1. Introduction
Since radar, which detects objects using an electromagnetic spectrum, has appeared on the battlefield, on the one hand, information obtained through detection and reconnaissance by radar-equipped aircraft has given an edge to the friendly forces in the war. The importance of information acquisition through the electromagnetic (EM) spectrum is growing [
1,
2,
3]. On the other hand, techniques that can deny an enemy’s effort in information acquisition through the EM spectrum is important. The two types of techniques are continuously being developed to overcome each other [
4].
Modeling and simulation (M&S) technology provides an experimental environment in a virtual space for predicting and verifying situations that are difficult or impossible to reproduce in reality. M&S technology is especially useful in the defense sector, where real system evaluation may be risky and requires significant cost. One such example is modeling of an electronic warfare (EW) environment, which may involve a continent-size field, harmful electromagnetic radiation, etc. Thus, considerable efforts are underway to develop EW simulators to incorporate the merits of M&S into EW [
5,
6,
7].
In order for M&S technology to be useful, accurate modeling of the environment and rapid calculation are required. Thus, the problem of reducing the amount of computation time is one of the important issues in EW simulation. For example,
Figure 1 shows a scenario in which an aircraft equipped with a jammer emits a jamming signal toward the enemy objects. The intensity and delay of the jamming signal is easy to calculate in the line-of-sight (LOS) path. However, if the jamming signal is obscured by obstacles, such as mountains, it experiences complicated physical phenomena, such as diffraction, reflection, etc. The non-LOS calculation is performed in separate subroutines, and the depth and complexity of the modeling depends on the modeling purpose. Thus, in this scenario, the priority is to check whether the obstacle exists on the LOS path of the jamming signal [
8,
9,
10].
This study proposes a novel LOS decision technique that is based on the scenario shown in
Figure 1. In the proposed algorithm, a virtual triangular plane including an aircraft and a threatening object is created, and it is rapidly determined whether the signal path is LOS based on sign counting, which is elaborated in the following sections. The efficiency of the proposed algorithm is validated in a space reflecting actual three-dimensional (3D) terrain data.
The rest of the paper is organized in the following order: In
Section 2, we introduce the commonly used terrain data format and the LOS decision algorithm in the literature; in
Section 3, we present the proposed algorithm, which determines LOS faster than the existing methods; in
Section 4, we validate the performance of the proposed algorithm by comparing the LOS decision times of the proposed algorithm and the existing methods.
2. Terrain File Formats and Line-of-Sight (LOS) Algorithms
To determine if a signal is on an LOS path, actual 3D terrain data is necessary. All LOS decision algorithms make judgments based on specific terrain data. In this study, we used a digital terrain elevation data (DTED) format because it is one of the most frequently used terrain data formats. DTED uses a grid-post terrain data format, which has height information corresponding to each two-dimensional coordinate plane grid, as shown in
Figure 2. The DTED data is standard digital data representing the altitude above sea level, and it was first developed for aerial radar simulation and prediction in the 1970s. Earth elevation was measured based on EGM96 [
11,
12].
This dataset is used in many military system applications that require terrain elevation information. DTED is accompanied by a level that is designated according to the resolution. Levels are divided into levels 0, 1, and 2, with a higher number indicating higher resolution. The horizontal and vertical resolutions are approximately 900, 90, and 30 m, in levels 0, 1, and 2, respectively. Moreover, data with higher resolution are available in high-resolution terrain information (HRTI) data, which was constructed through the Advanced Concept Technology Demonstration (ACTD) program in the United States. The HRTI data are often designated as levels 3 to 5, and are defined in [
13].
The algorithm introduced in this study is applicable to all grid-post terrain types, and to obtain accurate results, a high-level dataset is necessary. However, these data are usually not open to the public in most cases because they contain data that is important for national security. Therefore, the performance of the proposed algorithm was confirmed by using level 0, which is available in the global dataset.
Figure 3a shows the areas of 51T, 52T, 51S, and 52S in the Universal Transverse Mercator (UTM) coordinate system, which corresponds to the vicinity of the Korean Peninsula.
Figure 3b shows the magnified view of the terrain marked in the red box with the actual terrain information, which is obtained from the DTED level 0.
3. LOS Decision Technique
3.1. Conventional Method
An intuitive way to determine if a signal path is LOS is to form a line by connecting the jammer and the object, and check the DTED data to determine whether there are any higher points along the created line [
8,
11]. The grid-post terrain data stores only the height information at the intersection points at the desired resolution, as shown in
Figure 2. Thus, the line connecting the jammer and the object does not pass the grid intersection. In this case, an LOS decision is performed using a point reconstruction technique that creates a new point using interpolation techniques, such as nearest point, double linear, or bilinear interpolations [
11]. Although this method is intuitive, because it only calculates the straight signal path, it is not suitable to be applied to radar signals with a beam width. In addition, when the resolution is high, it takes a significant amount of time to calculate the path.
As an example, areas 51T, 52T, 51S, and 52S in the UTM coordinate system are expressed as 961 points from 124 to 132 degrees longitude and 1921 data points from 31 to 47 degrees latitude. Even in a DTED level 0 dataset, which has the lowest resolution, a total of 1,846,081 data points must be processed for each jammer-object LOS decision. Therefore, in order to calculate a real time simulation, an algorithm that can immediately process approximately 2 million data points is necessary.
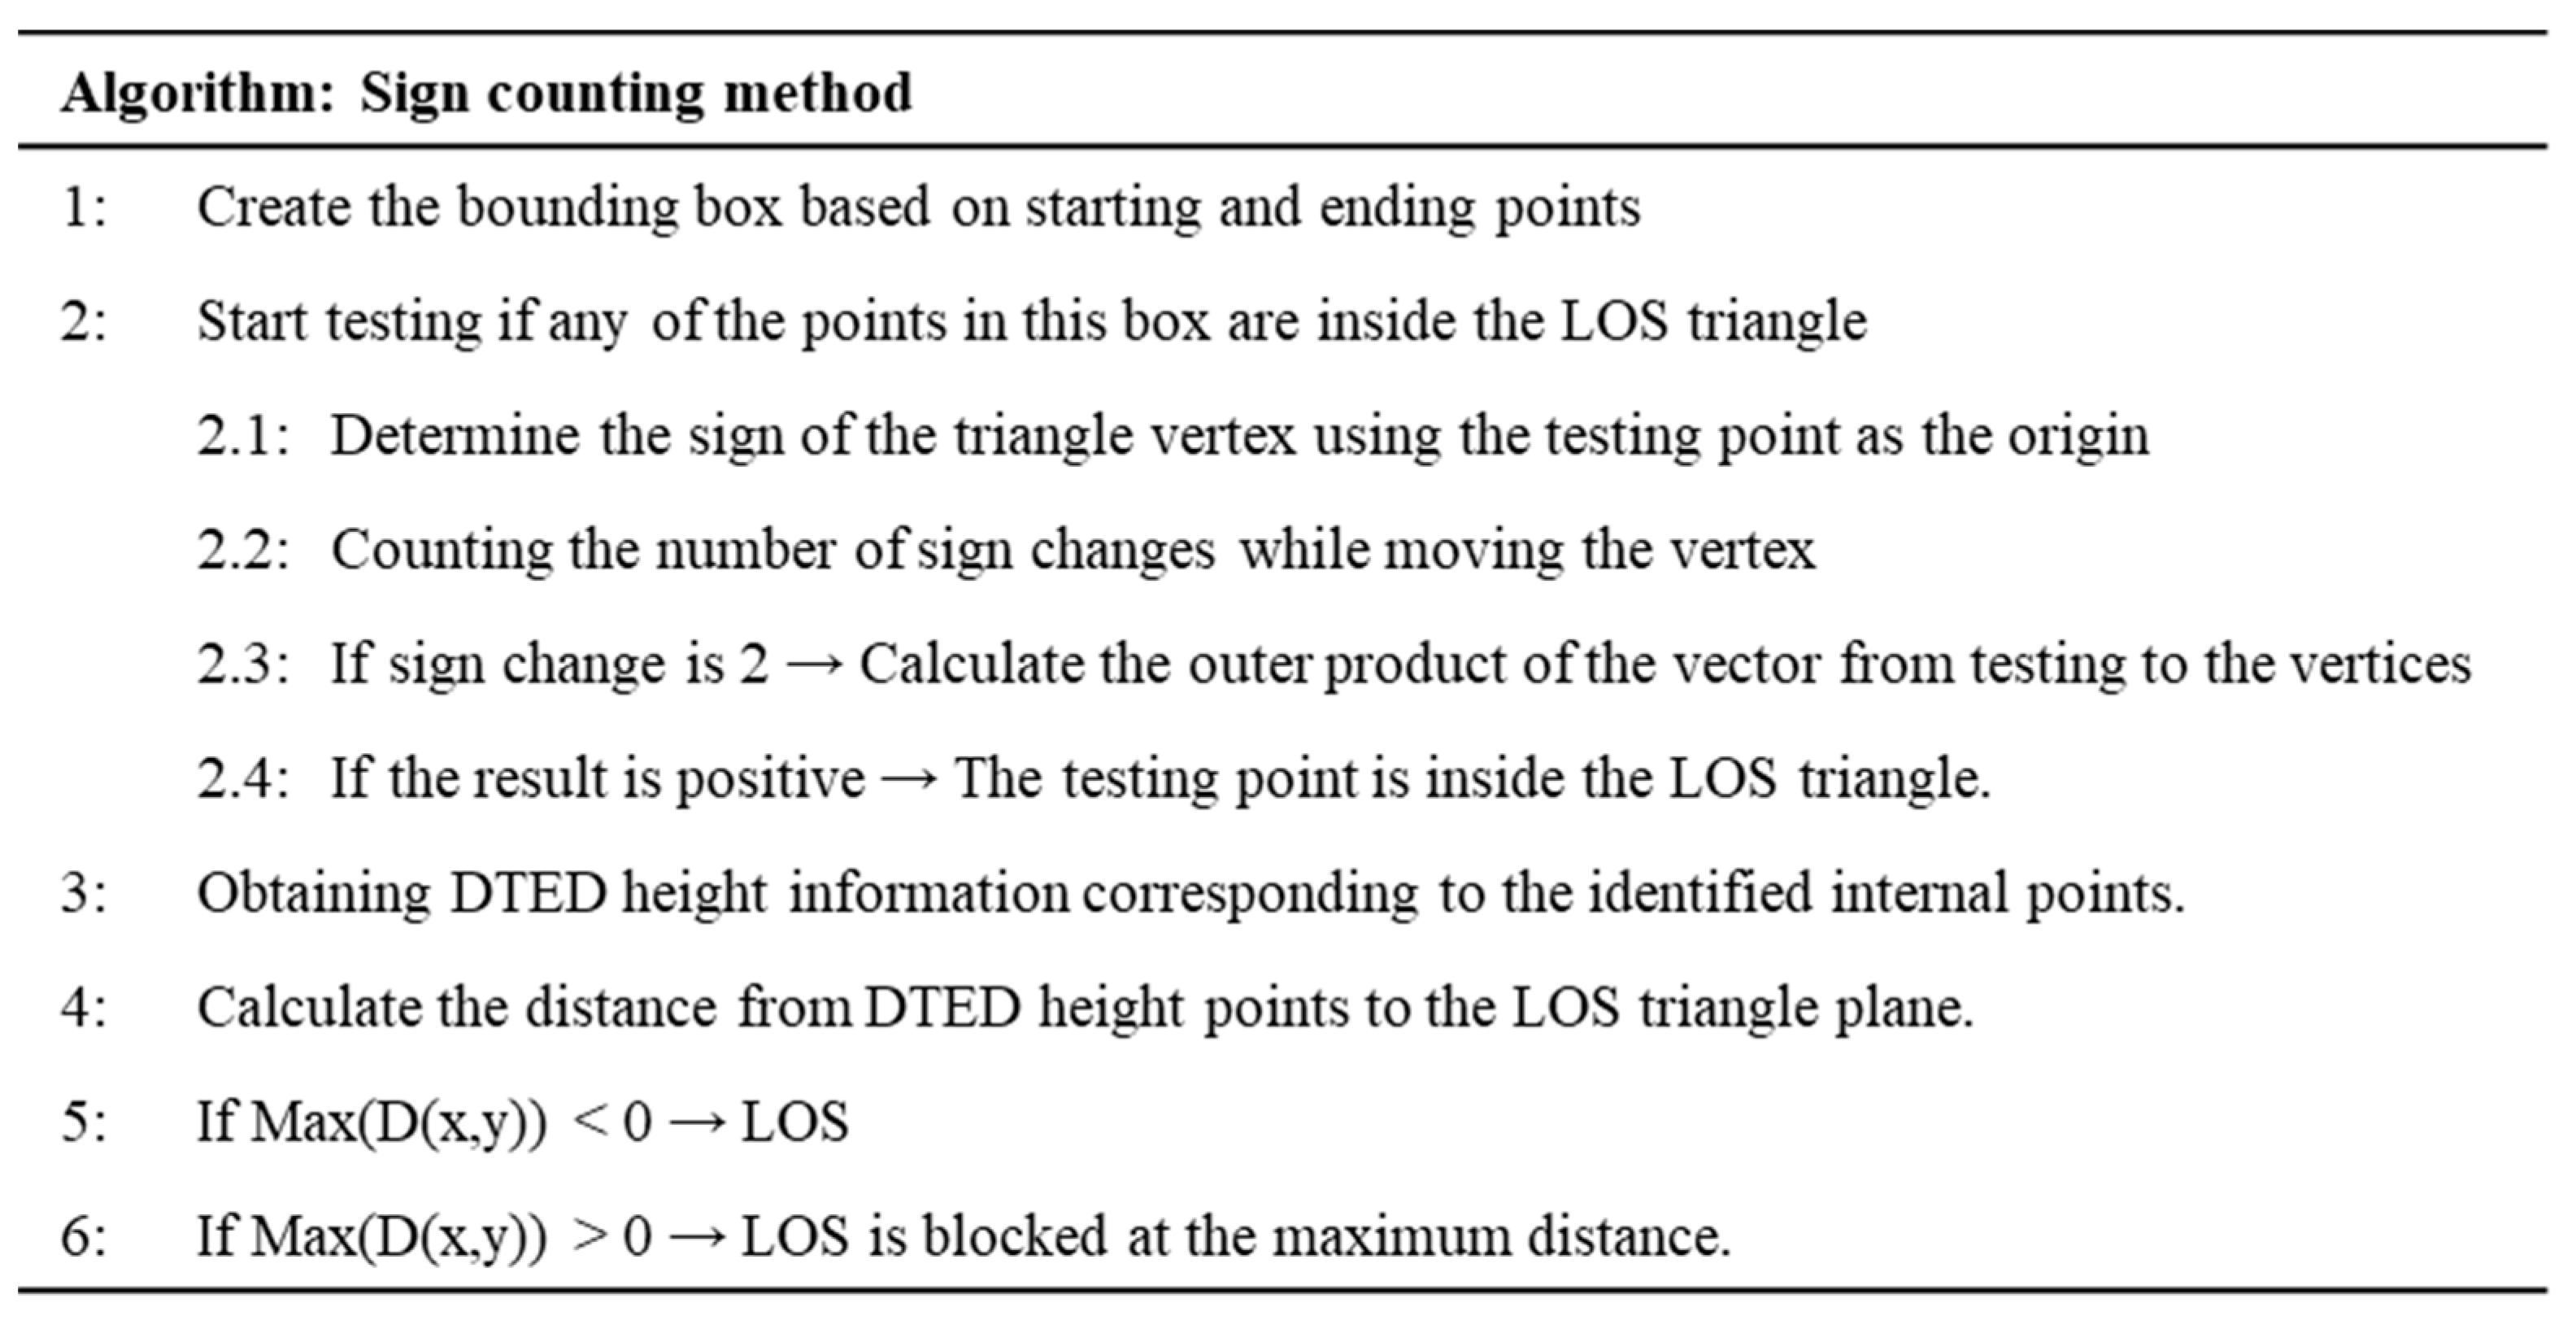
3.2. Proposed Method: Sign Counting
For a given jammer-object position, using all the points in the dataset is unnecessary. In order to reduce the points that may be used in the LOS decision, a triangular plane including the LOS path is formed. The three vertices of the triangular plane are the jammer point in the 3D space and two fictitious points near the object reflecting the DTED information. If any of the DTED points within the triangular area is higher than this triangular plane, the jammer-object path is considered to be non-LOS (NLOS). The two points are created at δ distance apart from the object in a direction perpendicular to the LOS path. The distance δ may be set in consideration of the beam width of the jammer antenna. The equation of the plane containing the triangle may be expressed as follows:
and for the three points
,
, and
, four coefficients in Equation (1) can be determined by following Equation (2):
The three vertices give a rough bounding box whose sides are parallel to the UTM axes. The points that are outside of this bounding box are excluded from the LOS decision calculations. The points within the bounding box are determined if they are within the triangle area called the LOS decision triangle. The sign-counting method is proposed to determine if the points are within the triangle.
Figure 4 shows the LOS decision triangle and its bounding box as described below.
Consider a point within the bounding box. The point is temporarily set as the origin. Four quadrants can be defined, according to the reference to the origin. Each quadrant is given a pair of two signs, as shown in
Figure 5. The locations of the three vertices are determined in the four-quadrant space. Starting from one vertex, we move to the second vertex and count the sign change. The sign change is counted as we move from the second to the third, and from the third to the first. The sign change can range from 0 to 2. The sign change examples are shown in
Figure 5.
The cases where the sign changes in the quadrant are as follows:
- (1)
When moving within the same quadrant, the change of sign = 0;
- (2)
When moving to the adjacent quadrant, the change of sign = 1;
- (3)
When moving to the diagonal quadrant, the change of sign = 2.
For a given point to be included within the triangle, at least a sign change of 2 is necessary. These cases correspond to
Figure 5c–f. For other cases, the test points are excluded from the LOS decision calculations. For the cases corresponding to
Figure 5c–f, the outer product calculations are used to determine if the point is within the triangle. If the point is determined to be within the triangle, the height of the point from sea level can be determined from the following equation:
where
and
are the coordinates of the point in the LOS decision triangle.
The distance from the triangular plane can be obtained from the following equation:
where
is elevation data corresponding to
in DTED.
If this distance is positive, it interferes with the LOS. This is repeated for all the points within the triangular plane. If all the points have max(
D(
x,
y)) < 0, the path is LOS. The (
x,
y) points that result in the max(
D(
x,
y)) are the most blocking points that result in NLOS. A summary of this algorithm is shown in
Figure 6.
If the DTED data is compared only in the extracted area by applying this sign-counting algorithm to determine whether it is LOS or not, the LOS can be determined in a much faster way than comparing the whole area.
4. Experimental Results and Comparison
This section applies the proposed sign-counting method described above to a DTED level 0 dataset in areas of 51T, 52T, 51S, and 52S in the UTM coordinate system. The results were compared with the interpolation method, which was directly calculated. This data was converted into a UTM-k coordinate system and this system was used. UTM-k coordinates are similar to the existing UTM coordinates, but false northing and false easting are slightly different coordinates according to the earth’s curvature at the place where the Korean Peninsula is located. The simulation was conducted using MATLAB installed in a computer with an Intel Core i7-3770 @ 3.40GHz CPU, 16GB of RAM, and operated on a 64-bit operating system.
The two randomly selected points are the positions where LOS is not secured, and the positions of a jammer and an object in the converted to UTM-k coordinate system are shown in
Table 1.
The LOS decision was performed according to the algorithm described in the previous section and the location of the point that interfered with the LOS was calculated. The average time was calculated through a total of 10 simulations, and
Table 2 shows the time taken and the average time while performing 10 simulations.
With the proposed method, LOS can be accurately determined with an average of 0.026 s for the 1.8 million data, which has approximately 1.5 times the efficiency of the existing interpolation method. Since this method vectorizes the given data and calculates it, even if the data increases, the time does not increase linearly as much as a multiple of the data. Therefore, even if a higher level of DTED is used in an electronic war situation, it can be determined in real time.
5. Discussion and Conclusions
In order to make certain judgments by simulating an electronic warfare environment, a simulation must be performed in real time so that appropriate and accurate judgments can be made even in changing environments. Therefore, accurate judgment, terrain data, and modeling of the object must be reflected, and fast computational algorithms are required for a real-time simulation. In this study, LOS judgment was made in an electronic warfare environment in which DTED was reflected. In this paper, we introduce an algorithm that could be calculated in less than 0.03 s for an approximately 2 million dataset. The terrain data used to verify the algorithm is a UTM coordinate system dataset that covers the entire Korean peninsula and shows 50% improved efficiency as compared with the existing interpolation method. The proposed algorithm has the advantage of being faster than other techniques because it only judges the sign, or bit-wise operation, by testing the points included in the LOS triangle region.
Using this technique, LOS judgment for a desired area can be performed in real time for a situation in which a radar-equipped aircraft moves in a certain scenario. Using this sign counting method, the path from a jammer to an object can be accurately identified, and based on the method, the loss factor and J/S (jammer-to-signal ratio) can be calculated.
Author Contributions
Conceptualization, H.-K.J. and K.K.; Formal analysis, J.L. and K.K.; Investigation, C.L., H.H.L., and K.T.P.; Methodology, J.L. and K.K.; Project administration, C.L.; Resources, K.T.P.; Supervision, H.-K.J.; Validation, H.H.L.; Writing—original draft, J.L.; Writing—review and editing, K.K. All authors have read and agreed to the published version of the manuscript.
Funding
This work was supported by Agency for Defense Development, Republic of Korea, under the contract “Modeling and Simulation Based Design and Analysis Technologies for Electronic Warfare Systems”.
Institutional Review Board Statement
Not applicable.
Informed Consent Statement
Not applicable.
Data Availability Statement
Data available in a publicly accessible repository.
Conflicts of Interest
There is no conflict of interest.
References
- Kim, J.; Hespanha, J.P. Cooperative radar jamming for groups of unmanned air vehicles. In Proceedings of the 43rd IEEE Conference on Decision and Control (CDC) (IEEE Cat. No.04CH37601), Nassau, Bahamas, 14–17 December 2004; Volume 1, pp. 632–637. [Google Scholar] [CrossRef]
- Adamy, D. EW 104: Electronic Warfare Against a New Generation of Threats; Artech: Norwood, MA, USA, 2015. [Google Scholar]
- Graham, A. Communications, Radar and Electronic Warfare; John Wiley & Sons: Hoboken, NJ, USA, 2011. [Google Scholar]
- Liu, X.; Li, D. Analysis of cooperative jamming against pulse compression radar based on CFAR. EURASIP J. Adv. Signal Process. 2018, 2018, 69. [Google Scholar] [CrossRef]
- National Research Council. Defense Modeling, Simulation, and Analysis: Meeting the Challenge; The National Academies Press: Washington, DC, USA, 2006. [CrossRef]
- Adamy, D. Introduction to Electronic Warfare Modeling and Simulation; Artech House: Norwood, MA, USA, 2003. [Google Scholar]
- Frederick, G.K., Jr.; Donald, E.F. Line-of-sight determination in real-time simulations. Technical Papers (A93-52651 23-09). In Proceedings of the AIAA Flight Simulation Technologies Conference, Monterey, CA, USA, 9–11 August 1993. [Google Scholar]
- Funfzig, C.; Ullrich, T.; Fellner, D.W.; Bachelder, E.N. Empirical comparison of data structures for line-of-sight computation. In Proceedings of the 2007 IEEE International Symposium on Intelligent Signal Processing, Alcala de Henares, Spain, 3–5 October 2007. [Google Scholar]
- Topcu, S.; Goktas, P.; Karasan, E.; Altintas, A. A new approach to diffraction modelling for line-of-sight (LOS) paths. In Proceedings of the 2015 IEEE-APS Topical Conference on Antennas and Propagation in Wireless Communications (APWC), Turin, Italy, 7–11 September 2015; pp. 696–699. [Google Scholar]
- Venkatraman, S.; Caffery, J.; You, H.R. A novel TOA location algorithm using LOS range estimation for NLOS environments. IEEE Trans. Veh. Technol. 2004, 53, 1515–1524. [Google Scholar] [CrossRef]
- Proctor, M.D.; Gerber, W.J. Line-of-Sight Attributes for a Generalized Application Program Interface. J. Def. Modeling Simul. 2004, 1, 43–57. [Google Scholar] [CrossRef]
- South, M.T.; Owen, W.; Snider, K. Transitioning Advanced Concept Technology Demonstrations to Acquisition Programs. Master’s Thesis, Naval Postgraduate School, Monterey, CA, USA, December 2003. [Google Scholar]
- Kweon, I.-S.; Takeo, K. High-resolution terrain map from multiple sensor data. IEEE Trans. Pattern Anal. Mach. Intell. 1992, 14, 278–292. [Google Scholar] [CrossRef]
| Publisher’s Note: MDPI stays neutral with regard to jurisdictional claims in published maps and institutional affiliations. |
© 2021 by the authors. Licensee MDPI, Basel, Switzerland. This article is an open access article distributed under the terms and conditions of the Creative Commons Attribution (CC BY) license (http://creativecommons.org/licenses/by/4.0/).

 ,
, 


