Article

A Vehicle Guidance Model with a Close-to-Reality Driver Model and Different Levels of Vehicle Automation

Department of Mechatronics, University of Duisburg-Essen, 47058 Duisburg, Germany
*
Author to whom correspondence should be addressed.
Appl. Sci. 2021, 11(1), 380; https://doi.org/10.3390/app11010380
Submission received: 5 December 2020 / Revised: 23 December 2020 / Accepted: 28 December 2020 / Published: 2 January 2021
(This article belongs to the Section Mechanical Engineering)

Abstract

:
This paper presents a microscopic vehicle guidance model which adapts to different levels of vehicle automation. Independent of the vehicle, the driver model built is different from the common microscopic simulation models that regard the driver and the vehicle as a unit. The term “Vehicle Guidance Model” covers, here, both the human driver as well as a combination of human driver and driver assistance system up to fully autonomously operated vehicles without a (human) driver. Therefore, the vehicle guidance model can be combined with different kinds of vehicle models. As a result, the combination of different types of driver (human/machine) and different types of vehicle (internal combustion engine/electric) can be simulated. Mainly two parts constitute the vehicle guidance model in this paper: the first part is a traditional microscopic car-following model adjusted according to different degrees of automation level. The adjusted model represents the automation level for the present and the near and the more distant future. The second part is a fuzzy control model that describes how humans adjust the pedal position when they want to reach a target speed with their vehicle. An experiment with 34 subjects was carried out with a driving simulator based on the experimental data and the fuzzy control strategy was determined. Finally, when comparing the simulated model data and actual driving data, it is found that the fuzzy model for the human driver can reproduce the behavior of human participants almost accurately.

1. Introduction

Microscopic traffic simulation is widely used in research due to its high efficiency and low cost when comparing to the actual implementation in the real world. To reduce simulation time, the driver and the vehicle are always simulated as one unit. Well-known car-following models in microscopic traffic simulation such as Gipps’ model [1], Krauß’ model [2] or the intelligent driver model (IDM) model [3] are based on treating the driver and the vehicle as one unit. This approach allows a fast and efficient simulation. At the same time, however, combining the driver and the vehicle into a single unit makes it difficult to distinguish between the characteristics of the driver and the vehicle in the simulation and to analyze their respective influences. Due to the rapid development of automotive technology, it must be ensured that vehicles with different drive energy sources as well as vehicles with advanced driver assistance technologies can be easily included in simulations. Nevertheless, how these new technologies will impact the overall traffic is a concern for many transportation-planning organizations. This paper provides a method of establishing a vehicle guidance model with different degrees of automation for representing the automation level of the present, near and the more distant future. The model in this paper can be combined with different vehicle models to allow the simulation of more complex collocations. For example, the effects on traffic of electric vehicles with and without a driver assistance system, fuel cell electric vehicles with full autonomous driving technology and liquefied petroleum gas (LPG) vehicles with no automation equipped can be simulated.
In order to reproduce the driving behavior of human drivers, many driver models (driver–vehicle unit model) have been developed in microscopic traffic simulation. Chandler [4] introduced a stimulus-response model based on perceived distance and speed difference [5]. The general idea is that the acceleration of the following car depends linearly on its speed difference to the leading car. The correlation coefficient is the vehicle weight and the sensitivity factor of the control mechanism. Gazis [6] developed General Motors’ (GM) nonlinear model and introduced space headway of the following vehicle as a system factor instead of vehicle mass. The psychologist Wiedemann [7] introduced a psycho-physical spacing driver model by dividing the driving behavior into four driving situations, i.e., uninfluenced driving, approaching, braking and car following. Wiedemann’s relatively complex driver model provides more details on driving behavior but also requires a reliable database for accuracy. Gipps [1] concentrated on the safety rules of his driver model and lots of varieties based on his work became widely used. Krauß’ model is one of the variants of Gipps’ model, based on safety distance. The desired velocity of the driver is the minimum of safe speed, maximum allowed speed, and maximum possible speed of the next simulation step [2]. Treiber [3] introduced the intelligent driver model (IDM) with more parameters, including vehicle gap, velocity difference, desired deceleration, etc. These car-following models are widely used in traffic simulation nowadays.
In the real world, the human drivers must operate their vehicle using the accelerator pedal, brake pedal, steering wheel and, eventually, gear lever. The individual models for driver and vehicle must exchange the operating parameters with each other. In a simulation environment, the driver model transmits corresponding information as signals to the vehicle model, such as accelerator pedal angle, brake pedal angle, steering angle and gear selection.
With the driver’s information, the vehicle model outputs the velocity and acceleration of the next time step according to different vehicle characteristics. In this paper, the human driving process is divided into two steps. (1) The driver model calculates the desired velocity based on environmental factors (such as the velocity of the leading car, the distance from the leading car, the maximum speed of the current road, etc.) and ego parameters (such as velocity and acceleration of the ego car). (2) The driver model manipulates the vehicle model to reach and keep the desired speed. The first step follows the theory of the Krauß model, i.e., the desired speed must be below the safe speed, the maximum possible speed and the maximum allowed speed of the road. In order to transform the desired speed into pedal displacement, real human driver data should be used. Thus, an experiment with a driving simulator was implemented [8,9].
Precision is one of the main differences between human and machine driving. The non-precise characteristics of human driving behavior make fuzzy control a more effective method to represent human driving than precise mathematical model control theories. Hayashi [10] introduced a transmission control system based on a neuro and fuzzy approach. An experienced driver was used to train the neural network for generating an optimal gear-shift scheduling. Holve [11] developed an adaptive fuzzy controller to assist the driver in vehicle speed and distance control. Training data were gathered during several test drives with a test car. Because of the sensor insufficiencies, the gained data were noisy. The insufficient amount of data also made the generated rules rugged. Naranjo [12] asset up an adaptive control system (ACC) based on a throttle and brake fuzzy control system. It made vehicles behave human-like in car-following situations and open to cooperate with drivers. The throttle and brake outputs were Boolean values, with no pedal position included. Pananurak [13] developed an adaptive cruise control system with a proportional and derivative control compensation algorithm and implemented it on an intelligent vehicle. The fuzzy rules were designed from experience and adjusted by two experiments. Due to the restrictive boundary conditions for conducting real vehicle experiments, the possible number of participants was too limited to make the model universally usable and reliable. Chen et al. [14] proposed an adaptive speed control method for a robot driver based on fuzzy logic and conducted driving experiments in a Ford Focus car.
For our present work, the simulation models were set up by conducting a study with 37 subjects. Of these, 34 datasets have been evaluated. All parameters in the vehicle model used in simulation were set according to the driving simulator so that the comparison of the simulation results of the driver model and human driver data will be more convincing.

2. Methodology

2.1. Participants and Driving Simulator

In total, 37 subjects with valid driver license participated in the present study. Data from three participants were excluded from the evaluation due to their insufficient adaptation to the driving simulator. Two of them encountered physical discomfort by driving the simulator and one of them could not accomplish the whole task because they could not successfully control the simulated vehicle well. Hence, 34 subjects with an age ranging from 23 to 40 years completed the driving test, including 3 female drivers. All subjects were informed, before their participation, that they could stop the experiment at any time without any disadvantages.
The dynamic driving simulator of the Chair of Mechatronics at the University of Duisburg-Essen was used. A driver’s cab with one seat is mounted on a motion platform. The motion platform of the simulator enables the actuation of three degrees of freedom: pitch, roll and heave motions. The motion platform provides the drivers with a dynamic feeling of movement and allows them to be immersed in the real driving situation. For visualization, a curved screen with a 252° field of view is mounted in front of the driver’s cabin [15]. The side mirrors consist of displays that visualize the simulated environment as well as other road users in the vicinity of the ego vehicle [16]. The inputs from the driver are transferred to the simulation system via a CAN bus. The arrangement of the simulator can be seen in Figure 1. The virtual road scenario is an area of 3×3 km and consists of inner city areas as well as rural routes and highways [17]. Because our desired speed has both high speed and low speed, to avoid high-speed driving in low-speed areas, we only used the highway part of the scenario. The subjects drove on highways of an infinite scenario without dead-ends, which further supports the realistic impression.

2.2. Experimental Arrangement

The key point of the experiment is to find out how the drivers press the drive and brake pedals when they want to reach their desired speed/target speed. To achieve this purpose, a display screen is assembled on the right side of the steering wheel. The target speed for each step is displayed on the screen (see Figure 1, left). The function of this display screen is to emulate the speed limit on real-world roads. If the driver is going too fast, they should decelerate, and if a higher speed is allowed, they should try to match it. Thus, the collected driving behavior from the driving simulator is consistent with the driving habits of most drivers in real world. In this experiment, the subjects were asked to reach the desired speed/target speed while keeping the ego vehicle in lane without collision with other traffic users. When the actual speed of the ego vehicle stays in a range of ±2 km/h of the desired speed for 5 s, the desired speed/target speed of the next step appears on the display along with a “beep” sound as a reminder to the driver. In total, 86 steps were carried out for each participant. The total time it took for each participant varied individually, ranging from 18.5 to 64.3 min. Drivers with more driving experience and more familiarity with the simulator or other virtual technologies showed a tendency to finish the driving test faster. During the driving experiment, the driving behavior of the participants (drive and brake pedal position, actual speed, target speed, etc.) are recorded. The data were transmitted 100 times per second.

2.3. Data Analysis

MATLAB was used to create and parameterize the fuzzy control model from the extensive amount of data. Each dataset of a participant was divided into 86 segments according to the level of the target speed. In each segment, two sub-segments of data were extracted. One is the sub-segment that represents the velocity change action and the other one is describing the steady velocity part. For example, if the segment is a driving segment from 30 to 60 km/h, the first speed rise from 32 to 58 km/h is extracted as sub-segment (1), and the last 5 s for keeping speed between 58 and 62 km/h is recorded as sub-segment (2). Next, each part of the data was processed separately and data from the same part of different drivers were averaged.

3. Driver Model

3.1. Modified Krauß Model

The original Krauß model [2] can be expressed as:
{ v ( t + Δ t ) = max ( 0 , V n φ ) V n = min [ v n ( t ) + a n τ ,   v s , V m a x ] v s = v n 1 ( t ) + g n ( t ) v n 1 ( t ) τ v n ( t ) + v n 1 ( t ) 2 b + τ
where υ ( t   +   Δ t ) represents the speed of the ego vehicle after time Δ t ; V n is the desired speed/target speed; φ is a random perturbation to allow for deviations from optimal driving; υ n ( t ) is the speed of the ego vehicle at time t ; υ n 1 ( t ) is the speed of the leading vehicle; α n is the maximum acceleration; τ is the reaction time of the driver; υ s is the safe speed; V m a x   is the allowed speed of the road; g n ( t ) is the gap between the leader and the follower; b is the maximum deceleration of the ego vehicle.
In the microscopic traffic flow system Simulation of Urban MObility (SUMO), Krauß’ model is modified to make it more suitable for simulation [18]. Krauß’ model in SUMO can be expressed as:
{ v ( t + t l ) = max ( 0 , V n ϵ   a   η ) V n = min [ v s ,   V m a x , v n ( t ) + a n t l ] v s =   τ   b + ( τ   b ) 2 + v n 1 ( t ) 2 + 2 b   g n ( t ) x ( t + 1 ) = x ( t ) + v n ( t )   t l
where ε is the imperfection factor of the driver; a is the acceleration of the ego vehicle; η is a random number between 0 and 1; t l is the time step of simulation; x ( t ) is the position of the ego vehicle at time t ; and x ( t + 1 ) is the position of the ego vehicle at next time step.
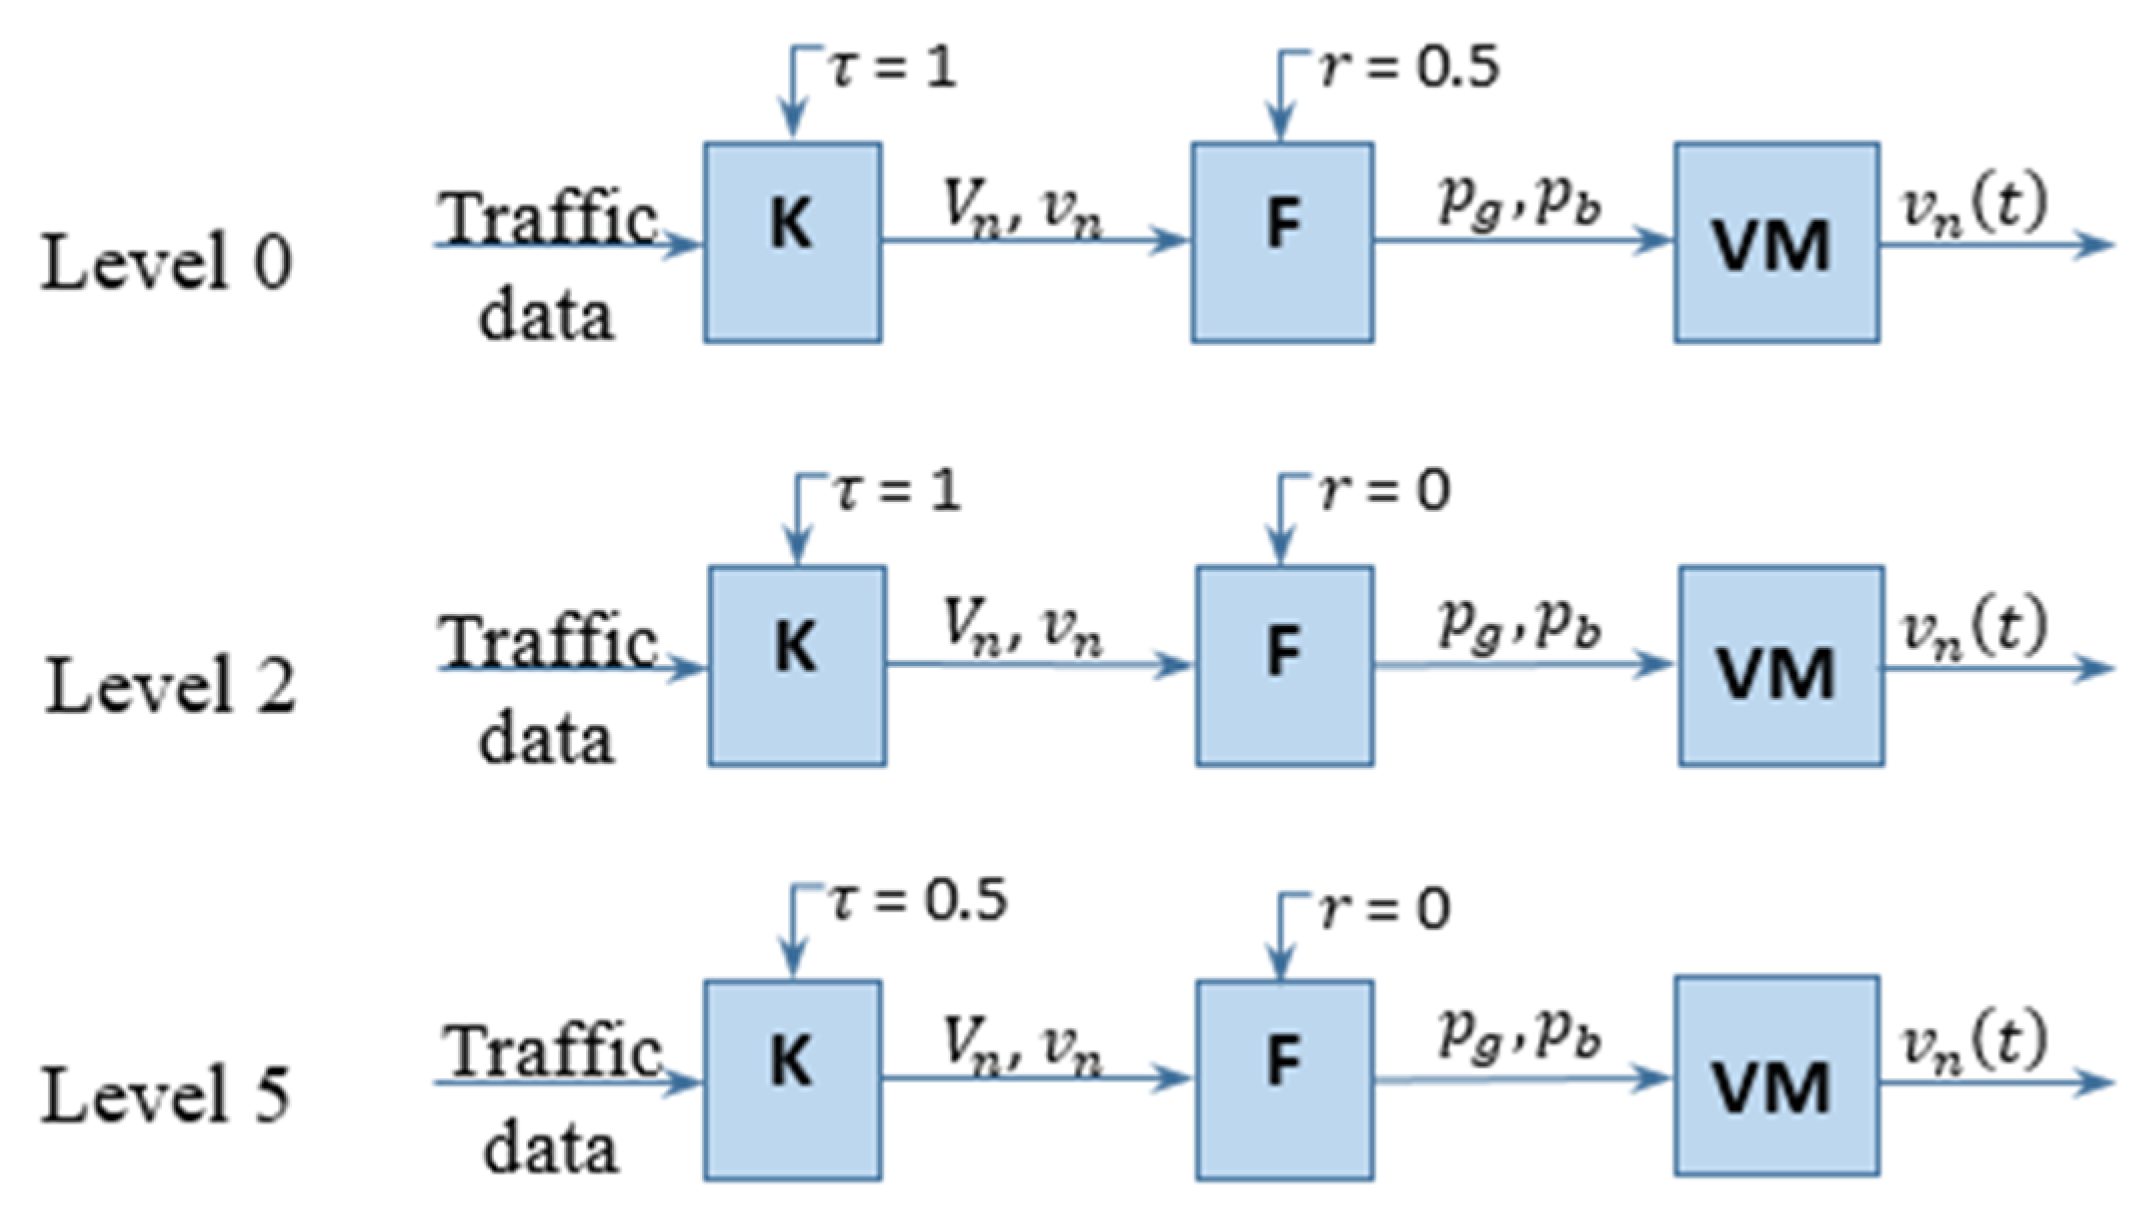
In this paper, some of the parameters of the Krauß model implemented in SUMO are modified. The desired speed and safe speed remain the same, but the vehicle model, according to command from the driver and vehicle parameters, generates the velocity of the next time step. Figure 2 shows a schematic diagram of the driver and vehicle system.

3.2. Fuzzy Model

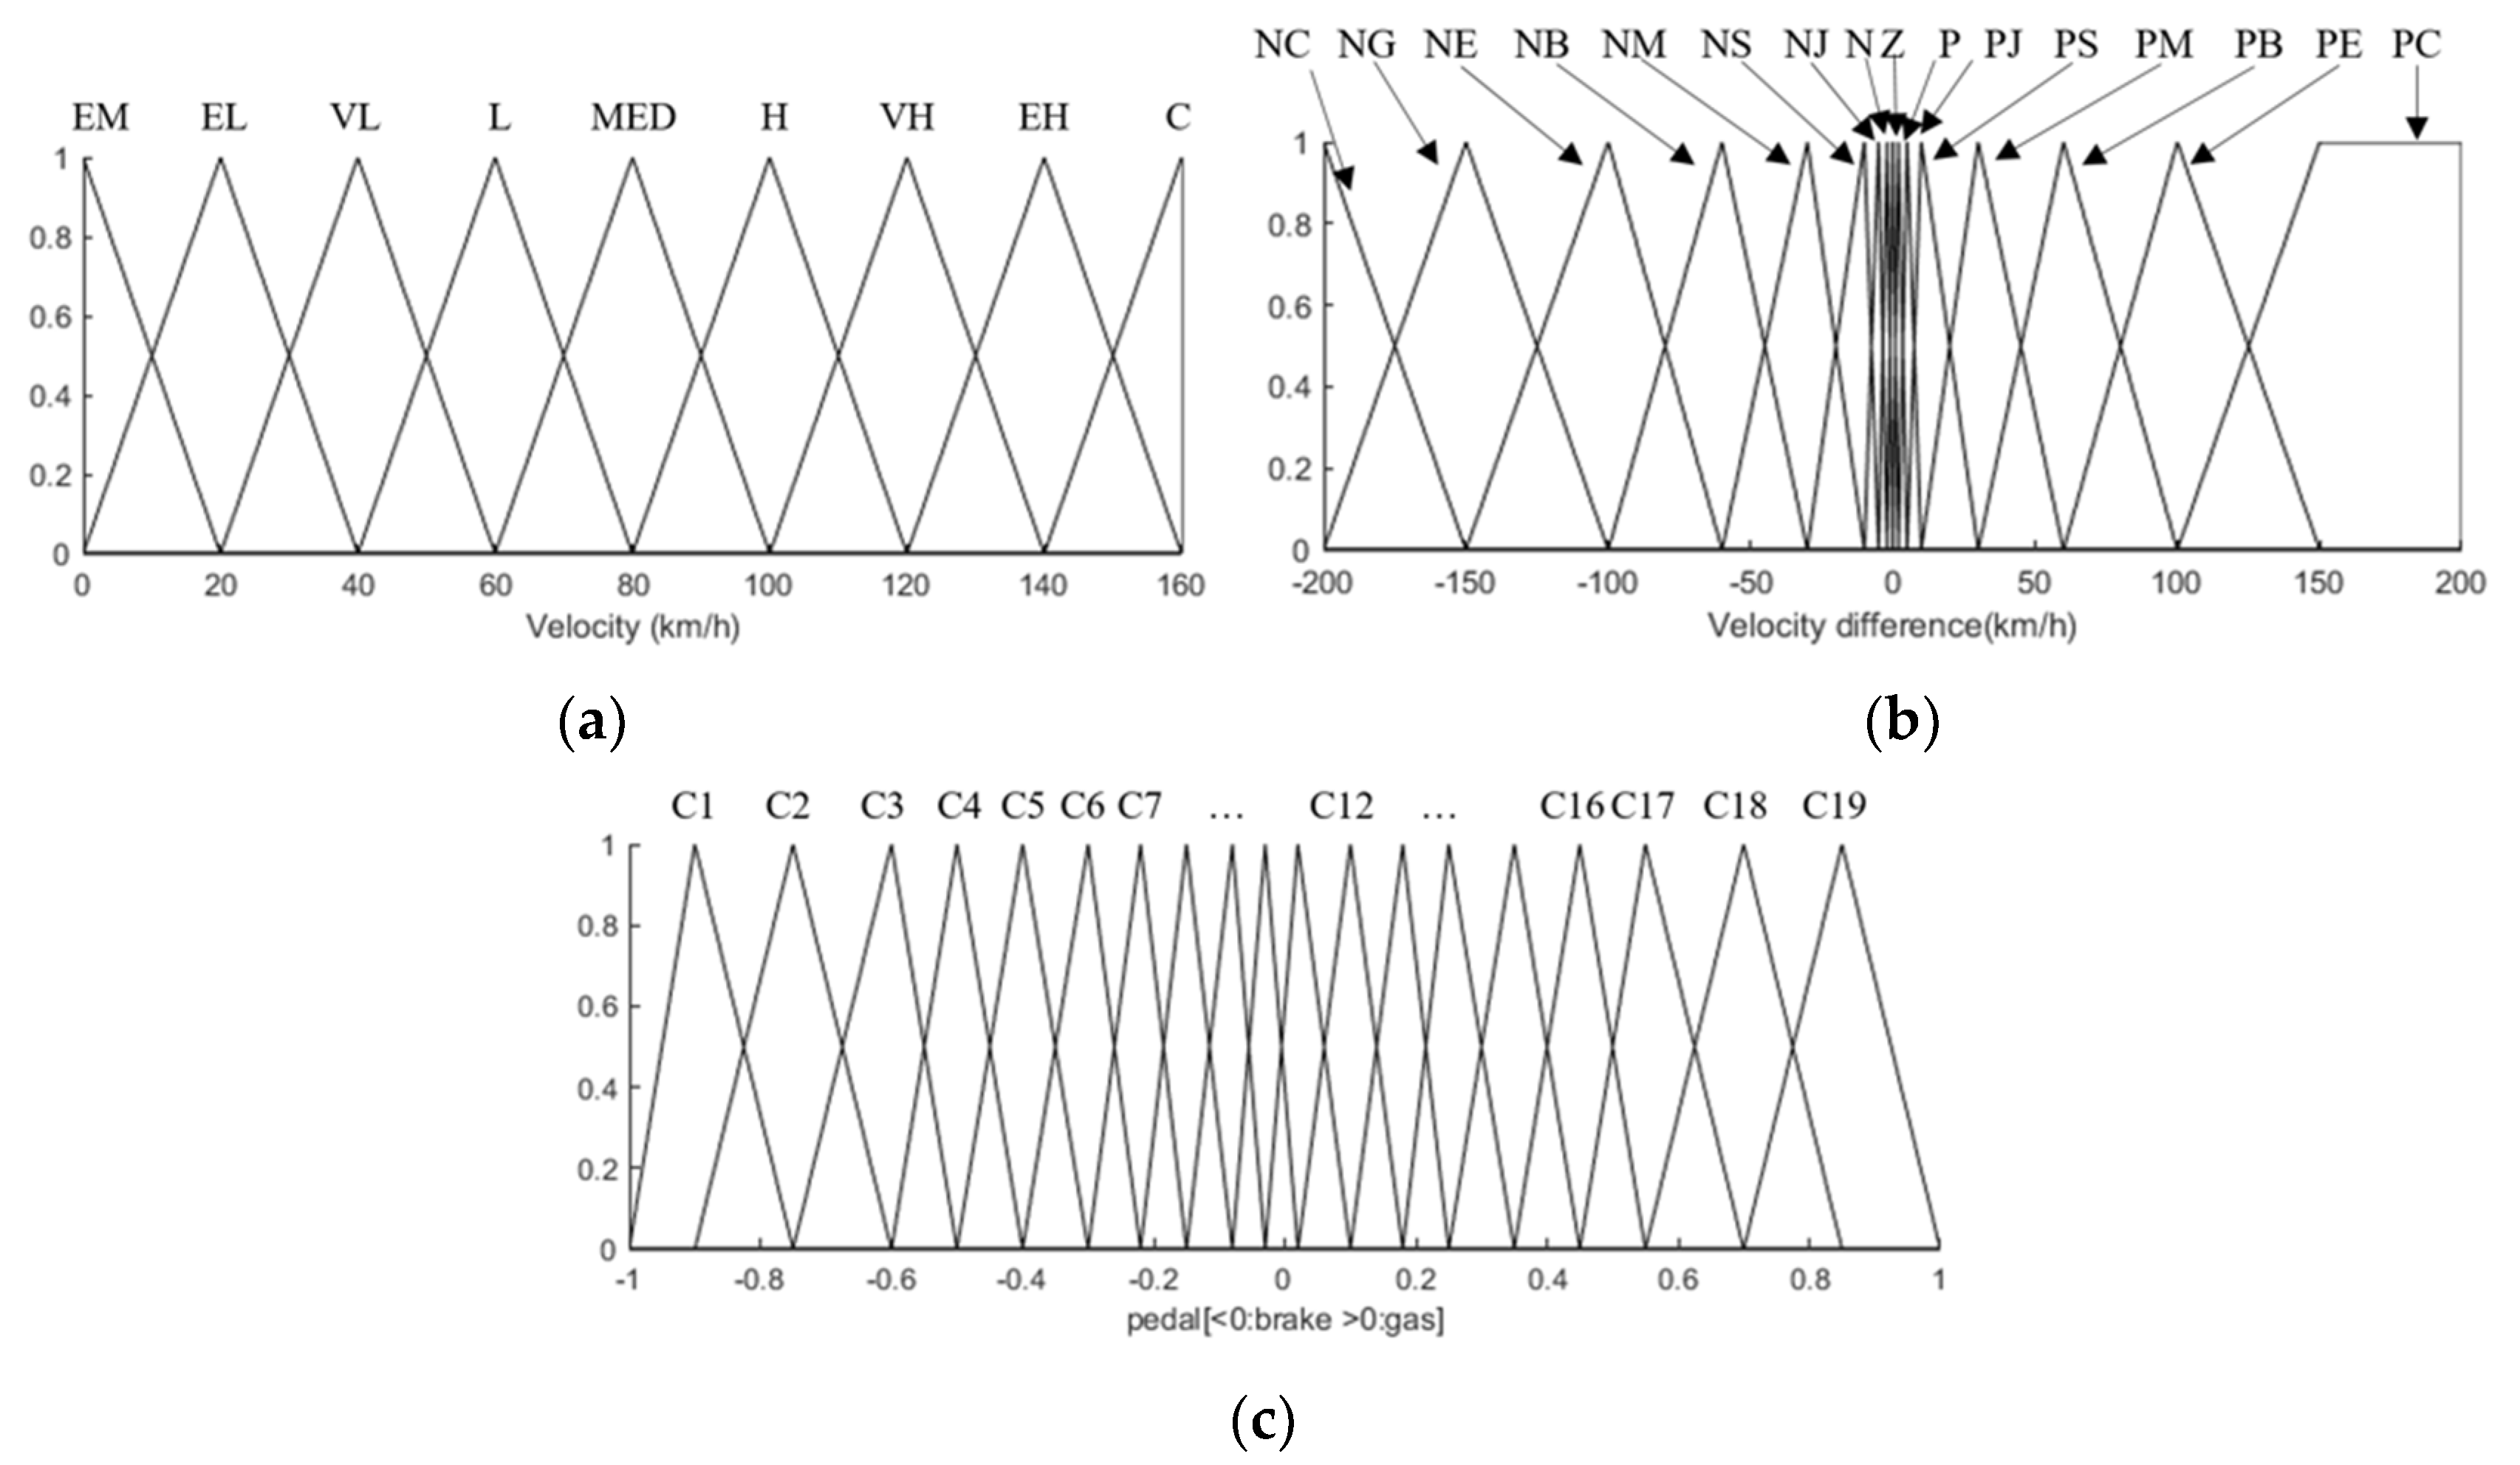
Fuzzy method is a kind of uncertainty reasoning, and fuzzy control is a control method that uses the control rules of the fuzzy reasoning theory to control the system. Different from the theory of precise mathematical model control, fuzzy control uses an imprecise mathematical model to achieve adaptive control, and the controlled object may be a non-time invariant system. The accelerator pedal and brake pedal are the main interface between the driver and the vehicle, and pedal position is necessary to maintain the desired speed and distance. Depending on the difference between the desired speed Vn and the actual velocity υn(t), the fuzzy controller determines a target pedal position. The experimental data from Section 2.3 were used to build a fuzzy control model with the two named inputs and one output (pedal position, positive means accelerating and negative means braking) (see Figure 3). The generated fuzzy rules are in Table 1, and manually added rules are marked in grey.

3.3. Vehicle Guidance Model with Different Degrees of Automation

According to the classification of automation levels in vehicles, six different levels of automation have been defined based on the extent of driver intervention and required attentiveness. This classification has been modified several times and is now widely accepted by researchers and the automotive industry. In this classification system, Level 0 represents no automation at all, and Level 5 represents full automation. Today, most car owners still have level 0 or 1 vehicles due to the additional price of higher equipped vehicles. However, due to government regulations, more and more assistance systems in vehicles are becoming standard, which promotes the penetration of the vehicle population with driver assistance systems. Level 2 is also called the partial automation level, which has both longitudinal control (acceleration/deceleration assistance) and lateral control (steering control assistance). In the near future, there is good reason to believe that these assistance systems will be widely used on most cars on the road. Additionally, there will be a day that fully autonomous cars become a common choice. Based on these assumptions, the automation levels to be simulated were set at Level 0, Level 2 and Level 5 to represent the automation level of the current stage, that in the near future and that in the far future.
There are many differences in driving behavior between human drivers and machines. The parameters that make the biggest differences are reaction time, action points and time headway [19]. In this paper, the reaction time τ and the imperfection factor ϵ were used to distinguish different levels of automation. The reaction time τ is affected by factors such as age, gender of the drivers, temperature, altitude of the environment [20] and unexpected situations [21]. However, human drivers’ reaction times fluctuate in a relatively small range, from 0.9 to 1.2 s [21] or 0.5 to 2 s [22]. Consequently, τ = 1 was set as the average reaction time for human drivers. For an autonomous car (Level 5), the reaction time was set to τ = 0.5 [19]. The partially automated vehicles with automation Level 2 still need the driver’s supervision all the time. In other words, the reaction activity is still made by the driver. Thus, the reaction time of vehicles in Level 2 should be same as Level 0.
The imperfection factor of the driver will not be parameterized in this work. Instead, different models were used to represent imperfect driving behaviors. As in Figure 4, the driver model receives traffic data and uses Model K (modified Krauß model) to generate the desired speed Vn. Then, Model F (fuzzy control model) generates the pedal position imitating real human drivers’ behaviors. Model VM (Vehicle Model) then generates the vehicle speed based on vehicle parameters and inputs it back into the simulation. Besides reaction time, another difference between human and machine driving is the action points. In order to better imitate unstable action points, the fuzzy control model was extended by a randomness factor r . Based on the analysis of real data from different drivers of the driving experiment in the simulator, r = 0.5 was set for human drivers. That means that plus and minus 50% randomness of pedal position has been added into the fuzzy control system representing Level 0 (no automation level driving). Unlike human drivers, the driver assistance system and the completely autonomous system have stable action points with no randomness. Therefore, r = 0 is set for Level 2 and Level 5. For Level 5 vehicles with a higher assistance level, the reaction activity is also implemented by a machine and τ has been set to the machine reaction time.

4. Verification and Simulation

4.1. Simulation Scenario and Software

In order to verify the applicability of the generated driving model, two simulations have been carried out. Firstly, a simulation with a fuzzy control model representing human drivers has been performed and compared with real driving data. Here, the behavior of the subject in the study is imitated—the desired speed/target speed is given to the driver model in the same order as in the experiment, and the pedal position output by the driver model is recorded and compared with real test data. Next, a simulation of the Level 0, Level 2 and Level 5 assistance systems was accomplished. In this simulation, the microscopic traffic simulation system SUMO was chosen for providing the simulation scenario. The TraCI (Traffic Control Interface) interface was used to connect the driver model in MATLAB with the vehicle model in SUMO. Vehicles with different degrees of automation were implemented on a simple intersection in SUMO and the vehicle counters were located at the end of each road.

4.2. Comparison of Fuzzy Model and Human Driver Data

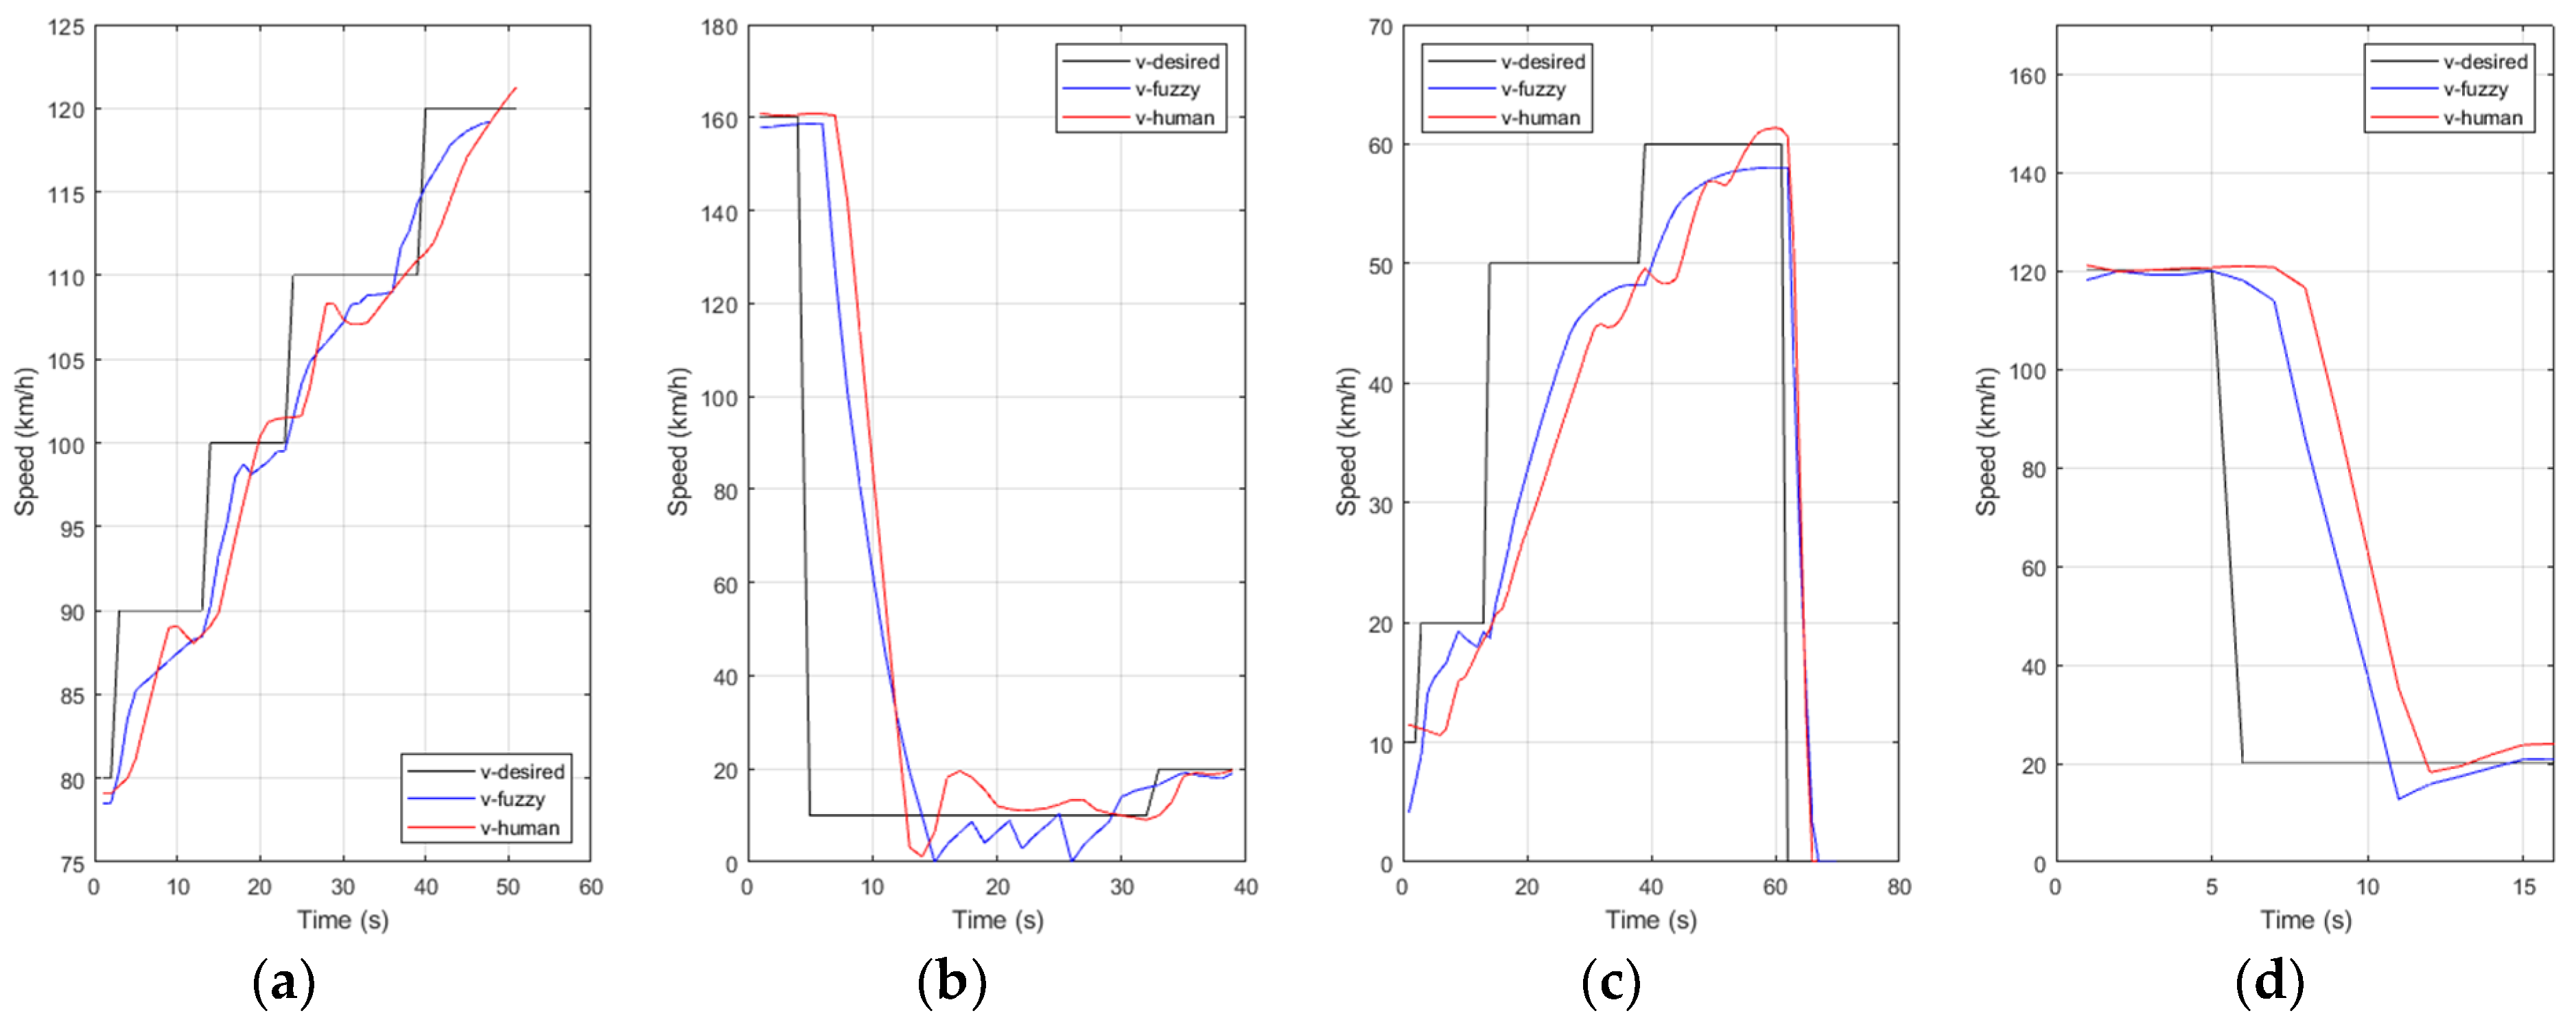
Although the real data of human drivers already showed a large variance in the subject study, the comparison of the behavior that was observed in the study indicates that the fuzzy model can well reproduce the characteristics of the human drivers’ behavior. Each participant followed 86 steps to provide 85 pedal opening responses based on the given target speed, and 34 effective subjects gave a total of 2890 effective segments. Figure 5 compares four exemplary diagrams of the experimental results of participants and fuzzy model simulation in the same driving situation characterized by the same initial speed and target speed. The black lines represent the desired speed/target speed, the red lines represent the actual speed from the driver (participant) and the blue lines correspond to the velocity of the vehicle model (with the fuzzy control model). The first figure shows the continuous acceleration situation, and the second and last figures are deceleration situations. The third figure shows a low speed situation.
In terms of total time, the fuzzy model always takes a shorter time than human drivers because machines do not have problems of faulty manipulation. In terms of driving behavior, there are hardly any significant differences in deceleration characteristics between the human driver and the model. However, the fuzzy control model has a smoother acceleration curve during acceleration, whereby the acceleration decreases as the actual speed approaches the target speed; the human drivers are less sensitive to the difference between current speed and desired speed. Overall, the fuzzy control model can adequately reflect the driving behavior of human drivers.

4.3. Comparison of Different Levels of Automation

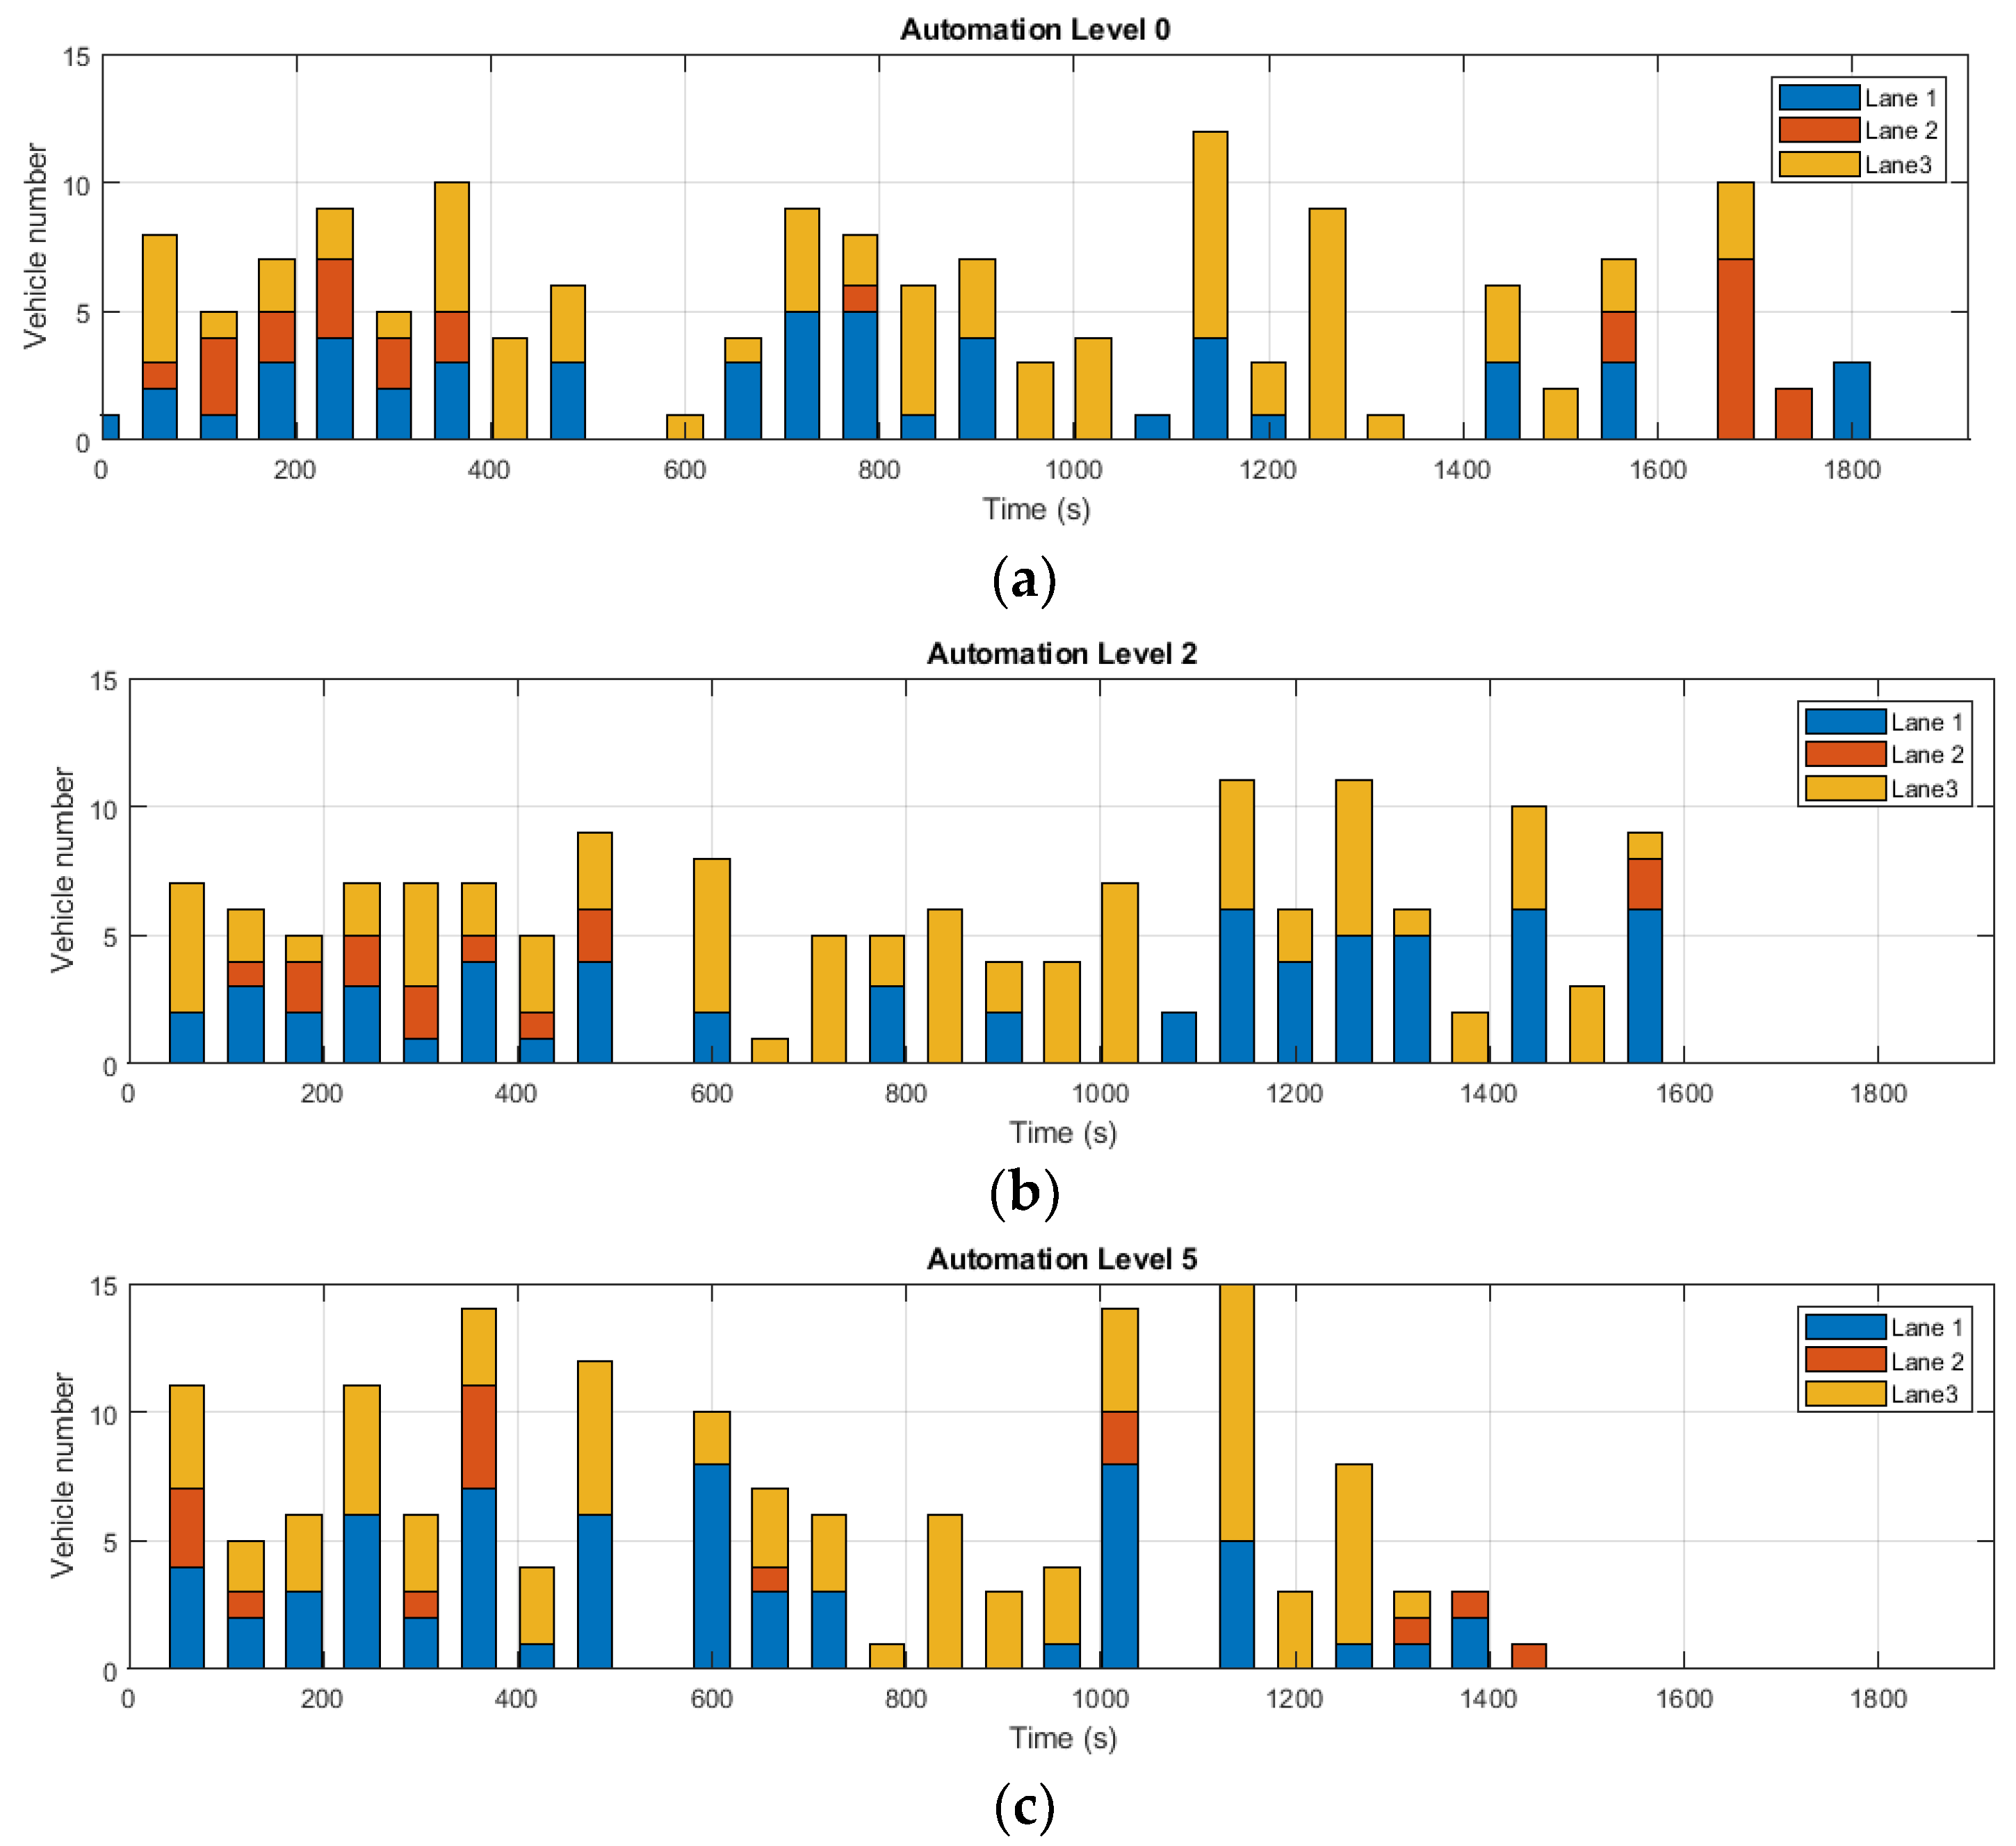
The simulation scenario considered in this section is a simple traffic intersection. Apart from the driver model, all other parameters were the same for the three simulations. Three induction loops were placed on the three lanes of one edge/road in the scenario, recording the amount of vehicles passing by every 60 s. Since the total number of vehicles in the three simulations was the same, the departure time of each vehicle was the same, and the simulation scenario was also the same. The only difference was the level of automation of vehicles. Therefore, by comparing the number of vehicles passing through the induction loops per unit time, the traffic flow of the three scenarios can be compared. Figure 6 shows the results of the simulation with the driver models of three different degrees of automation: Level 0, Level 2 and Level 5. The horizontal and vertical axes of the bar graph have been set the same in order to compare the differences between the three simulations in a clearer way. The departure time of all the vehicles ended before 660 s (simulation time). From the figure, it can be seen that the simulation with the Level 0 automation driver model takes the longest time of the three simulations. The simulation results in a duration of 1920 s. The second situation (simulated with the Level 2 automation driver model) is better in the total time with 1745 s, but the maximum traffic volume per minute remains the same as with Level 0. The third simulation with the fully autonomous driver model only took 1540 s, and the maximum traffic volume per minute has a significant increase.

5. Discussion and Future Scope

This paper presents a microscopic vehicle guidance model with three different degrees of automation level. The driver model consists of an adjusted microscopic car-following model and a fuzzy control model. The driving data of the fuzzy control model were collected from a driving experiment with 34 participants in a driving simulator. Using TraCI, SUMO was connected with MATLAB to simulate the driver model in a simple traffic scenario. Through the comparison of the fuzzy control model and real driver data, it has been verified that the driver model of Level 0 can represent real driving behavior. In the comparison of simulations implemented with driver models with different degrees of automation, it was shown that the traffic flow can be increased by vehicles with a higher degree of automation. With the increase of the automation level, the traffic density drops. Vehicles with the full automation level travel more efficiently on the road than the partial automation level ones.
The driving experiment showed some deficiencies for this work. In the driving simulator, due to the no-collision model, the participants have less fear of their vehicle at high speeds. In addition, the sensation of speed in real vehicles cannot be perfectly reproduced in simulators. This also affects the driving data at high speeds. Generally, in most instances, the driving model with no automation reproduces the behavior of human drivers sufficiently well.
The vehicle guidance model with a close-to-reality driver model presented in this article is different from the driver models which treat the driver and the vehicle as a unit. The model in this article is independent of the vehicle and can be matched with a variety of vehicle models to simulate more possibilities for future trends. For example, with an electric vehicle model, the impact of vehicles’ different degrees of automation on electric vehicles can be researched. There are also limitations of this article. The driving behavior segments were collected from the driving simulator, but for some reason, the driving behavior of subjects in a driving simulator can differ from their real behavior on the road. First, the difference of screen and real scenarios and the motion limitation of the driving simulator may cause a feeling of unreality in driving. Second, some participants may change their usual driving behavior when ”being watched” (e.g., probably, aggressive drivers would slow down and timid drivers would drive faster). Lastly, some participants may drive faster than usual because there is no fear of crashing in the simulated scenario. Moreover, in the driving experiment of this article, the number of male and female drivers was not the same; however, no obvious difference between male and female drivers were found in the driving experiment of this article.
Further research is planned to implement the driver model in a larger traffic scenario such as a whole city. By this, the effects of vehicles with different automation degrees can be observed in a simulation. In further simulations, the automation levels of certain vehicle groups will be continuously increased in order to see the process of traffic transformation from the actual situation to the far future. In cooperation with vehicle models, more different vehicle types (electric/hybrid/fuel cell) will be increasingly used and will be simulated with different driver models. In this case, not only the effects of traffic but also those of the environment can be seen from the simulation.

Author Contributions

X.M.: conceptualization, data curation, formal analysis, methodology, soft- ware, writing and editing. X.H.: conceptualization, methodology, validation, writing and editing. S.S.: methodology, software, revision. J.P.: revision. D.S.: project administration and supervision, result validation and critical revision. All authors have read and agreed to the published version of the manuscript.

Funding

This research received no external funding.

Informed Consent Statement

Informed consent was obtained from all subjects involved in the study.

Data Availability Statement

The data presented in this study are available on request from the corresponding author. The data are not publicly available due to restrictions of the subjects’ agreement.

Acknowledgments

We acknowledge support by the Open Access Publication Fund of the University of Duisburg-Essen.

Conflicts of Interest

The authors declare no conflict of interest.

References

  1. Gipps, P.G. A behavioural car-following model for computer simulation. Transp. Res. Part B: Methodol. 1981, 15, 105–111. [Google Scholar] [CrossRef]
  2. Krauß, S. Microscopic Modeling of Traffic Flow. Investigation of Collision Free Vehicle Dynamics; Als, G., Ed.; Zentrum für Luft- und Raumfahrt e.V., Abt. Unternehmensorganisation und -Information: Köln, Germany, 1998. [Google Scholar]
  3. Treiber, M.; Kesting, A. Traffic Flow Dynamics. Data, Models and Simulation; Springer: Berlin/Heidelberg, Germany, 2013; ISBN 978-3-642-32460-4. [Google Scholar]
  4. Chandler, R.E.; Herman, R.; Montroll, E.W. Traffic dynamics: Studies in car following. Oper. Res. 1958, 6, 165–184. [Google Scholar] [CrossRef]
  5. Pipes, L.A. An operational analysis of traffic dynamics. J. Appl. Phys. 1953, 24, 274–281. [Google Scholar] [CrossRef]
  6. Gazis, D.C.; Herman, R.; Rothery, R.W. Nonlinear follow-the-leader models of traffic flow. Oper. Res. 1961, 9, 545–567. [Google Scholar] [CrossRef]
  7. Wiedemann, R. Simulation des Strassenverkehrsflusses. 1974. Available online: https://trid.trb.org/view/596235 (accessed on 2 January 2021).
  8. Lu, Z.; Fu, T.; Fu, L.; Shiravi, S.; Jiang, C. A video-based approach to calibrating car-following parameters in VISSIM for urban traffic. Int. J. Transp. Sci. Technol. 2016, 5, 1–9. [Google Scholar] [CrossRef] [Green Version]
  9. Fabianova, J.; Michalik, P.; Janekova, J.; Fabian, M. Design and evaluation of a new intersection model to minimize congestions using VISSIM software. Open Eng. 2020, 10, 48–56. [Google Scholar] [CrossRef] [Green Version]
  10. Hayashi, K.; Shimizu, Y.; Dote, Y.; Takayama, A.; Hirako, A. Neuro fuzzy transmission control for automobile with variable loads. IEEE Trans. Control Syst. Technol. 1995, 3, 49–53. [Google Scholar] [CrossRef]
  11. Holve, R.; Protzel, P.; Naab, K. (Eds.) Generating Fuzzy Rules for the Acceleration Control of an Adaptive Cruise Control System. In Proceedings of the North American Fuzzy Information Processing, Berkeley, CA, USA, 19–22 June 1996; IEEE: Piscataway, NJ, USA, 1996. [Google Scholar]
  12. Naranjo, J.E.; González, C.; García, R.; de Pedro, T. ACC+ Stop&go maneuvers with throttle and brake fuzzy control. IEEE Trans. Intell. Trans. Syst. 2006, 7, 213–225. [Google Scholar]
  13. Pananurak, W.; Thanok, S.; Parnichkun, M. (Eds.) Adaptive cruise control for an intelligent vehicle. In Proceedings of the 2008 IEEE International Conference on Robotics and Biomimetics, Bangkok, Thailand, 22–25 February 2009; IEEE: Piscataway, NJ, USA, 2009. [Google Scholar]
  14. Chen, G.; Zhang, W.; Li, X.; Yu, B. Adaptive speed control method for electromagnetic direct drive vehicle robot driver based on fuzzy logic. Meas. Control 2019, 52, 1344–1353. [Google Scholar] [CrossRef] [Green Version]
  15. Maas, N.; Benjamin, H.; Martin, K.; Schramm, D. (Eds.) Simulator Setup According to Use Case Scenarios-A Human-Oriented Method for Virtual Development. In Proceedings of the 2014 IEEE/ASME 10th International Conference on Mechatronic and Embedded Systems and Applications (MESA), Senigallia, Italy, 10–12 September 2014; IEEE: Piscataway, NJ, USA, 2014. [Google Scholar]
  16. Maas, N. Konzeptionierung, Auslegung und Umsetzung von Assistenzfunktionen für die Übergabe der Fahraufgabe aus Hochautomatisiertem Fahrbetrieb. Ph.D. Thesis, Universitätsbibliothek Duisburg-Essen, Duisburg, Germany, 2017. [Google Scholar]
  17. Schweig, S.; Liebherr, M.; Schramm, D.; Brand, M.; Mass, N. (Eds.) The impact of psychological and demographic parameters on simulator sickness. In Proceedings of the SIMULTECH, Porto, Portugal, 29–31 July 2018. [Google Scholar]
  18. Lopez, P.A.; Behrisch, M.; Bieker-Walz, L.; Erdmann, J.; Flötteröd, Y.-P. (Eds.) Microscopic traffic simulation using sumo. In Proceedings of the 2018 21st International Conference on Intelligent Transportation Systems (ITSC), Maui, HI, USA, 4–7 November 2018; IEEE: Piscataway, NJ, USA, 2018. [Google Scholar]
  19. Wagner, P. Steuerung und Management in Einem Verkehrssystem mit Autonomen Fahrzeugen; Autonomes Fahren; Springer: Berlin/Heidelberg, Germany, 2015; pp. 313–330. [Google Scholar]
  20. Teichner, W.H. Recent studies of simple reaction time. Psychol. Bull. 1954, 51, 128. [Google Scholar] [CrossRef] [PubMed]
  21. Johansson, G.; Rumar, K. Drivers’ brake reaction times. Hum. Fact. 1971, 13, 23–27. [Google Scholar] [CrossRef] [PubMed]
  22. Orosz, G.; Wilson, R.E.; Krauskopf, B. Global bifurcation investigation of an optimal velocity traffic model with driver reaction time. Phys. Rev. E 2004, 70, 26207. [Google Scholar] [CrossRef] [PubMed] [Green Version]
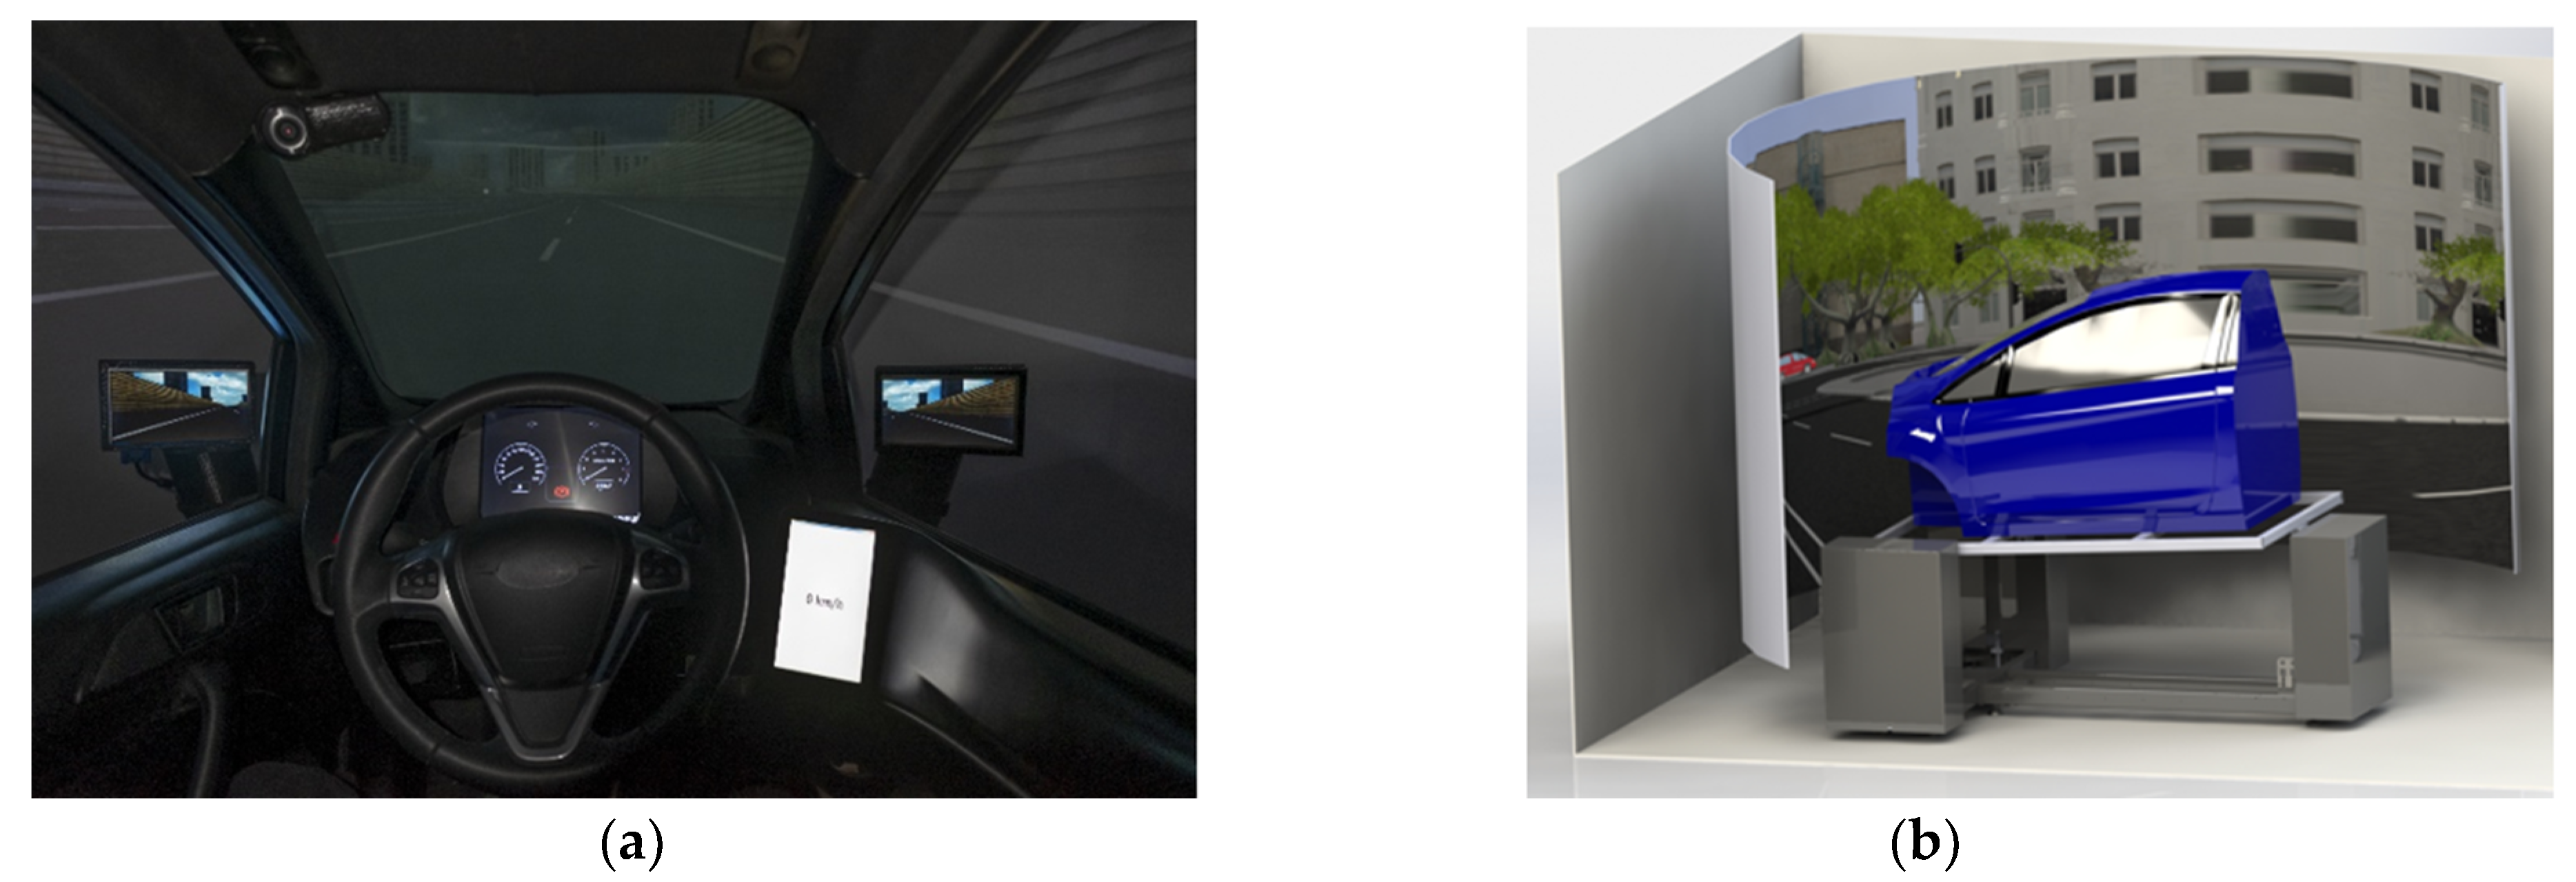
Figure 1. (a,b) Internal and external layout of the simulator.
Applsci 11 00380 g001
Figure 2. Schematic diagram of the driver model and vehicle model system.
Applsci 11 00380 g002
Figure 3. Inputs and outputs of the fuzzy control model. (a,b) are inputs, actual velocity of the vehicle and velocity difference with the desired speed. Depending on the rules in Table 1, the fuzzy control model generates outputs (c) that represent pedal positions.
Applsci 11 00380 g003
Figure 4. Driver model with different degree of automation.
Applsci 11 00380 g004
Figure 5. (ad) Behavior of fuzzy control model compared with subjects’ driving behavior.
Applsci 11 00380 g005
Figure 6. (ac) Comparison of simulations with different driver models.
Applsci 11 00380 g006
Table 1. Generated fuzzy model rules.
Vn
NCNGNENBNMNSNJNZPPJPSPMPBPEPC
vnEMC0C1C1C1C2C3C8C10C10C11C12C14C17C17C18C18
ELC0C1C1C1C2C3C8C10C10C11C13C14C14C17C18C18
VLC0C1C1C1C3C3C10C10C11C11C13C14C15C17C18C18
LC0C1C1C1C2C3C10C10C11C11C13C14C16C16C18C19
MEDC0C1C1C2C2C3C10C10C11C12C13C14C16C17C18C19
HC0C1C1C2C2C4C11C11C11C12C13C14C16C17C18C19
VHC0C1C1C2C3C4C11C12C13C13C14C15C16C17C18C19
EHC0C1C2C2C3C4C11C12C13C13C14C15C16C17C18C19
CC0C1C1C2C3C5C11C12C14C13C14C15C16C17C18C19
Publisher’s Note: MDPI stays neutral with regard to jurisdictional claims in published maps and institutional affiliations.