1. Introduction
A mechanically stabilized earth MSE wall is a new method applicable to replace conventional concrete retaining walls, and a very good method in terms of economic efficiency, stability, and constructability. Therefore, its on-site application is currently increasing. Key components of an MSE wall include a front wall, a reinforcement, and backfill soil. In particular, the reinforcement enhances the tensile strength of soil, and implements the reinforcement effect by means of frictional resistance between the soil and the reinforcement. Therefore, the reinforcement is an element playing the most important role in an MSE wall, and is continuously studied for developing various types of reinforcements.
The reinforcements used generally in MSE walls are classified into three types, including sheet-type reinforcements, strip-type reinforcements, and grid-type reinforcements. In particular, the geogrid, which is a very strong grid-type fiber for civil engineering applications and developed in the early 1980s, has been generally used so far.
Many studies have been conducted for the pullout test to find the frictional characteristics between soil and reinforcements required in designing the internal stability of a mechanically stabilized earth (MSE) wall depending on various test conditions. However, despite many studies, each country has its own regulations for the pullout test method, regarding the pullout box sizes and methods. The pullout test was conducted to understand the properties of pullout behavior about the influence factors of the pullout test, especially the confining stress and the reinforcement tensile strength.
Previous studies have been reviewed about the reinforcement confining stress and the tensile strength, having influence on frictional characteristics between soil and the reinforcement. In general, dilatancy affecting the friction can be greater in low stress rather than in high stress. Such a result showed that the coefficient of friction on the upper layer of the soil reinforcement structure was greater than the coefficient of friction on the lower layer. Some researchers insist that the vertical stress in pullout is related to dilatancy of the soil at the interface between the soil and the geogrid for civil engineering applications (Brand and Duffy [
1]; Rao and Pandey [
2]; Chang et al. [
3]). In addition, as a result of the experiment, the volume expansion of the soil around the reinforcement is influenced by the sample preparation method, compaction method and vertical stress and specification of the reinforcement (Farrag [
4]; Moraci and Recalcati [
5], Palmeira and Milligan [
6]). The volume expansion between the reinforcement and soil are also influenced by sample preparation, compaction method, normal stress, and the properties of reinforcements. Research has been conducted to investigate the behavior between soil and geotextiles through various shear tests (Lee and Manjunath [
7]; Liu et al. [
8]; Vieira et al. [
9]). A number of studies have been conducted to evaluate the behavior of the reinforcement and soil.
In particular, Ingold [
10] conducted pullout tests for a real-scale MSE wall and presented that the maximum frictional angle decreased as the surface load increased. Rao and Pandey [
2] demonstrated that the coefficient of friction at the interface between the soil and the geogrid for civil engineering applications can be greater than the coefficient of friction of the soil itself. Ingold [
11] showed that the coefficient of friction of soil/geogrid for civil engineering applications at low vertical stress is greater than the coefficient of friction of the soil in terms of the frictional angle at the interface between the soil and the geogrid for civil engineering applications. Moreover, Scholsser and Elias [
12] presented that the interlocking coefficient of granular soil with small surface load lies between two and six, and is almost constant where the surface load is at least 80 kN/m
2. Farrag and Griffin [
13], and Palmeira [
14] stated that the condition of the pull-out device had the greatest influence on the results of the drawing test. Farrag and Griffin [
13], and Palmeira [
14] reported that the pullout test is most influenced by the condition of the face wall of the pullout equipment. Seira [
15] considered that higher compaction provides the cause of tensile failure of the reinforcement. Seira [
15] investigated the cause of tensile failure with high compaction energy.
As a result of the analysis of previous studies, it was found that the pull-out constant applied to the design of the MSE walls has a great influence on the constraining stress and tensile strength of the reinforcement. In particular, the pull-out test with low confining stress tended to overestimate the pull-out constant.
Therefore, in this study, the pull-out resistance characteristics of the reinforcement were analyzed by varying the constraining stress (0, 10, 20, 30, 40 and 60 kPa or 0, 20, 40, 60, 80 and 100 kPa) and tensile strength (60, 100 and 150 kN/m) of the reinforcement using an extensible grid-type reinforcement. In addition, the rational pull-out constant required for the design of the MSE walls was determined from the experimental results.
2. Behavioral Properties of Soil and Reinforcement
2.1. Theoretical Background
Many studies have been conducted on the pullout test of MSE walls to find pullout characteristics between the soil and the reinforcement. There are many pullout test data obtained for various reinforcements, features of pullout test systems and test conditions. However, each country has its own test methods and regulations. In particular, many block-type MSE walls appropriate for the conditions of Korea are employed, rather than the panel-type MSE walls, and geogrid reinforcements are used in most cases.
Conducted pullout test studies showed that the confining stress ranges between 30 kPa and 200 kPa, and
Figure 1 shows the pullout force depending on the influence of confining stress in the pullout test.
Therefore, the confining stress, which is one of various factors in the pullout test, has great influence, and in particular, the pullout behavioral properties between the soil and reinforcements are different depending on the types and shapes of reinforcements and their tensile strength. In particular, non-extensible reinforcements do not experience damage by confining stresses, and their pullout force following pullout displacement linearly increases. However, geogrid reinforcements tend to have pullout force concentrating mostly on their front depending on the pullout load in the case of high confining stresses, and have a smaller pullout force in the back thereof. Moreover, with smaller confining stresses than approximately 50 kPa, the pullout force is exerted across the whole area of the reinforcements.
There is no method specified for confining stresses in the pullout test so far; therefore, pullout tests with only three or four types of confining stresses were conducted. The result of pullout testing geogrid reinforcements showed no pullout displacement occurs in a pullout box with a high confining stress in some cases. Ochiai, et al. [
17] suggested an average resistance method for evaluating shear strength between the soil and the reinforcements by using pullout resistance obtained from the pullout test result to consider the pullout resistance properties of a geogrid reinforcement.
The average resistance method uses the average in consideration of a pullout force distribution depending on reinforcement length under maximum pullout force for calculating the shear strength at the interface between the soil and the reinforcement, and is mainly used for limit equilibrium analysis of the MSE wall. The average resistance method is classified into the whole area method, the effective area method, and the steepest descent method depending on the average-taking process. The whole area method assumes that pullout resistance acts on the whole area of a reinforcement; the effective area method assumes that pullout resistance acts just on the section where actual strain occurs; and the steepest descent method calculates an average resistance between the soil and the reinforcements from the gradient of a tangent at the point where the curve gradient of a tensile force distribution curve is the greatest. Among the three aforementioned methods, the effective area method is considered the most effective, and the result of calculation gives intermediate values. However, with the effective area method, it is hard to calculate an effective area, and shows a big difference between the pullout resistances depending on the effective areas.
In this study, the nodal displacement of the geogrid installed in the soil tank for applying pullout parameters was measured to determine the confining stress at which the whole reinforcement area was pulled out as an effective confining stress, and then pullout parameters were calculated. The pullout test was conducted with different reinforcement tensile strengths and confining stresses to compare the results. The pullout test result was used to analyze the relationship between front-end pullout displacement and pullout force, depending on the reinforcement tensile strength and the confining stress, and nodal displacement thereof. The pullout parameters depending on the reinforcement tensile strengths and the confining stresses were also compared and evaluated.
2.2. Evaluating Pullout Parameters
For the internal stability analysis of an MSE wall, it is necessary to review rupture by horizontal activity and the stability of pullout failure, and conduct the pullout test to obtain pullout parameters showing frictional characteristics between the soil and the reinforcements in the review process. However, in the pullout test, unlike the direct shear test, the pullout resistance decreases as it moves farther from the front side of the pullout section, that is, the front side of the pullout test system.
The pullout test result revealed that the pullout resistance observed was not constant across the whole area and a greater pullout displacement occurred as it moved closer to the front side. That is, the pullout force was concentrated and acted greatly on the front, and some parts had smaller or no pullout displacement at all because they were closer to the rear side. As a result, the pullout test showed different pullout forces depending on the influence of reinforcement tensile strength and the confining stress. Therefore, it is very difficult to obtain accurate pullout parameters. An effective confining stress was thus selected from the confining stress at which the pullout behavioral properties of the reinforcement were well developed. The relationship between the effective confining stress and the average pullout stress corresponding to the effective confining stress was shown to select a pullout frictional angle to name it as an effective confining stress method.
This study shows the relationship between the confining stress and the average pullout stress compared to the pullout test result, depending on the reinforcement tensile strength and the confining stress. This was calculated with Equation (1) (Ochiai, et al. [
17]). The average pullout stress was obtained with Equation (2) for the whole area method (Ochiai, et al. [
17]). The angle of the straight line in the relationship curve was tanφ
p, and tan
−1(gradient of the straight line) corresponded to the pullout frictional angle (φ
p). The intercept corresponded to the pullout cohesion (c
p). The sample used in this study was Jumunjin (in South Korea), standard sand of which the pullout cohesion is 0 (zero), and just the pullout frictional angle was analyzed as a pullout parameter.
where τ
av is the average pullout stress (kPa), σ
v is the confining stress (kPa), φ
p is the pullout frictional angle (
), and c
p is the pullout cohesion (kPa).
where
is the average pullout stress (kPa),
is the maximum pullout force (kN)
B is the reinforcement width (m), and
L is the reinforcement length (m).
3. Pullout Test
3.1. Pullout Test Apparatus
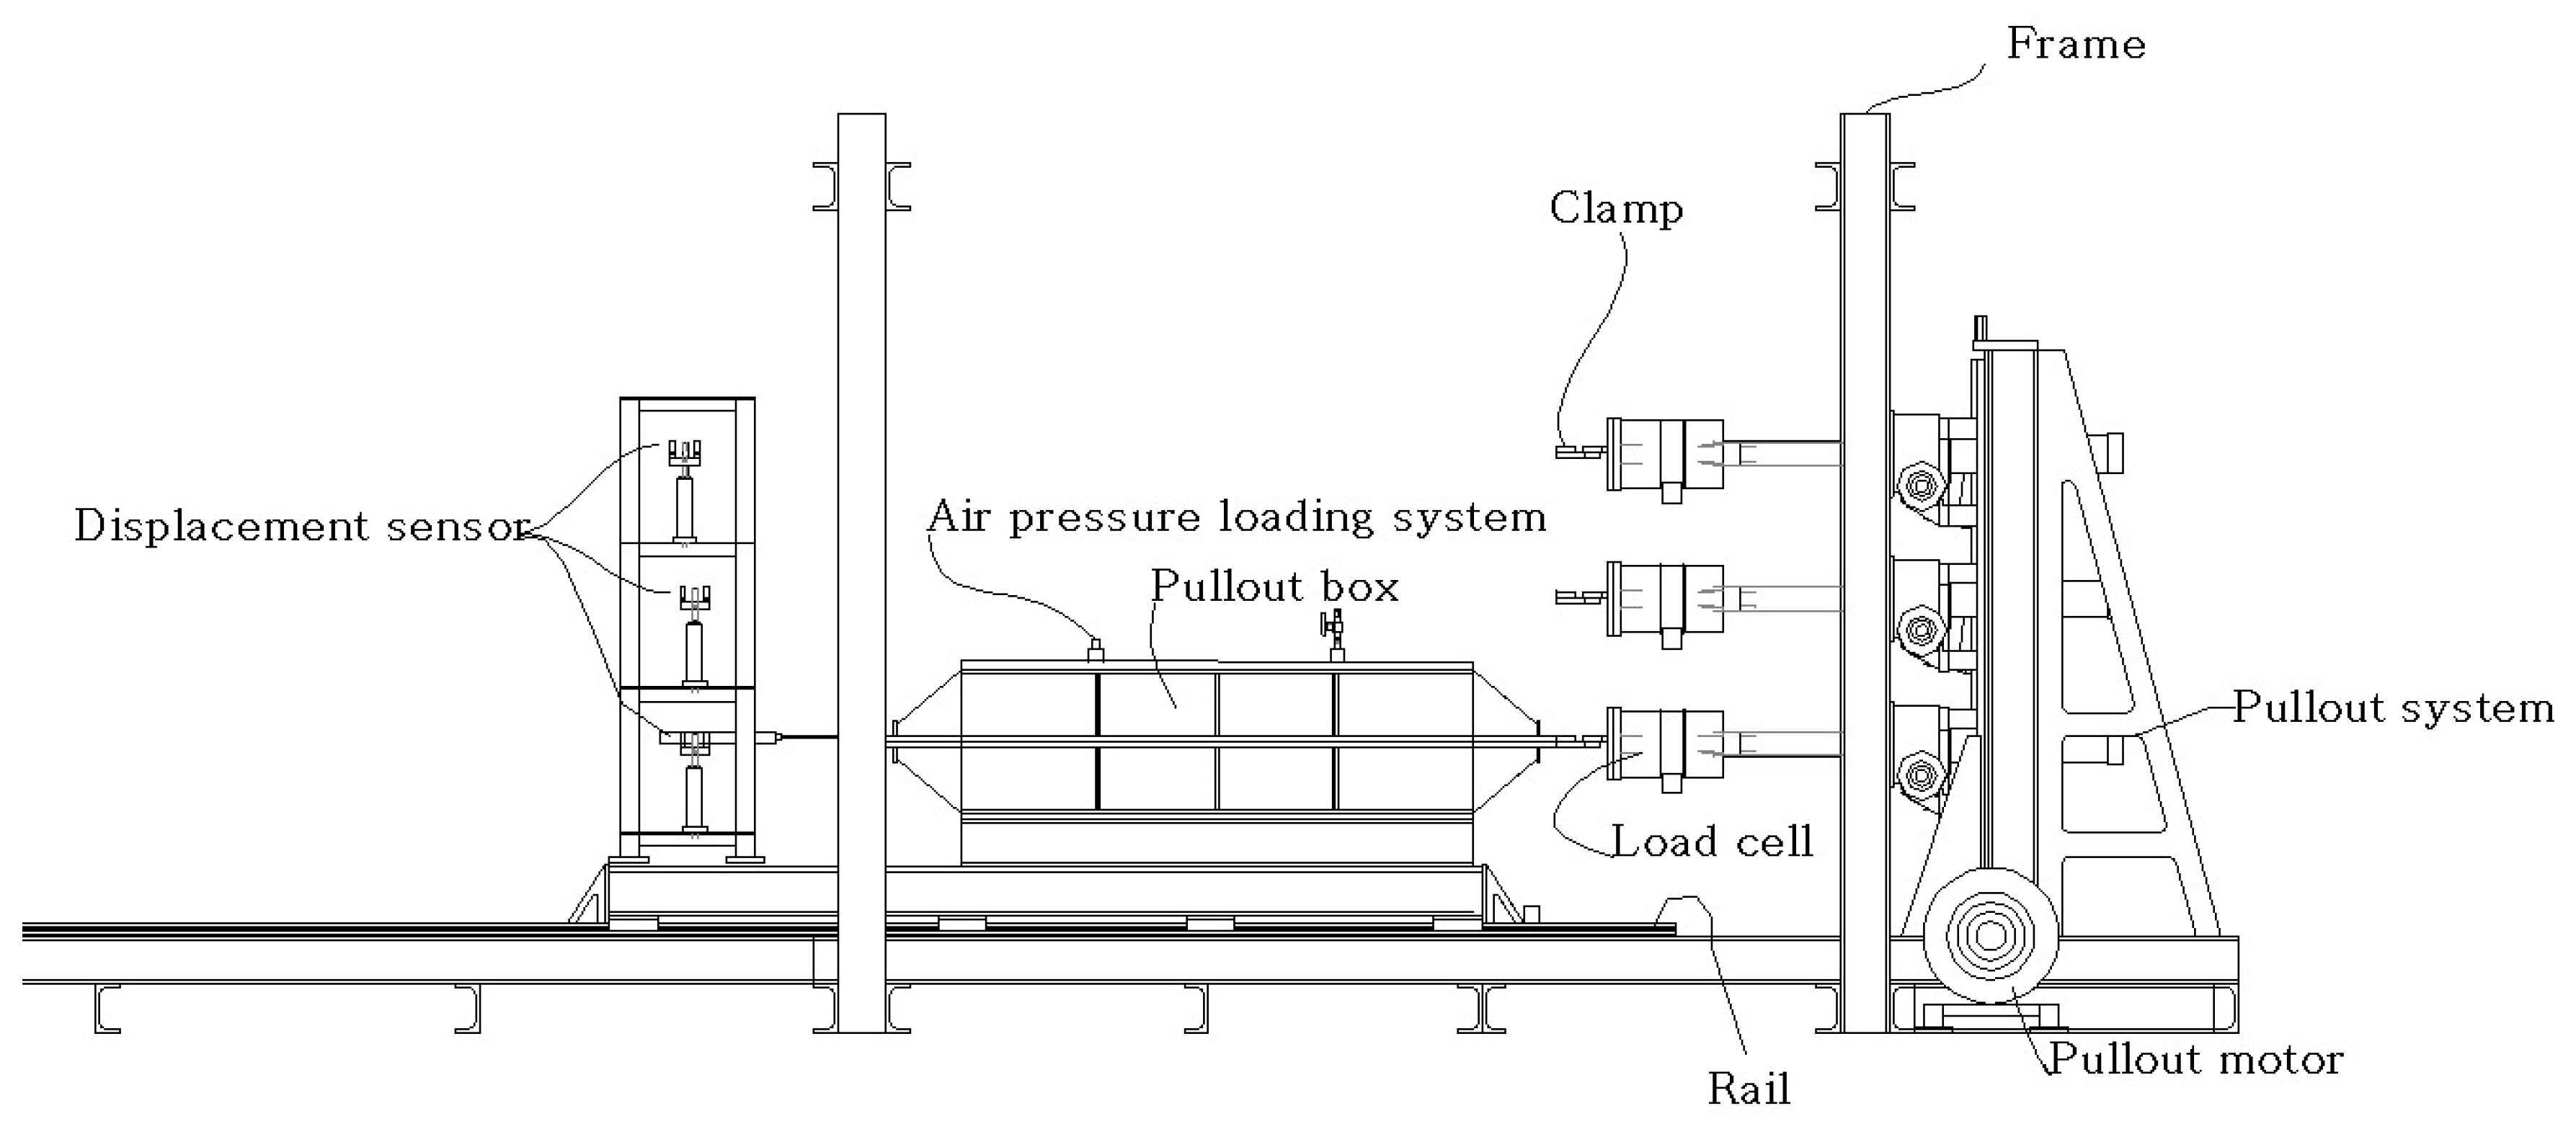
In this study, a multi-stage pullout test apparatus was used, in which the pullout system has three stages, as shown in
Figure 2. The pullout test was conducted with different reinforcement tensile strengths and confining stresses with the pullout test apparatus to obtain pullout characteristics as the key characteristics of an MSE wall, i.e., the behavioral properties between the soil and the reinforcements in pullout.
The loading system used for the pullout test was mostly the air pressure type, and the pullout box size on each stage was 100 × 30 × 40 cm (depth, length and width, respectively). For the confining stress, an air pressure bag system was installed to load a confining stress uniformly in the soil tank by means of air pressure, and the maximum air pressure was 200 kPa applied to the air pressure bag system.
The device for fixing the geogrid was used to tighten the screws to fix the geogrid and connected directly to the load cell to get data. The pullout test apparatus had components of a loading system, a soil tank, and a measuring system.
As described above, the configuration of the pullout test was divided into a load cell, soil box, and a displacement sensor system. Compared with the existing pullout test, the features of the multilayer pullout test are as follows. One side of the soil box was made of an acrylic so that the ground behavior of the reinforced soil could be observed. In addition, the clamp, which was a geotextile reinforcement fixing device, was made up of a top and bottom pair, and irregularities were formed on the opposite surface to prevent the geotextile from being broken by local stress.
In order to smoothly carry out the preparation of the model ground, the soil box was placed able to move on the rail. A stopper to stop the movement of the soil box was installed on the rail, and the pullout box was designed to be separated.
3.2. Material Tested
3.2.1. Properties of Reinforcement
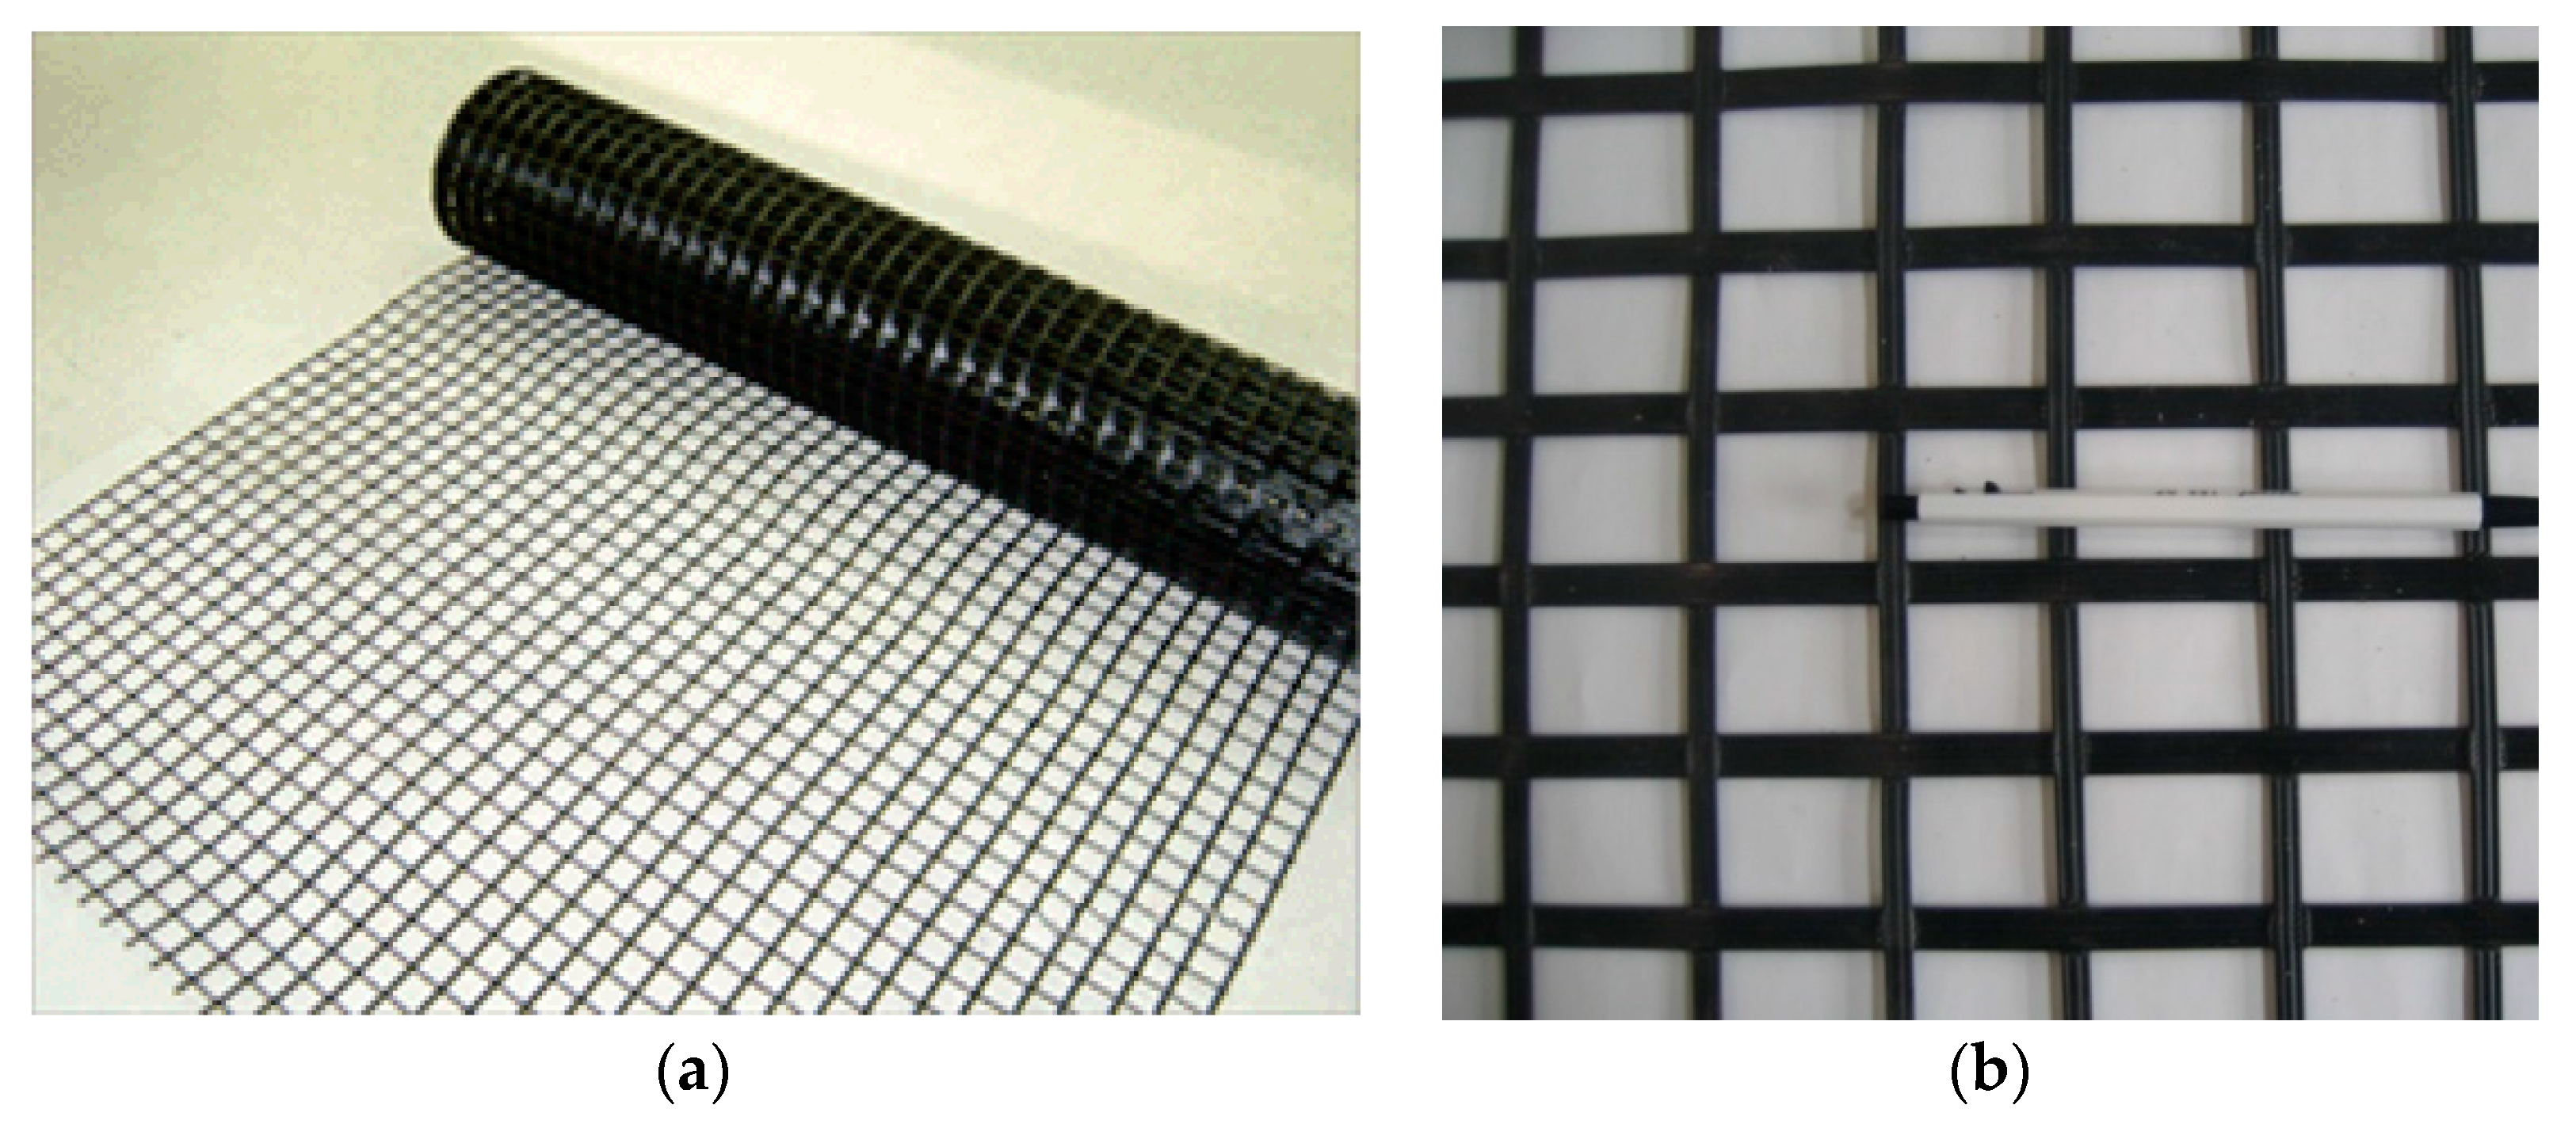
The reinforcement material used in this study was a geogrid manufactured by melting polymer strips reinforced with high-performance fiber in a 3D-cross structure. The high strength yarn (PET) developed specially for civil engineering applications was made as original fabric in a grid form and then coated with a plastic protection material (PP) to produce a combination-type geogrid. Physical properties of the used reinforcement are illustrated in
Table 1.
Figure 3 is the shape of the geogrid reinforcement used in the pull-out test. The geogrid in
Figure 3a had a maximum tensile strength of 100 kN/m and a maximum tensile strain of 13.0%. Additionally, as shown in
Figure 3b, the size of the geogrid was 40 mm × 40 mm.
3.2.2. Laboratory Model Test
The soil sample used in this study was Jumunjin standard sand, and
Table 2 illustrates the engineering characteristics of the soil sample. The Jumunjin standard sand corresponds to SP (Poorly-graded Sand), which is a poorly graded sand based on the Unified Soil Classification System (Casagrande [
19]). Based on the direct shear test, the soil sample was found to have an internal frictional angle of 34.5°.
3.3. Test Method
The pullout test was conducted in the following sequence:
- -
The reinforcement laying length was fixed to L = 100 cm to conduct the pullout test for three types of tensile strength and six steps of the confining stress of the reinforcement.
- -
Jumunjin standard sand was used to produce a simulated ground, and multiple-sieving pluviation apparatus was used to produce the relative density of simulated ground.
- -
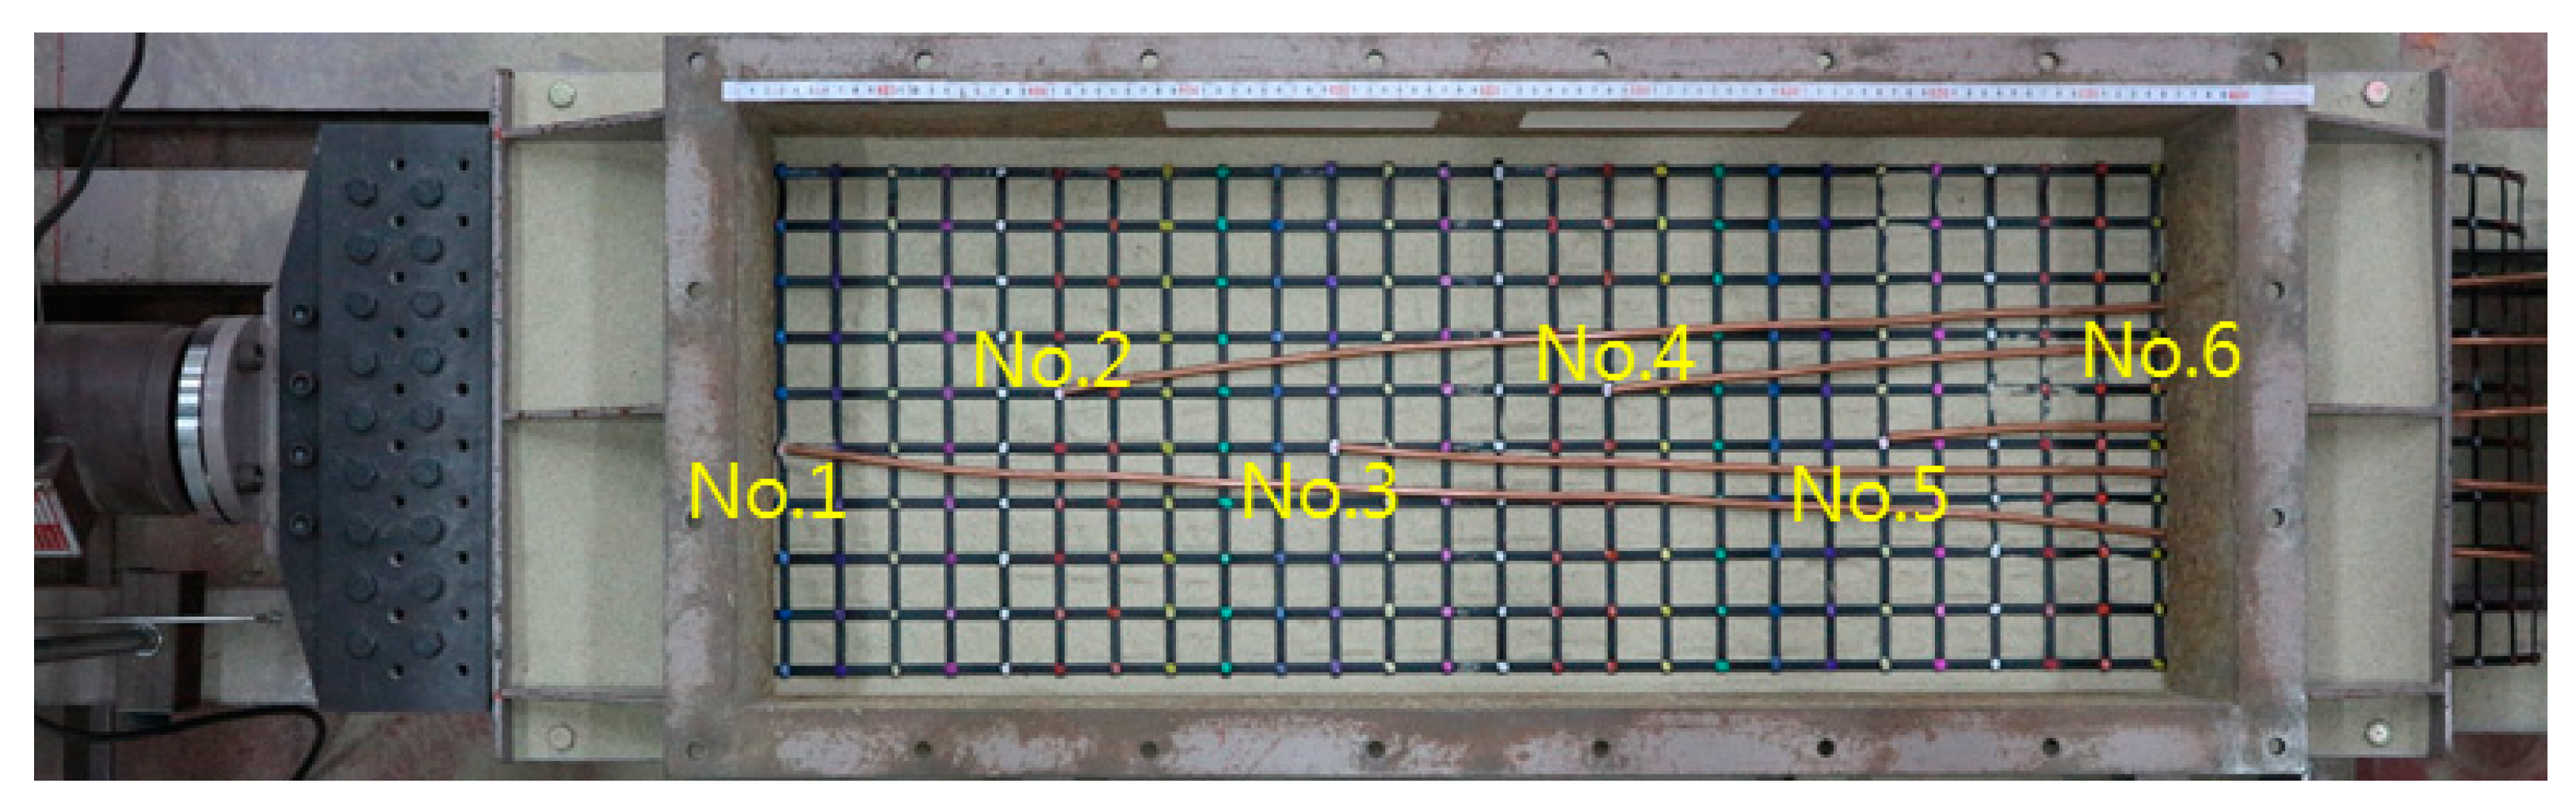
One displacement sensor was installed on one side of the apparatus for fixing the geogrid, and the displacement sensors were fixed to measure nodal pullout displacement (
Figure 4).
- -
The results were connected to the data logger to measure pullout displacement at the intervals of 60 s.
- -
An air pressure bag system was installed on the soil tank after manufacturing the model ground.
- -
The laid reinforcement was coupled to a clamp, and pullout was applied depending on the confining stresses. In the pullout test, a constant pullout speed was applied at 1 mm/min, and pullout force was measured by means of the load cell connected to the apparatus for fixing the geogrid.
- -
The front-end pullout displacement, pullout force and nodal displacement in the pullout process were measured.
- -
Pullout parameters were determined in accordance with the evaluation method from the relationship curve between the pullout force and pullout displacement, depending on each confining stress.
3.4. Conditions of Pullout Test
For the pullout test to determine practical pullout parameters, test conditions were selected depending on the reinforcement confining stresses and the tensile strengths. An extensible geogrid reinforcement was selected, of which the tensile strengths were 60 kN/m, 100 kN/m, and 150 kN/m. The selected confining stresses were 0 (self-weight), 10, 20, 30, 40 and 60 kPa for the reinforcement tensile strength 60 kN/m, and 0 (self-weight), 20, 40, 60, 80 and 100 kPa for the reinforcement tensile strength of 100 kN/m and 150 kN/m.
Table 3 illustrates the conditions of the pullout test.
4. Pullout Behavioral Properties Depending on Reinforcement Tensile Strength and Confining Stress
4.1. Analysis of Relationship between Front-End Pullout Displacement and Pullout Force Depending on Reinforcement Strength
Figure 5,
Figure 6 and
Figure 7 show the relationship between front-end pullout displacement and pullout force obtained from the pullout test result for tensile strength (T
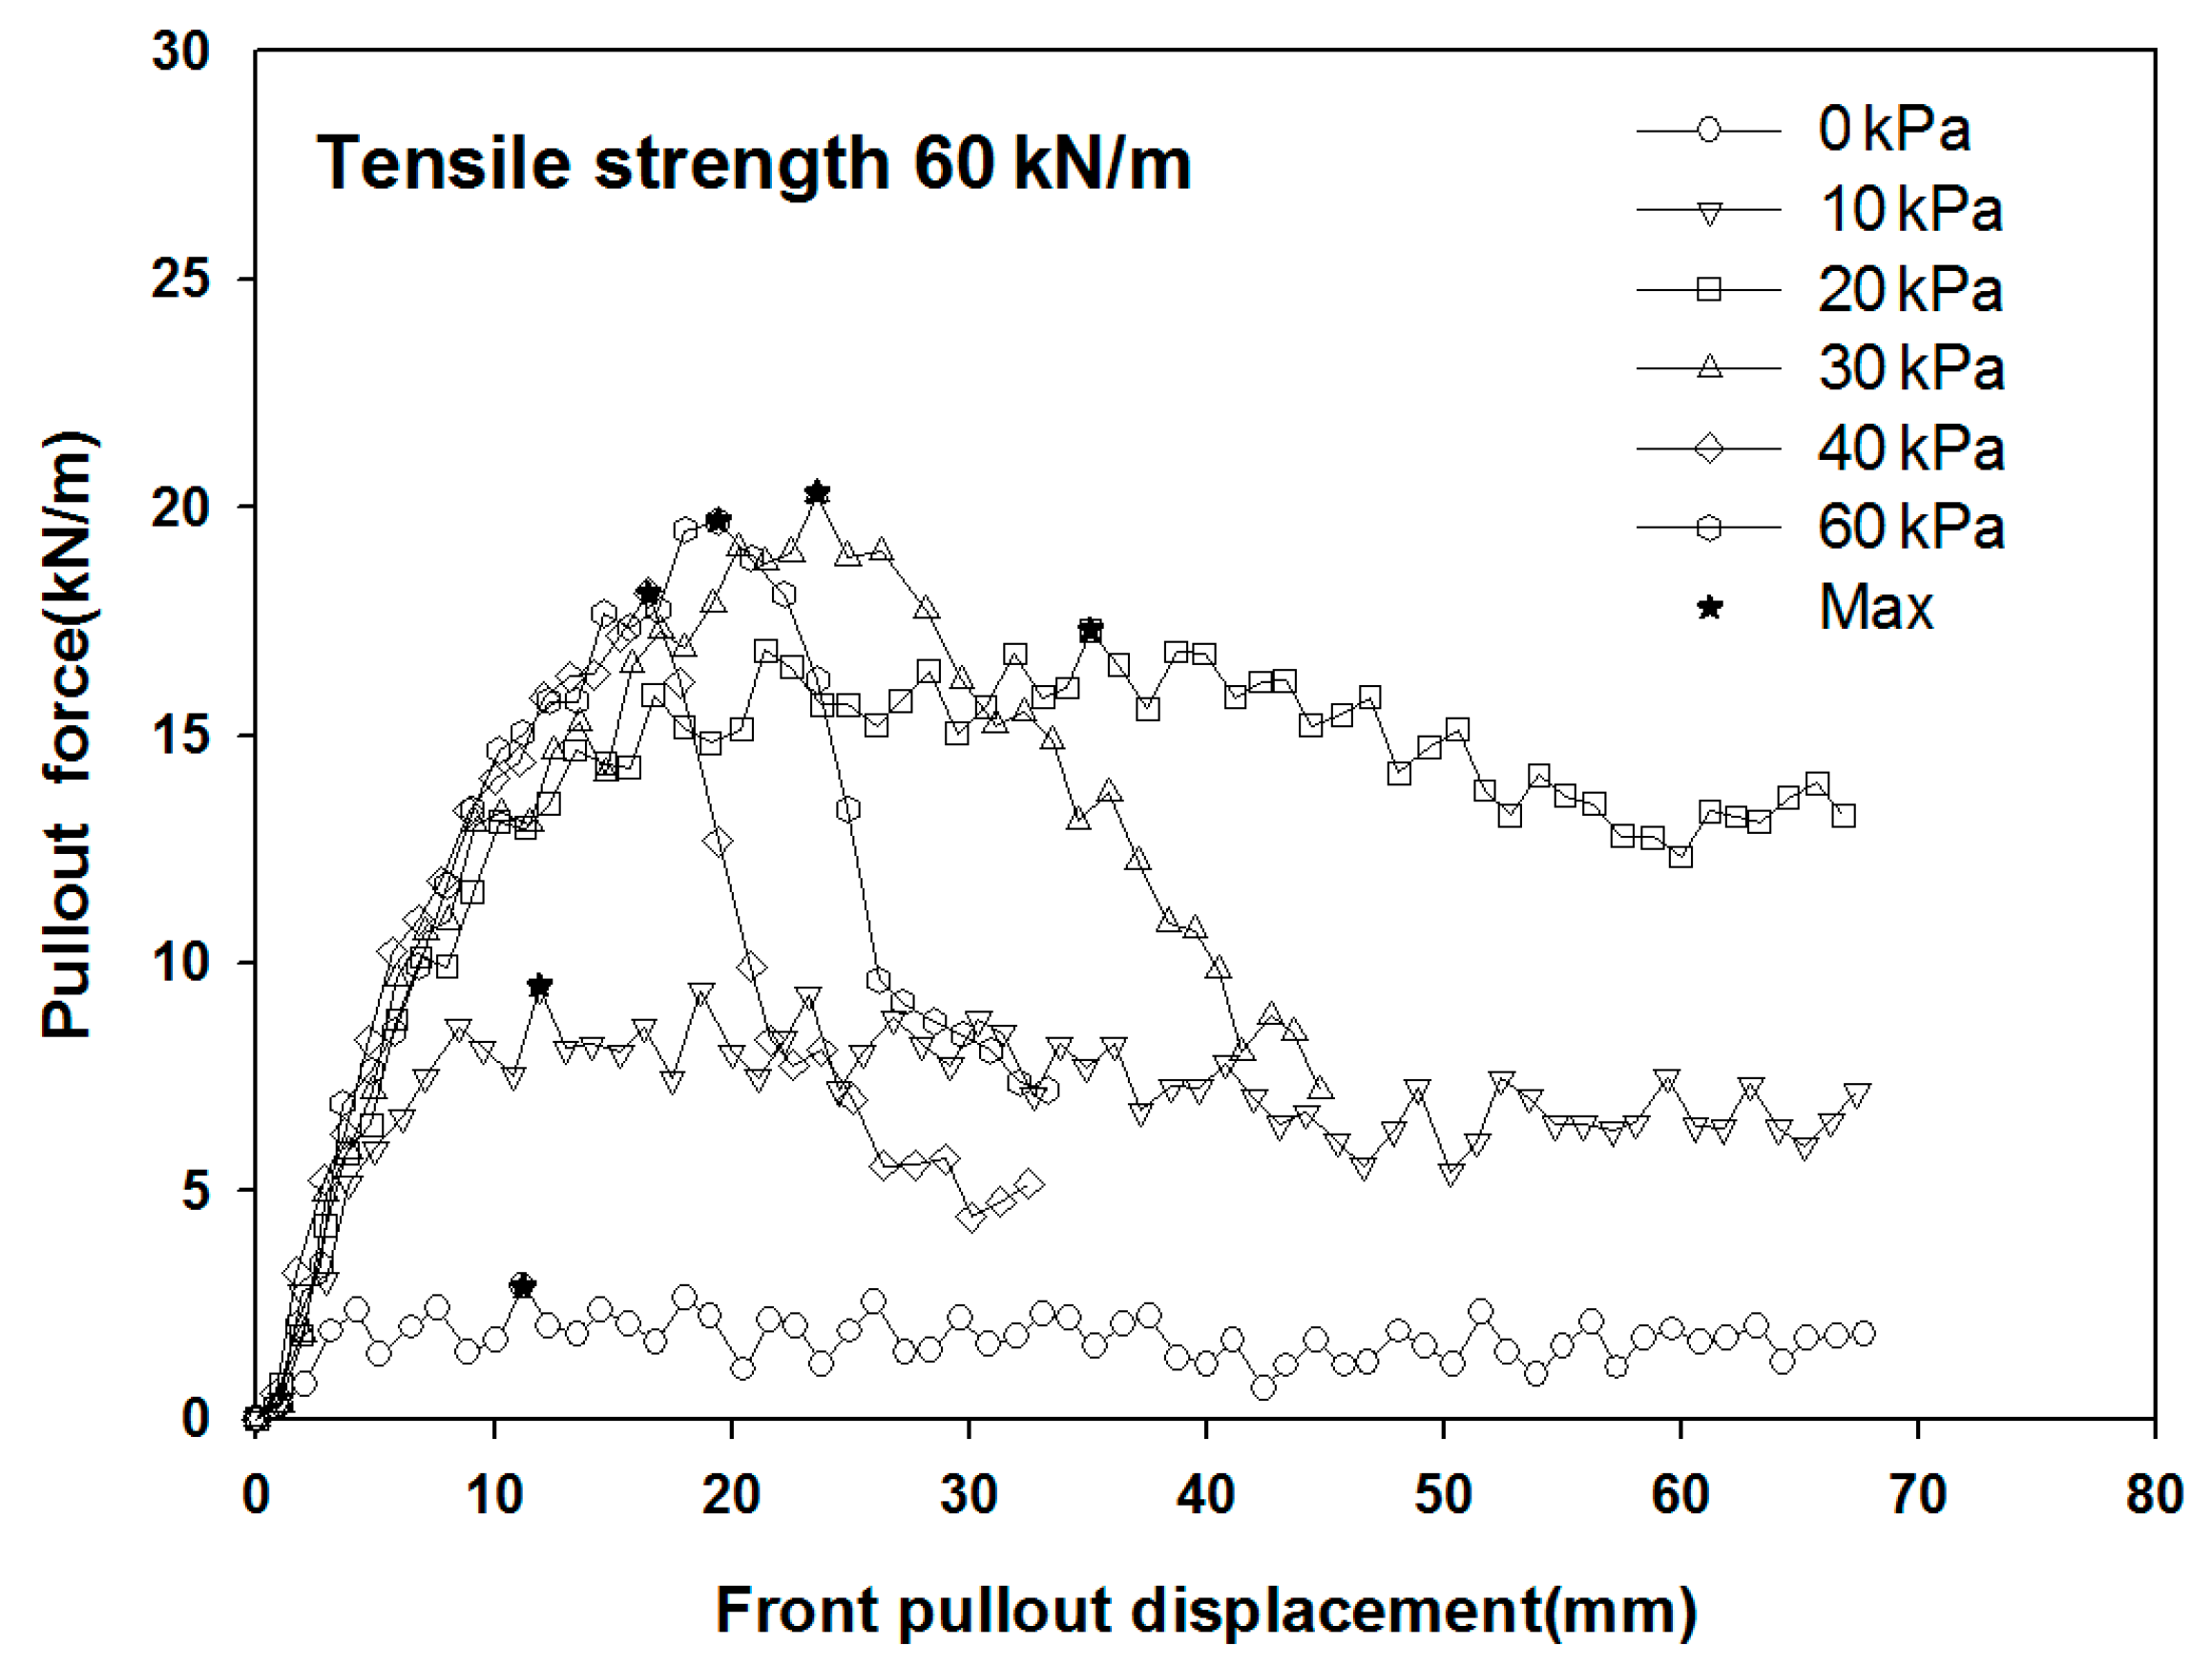
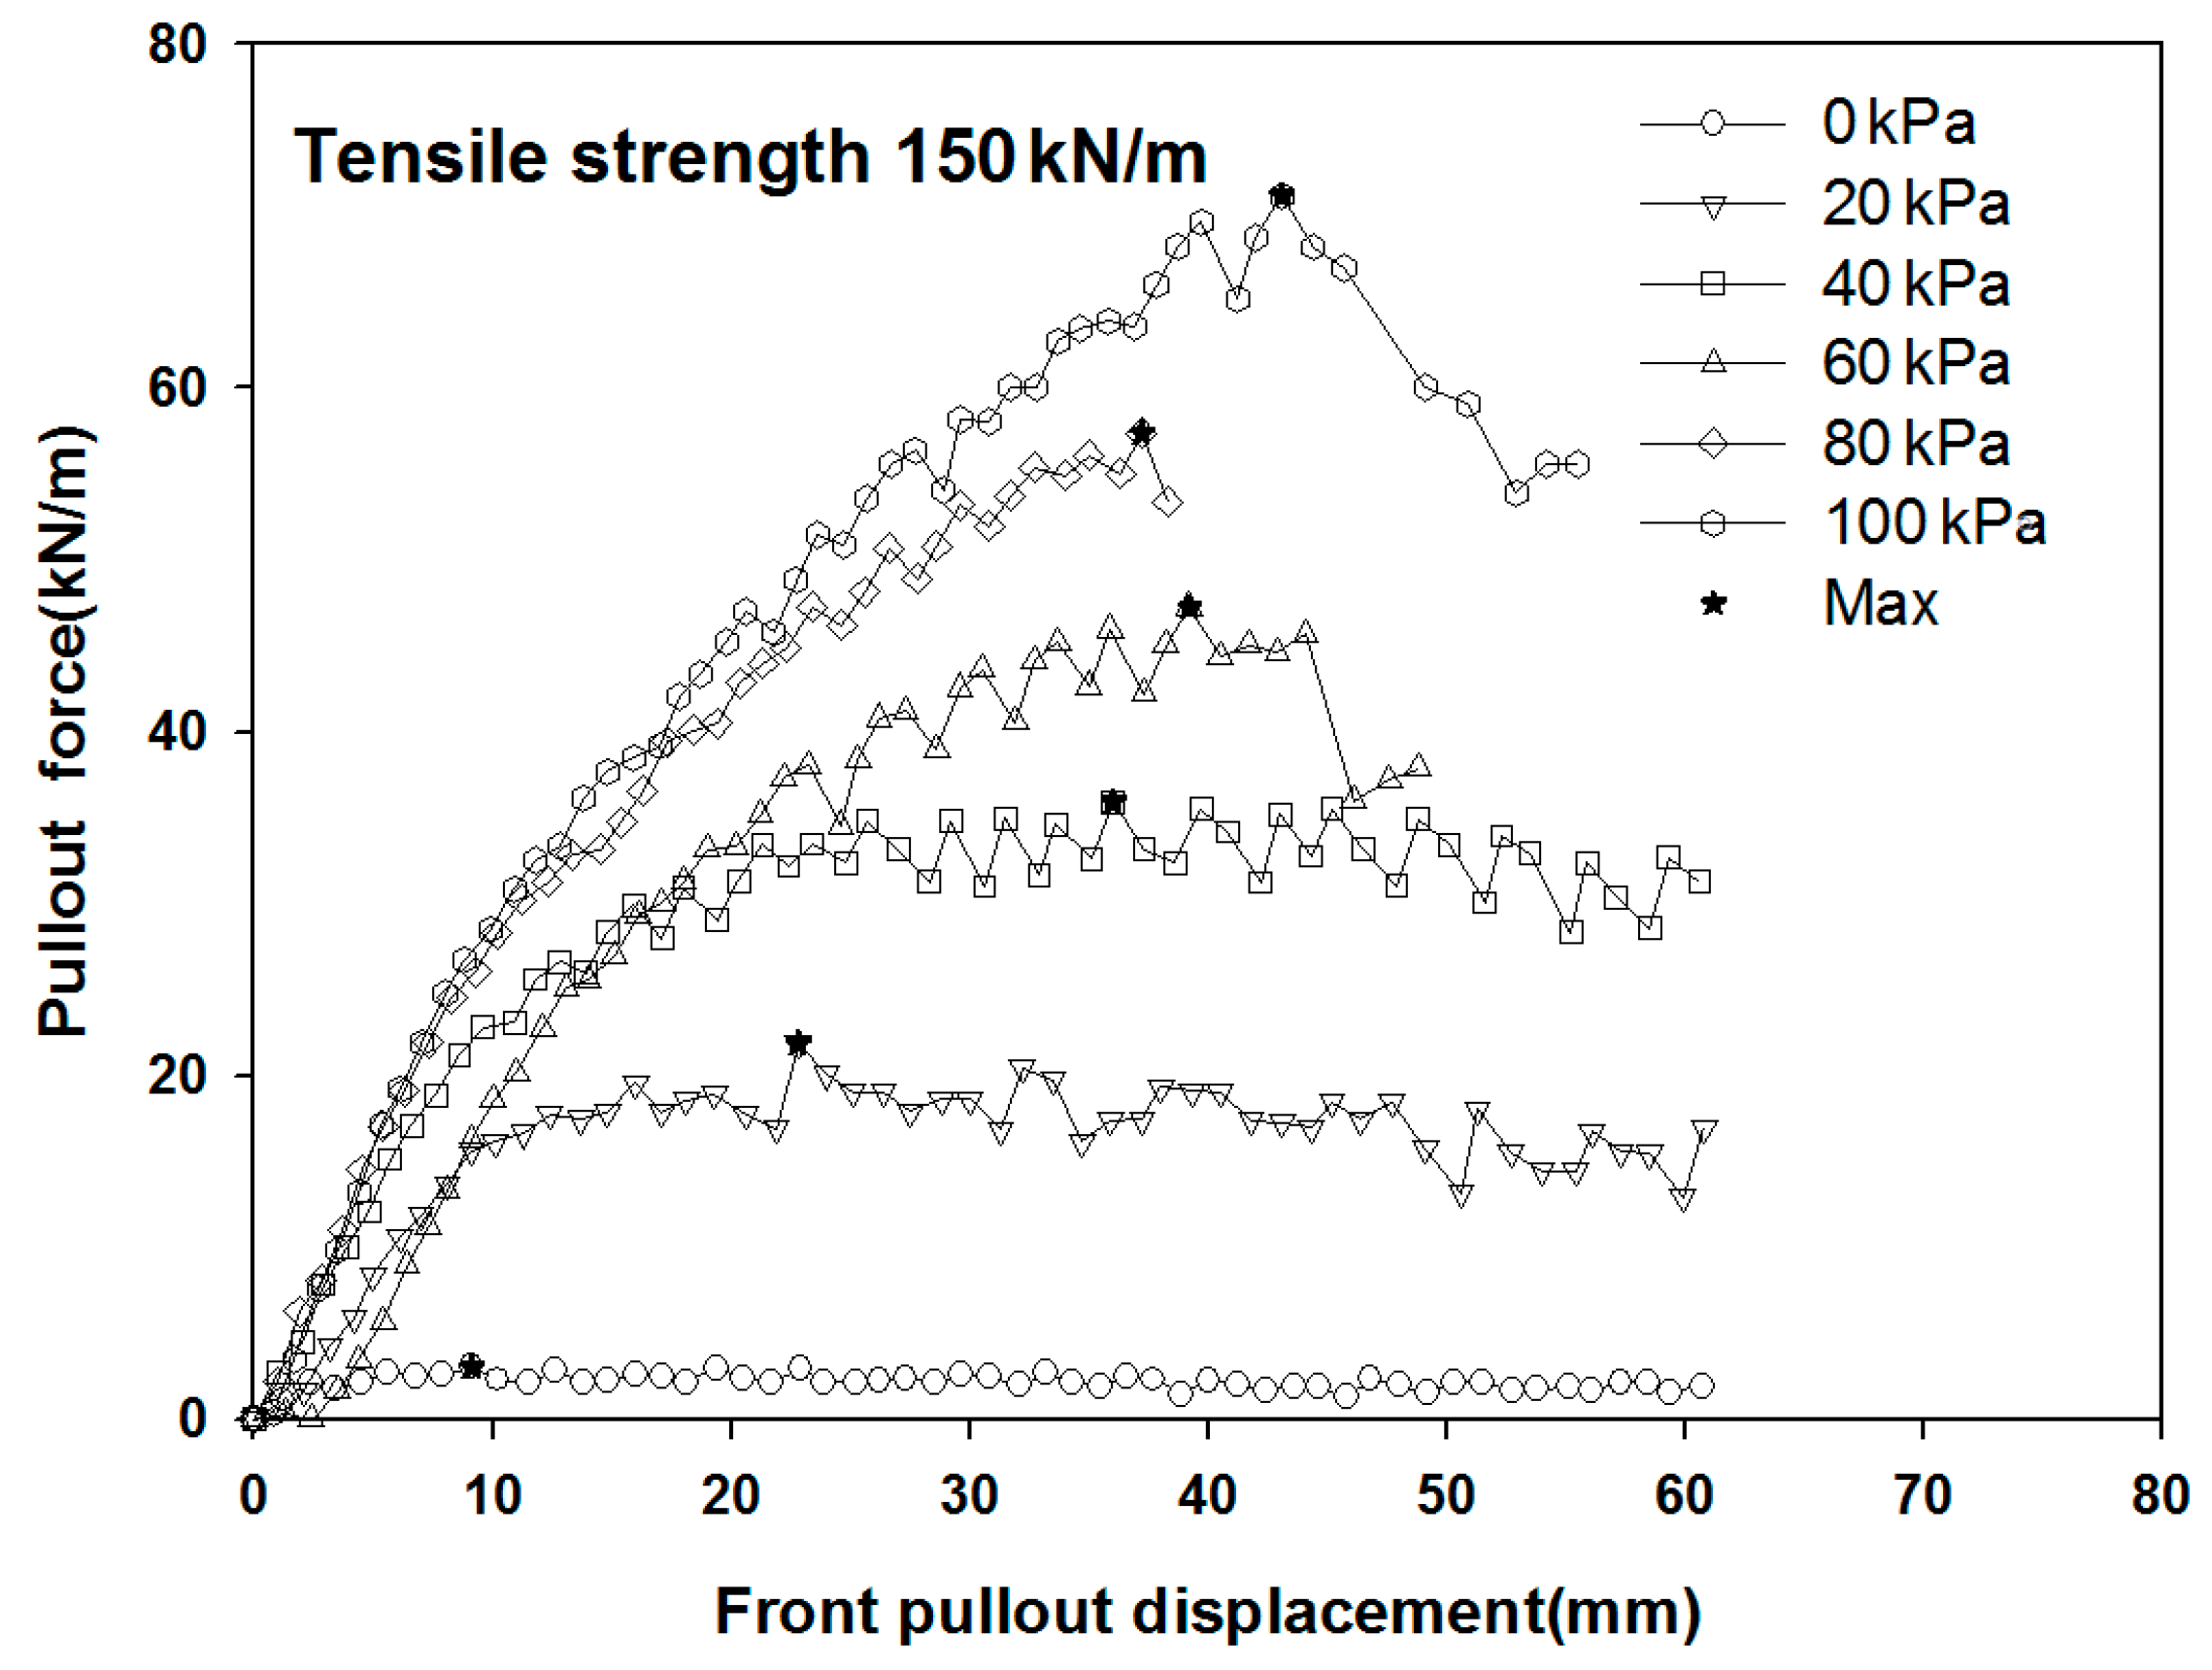
g) of 60 kN/m, 100 kN/m and 150 kN/m of the geogrid reinforcement, respectively. With the reinforcement tensile strength of 60 kN/m, the confining stress was 0 (self-weight), 10, 20, 30, 40 and 60 kPa. With the reinforcement tensile strength of 100 kN/m and 150 kN/m, the confining stress was 0 (self-weight), 20, 40, 60, 80 and 100 kPa. In the figures, ★ denotes the maximum pullout force.
The reinforcement used in this study was a geogrid, which can experience reinforcement displacement, damage and rupture depending on the pullout force. After finishing the pullout test, the nodal displacement of the geogrid and the reinforcement were examined to observe reinforcement damages. No reinforcement damage was found after finishing the test. The pullout test showed that the pullout force increased as the front-end pullout displacement and the confining stress increased with the reinforcement tensile strength of 60 kN/m. Constant pullout force was shown while the reinforcement was pulled out with the confining stress of 0 (self-weight), 10 and 20 kPa. This implies that significant pullout resistance was exerted even with a small confining stress. Reinforcement rupture occurred with the confining stresses of 30, 40 and 60 kPa. Reinforcement rupture occurred with a relatively small reinforcement tensile strength and increasing confining stresses to result in great tensile force acting on the front side. The measured maximum pullout forces were constant, i.e., 20.3, 18.1, and 19.7 kN/m, respectively, with the confining stresses of 30, 40 and 60 kPa at which reinforcement rupture occurred.
The pullout test for a reinforcement with tensile strength of 60 kN/m revealed that the maximum pullout force of 17.3 kN/m with the confining stress of 20 kPa (having enough pullout) was not much different from the maximum pullout force with rupture at higher confining stresses. With a small reinforcement tensile strength, the confining stress had great influence, and the confining stress-causing rupture was smaller.
Meanwhile, with the reinforcement tensile strength of 100 kN/m and 150 kN/m, the pullout test revealed that the pullout force also increased as the front-end pullout displacement and the confining stress increased. With the confining stresses of 0 (self-weight), 20 and 40 kPa, it was shown that the pullout force remained constant while the reinforcement was pulled out. This implies that enough pullout resistance was exerted with smaller confining stresses. With the confining stresses of 60, 80 and 100 kPa, reinforcement rupture occurred. This implies that relatively smaller reinforcement strengths and increasing confining stresses produced great tensile force acting on the front side to cause rupture. With the reinforcement tensile strength of 100 kN/m, the measured maximum pullout forces were 32.9, 34.6 and 33.4 kN/m, with the confining stresses of 60, 80 and 100 kPa, respectively, the latter at which reinforcement rupture occurred. This was 165% more than the case of the reinforcement strength of 60 kN/m. As a result, with the reinforcement tensile strength of 60 kN/m and 100 kN/m, the maximum pullout force with reinforcement rupture was constant, and reinforcement rupture occurred with the pullout strength which was one-third of the reinforcement strength.
In particular, with the reinforcement tensile strength of 150 kN/m, the maximum pullout force with reinforcement rupture also increased as the vertical stress increased. With the reinforcement tensile strengths of 60 kN/m and 100 kN/m, reinforcement rupture occurred for the pullout force greater than a given maximum pullout force, but the maximum pullout force was different depending on the vertical stress for the case of 150 kN/m. Reinforcement rupture occurred at least 30 min after starting the pullout test. Such a pullout test result illustrates that the scale of pullout force is different, which the reinforcement could bear during pullout depending on reinforcement tensile strengths.
4.2. Pullout Parameters Depending on Reinforcement Strength
4.2.1. Pullout Parameters of Reinforcement Tensile Strength of 60 kN/m
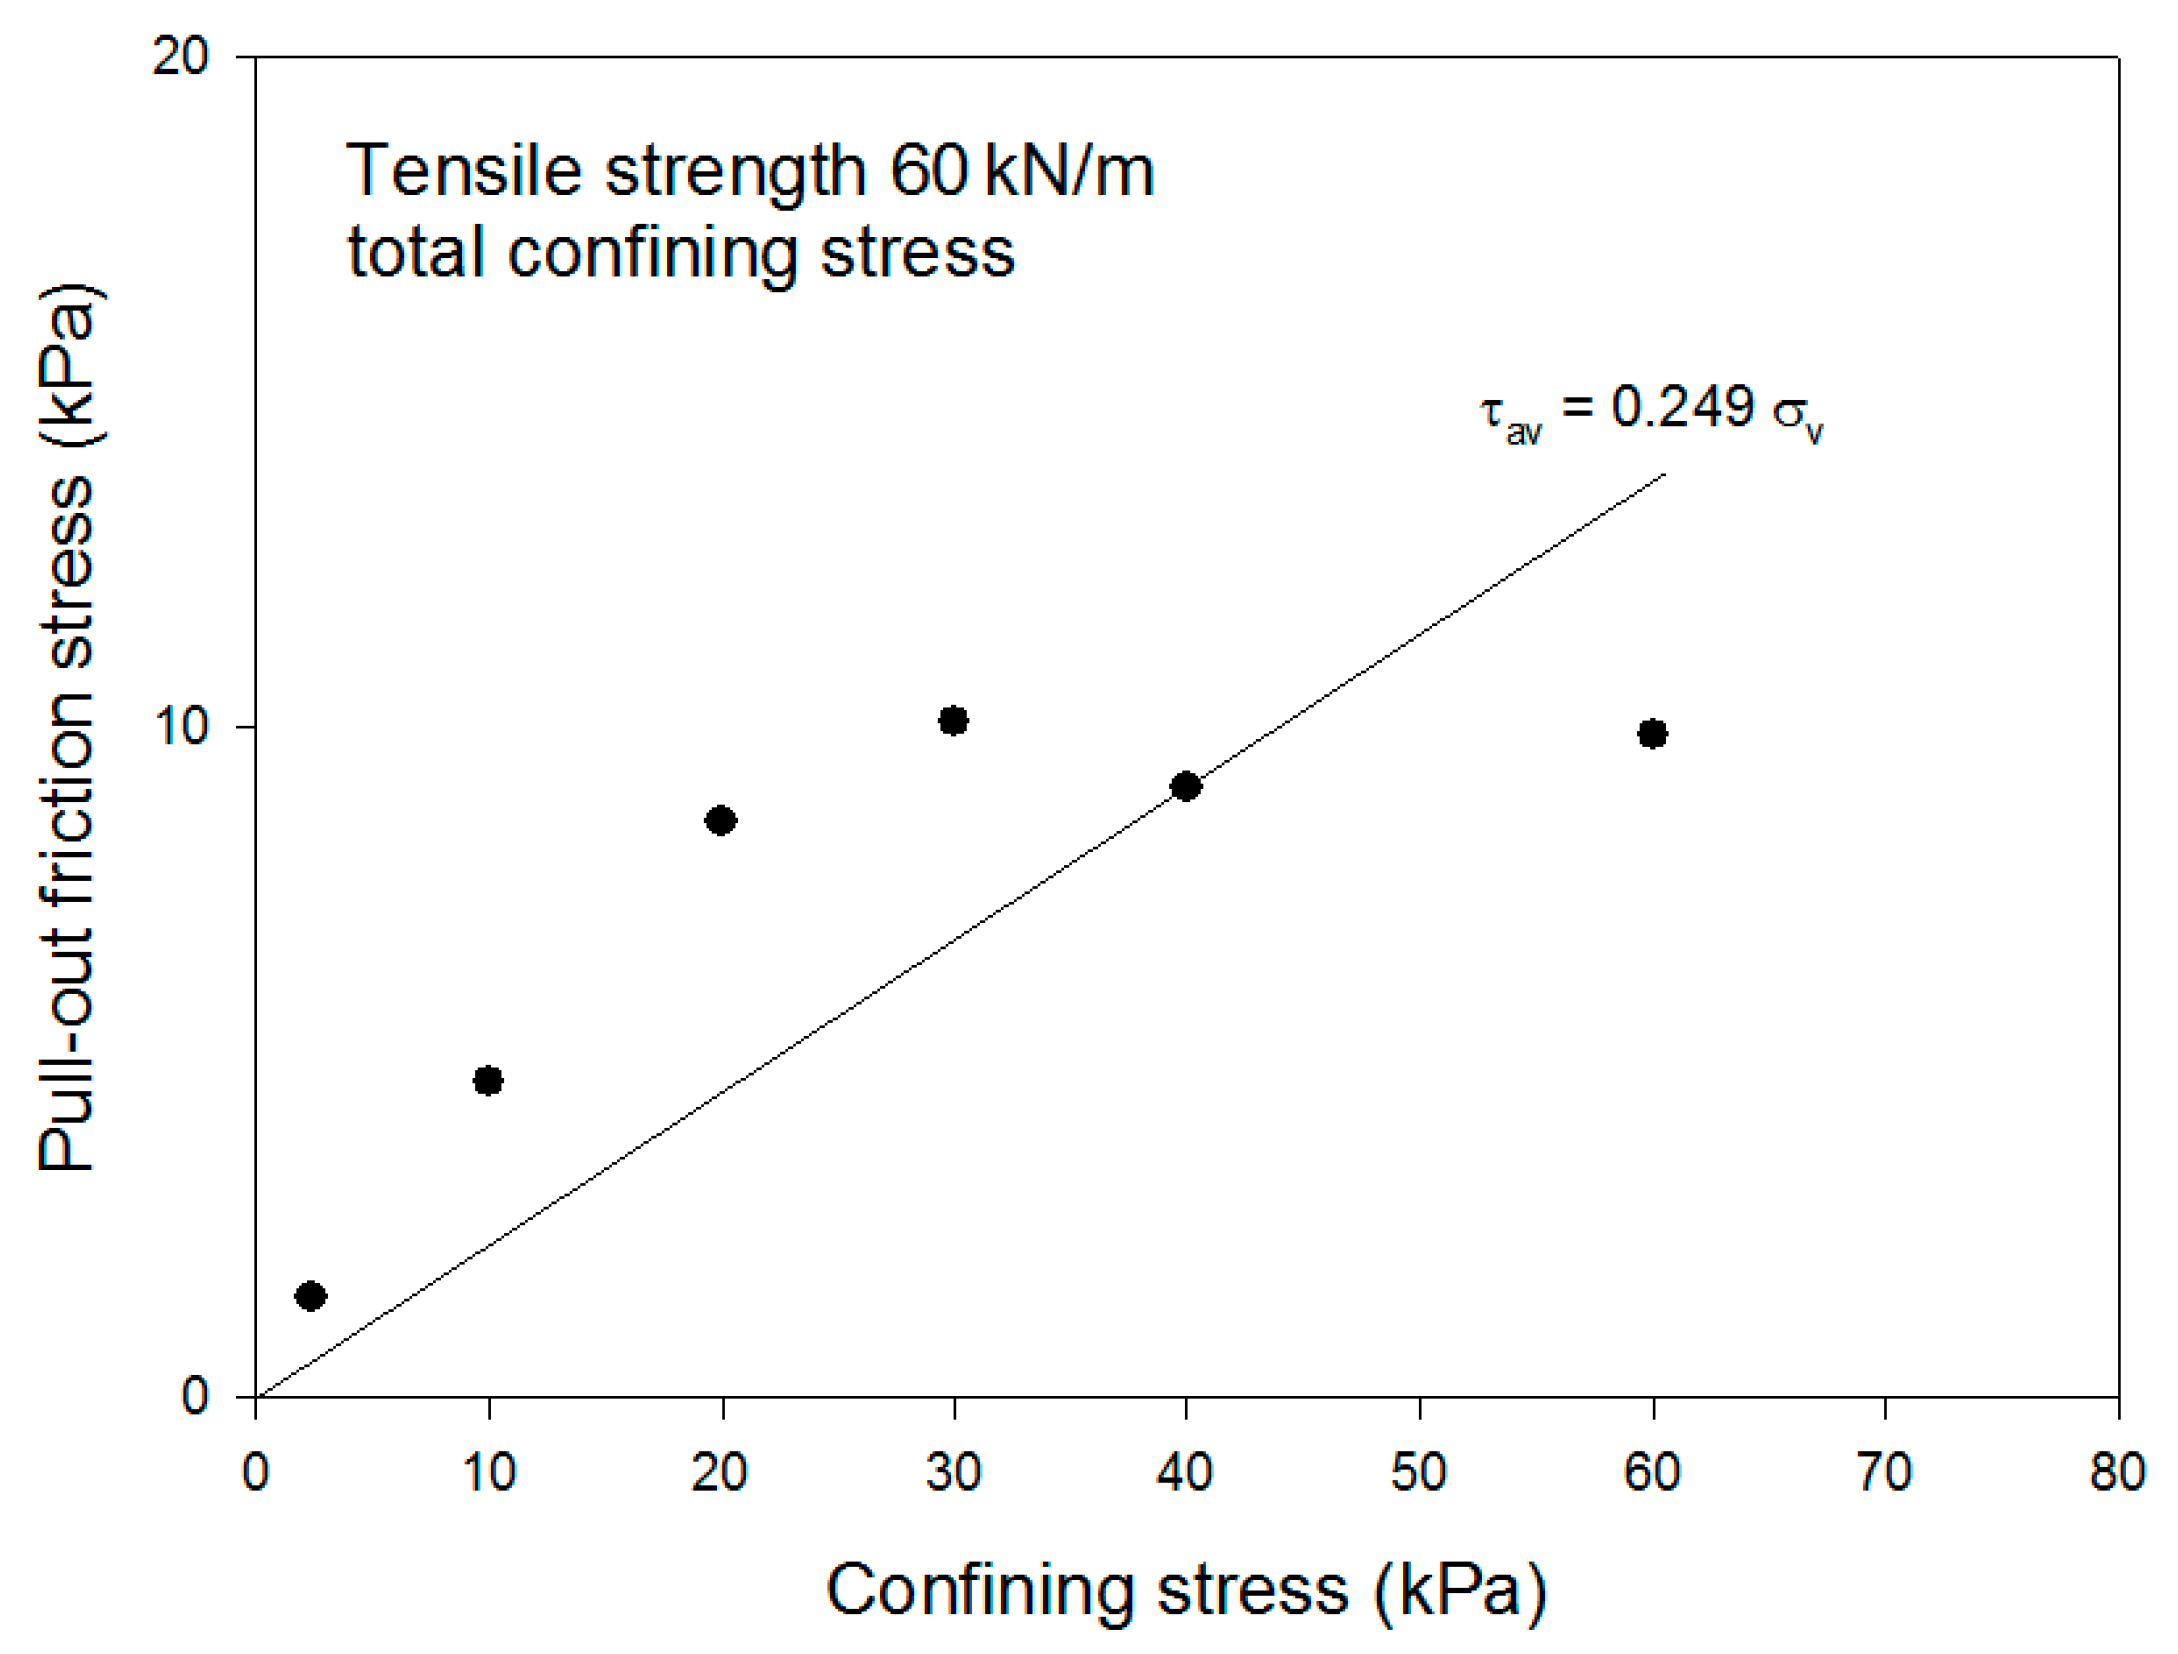
Figure 8 and
Figure 9 show the relationship between a confining stress and an average pullout stress when a geogrid reinforcement with the tensile strength of 60 kN/m was used. Here, the average pullout stress was obtained by using the whole area method, and the pullout frictional angle was calculated by using the relationship curve. The straight line gradient in the relationship curve corresponds to the pullout frictional angle, and the pullout adhesion corresponds to “0” with the sandy soil ground of Jumunjin standard sand.
Figure 8 shows the relationship between the total confining stress and the average pullout stress obtained through the pullout test to find pullout frictional angles.
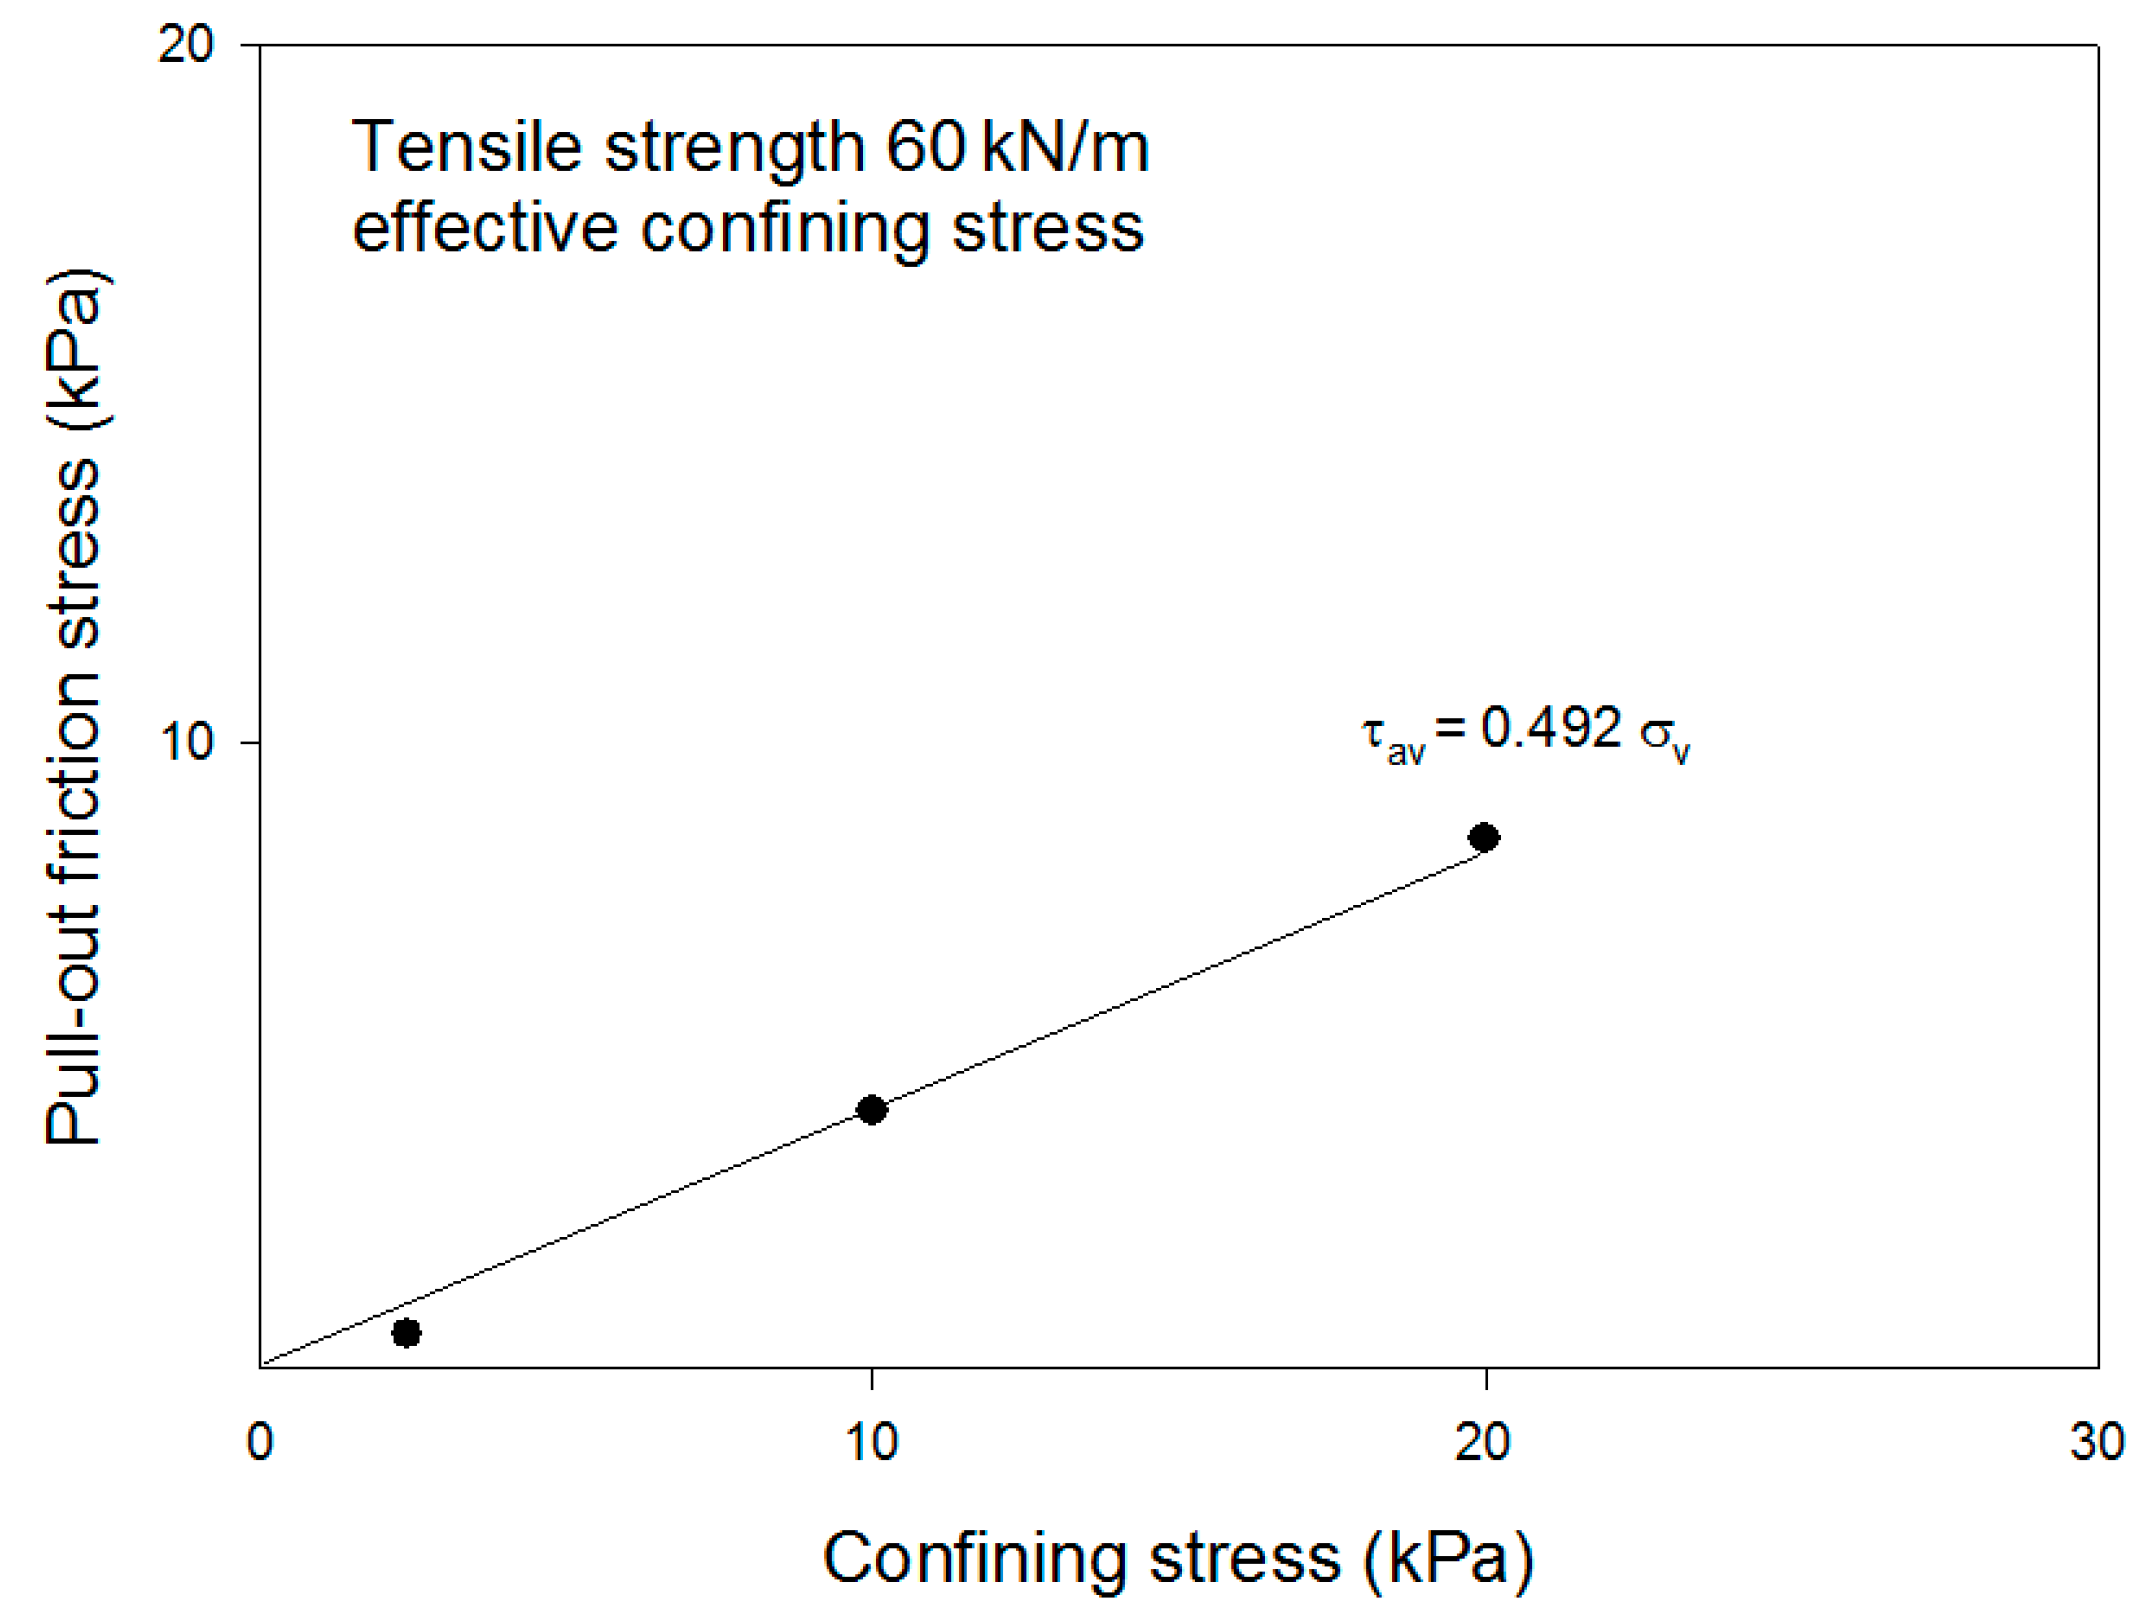
Figure 9 shows the relationship between an effective confining stress and an average pullout stress with the reinforcement pulled out in the pullout test to find pullout frictional angles.
The pullout frictional angle was measured to be 13.99° by to the total confining stress and the average pullout stress.
In the pullout test, the effective confining stress was selected from the confining stresses of 0 kPa, 10 kPa and 20 kPa, at which no reinforcement rupture occurred, and the whole area of the reinforcement was pulled out.
The graph gradient of the effective confining stress and the average pullout stress was 0.492 and the measured pullout frictional angle was 26.17°. While using the total confining stress, the measured pullout frictional angle was smaller than the pullout frictional angle by the effective confining stress method.
This implies that the used total confining stress includes the confining stress at which reinforcement rupture occurs. The maximum pullout force resisted by the reinforcement was constant, but the confining stress just increased, therefore the gradient of the pullout frictional angle decreased and contributed to decreasing the pullout frictional angle.
4.2.2. Pullout Parameters of Reinforcement Tensile Strength of 100 kN/m
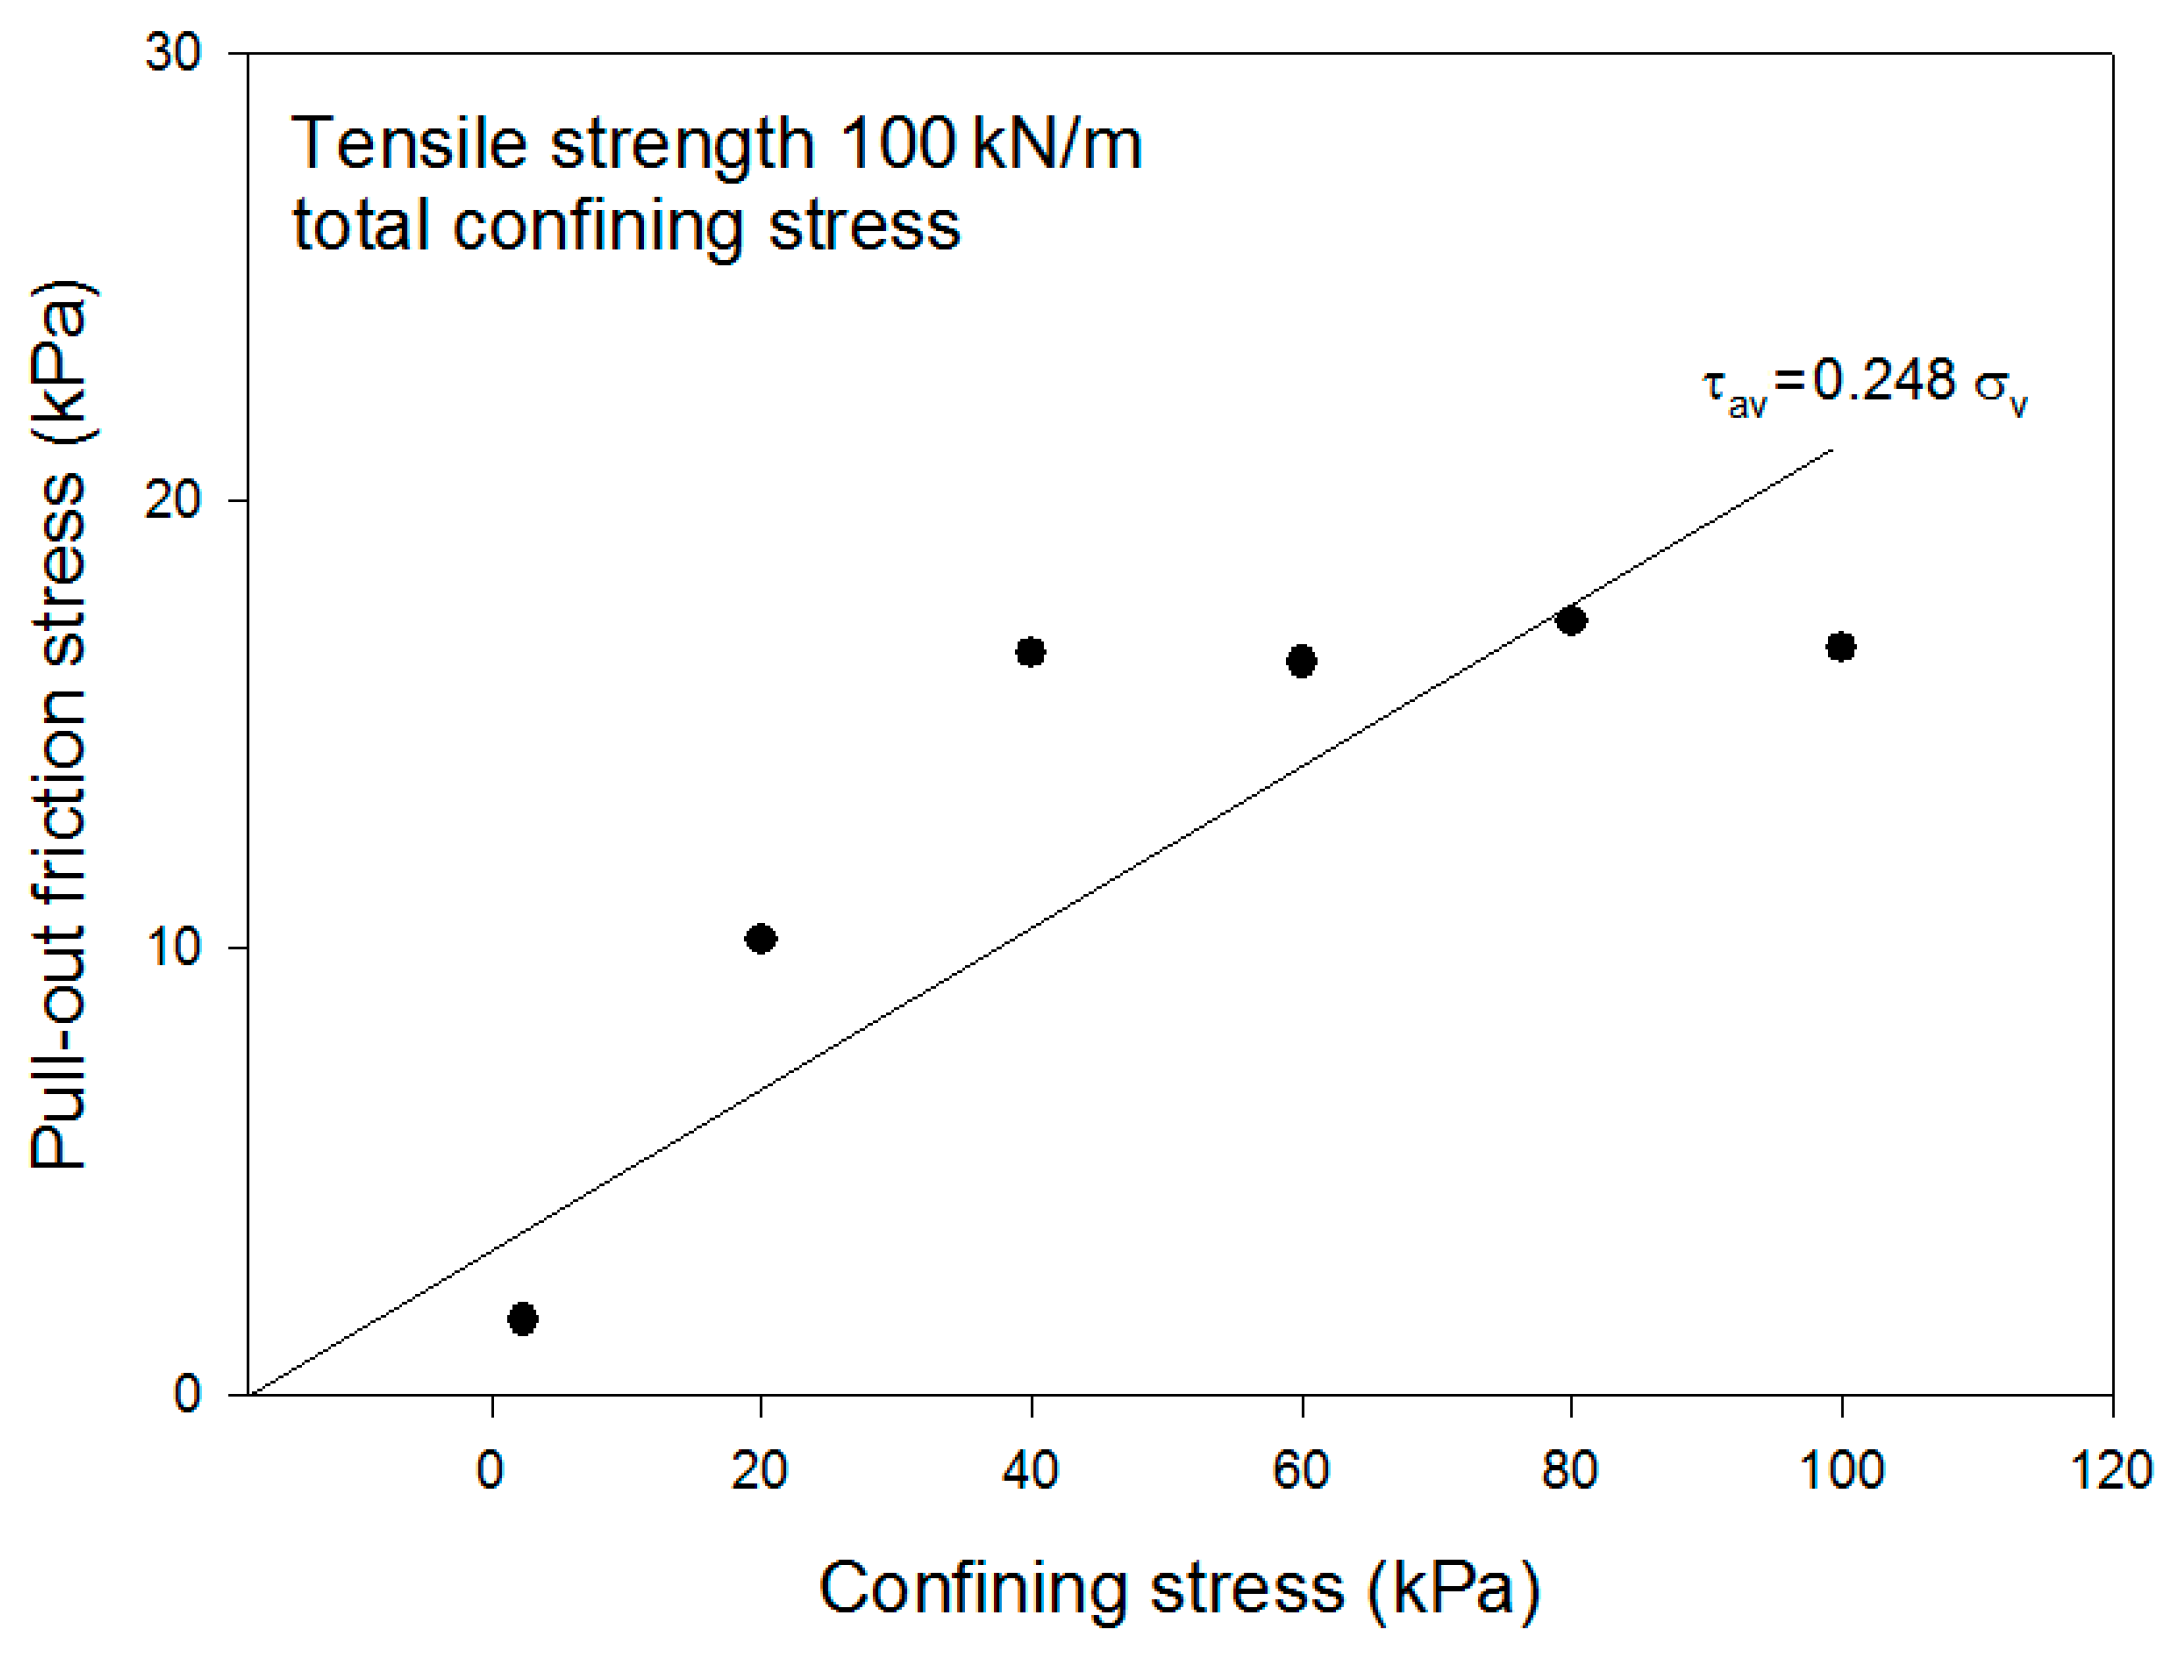
Figure 10 and
Figure 11 show the relationship between the confining stress and the average pullout stress while using a geogrid reinforcement with the tensile strength of 100 kN/m.
The measured pullout frictional angle was 13.94° by the total confining stress and the average pullout stress.
As with the tensile strength of 60 kN/m in the pullout test, the confining stresses of 0 kPa (self-weight), 20 kPa and 40 kPa were selected as effective confining stresses at which no reinforcement rupture occurred, and the entire area of the reinforcement was pulled out. The gradient of the graph for the effective confining stress and the average pullout stress was 0.484, and the pullout frictional angle was 25.81°.
In particular, it was observed that the confining stress caused rupture which was greater than the reinforcement tensile strength of 60 kN/m, and the maximum pullout force the reinforcement could withstand increased as the reinforcement tensile strength increased, resulting in the confining stress causing rupture to be greater. It was thus determined that selecting a confining stress and conducting the pullout test depending on the reinforcement tensile strength is an influence factor very important in the pullout test.
4.2.3. Pullout Parameters of Reinforcement Tensile Strength of 150 kN/m
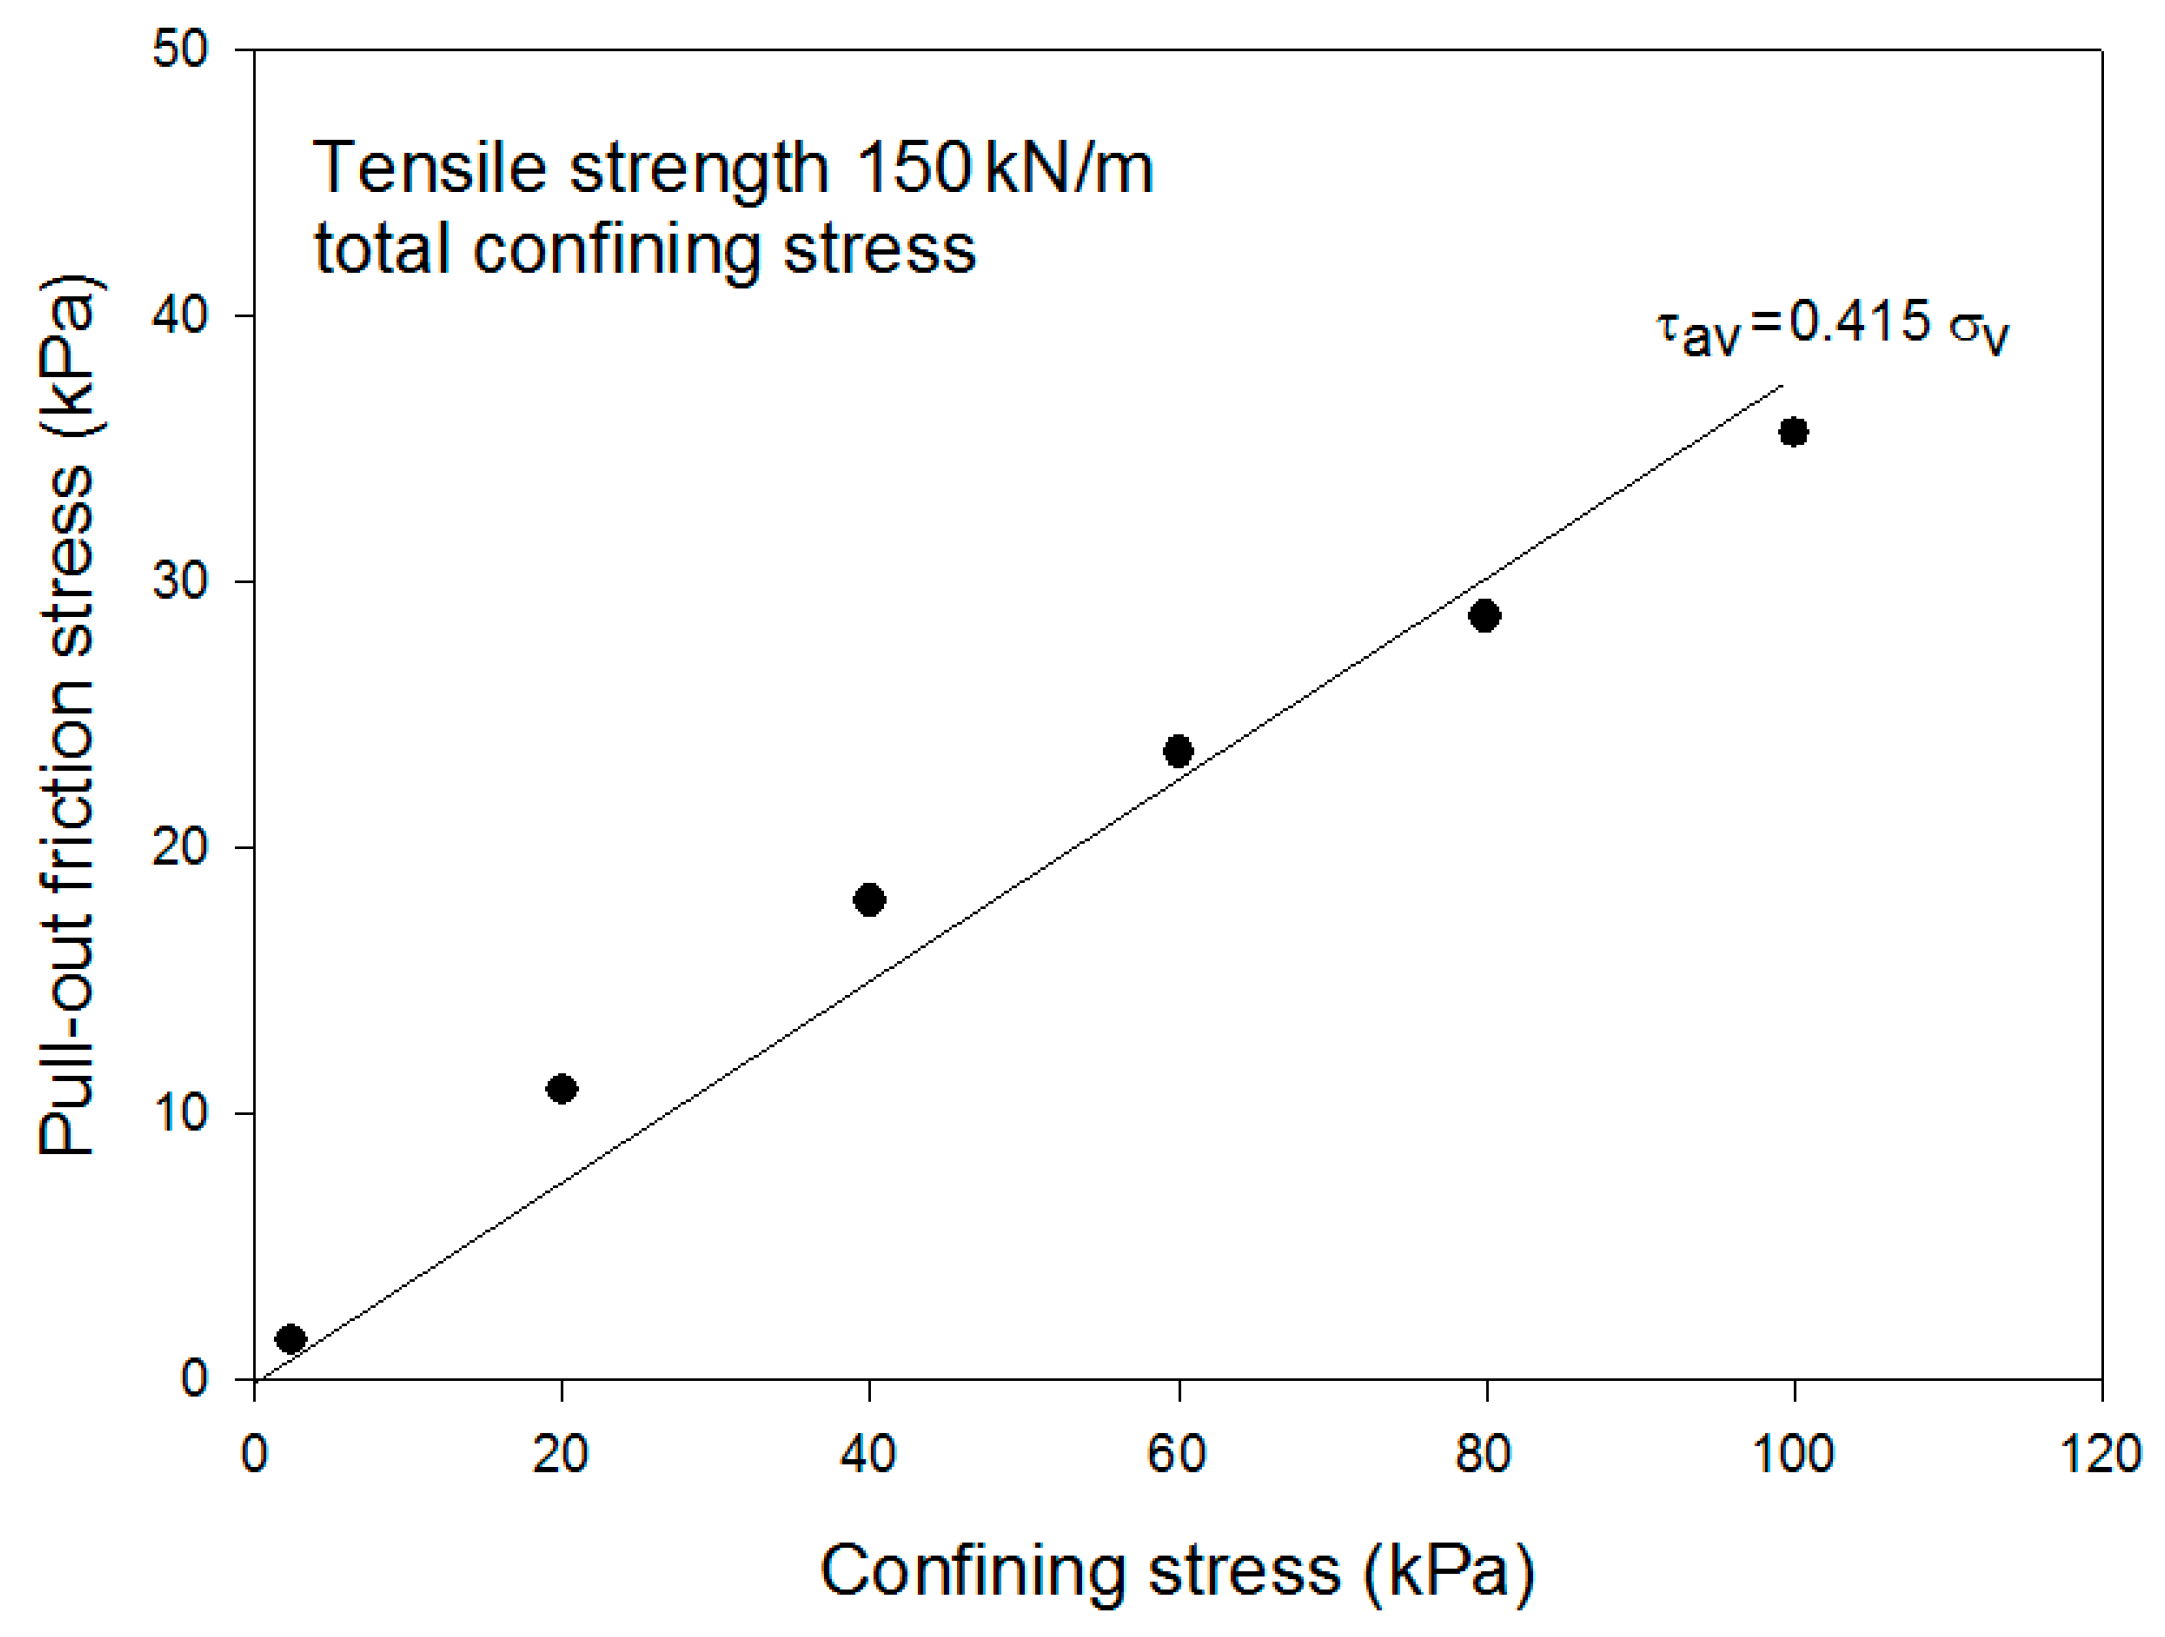
Figure 12 and
Figure 13 show the relationship between the confining stress and the average pullout stress while using a geogrid reinforcement with the tensile strength of 150 kN/m.
With the reinforcement tensile strength of 150 kN/m, it was observed that the reinforcement pullout resistance strength was also greater, and the measured pullout frictional angle was 22.53° in the graph for the total confining stress and the average pullout stress. While no reinforcement rupture occurred in the pullout test and the whole area of the reinforcement was pulled out, the gradient of the graph for the confining stresses of 0 kPa (self-weight), 20 kPa and 40 kPa, the average pullout stress was 0.521, and the pullout frictional angle was 27.52°.
As described above, with the total confining stress, the pullout frictional angle was measured to be smaller than the case of the reinforcement pulled out in the pullout test. This is because the ruptured reinforcement in the pullout test contributes to causing insufficient pullout frictional properties to develop, although the reinforcement was fully pulled out to maximize the development of pullout behavioral properties between the reinforcement and the soil.
4.3. Pullout Behavior Properties Depending on Reinforcement Strength and Confining Stress
The pullout test result revealed that the pullout frictional angle tended to be similar, although the confining stress was different between one geogrid reinforcement with the tensile strength of 60 kN/m and the other geogrid reinforcement with the tensile strength of 100 kN/m. In the effective confining stress pullout test in which the reinforcement was fully pulled out to show well-developed pullout characteristics, the pullout frictional angle of the reinforcement with the tensile strength of 0 kN/m was 26.17°, and the pullout frictional angle of the reinforcement with the tensile strength of 100 kN/m was 25.81°. This is a small pullout frictional angle difference. Meanwhile, for the pullout frictional angle in the graph for the total confining stress and the average pullout stress, the pullout frictional angle of the reinforcement with the tensile strength of 60 kN/m was 13.99°, and the pullout frictional angle of the reinforcement with the tensile strength of 100 kN/m was 13.94°, implying similar pullout frictional angles.
Moreover, the internal displacement was measured to be very similar for the reinforcements with the tensile strengths of 60 kN/m and 100 kN/m. Although the confining stress was different, much displacement occurred at point No.1 (
Figure 4) and no displacement occurred at points No.2, 3, 4, 5 and 6, in some cases when reinforcement rupture occurred. It is considered that this describes the reason for the similar measured pullout frictional angles for the reinforcements with the tensile strengths of 60 kN/m and 100 kN/m.
For the reinforcement with the tensile strength of 150 kN/m, the measured pullout frictional angle was 22.53° in the graph for the total confining stress and the average pullout stress. The measured pullout frictional angle was 27.52 of 150 kN/m, the measured pullout test in which the reinforcement was fully pulled out and the pullout characteristics were well developed. For the reinforcement with the tensile strength of 150 kN/m, internal nodal displacement occurred in all nodes even when reinforcement rupture occurred. This tendency with the tensile strength of 150 kN/m was different from that with the tensile strengths of 60 kN/m and 100 kN/m. As the confining stress increased, although nodal displacement decreased, displacement did occur at all the nodes. This is because the pullout friction took place between the reinforcement and the soil in the pullout test. As a result, the pullout frictional angle of total stress for the reinforcements with the tensile strength of 150 kN/m was measured to be approximately 8.0° greater than the pullout frictional angle for the reinforcements with the tensile strengths of 60 kN/m and 100 kN/m.
In measuring the pullout frictional angle with the total confining stress, a great difference between pullout frictional angles was found because of reinforcement rupture in the confining stress after developing the maximum pullout force depending on the reinforcement tensile strength. However, in measuring the pullout frictional angle by means of the effective confining stress, the pullout frictional angles were not much different. Therefore, because the effective confining stress method could obtain similar pullout parameters for reinforcements with different tensile strengths, using the effective confining stress and measuring the pullout frictional angle is a method for selecting practical pullout parameters. That is, the measured effective confining stress was a vertical stress smaller than one-half of the reinforcement tensile strength in the pullout test.
As described above, a geogrid reinforcement was used to conduct the pullout test depending on the reinforcement tensile strength and the confining stress. Ochiai et al. [
17] suggested the use of the whole area method at a low confining stress for field applications, and Scholsser and Elias [
12] insisted that should reach a constant value with the surface load not smaller than 80 kPa. Moreover, Hayashi et al. [
20] reported that it is desirable to apply a vertical stress not greater than 80 kPa to prevent overrated pullout resistance, because the pullout resistance is different depending on the increase/decrease in dilatancy in shear progress for the effect of dilatancy. Koutsourais et al. [
21] reported that the pullout resistance was evaluated approximately 13% to 17% more than the internal frictional force of soil at low confining pressure (<4 psi).
Studies by some researchers (McGown et al. [
22]; Yuan et al. [
23]) have shown that the secant modulus and the ultimate strength generally increases in the strain of 5% of the geogrid for civil engineering applications as the confining stress increases. The volume of increase is slightly different depending on the type of geogrid for civil engineering applications, but a great increase up to more than 400% has also been reported.
As described above, the confining stress has great influence on the pullout test, and, in particular, influences of dilatancy on friction can be greater at low stress than at high stress; dilatancy highly depends on the scale of reinforcement confining stress. Therefore, because the pullout parameters are different depending on the scale of confining stress, the confining stress conditions which help pullout characteristics fully develop between the soil and the reinforcement can be an important influential factor in the pullout test. In particular, in grid-type reinforcements (geogrids, for example), great rib resistance in the direction parallel with the pullout direction of the geogrid for civil engineering applications will develop as a pullout behavior in reinforcement pullout at a low confining stress thereof.
Table 4 illustrates pullout frictional angles depending on the reinforcement strength and the confining stress. There is a difference between the pullout frictional angles obtained by using the total confining stress and those obtained by using the effective confining stress. Designing a reinforcement with pullout frictional angles by using the total confining stress can result in unconservative design, therefore using the pullout frictional angles together with the effective confining stress is a more effective evaluation method.


