1. Introduction
Severe motor vehicle crashes are one of the most frequent traumas experienced in the United States (US) [
1]. In 2018, the number of motor vehicle crashes exceeded 6.7 million in the US and about 2.7 million people reported injuries in the traffic accidents [
2]. According to a National Institute of Mental Health (NIMH) study, about 39% of the motor vehicle accident (MVA) survivors met DSM-III-R criteria for post-traumatic stress disorder (PTSD). Patients with PTSD often experience disabling memories and anxiety related to the car accident event, and are likely to be subjectively distressed by environmental conditions with increased impairment in daily performance, such as commuting to work or driving a car for pleasure [
3]. The type of PTSD that is caused by MVAs is known as a driving phobia disorder. Driving phobia is very common and the level of fear may range from mild to severe. Some patients are only afraid of specific driving conditions, while some cannot bear to sit behind the steering wheel of a motor vehicle.
The adoption of VRET for PTSD treatments allows patients to be exposed to levels and scenarios of traumatic stimuli (or conditions) using sound, visual, and tactile immersions. The VRET approach follows the concept of systematic desensitization (SD), which is recognized in the field of clinical psychology for helping patients effectively overcome various phobia and anxiety disorders based on classical conditions. In some SD literature, VRET has been verified for being as effective as the traditional cognitive behavioral therapy (CBT) [
4]. Using VRET, patients interact with near-real virtual representations of traumatic stimuli and scenarios to help the reduction of fears gradually and effectively. Several preliminary studies have supported the effectiveness of using VRET for driving phobia disorder [
5,
6,
7], although these studies are largely case studies with qualitative perspectives. Nonetheless, the effects of VRET are confirmed to be significant when compared to traditional behavior therapy [
8]. This research presents a new verification process to measure the effectiveness of VRET for driving phobia disorders. This refined VRET system, a newly modified and improved version based on our previous research, integrates the collection of the subjects’ biodata via a control group-based experimental design. The in-depth biodata analysis collected from the VRET experiments, combined with the treatment group vs. control group survey analysis, is presented as the objective evidence of the VRET effectiveness.
The paper is organized in the following sections. In
Section 2, the literature review of VRET in the field of driving phobia treatment, self-measurement surveys related to driving behavior, and the patents related to VR driving applications are presented.
Section 3 depicts the methodologies and approaches applied and integrated in this research.
Section 4 presents the newly modified system architecture with the modules integrated to build the VRET platform for treating driving phobia disorders.
Section 5 presents the analyses of survey questionnaire results and subjects’ biodata during the VRET experiment. Statistical analyses, such as means and standard deviations of biodata and a one-way ANOVA are used to determine whether there are significant differences between biodata types (e.g., temperature, heart rate).
Section 6 summarizes the key findings and contributions of the research. The analytical results of VRET effectiveness for treating driving phobia and the future development required in the field are addressed in the final remarks.
2. Literature Review
Driving is considered to be an essential skill for individuals living in modern society, a skill which facilitates the maintenance of independence, mobility, enables engagement in important activities, and is often a requirement of employment. People who suffered from the psychological impairment of serious motor vehicle accidents account for the majority of patients with driving phobia. Other possible reasons that lead to driving phobia include patients that suffer from claustrophobia may have panic attack while driving on the highway or in a traffic jams, patients that know someone that experienced a terrible car accident, or lack of trust in their own driving skills [
9]. Based on the emotional processing theory [
10], VRET can lead to fresh and neutral memory structures that, if applied to PTSD patients properly, can diminish old and traumatic memories, such as a bad car crash that often provokes and heightens anxiety. An increasing number of scholars have conducted research in the field of VRET with a focus on driving phobia. One early study used VRET in the treatment of PTSD symptoms in the aftermath of a serious motor vehicle accident. Six individuals reported either full or severe subsyndromal PTSD and completed ten sessions of VRET using software designed to create real-time driving scenarios. The results indicated significant reductions in post-trauma symptoms involving reexperiencing, avoidance, and emotional numbing, and VRET was successfully used in the treatment of PTSD following road accidents [
5]. In one VRET plus cognitive behavioral therapy (CBT) for driving anxiety and aggression pilot study, six U.S. veterans who suffered from MVAs while serving in the military participated in the research. The study was a novel VRET + CBT for patients that integrated the anxiety and anger management components, although the sample size is very small (only six) [
6]. Each veteran completed eight intervention sessions, as well as six to nine months follow-up assessments. At the end of the experiment, their hyperarousal in driving situations declined by 69%, aggressive driving declined by 29%, and risky driving declined by 21% [
6]. In a pilot study adopting VRET [
7], fourteen subjects with severe driving phobia disorders participated in psychotherapeutic, VRET, CBT sessions, and behavioral avoidance tests (BAT) when driving on the road. The treatment design placed the subjects under 10 days of therapeutic experiments. After the six to twelve weeks follow-up after experiments, thirteen out of fourteen patients maintained effective treatment results [
7]. Although this was a pilot study, the experiment design and procedure provide a good reference to the future VRET clinical studies.
In our previous study [
11], the research team conducted a pre-test experiment to examine the systematic design and development of a prototype VRET for driving phobia disorders. A VR headset, a realistic steering wheel (with foot pedals for acceleration and braking), IoT sensors for collecting biodata for analysis, and VR software for controlling hardware and driving themes were integrated to develop different fear levels for VRET-generated driving conditions. The subjects provided pre-test data for the system evaluation and biodata were collected from the experiments. Through pre-test data analysis, VR scenarios convincingly cause anxiety-like reactions similar to actual driving. Some systemic issues were discovered for future refinement. Thus, this sequel research is designated to correct, improve, and verify the effectiveness of the VRET system design [
11].
A self-measurement survey is commonly used to evaluate a potential subject’s degree of anxiety. Researchers have applied different questionnaires to investigate subjects’ anxiousness under specific driving situations. One research study used a driving behavior survey to measure which driving situation made the driver nervous, anxious, tense, or uncomfortable. Factor analytic techniques identified three dimensions of maladaptive behaviors across three college samples: anxiety-based performance deficits, exaggerated safety/caution behavior, and anxiety-related hostile/aggressive behavior, with a total of 21 questions using a 7-point Likert scale that ranges from 1 (never) to 7 (always) [
12]. In another anxiety related avoidance study, a scale was designed to assess avoidance behavior for various driving and riding situations. The twenty questions are rated for frequency of avoidance over a specific time period on a 4-point Likert scale that ranges from 0 (= avoid rarely or none of the time) to 4 (= avoid most or all the time) [
13]. The scale also measured drivers’ anxiousness under specific driving situations and included additional self-measurement surveys for specific driving environments. Following the self-efficacy scale guidelines, questions are designed to measure subjective units of distress and the drivers’ degree of confidence while driving under seven different conditions, including neighborhood blocks, residential areas, downtown streets, main arterial roads, freeways, major city roads, and mountain roads, referring to related survey design in [
14].
In order to better understand the principles of VRET application for driving phobia, this research uses Derwent Innovation to collect patents applied by large companies for the treatment of driving phobia and analyzes the most current technologies as the basis for the development of the new research study. According to the results of the patent analysis, the top two companies are Magic Leap in the United States and LG Electronics in South Korea. Magic Leap is an augmented reality company. The patents related to VR are for augmented reality to construct a virtual image generation system. The Magic Leap patent uses an augmented reality platform to display images and world views into a headset worn by users [
15]. LG is a Korean enterprise and its business scope includes electronics, communication technology, home appliances, and chemistry. The patents from LG are related to the design of a VR headset with improved VR image quality. The LG patent describes a display device having multiple data lines, multiple gate lines, and multiple pixels arranged in a matrix where the data lines and the gate lines intersect. By controlling the display, the driver shifts the gate signals, which improves the virtual reality display image quality and speed by minimizing data while reducing user fatigue [
16]. LG also has patents related to emotion recognition. The wearable device measures the user’s heart rate, skin temperature, respiratory volume, and blood pressure. The controller uses the data from the sensor to identify the user’s emotional state [
17]. A patent filed by the Korea University and Business Research Foundation describes a system that can measure the pressure and load level of PTSD patients by quantifying electroencephalography (EEG) and heart rate variability (HRV) while automatically adjusting the exposure intensity following patient response. This design uses personalized exposure treatment according to the patient’s anxiety so as to maximize the treatment effect [
18]. A stress disorder detection system for use in a VRET panic attack was developed by Blaubit Co. Ltd. The system detects a patient’s panic level by analyzing their behavioral data and provides appropriate treatment content according to their mental state [
19]. The patent applied by Qingdao Saibo Kaier Information Technology Co. describes a virtual reality treatment system for driving-related post-traumatic stress disorder. The system includes a head-mounted display for a virtual scene, a sound effect that matches the virtual scenes such as driving under different road conditions, and constant monitoring of the physiological data of the subjects. The virtual reality treatment system for driving-related post-traumatic stress disorder offers many advantages such as high safety of use, significant effect, strong controllability, and short treatment time [
20].
3. Methodology Applied in this Research
Driving phobia is a psychological anxiety disorder which effects the patient’s professional and social lives on a daily basis. Driving is as an essential skill and based on our encounters with patients with driving phobia symptoms visiting the psychiatry department, the focus of this research is to develop a clinical trial experiment of VRET that can be used to treat driving phobia disorders.
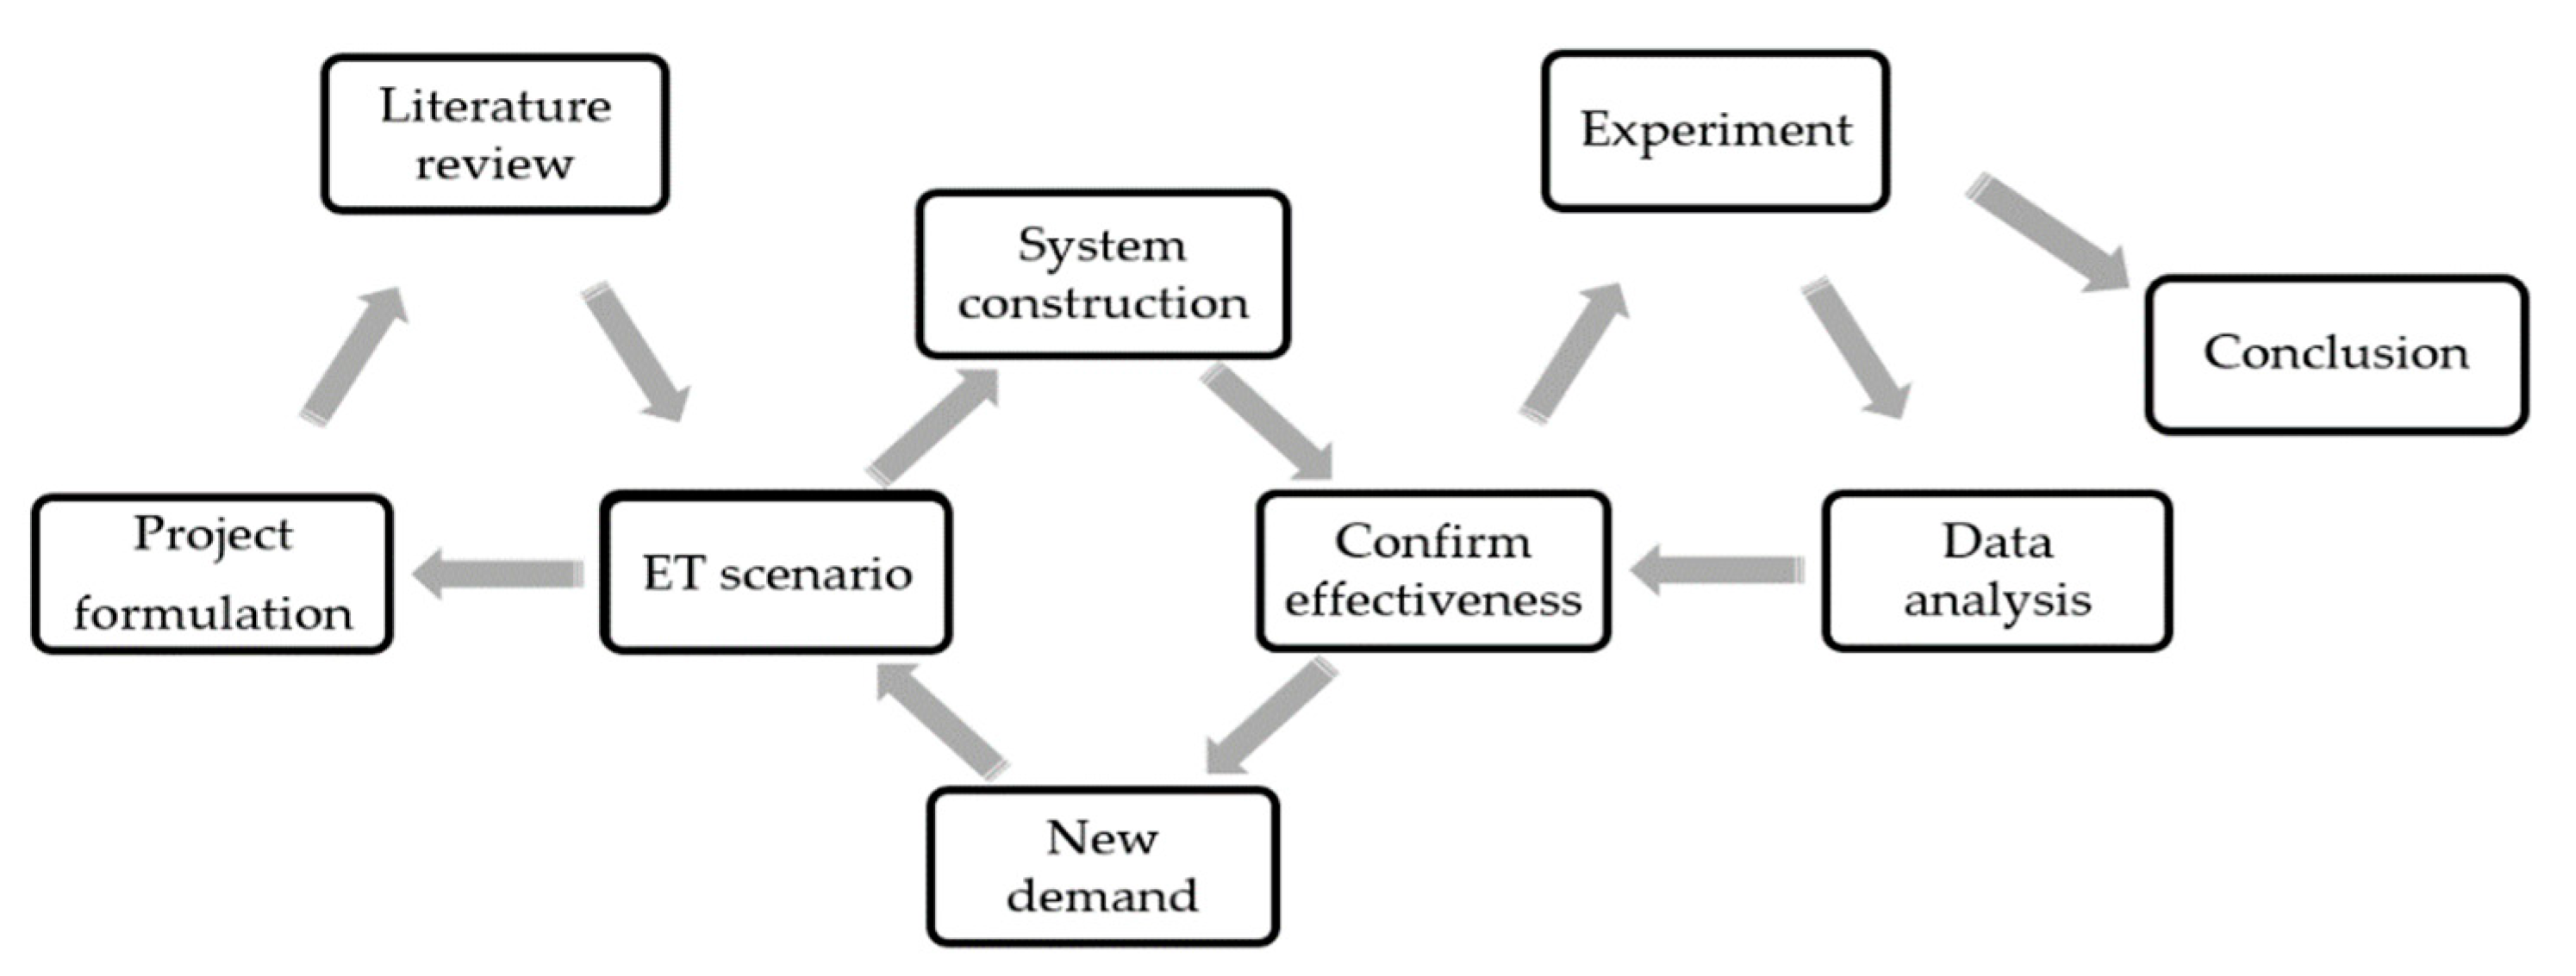
Figure 1 depicts the interactive process-flow for the driving phobia VRET research, development, clinical experiment, analysis, and system verification. The initial project formulation is to determine how to implement the research, perform the background literature review, and form hypothesized expected results. Previous research related to PTSD, driving phobia, and literature related to driving phobia VRET are reviewed prior to designing the VRET scenarios for treating driving phobia disorders. The proposed VRET is constructed to model different fear-level scenarios and can be used for clinical experiments. An iterative design modification and improvement processes is conducted to ensure the VRET system is effective and matches the needs of ethically and medically acceptable driving phobia treatments.
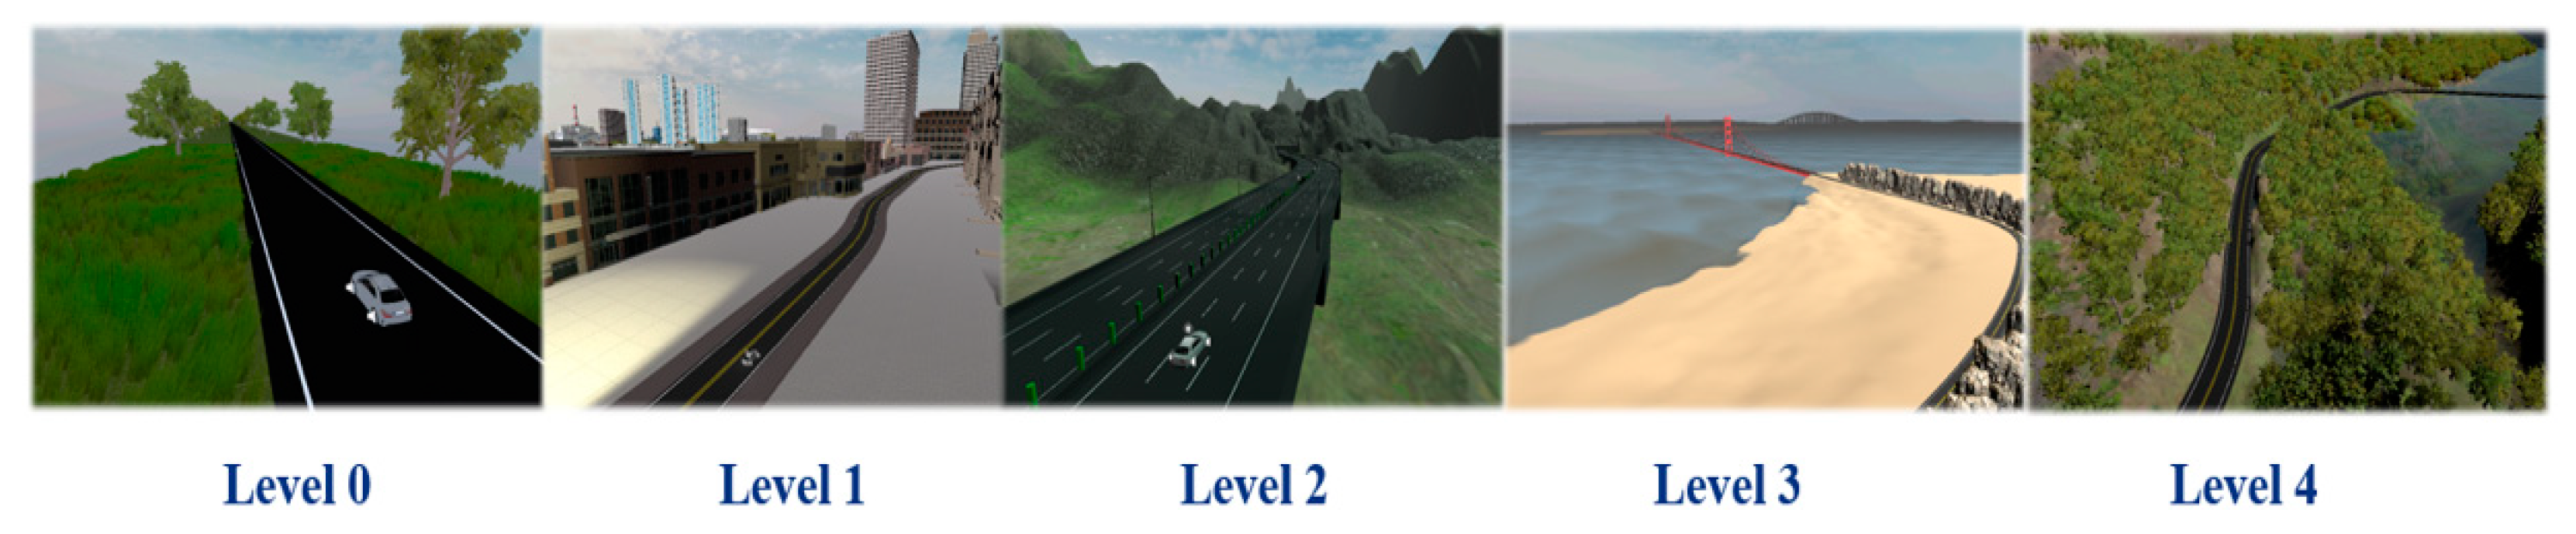
The VRET system includes level 0 for pre-experiment practice and levels 1 to 4 for actual implementation of scenarios as shown in
Figure 2 (5-level scenery descriptions) and
Figure 3 (scenery snapshots). Some patients experience extreme fear of car crashes and panic when pedestrians are present on the road and when there are large numbers of cars. Thus, the VRET excludes pedestrians and limits vehicles appearing in the opposite traffic lane. All of the simulated roads are in single route format, i.e., no splitting or intersection of multiple routes. Subjects drive for five minutes and are asked if they wish to advance to a higher level if the immersive driving environment is no longer challenging or fear inducing. Each level has its own virtual surrounding and scenery for treatment purposes. The details of the five levels (0~4) are described as follows:
- Level 0:
Driving on a straight wide road, the speed limit is set at 50 km/h.
- Level 1:
Driving in the city during the daytime, the speed limit is set at 50 km/h.
- Level 2:
Driving through a highway tunnel during the daytime, the speed limit is set at 110 km/h. Subjects will be asked to increase speed if lower than 80 km/h.
- Level 3:
Driving across a cross-water bridge and a tall bridge, the speed limit is set at 60 km/h.
- Level 4:
Driving on a mountain road at night, the speed limit is set at 50 km/h.
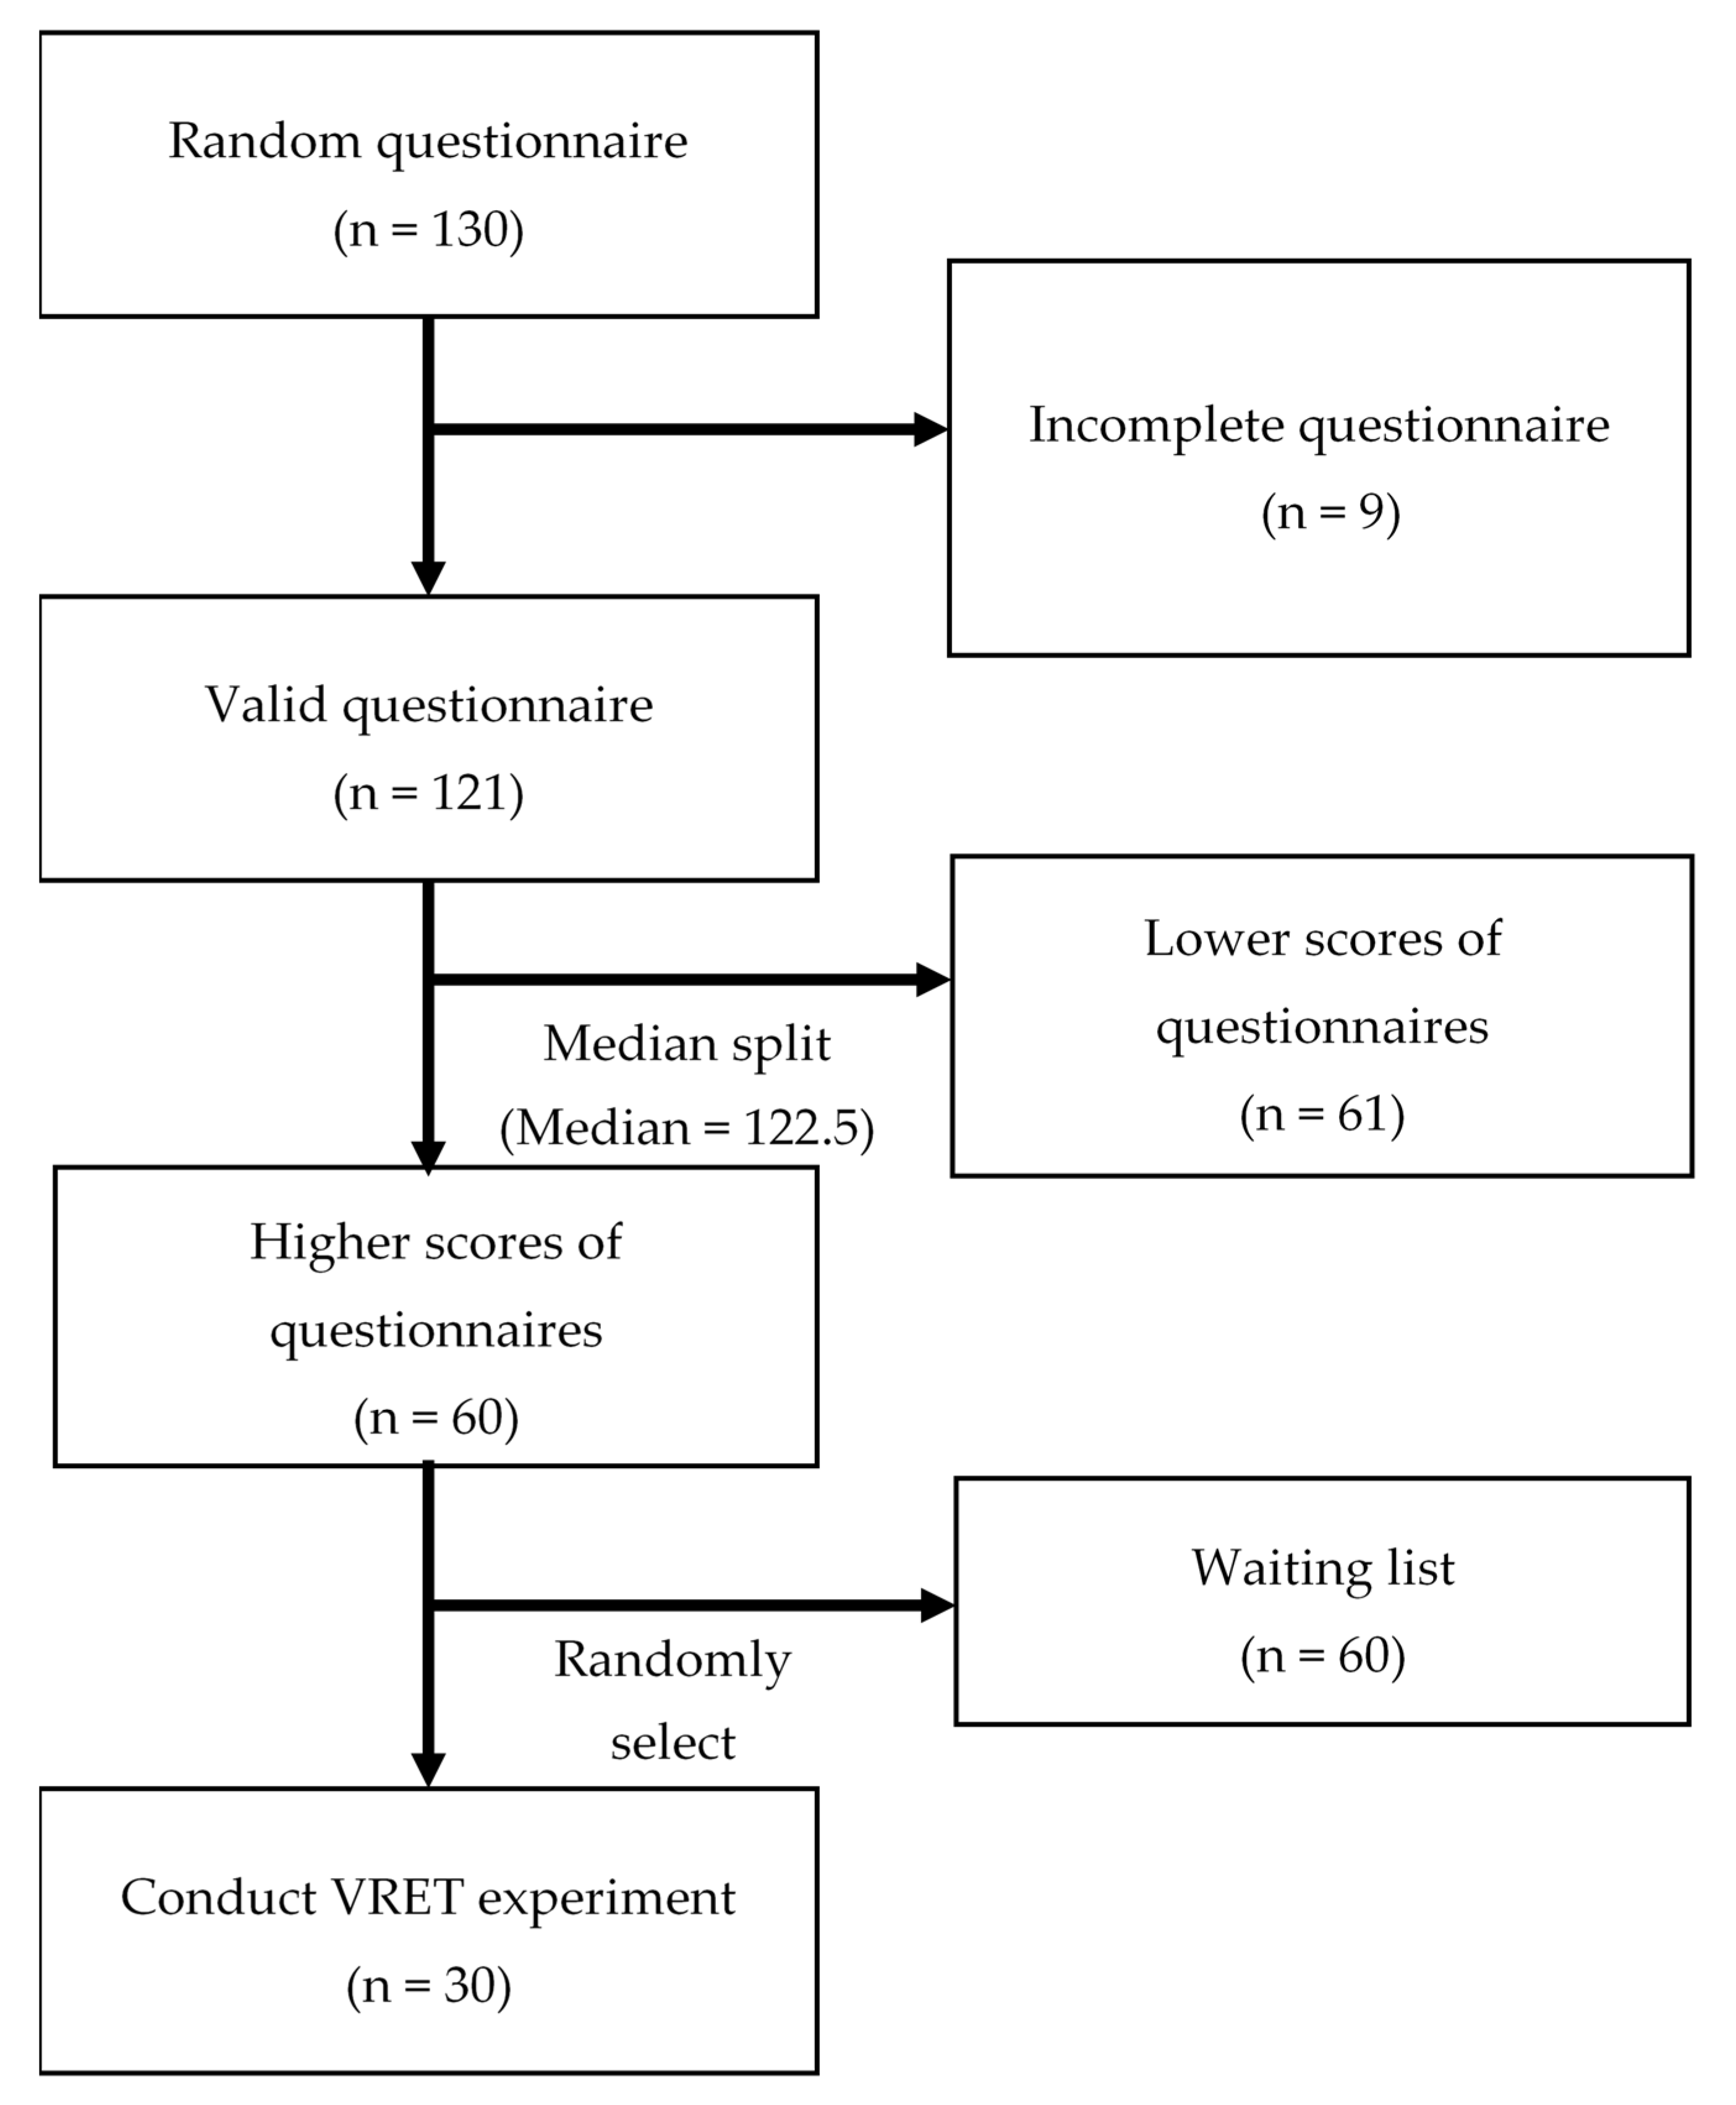
The method of recruiting and screening subjects for this study is shown in
Figure 4. A 7-point Likert scale survey for self-measurement driving behavior was designed referring to three academic papers addressing driving behavior measurements [
12,
13,
14]. The questions Q1~Q19 were adapted from and refer to the basic behavior scales for anxious driving behavior [
12]. Questions Q20~Q32 refer to a driving and riding avoidance scale (DRAS) verified in previous anxiety-related avoidance research [
13]. Finally, questions Q33~Q39 focus on driving in specific environments or conditions based on a pre-verified survey [
14]. Our questionnaire for the self-measurement of driving behavior incorporates these published and well-accepted questions (
Table 1). The pre-requisite screening for those who were eligible to fill out the survey was to have a driver’s license and be between 20 to 60 years of age. Drivers in this age range are considered mature drivers and drivers with sufficient driving experience. Drivers under the age of 20 are considered inexperienced drivers, while drivers over 60 have a higher risk of vehicle accident involvement due to age-related physical-response issues, as reported by the previous research [
21]. The new VRET experiment used drivers between the ages of twenty to sixty years old to minimize age factors affecting the experiment outcomes. A survey pre-test question removed subjects who had experienced traumatic traffic-related accidents to avoid the possibility of subjects having panic attacks during the experiments. A total of 130 randomly selected subjects were asked to fill out the driving behavior questionnaire to measure their fear of driving. After excluding 9 invalid questionnaires, the 121 surveyed subjects are median-split into two groups: 60 subjects ranked with high fear of driving and 61 subjects with low or no fear of driving. Among the 60 high-fear drivers in the waiting queue, 30 subjects were randomly drawn and invited to participate in the VRET experiment as the treatment group (TG). The control group (CG) of 61 subjects with low or no fear of driving was for VRET effectiveness comparison, who did not participate in the VRET experiment. The 30 randomly selected subjects as the TG to participate in the VRET experiment (sample size of 30) provided the appropriate sample size required for experiment validity [
22].
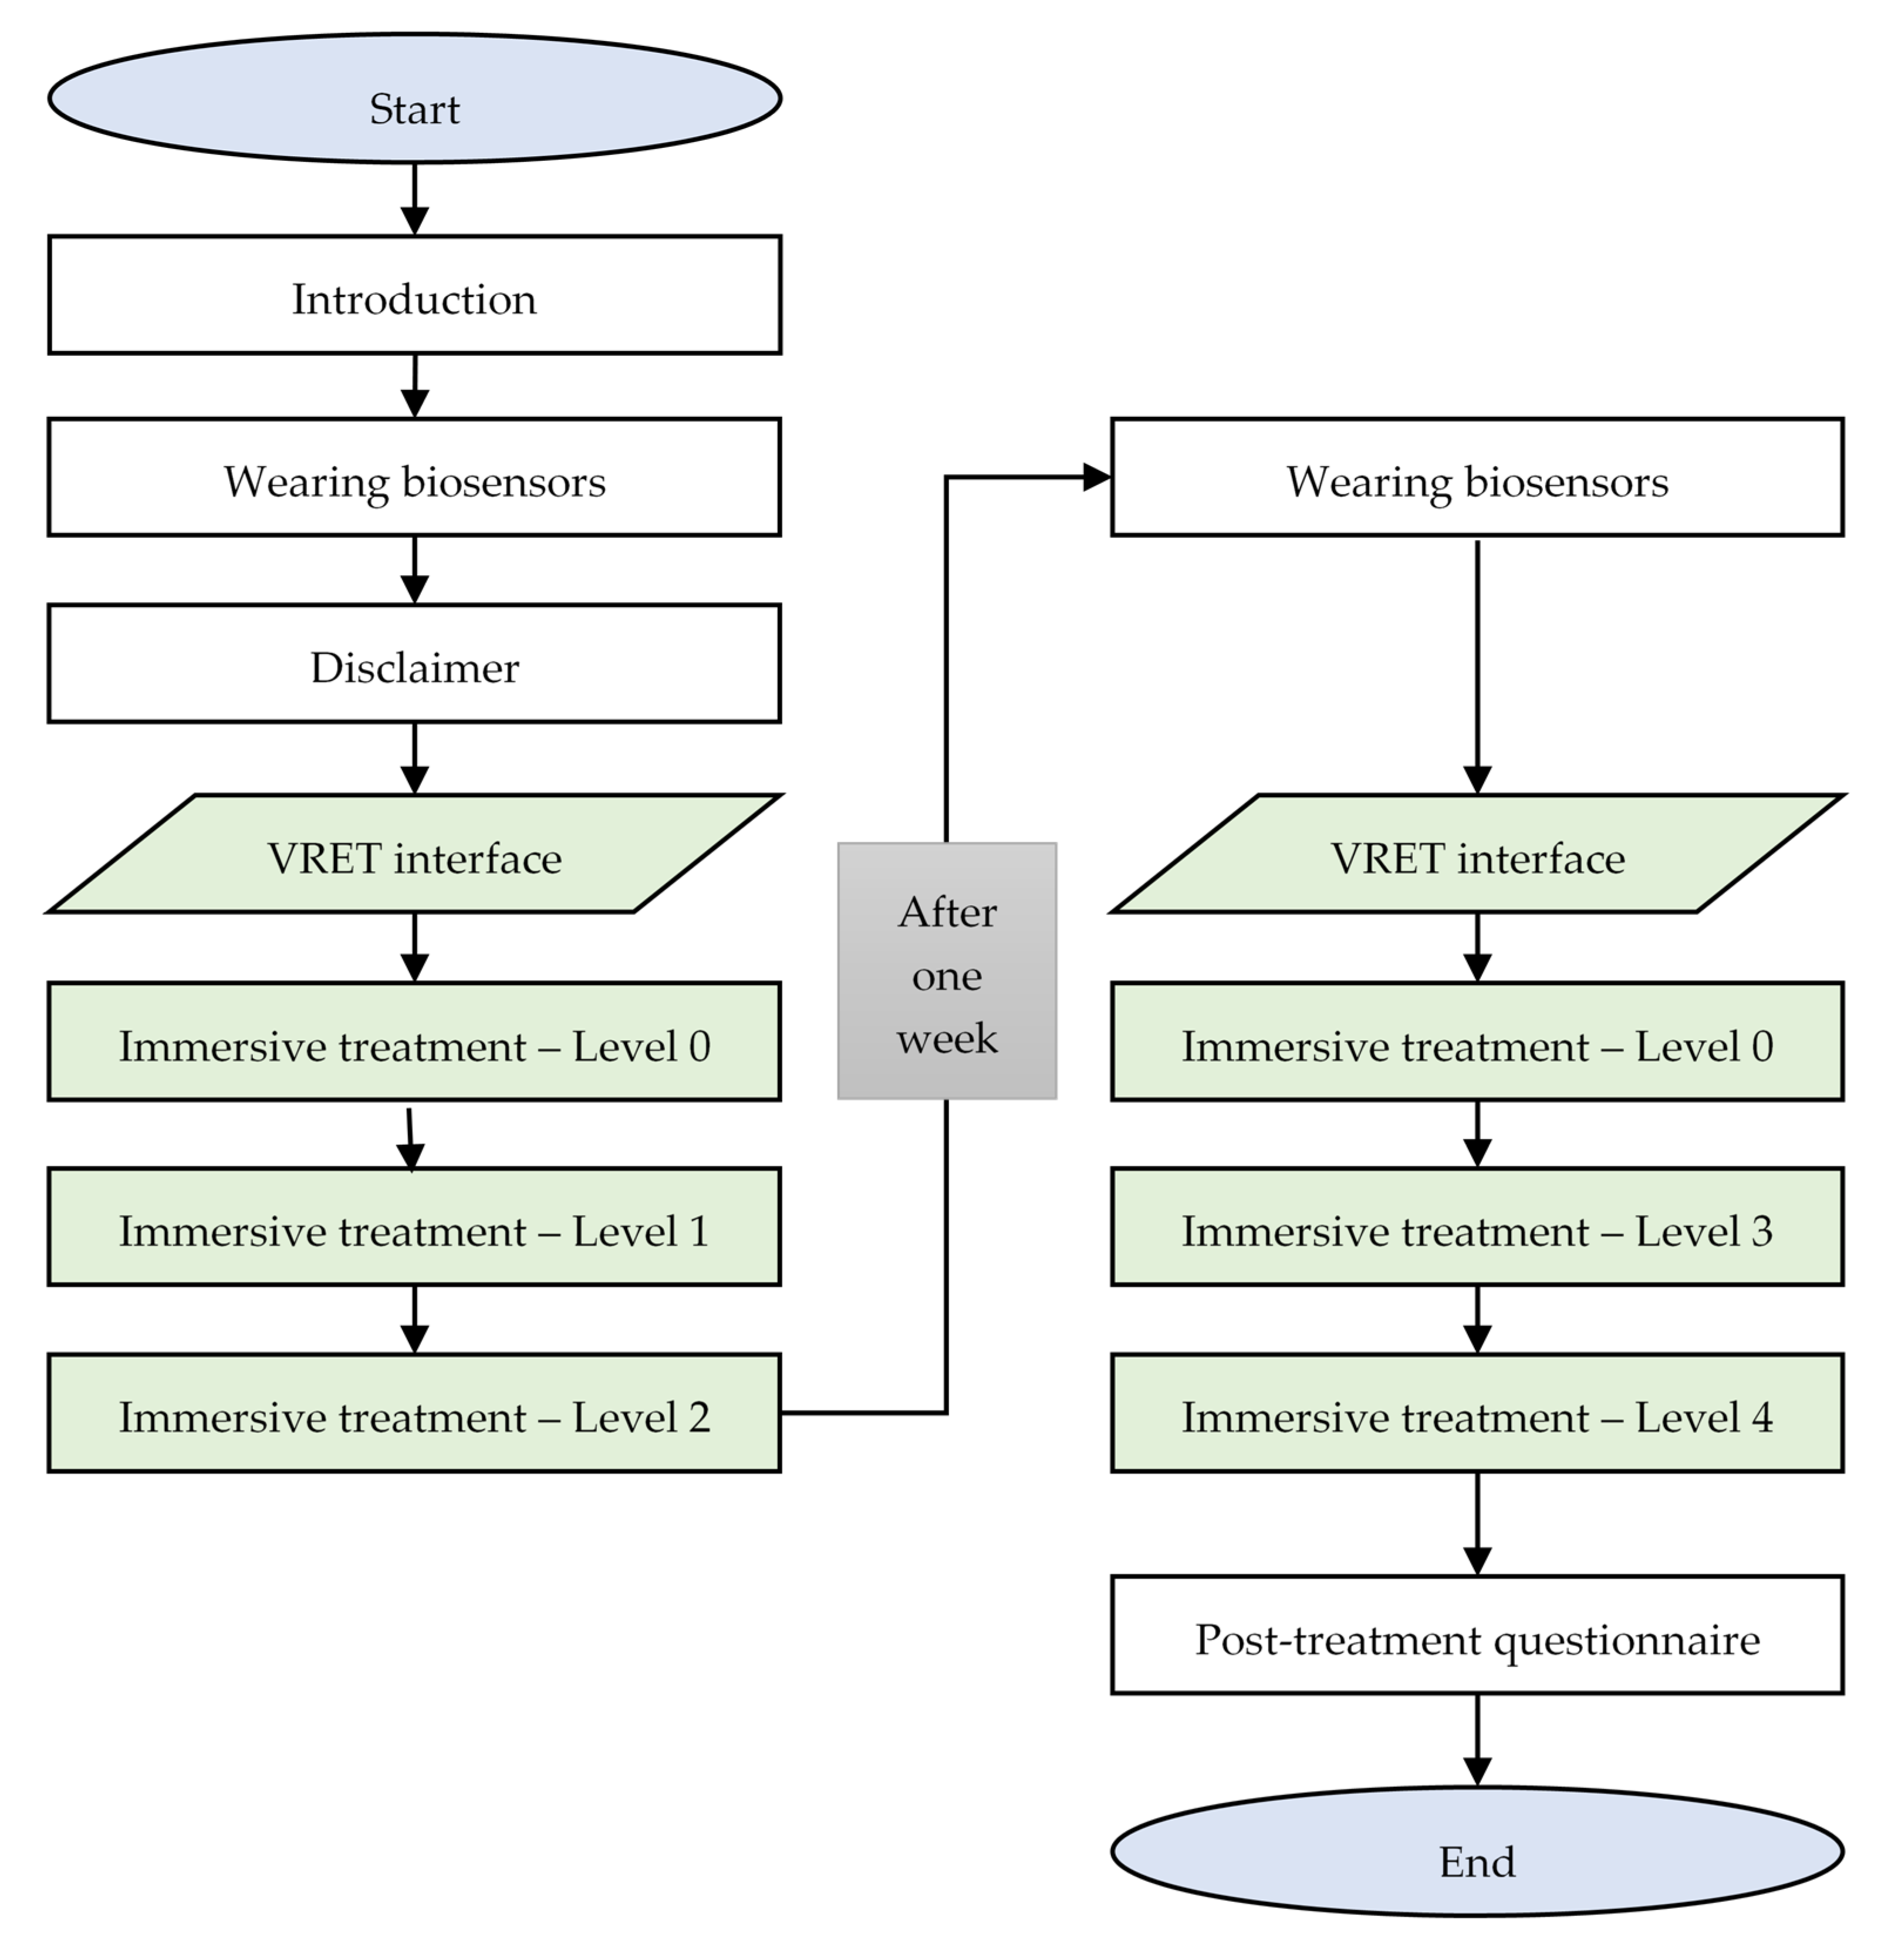
The proposed clinical experiment flowchart is shown in
Figure 5. Each subject participates in the VRET experiment twice, with an interval of one week between experiments. In the first experiment, the treatment begins with an introduction by the psychotherapist. An instructional short film is shown and explained to the subjects so that they fully understanding the experimental process and the equipment. The film provides detailed introductions about the experimental objective, method, procedure, expected risk, and relevant disclaimer information. Subjects are equipped with IoT sensors which measure their biodata, including temperature, respiration, heart rate, and skin conductance. The subjects’ biodata are collected without receiving any VR stimulation to establish a baseline-state biofeedback. After signing the disclaimer, the subject begins their VR driving simulation and the biofeedback data are collected using biosensors. On the first day of the experiment, the subjects practice level 0 until they are familiar with the VR environment and then advance to level 1 and level 2. When the subject finishes level 2, the first day of the experiment ends. One week later, subjects are invited to the second stage of the experiment. The subjects are equipped with biosensors and start from level 0. After getting used to the VR environment, the subject will advance to level 3 and level 4. When both immersive treatments are finished, subjects are asked to complete the post-treatment survey to measure the subject’s mental state after the VRET treatments. During the experiment, if a subject experiences panic, vertigo, or any feeling of motion sickness, an emergency stop can be triggered to immediately stop the experiment session as a safety precaution.
4. System Architecture
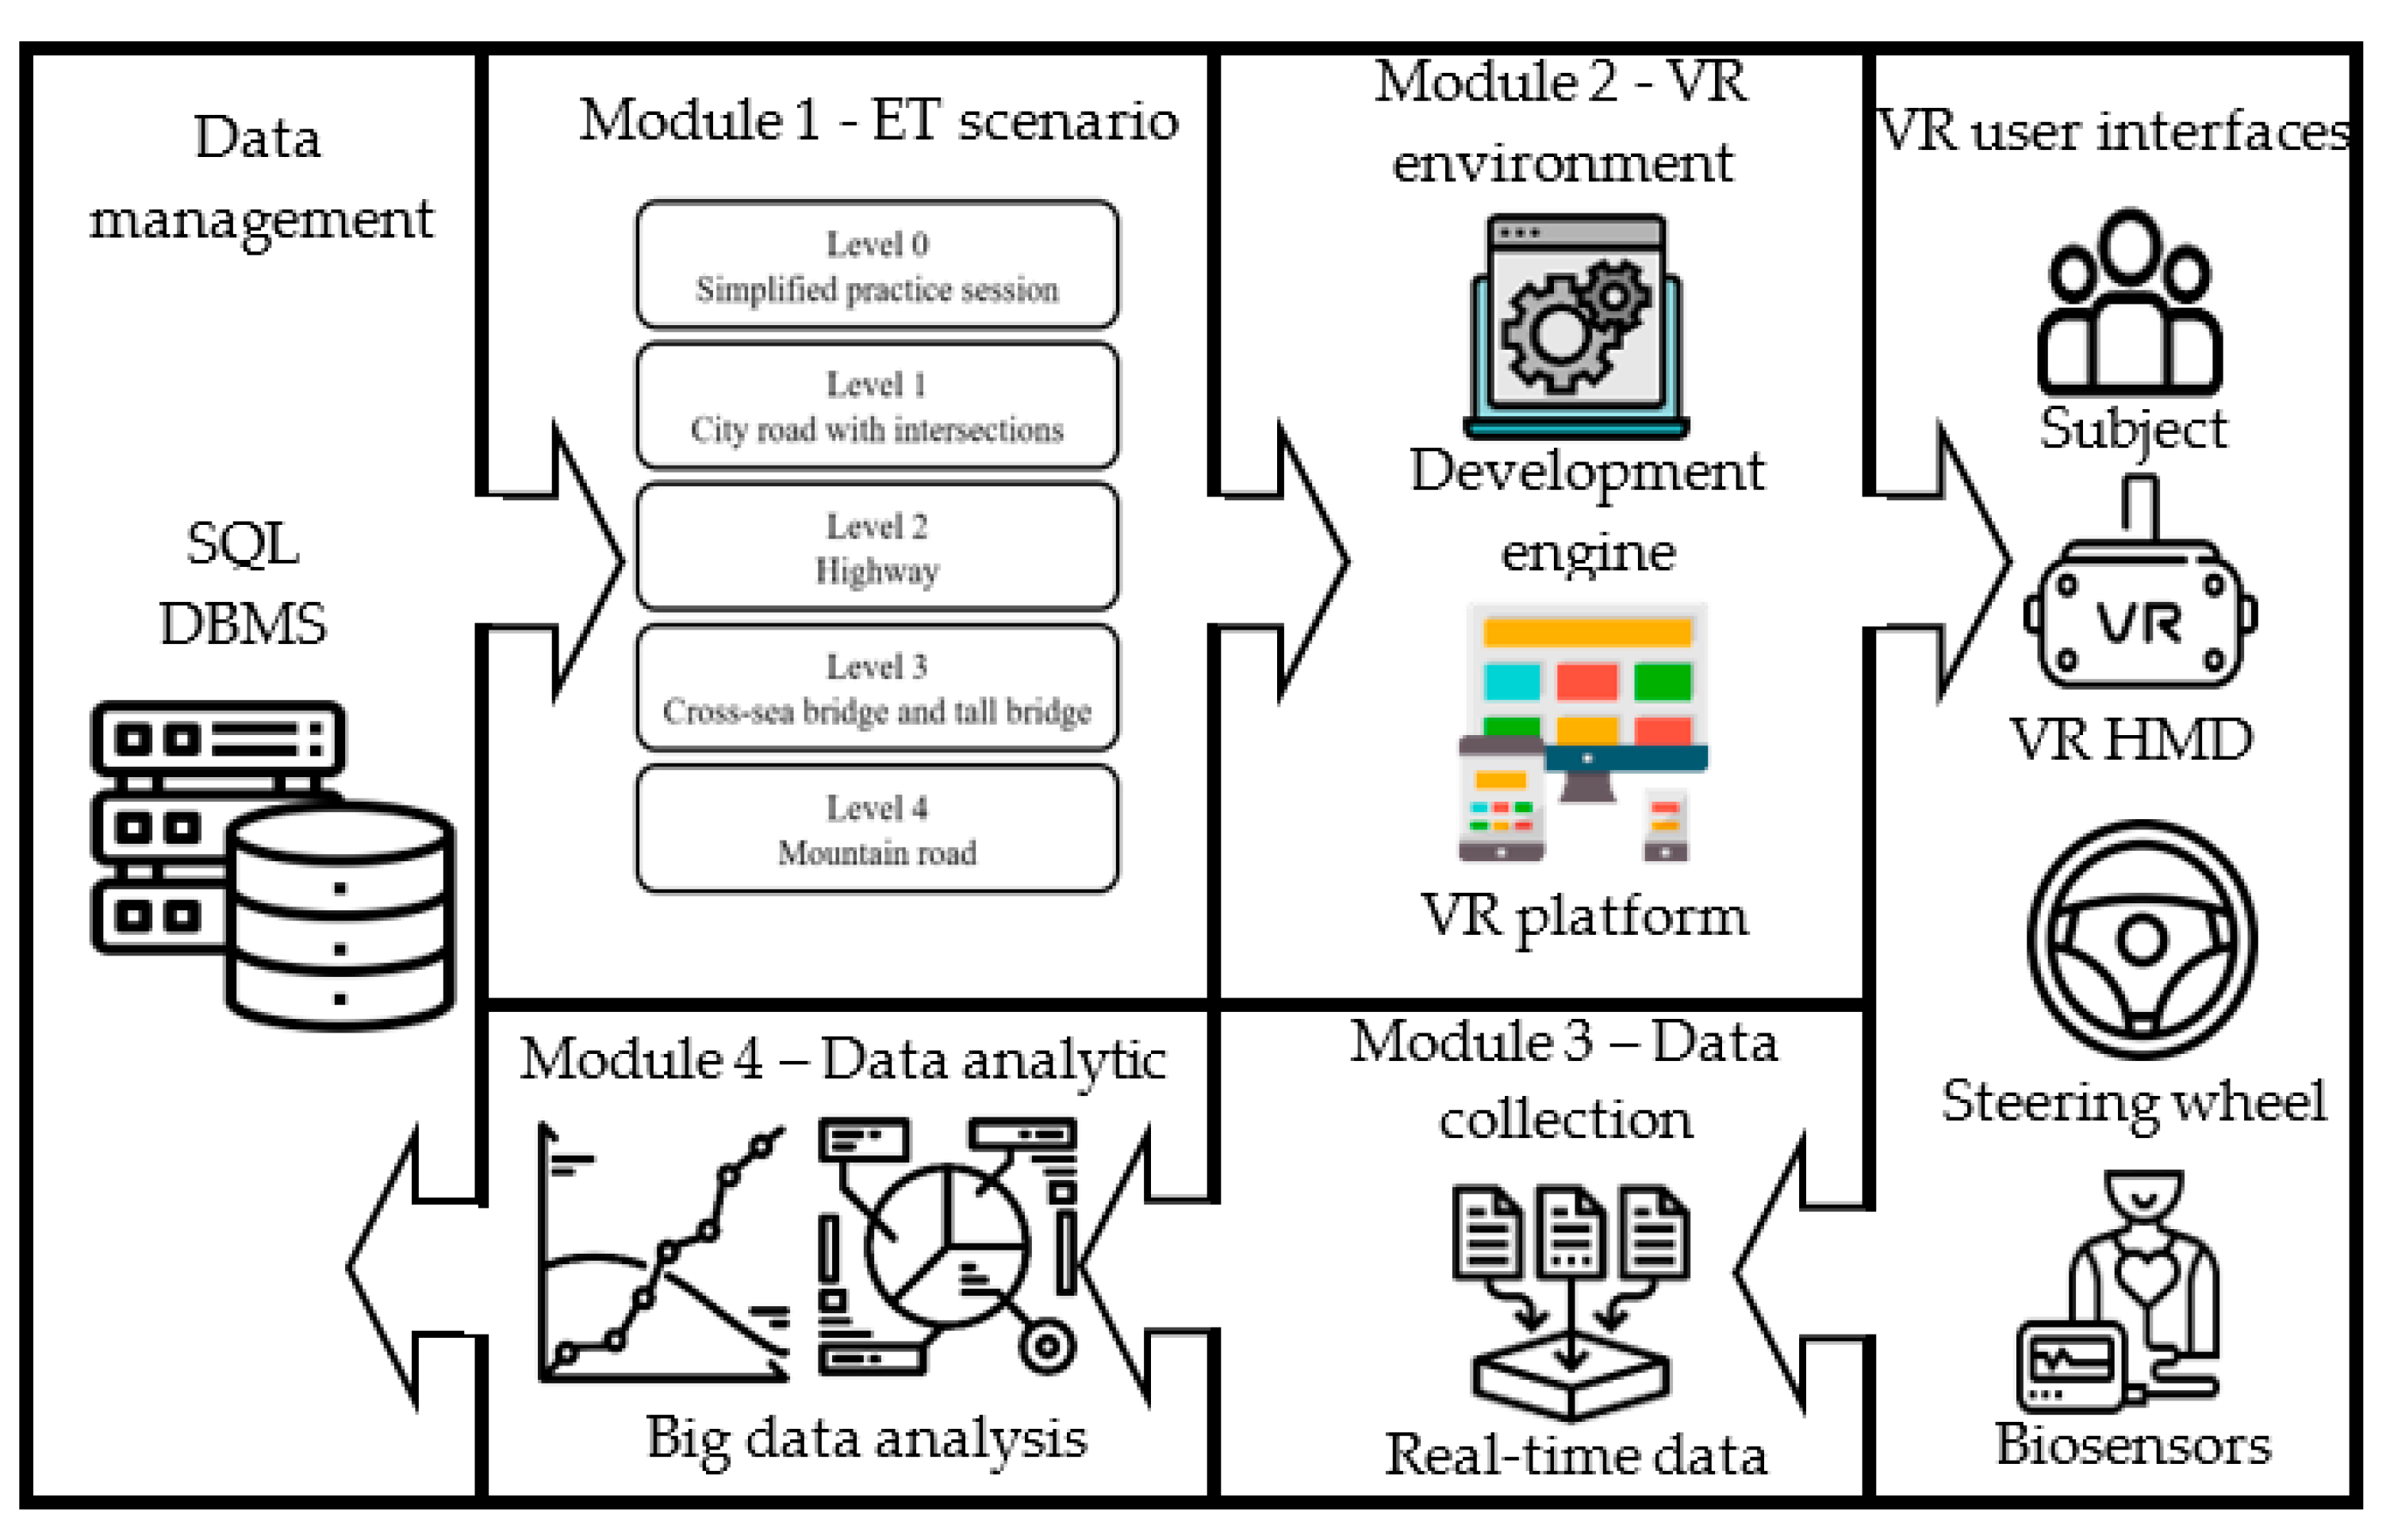
Figure 6 presents the system architecture of the proposed VRET, which is a refined version of the previous VRET system [
11]. The exposure therapy (ET) scenario module (with five levels) provides the architecture for scene construction. The VR environment includes the development engine and the VR platform. The data collection module collects biodata and system parameter data during the experiments. These data are analyzed in the data analytic module. External components such as the database management vault and the VR-user interfaces are connected to the system core modules.
The hardware of the VRET system includes the VR Head-mounted Display headset (HTC, VIVE Pro, Taipei, Taiwan), the steering wheel with joystick and pedals (Guillemot Co., Thrustmeter T300 RS GT, Carentoir, France), and biological signal sensors (Thought Technology Ltd., ProComp Infiniti, Montreal, QC, Canada). The software components include the development engine (Unity Technologies, Unity; San Francisco (HQ), CA, USA) and the VR platform (Valve Corp., Steam; Bellevue, WA, USA). For data storage and management, SQLite (SQLite.org) is used as DBMS and BioGraph Infinite software is used to record and visualize the biodata. For the software and hardware configuration and description, please refer to [
11].
5. Data Analysis
In this research, 130 subjects answered the questionnaire and among the 130 subjects, 15 males and 15 females were recruited to conduct VRET experiment. During the clinical experiment, the system’s parameter data, the subject’s biofeedback data, and the subject’s pre-treatment and post-treatment questionnaire data were recorded and organized in SQLite. Questionnaire scores and subjects’ biodata were analyzed in this section for the purpose of evaluating the effectiveness of the refined VRET experimental design. This clinical experiment design was thoroughly reviewed and approval by the Chang Gung Medical Foundation (CGMF) Institution Review Board (IRB) and its ethical commission. The approval number is 201901262B0.
5.1. Questionnaire Result
One hundred thirty randomly selected subjects filled out the self-measurement driving behavior survey. These subjects were divided into two groups according to their questionnaire scores (60 subjects belonged to the high driving fear score group, 61 belonged to the lower score group, and 9 were excluded due to incomplete answers). Thirty of the sixty subjects in a waiting queue that belonged to the high driving fear score group were randomly selected and assigned to treatment group (TG) to participate in the VRET experiment. Subjects from the low driving fear group were used as the control group (CG). A
t-test measured the difference between the means of driving behavior questionnaire scores for the TG and CG. The behavior scores were significantly different (95% confidence interval = (51.7, 66.12);
p-value = 0.000). Subjects in the TG completed the same self-measurement driving behavior survey after the VRET experiment to measure the effectiveness of the experiment. The hypothesis is that the subjects’ driving anxiety is reduced through VRET and their subjective distress is reduced toward the level of the CG that had significantly lower driving fear scores.
Table 2 presents the means and standard deviations (SDs) of each question in the survey, compared between TG’s pre-treatment questionnaire score (TG pre), TG’s post-treatment questionnaire score (TG post), and the CG’s questionnaire score (CG) without treatment. The SDs of all survey question results showed no significant differences between TG pre, TG post, and CG using a one-way ANOVA test.
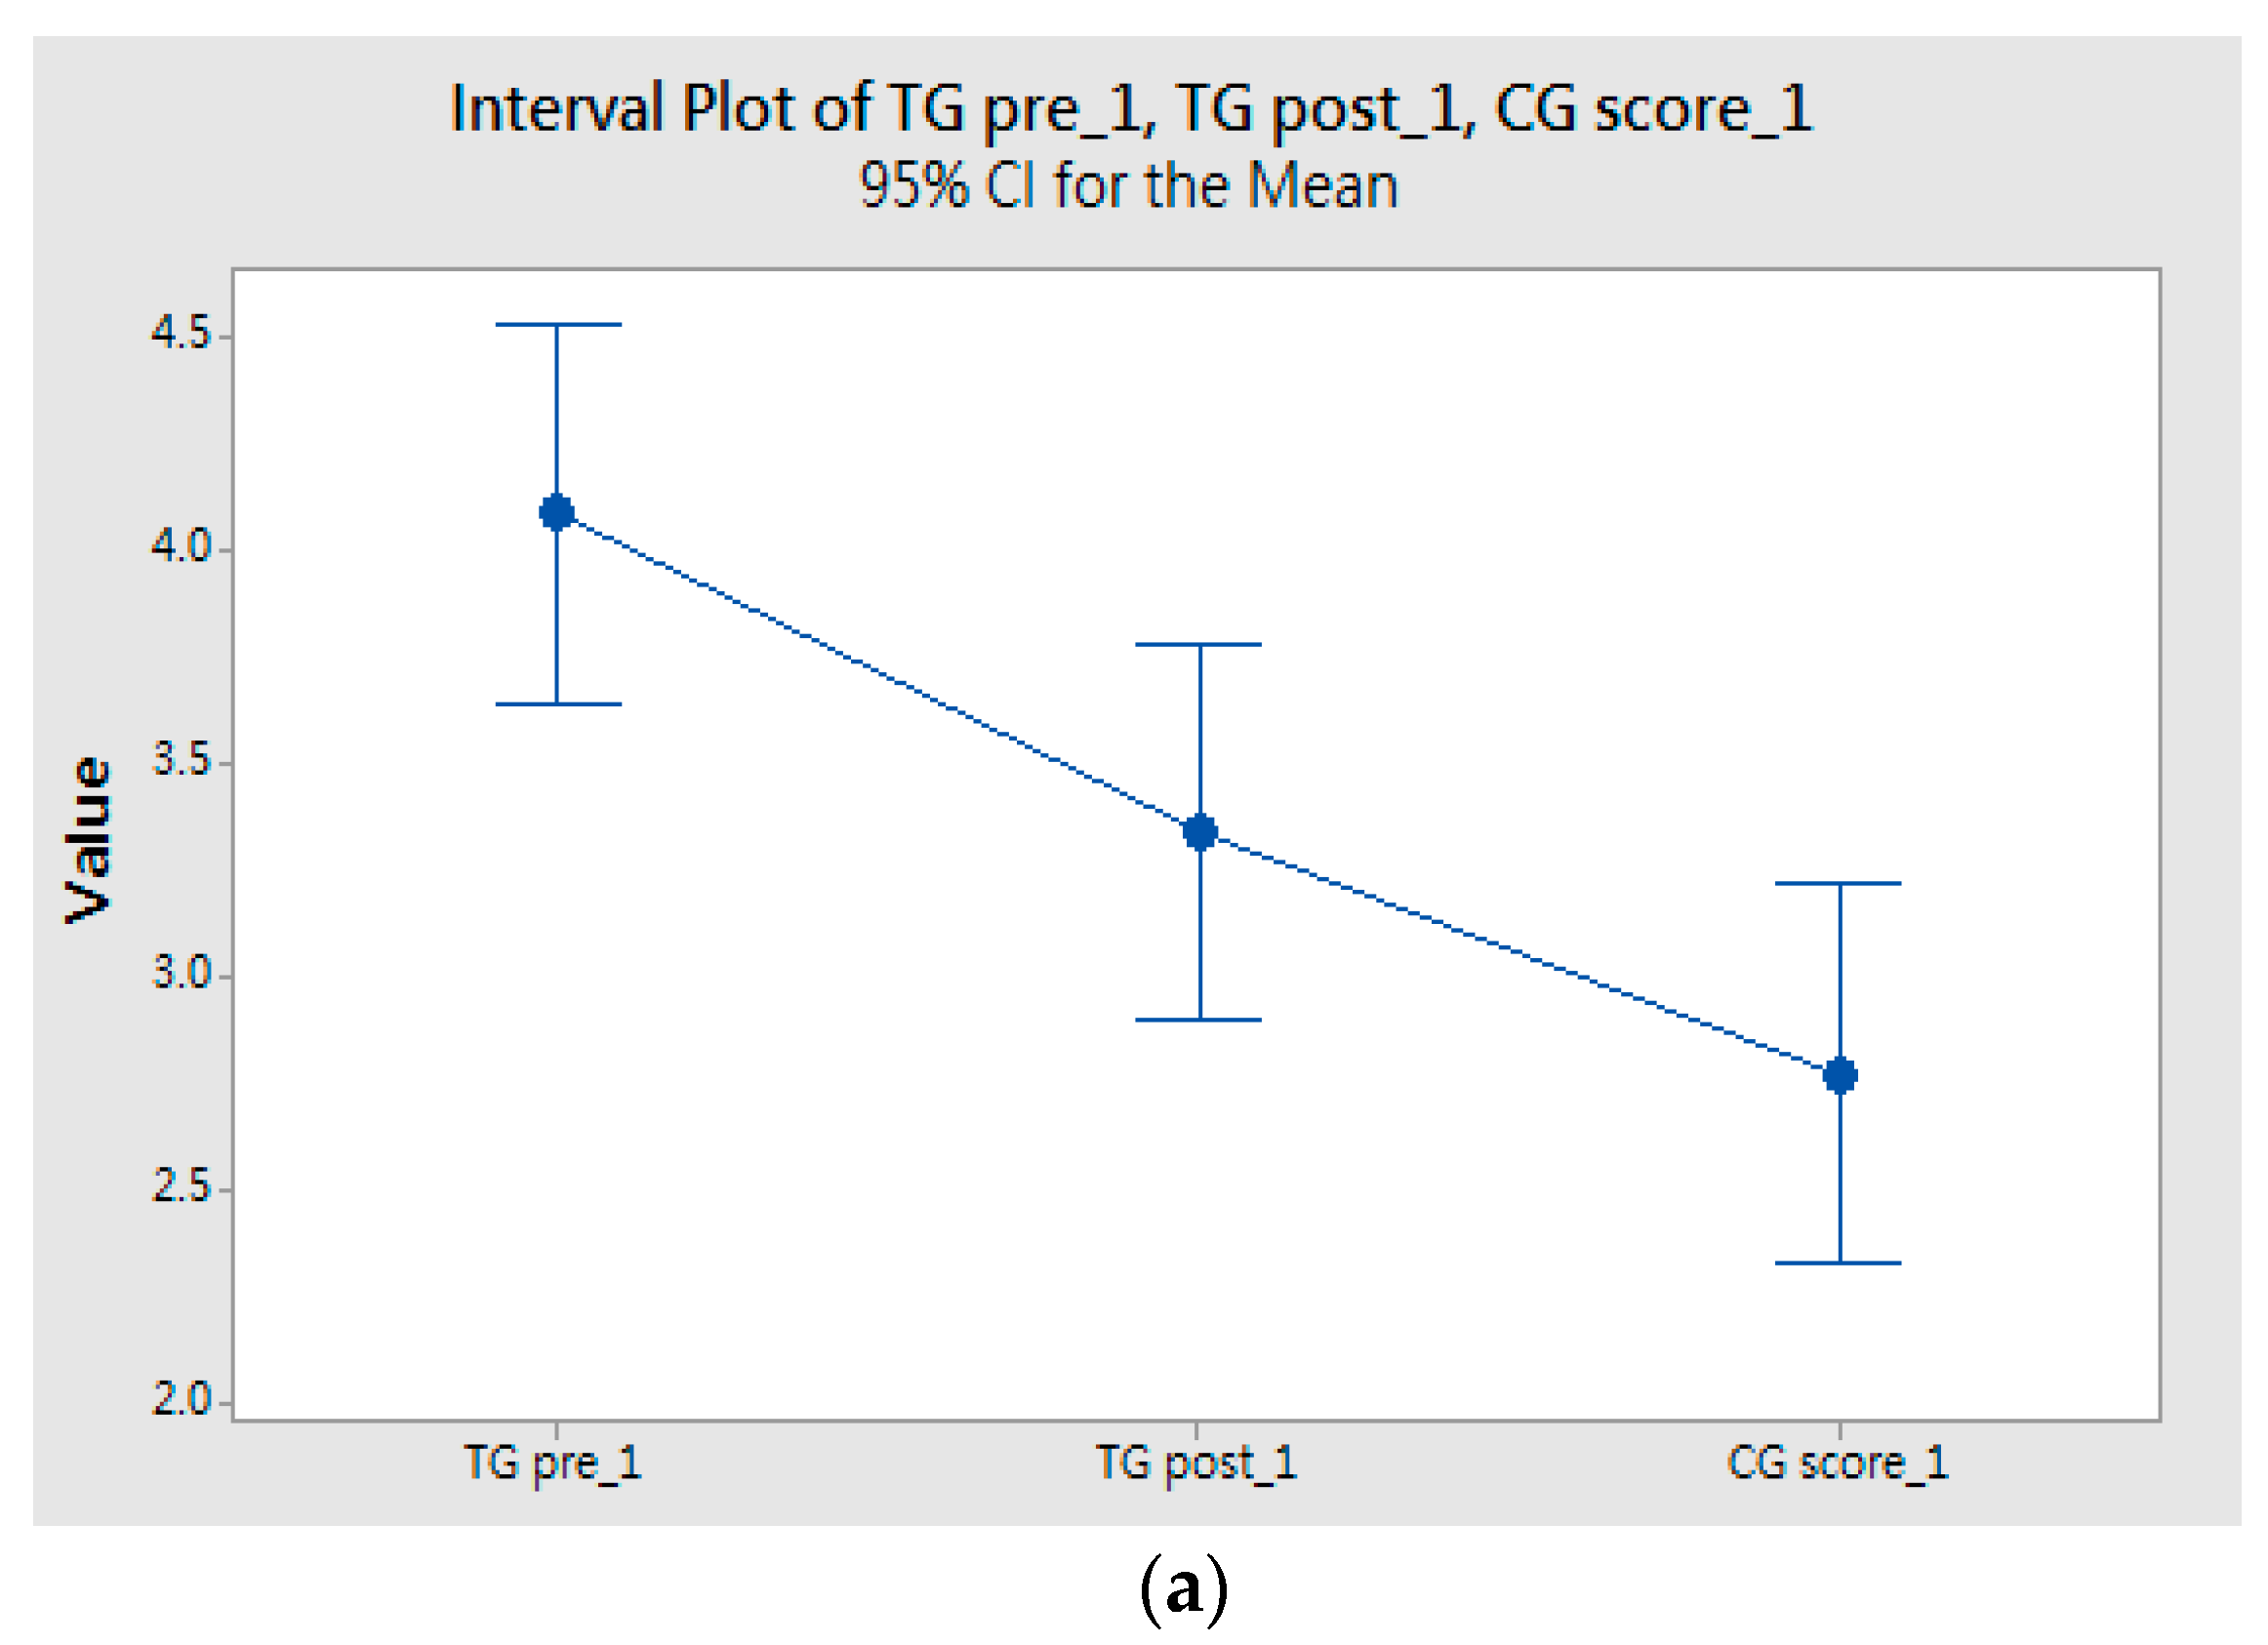
A one-way ANOVA test was used to compare three mean scores (i.e., TG pre, TG post, and CG) for the 39 questions. A 95% confidence interval (CI) with pairwise comparisons detect there were significant differences between the means of the scores. Fisher’s least significant difference method for multiple comparisons was applied to examine the means for different groups (
Figure 7). The results of multiple comparisons show that there were significant differences between all pairs (i.e., TG pre vs. TG post, TG pre vs. CG score, TG post vs. CG score). The ANOVA tests support significant evidence that the TG’s subjective distress was reduced through the treatment of VRET. The fear reduction (TG post) was not reduced to the same level as that of the control group. The experiment demonstrates with high confidence that the driving phobia VRET system can effectively reduce the subject’s avoidance of driving to a significant degree, but there is still a gap for complete recovery.
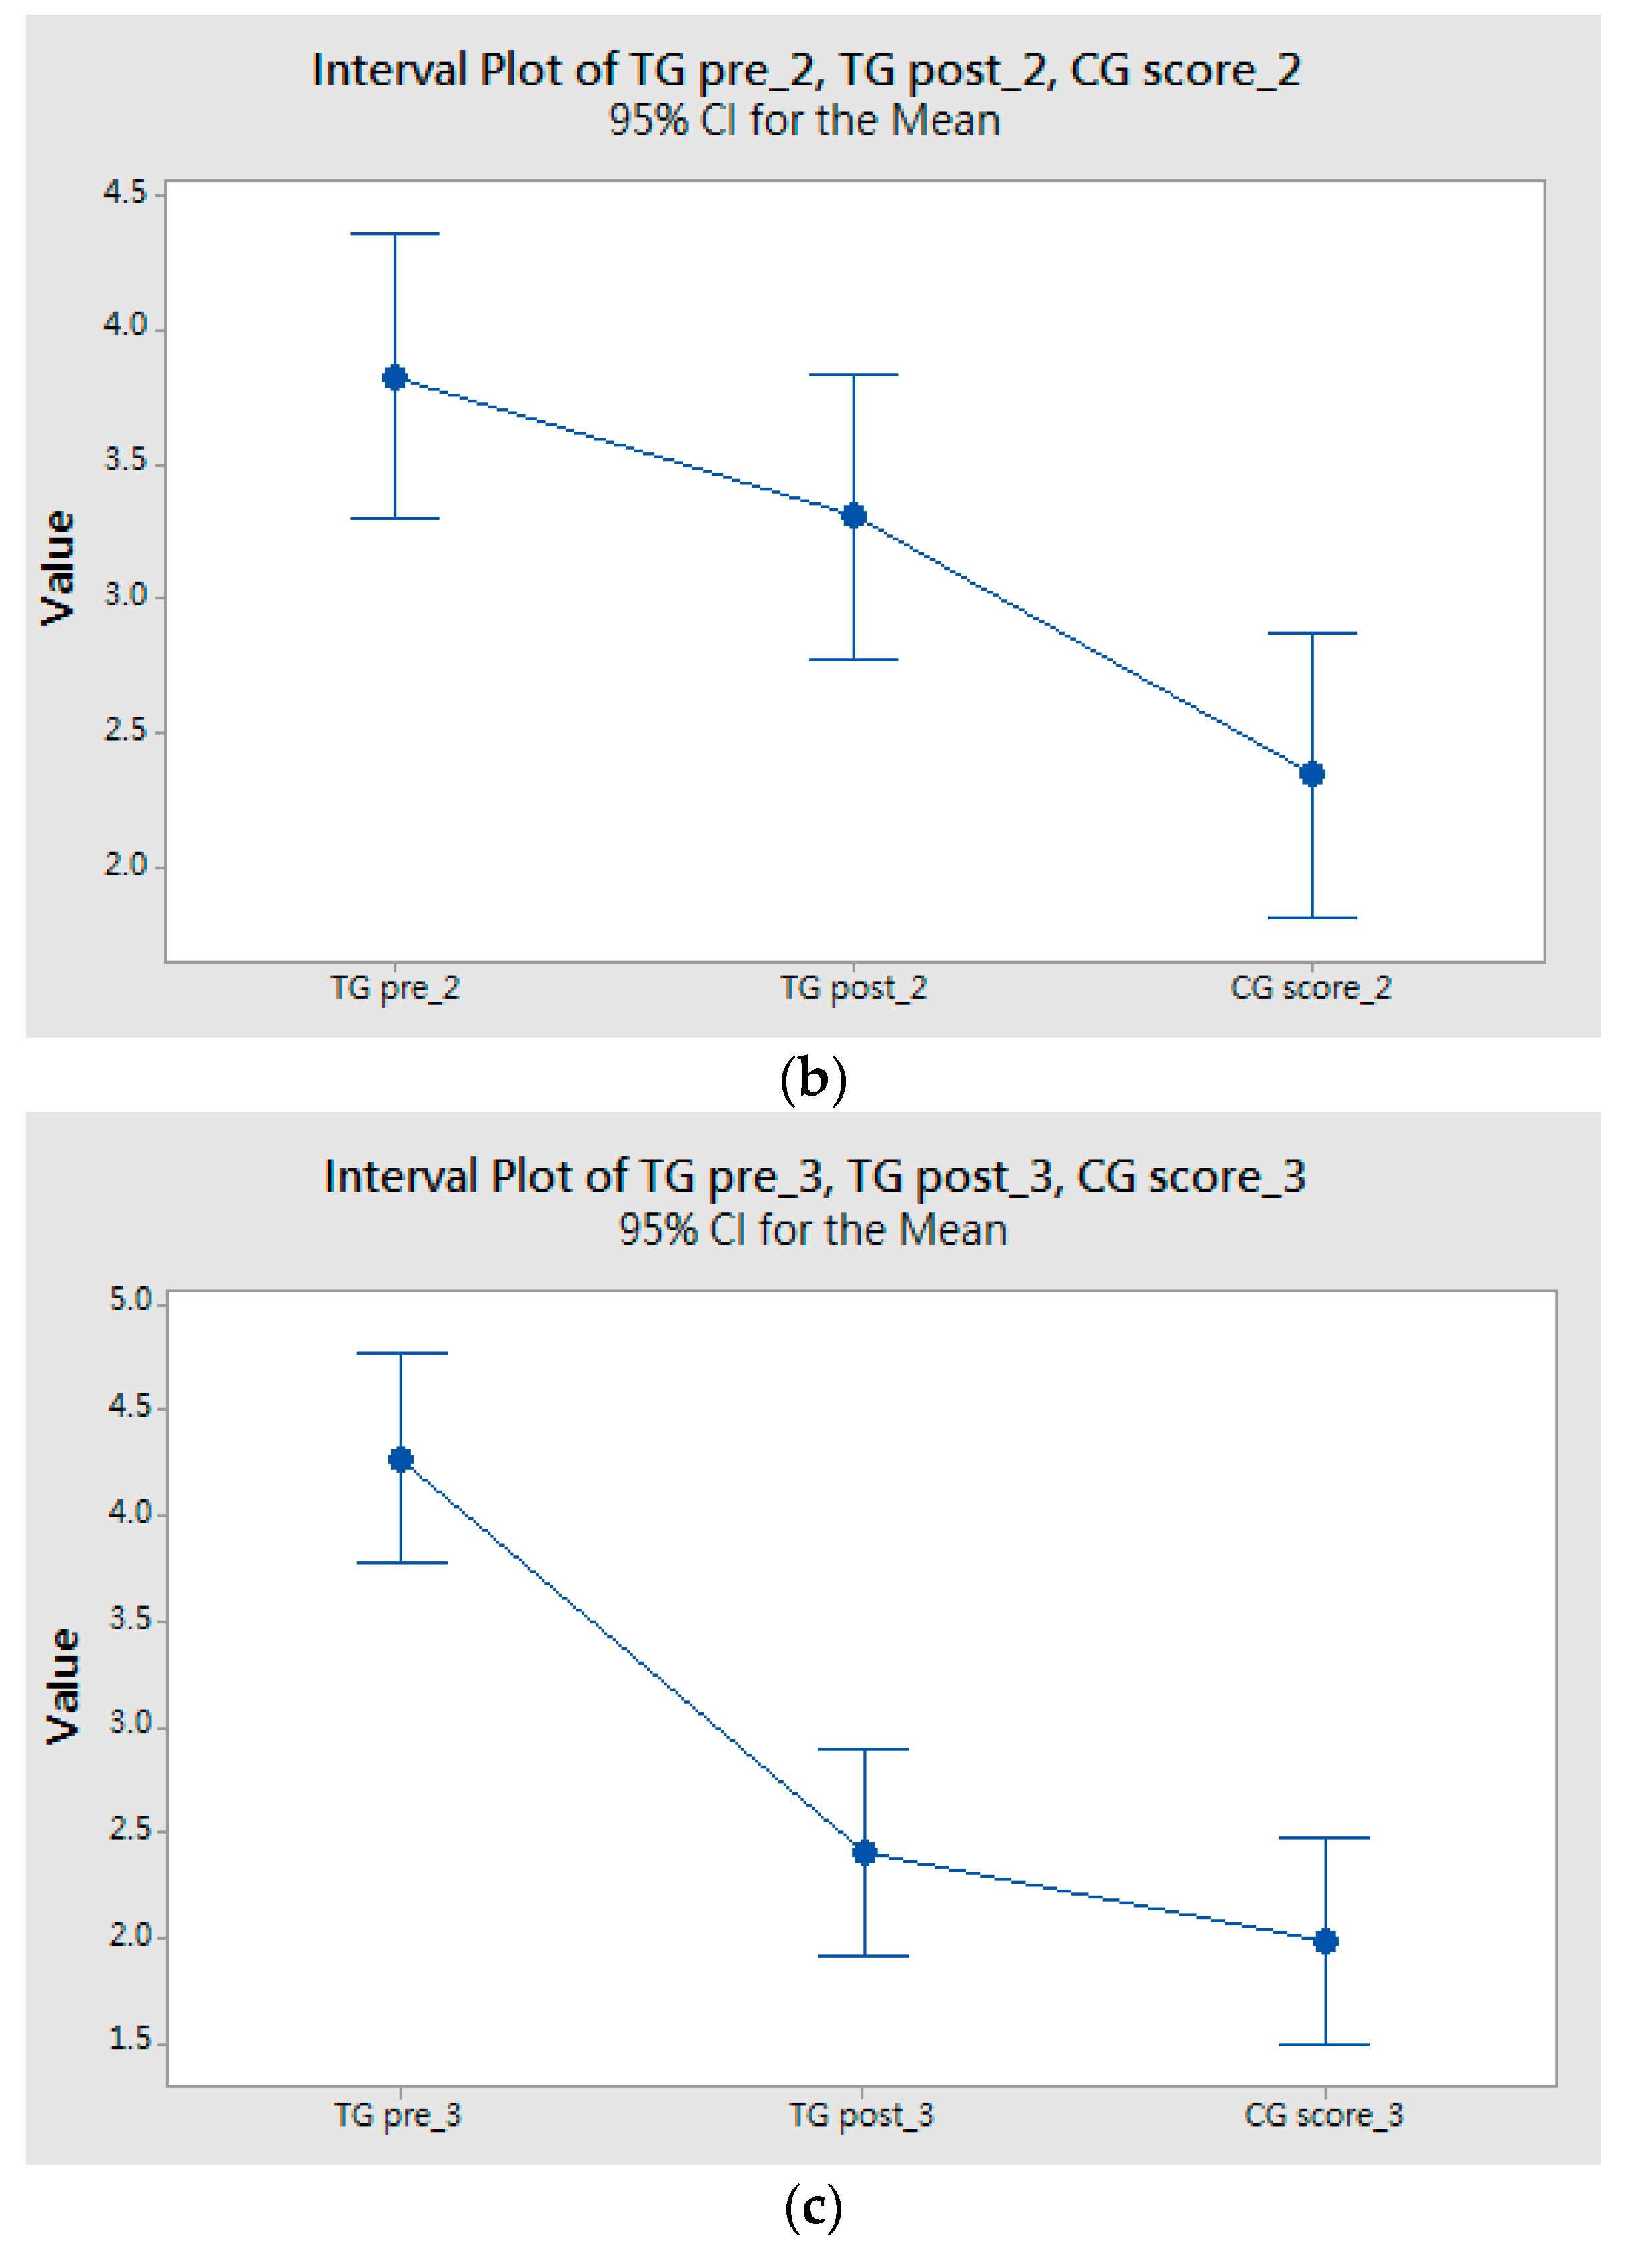
Further analysis on different types of questionnaire designs from the American Psychological Association and other international organizations will be studied for future implementation. The questionnaire design is based on three driving-behavior-survey studies, Q1~Q19 refer to an anxious driving behavior study [
12], Q20~Q32 refer to a DRAS mentioned in one anxiety-related-avoidance research [
13], and Q33~Q39 focus on driving in specific environments or conditions [
14]. A one-way ANOVA tests and Fisher’s least significant difference model for multiple comparisons are applied to each questionnaire design (
Figure 8a–c). The ANOVA analysis results relate to the questionnaire design for anxious driving behavior and anxiety-related-avoidance (Q1~Q32) from previous peer reviewed studies. The TG’s post-treatment questionnaire scores are significantly lowered after participating in the VRET experiment, though the results are still higher than the CG’s questionnaire scores. The result of the questionnaire design, which relates to driving in specific environments (Q33~Q39), shows that there are no significant differences between the TG post-treatment scores and the CG scores. Given the small number of questions asked (only seven questions), we conducted a nonparametric test, i.e., Mann–Whitney test, to determine whether the medians of two groups were different. The result shows that no significant difference between TG post and CG (95% CI = (−0.2999, 1.0001);
p-value = 0.1599). Thus, the subjects’ degree of confidence in specific driving environments was significantly increased after the experiment, indicating VRET indeed helps people with high driving fears better adapt to various driving conditions.
5.2. Mean and Maximum Biofeedback Differences for Each Session
The subjects’ biofeedback data including skin conductance, body temperature, respiration, and heart rate were collected while performing the experiment in each session to assess changes over the VRET sessions. Base heart rate and base respiration rate differed between individuals, reducing reliability to compare mean biofeedback values between different sessions. The data were standardized before comparison. Comparisons of the maximum and mean value difference biofeedback were used to standardize the heart rate and respiration rate. The magnitude of the subjects’ heart rate and respiration rate remained stable between different experimental scenarios and affected the intensity of the stimulus. For driving anxiety, emotion plays an important role in maximum and mean value differences for biofeedback. Larger value differences indicate a stronger anxiety response.
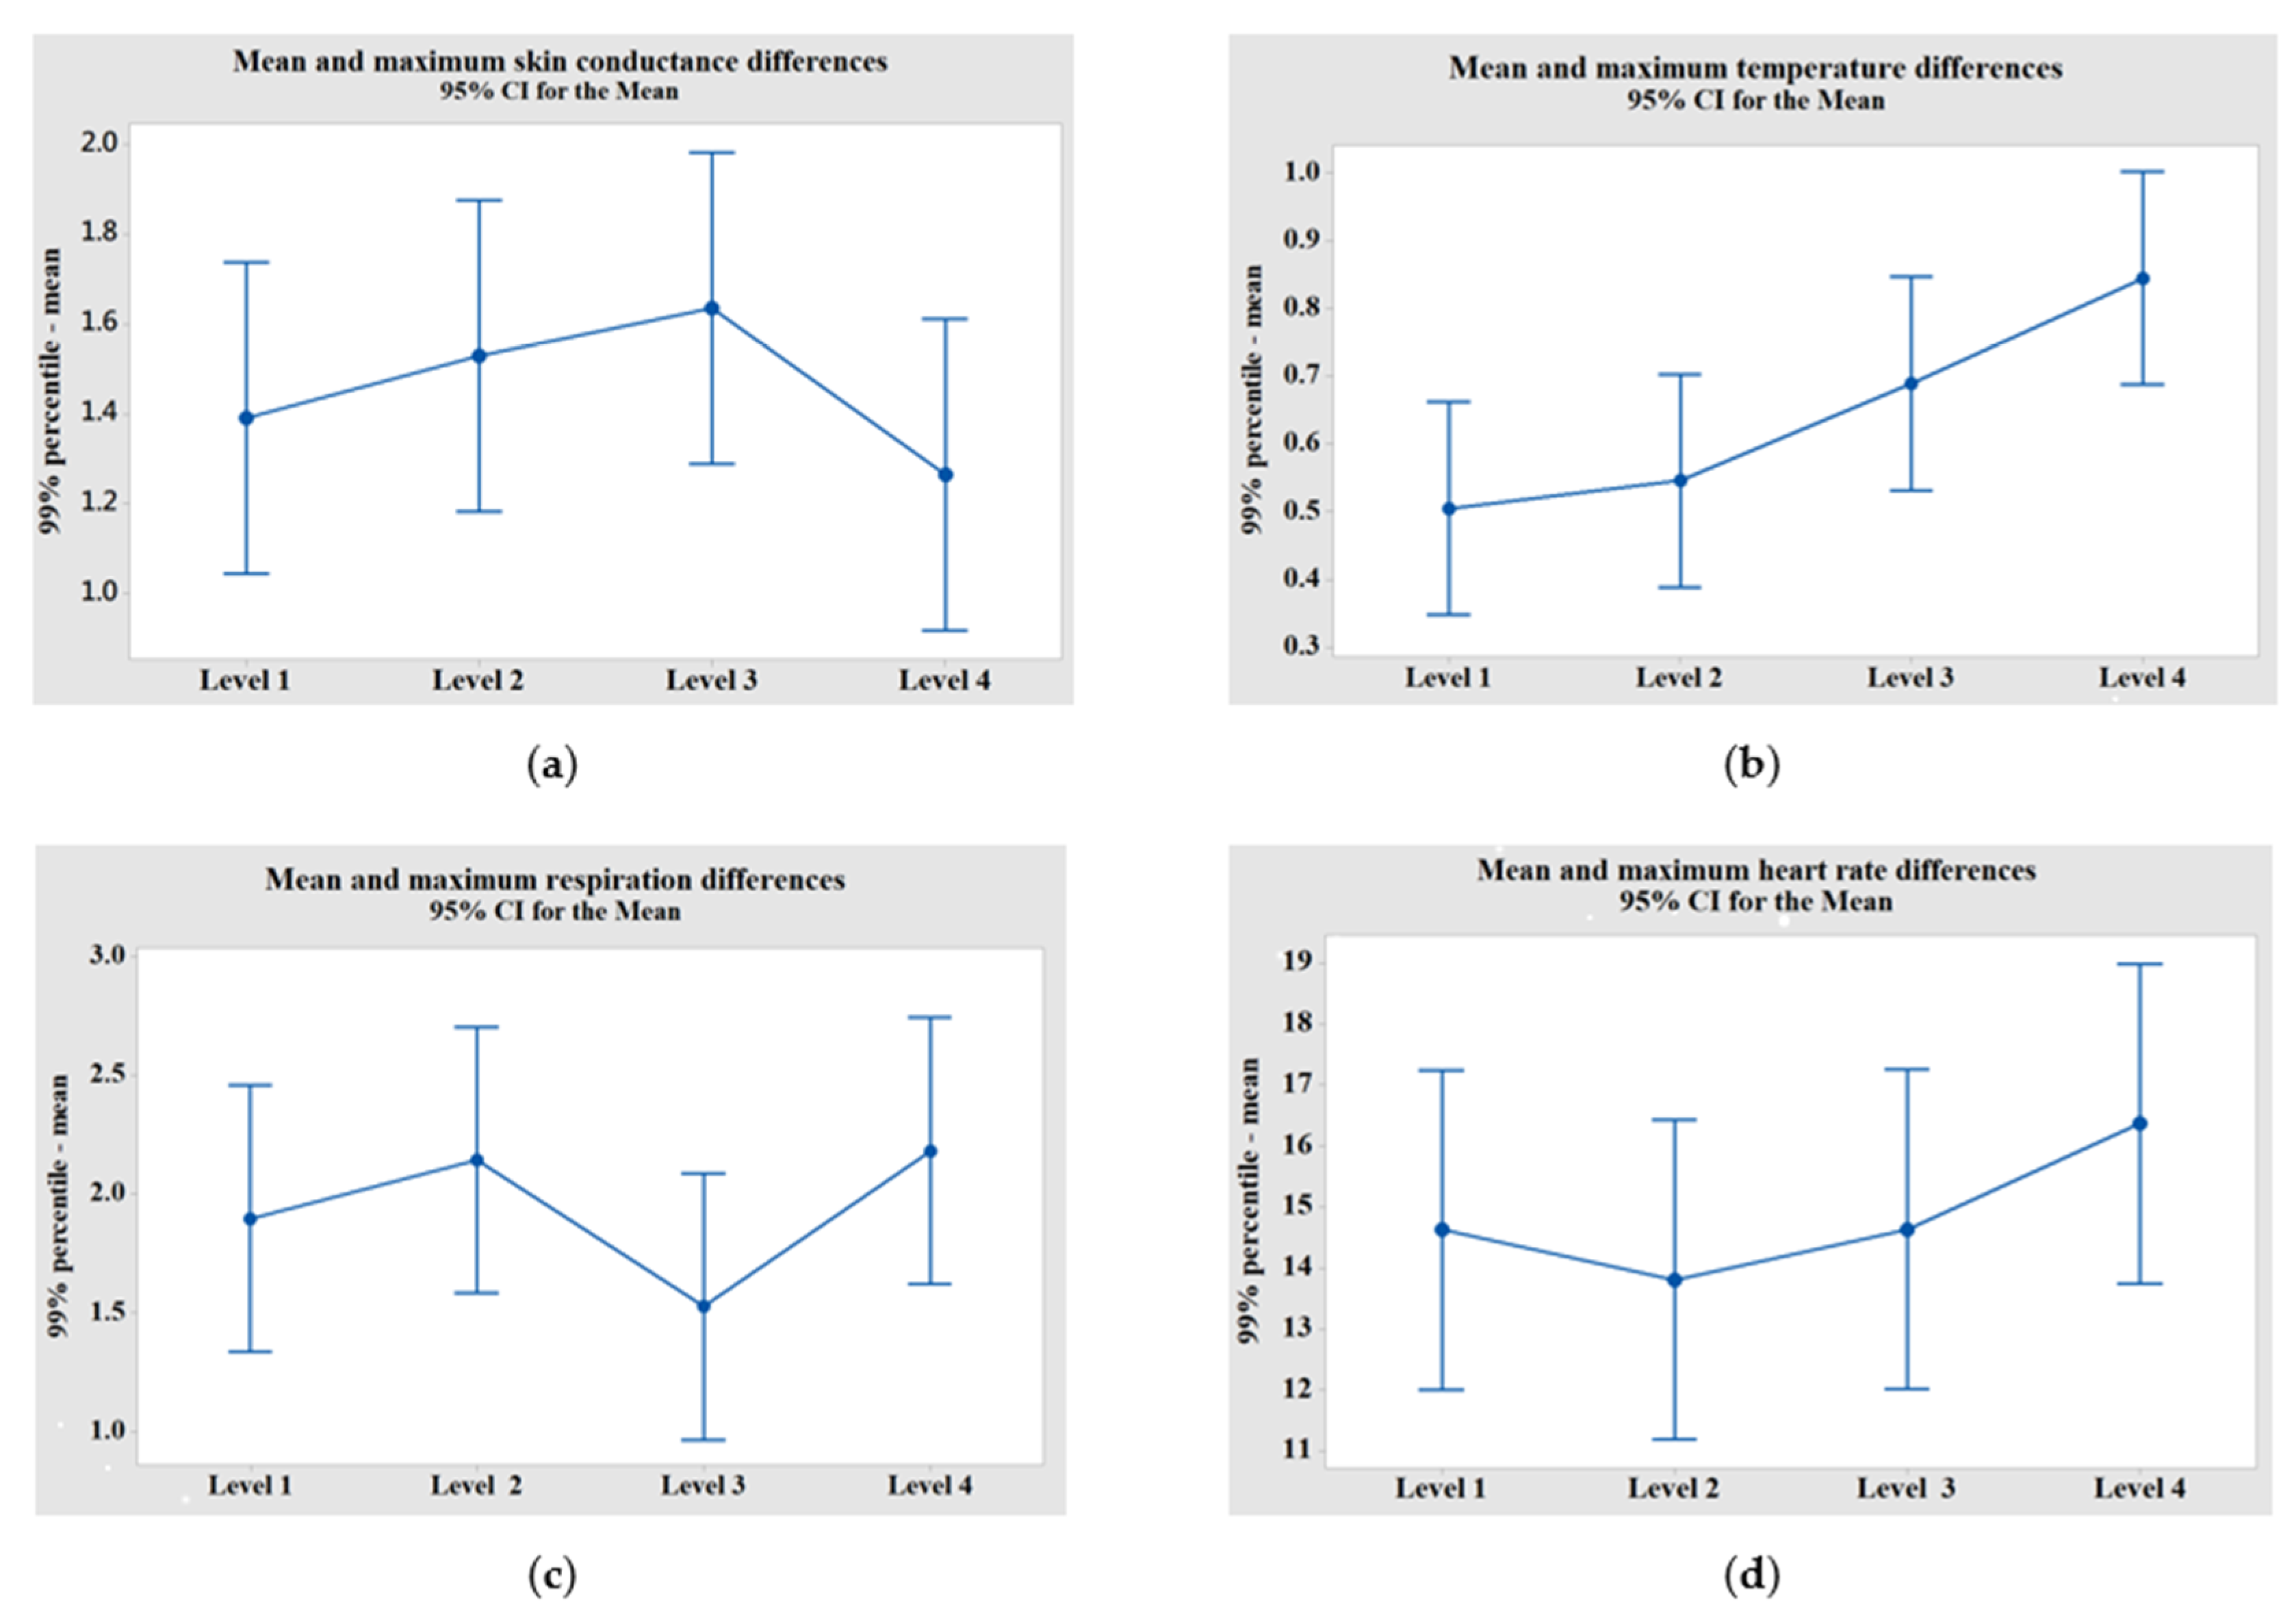
While performing data analysis, a 99 percentile data level was used to collect each session’s maximum biofeedback value to avoid outliers and changes within VRET sessions for the four driving scenarios of biofeedback (
Figure 9). The value of mean and maximum biofeedback differences progressively increased over sessions, with the exceptions occurring in skin conductance differences observed in level 4 and respiration differences observed in level 3. As a whole, the subjects’ anxiety arousal became stronger over sessions, indicating subjects were more anxious driving across long bridges and on mountain roads.
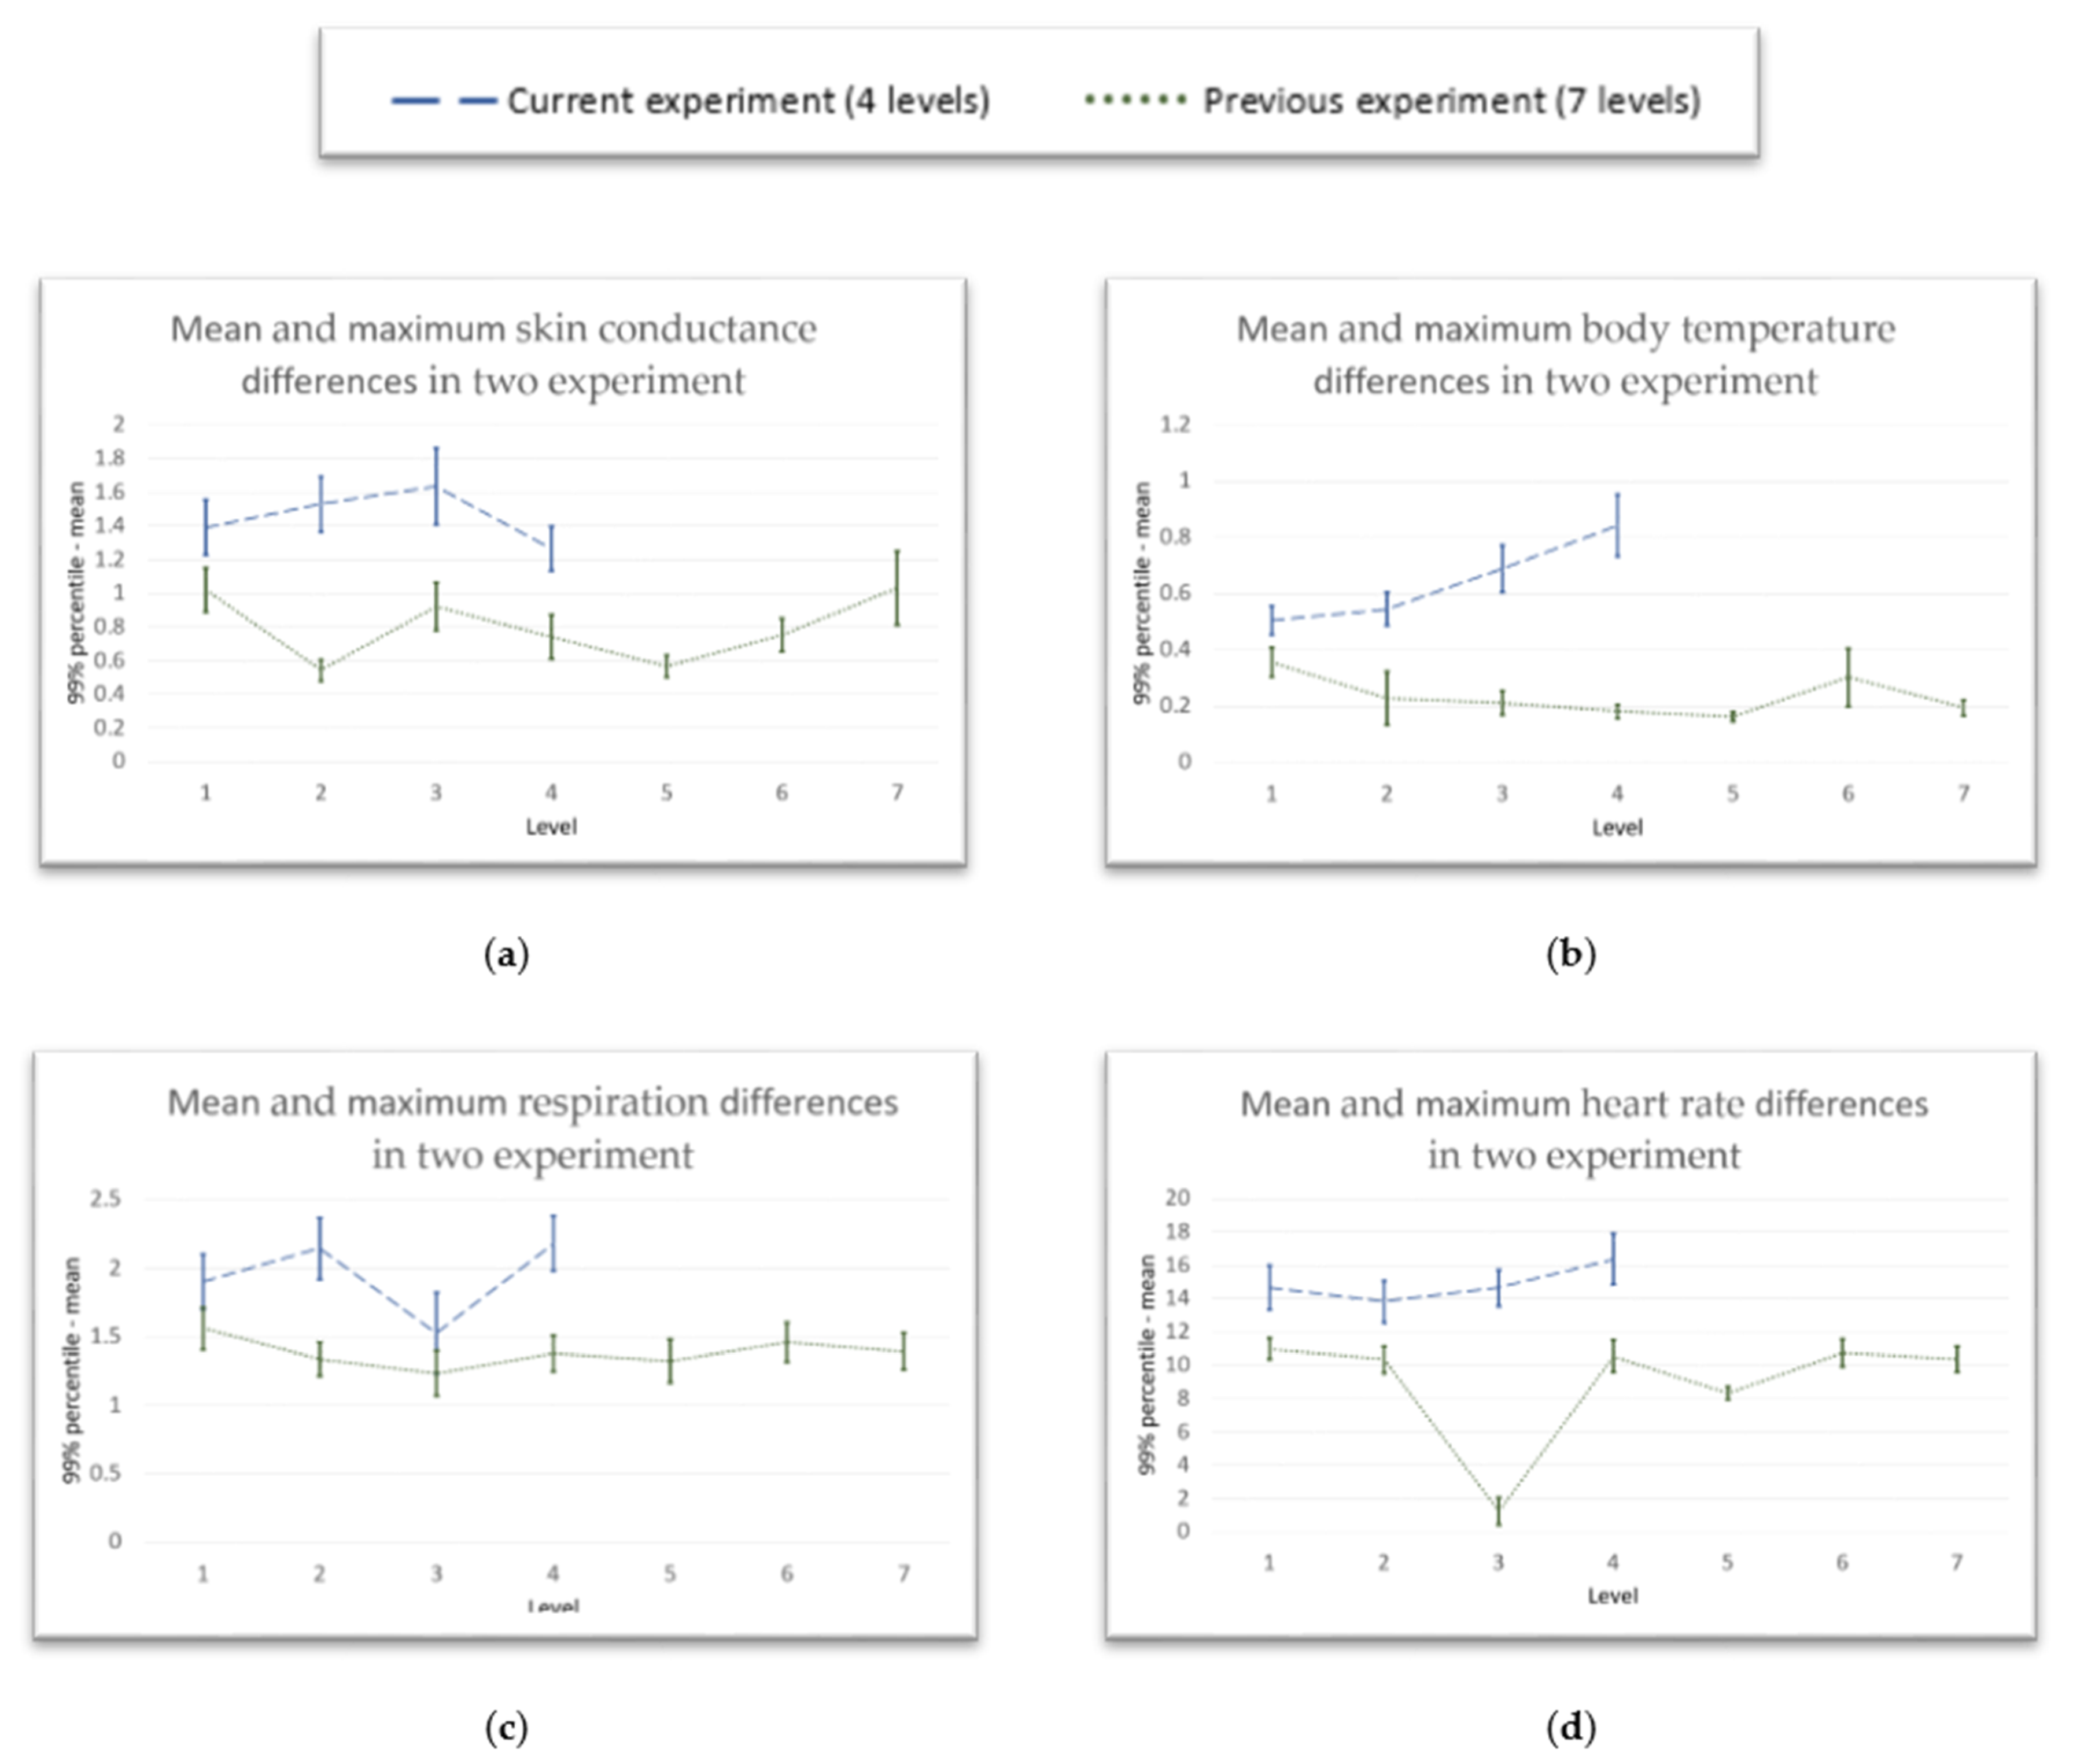
In our previous VRET experiment, we conducted a pre-test experiment with 31 subjects using a seven-level exposure therapy design (referring to [
11]). Some systemic problems were discovered during the experimental process since the environment was not realistic, which lessened the VR immersive experience. These problems were improved in this experiment with the programming of a more realistic environment, closer to actually driving a car. Comparisons of maximum and mean value differences for biofeedback data between the previous experiment and the current experiment were conducted. The subjects’ biofeedback shows significant differences between the two experiments. The results are presented in
Figure 10; the blue line represents the current experiment (4-level design) and green line represents previous experiment (7-level design).
Although we were unable to perform a pairwise comparison with our previous and current experiment, we observed an improvement with the enhanced immersive environment in the second experiment. The mean and maximum biofeedback differences collected from the current experiment are higher than the differences collected from the first experiment. The data show that subjects participating in the current experiment received increased intensity from a more realistic driving anxiety scenario. Although we have no evidence that VRET with a stronger anxiety-provoking scenario design will enhance the effectiveness of the treatment, the improved design with increased visual immersion induced a higher feeling of presence and improved driving performance on the part of the subject. VRET environments that increase the subjects’ anxiety are believed to be more effective for driving training and exposure therapy [
23].
5.3. Discussion of Experiment Outcome
An interesting result of our driving phobia experiment verifies that there are no significant difference between the TG’s post-treatment scores and CG scores for Q33~Q39, i.e., the questions related to driving in specific conditions as designed in our VRET scenario design. This result was not discovered in the previous study. The research leads to a new hypothesis that the driving phobia treatments are more effective when specific driving fear conditions or environment (e.g., darkness, high speed, bad weather, etc.) are designed into the VRET scenarios. Our current VRET sessions are constructed using four road scenarios and the subjects are aware that the experimental design is based on the scene changes during the experiment. Our original VRET design focused on observing the subjects’ biofeedback changes over different driving environments. More design changes were implemented to improve the realism of the experience of virtual driving. The driving environment changes, such as traffic jams or bad weather, which is often linked to anxiety-related-avoidance behavior, can be considered for the future VRET scenario designs. The result of the driving behavior survey supports that participating in VRET therapy will help people become increasingly comfortable with specific driving environments. Future scenarios will be tested and analyzed statistically, considering traffic events, traffic lights, bad weather, and the endurance of the treatment effect. In comparison to our preliminary VRET design, the latest VRET platform is proven to be more realistic with scenarios that are more anxiety-provoking and more effective in reducing distress through exposure.
6. Conclusions
Virtual reality provides a novel way of treating anxiety disorders in immersive environments. The subjects are gradually exposed to several levels and scenarios of traumatic stimuli (virtually), which complies with the systematic desensitization principle. The advantage of VRET is that it solves the problem of patients avoiding fear situations in traditional treatment and reduces the risk of physical injury for patients. Furthermore, the exposure intensity and time duration can be adjusted and the treatment can be terminated immediately to stop a panic attack. In addition, VRET can be used for treatment at more flexible times and allow patients to repeat specific scenes until they master their fears. The equipment is designed so that it is more convenient for doctors to monitor the patients’ physical and mental condition during ET treatment.
The research refines and verifies the VRET design, development, and experiment for driving phobia treatment. The experiment examined whether the TG subjects’ distresses were reduced after VRET and showed that fears of driving were effectively reduced. A survey of 121 subjects used a median split to create two groups: one high on fear of driving and one low on fear of driving. The two groups were t-tested as being significantly different in fear levels. From the sixty with a relatively high fear of driving, 30 were randomly selected while waiting in queue as the TG to participate in the VRET experiment. The 30 subjects in the TG provided biofeedback during VRET treatments for analysis. At the end of the experiment, the subjects in TG were asked to fill out the same self-measurement driving behavior survey. According to survey results, there was significant post-treatment improvement. The fears of driving were reduced to the same levels as drivers in CG (i.e., their anxious driving and anxiety-related-avoidance behaviors had no significant differences). In the research, the immersive experience of VRET also showed significant improvement as indicated in the biofeedback data analyses. In conclusion, the survey results and the data demonstrate the effectiveness of VRET for driving phobia treatment. Although significant progress has been made with VRET treatments in this research, driving phobias and other PTSDs are still far from satisfactory treatment. For future research, the development of an intelligent VRET that is customized with customized treatment programs based on individual patient’s fear is a challenging direction. While conducting the experiment, the subjects’ degrees of fears can be monitored and analyzed simultaneously and constantly with advances in computing technology. Thus, a self-adaptive smart VRET system that automatically adjusts the exposure therapy to ensure safe and effective customized treatment is the future research goal.

 ,
, 


