Article

Parametric Analysis of the Shear Lag Effect in Tube Structural Systems of Tall Buildings

Department of Structures, Faculty of Civil Engineering, University of Zagreb, 10000 Zagreb, Croatia
*
Author to whom correspondence should be addressed.
Appl. Sci. 2021, 11(1), 278; https://doi.org/10.3390/app11010278
Submission received: 8 December 2020 / Revised: 24 December 2020 / Accepted: 24 December 2020 / Published: 30 December 2020
(This article belongs to the Section Civil Engineering)

Abstract

:
Horizontal loads such as earthquake and wind are considered dominant loads for the design of tall buildings. One of the most efficient structural systems in this regard is the tube structural system. Even though such systems have a high resistance when it comes to horizontal loads, the shear lag effect that is characterized by an incomplete and uneven activation of vertical elements may cause a series of problems such as the deformation of internal panels and secondary structural elements, which cumulatively grow with the height of the building. In this paper, the shear lag effect in a typical tube structure will be observed and analyzed on a series of different numerical models. A parametric analysis will be conducted with a great number of variations in the structural elements and building layout, for the purpose of giving recommendations for an optimal design of a tube structural system.

1. Introduction

Today, most of the mid to high tall buildings are built with tube structural systems. This type of system is known for its circumferential frame structure composed of closely placed columns and high beams, forming a tubelike box cross section, whose main purpose is to resist horizontal loads such as winds and earthquakes. On the inside of the building, additional columns may be found for bearing only vertical loads. Additionally, a combination of a tube structure with a central core is quite often, thus further enhancing the stiffness of the structure. The greatest advantages of the tube structural system are the ability to build very tall buildings, the enhanced stiffness of the building, the possibility of construction in various materials such as reinforced concrete and steel, possibility to use prefabricated elements for the purpose of repeating the floor dimensions and plans, and finally, a much-desired openness for the interior design of the building. Aside from very small openings that are a direct result of the column spacing on the exterior of the building, the most significant shortcoming of the tube system is the shear lag effect [1]. This effect is also very common in other structural systems of tall buildings [2,3,4] which will be discussed in detail in chapter 2 of this paper.

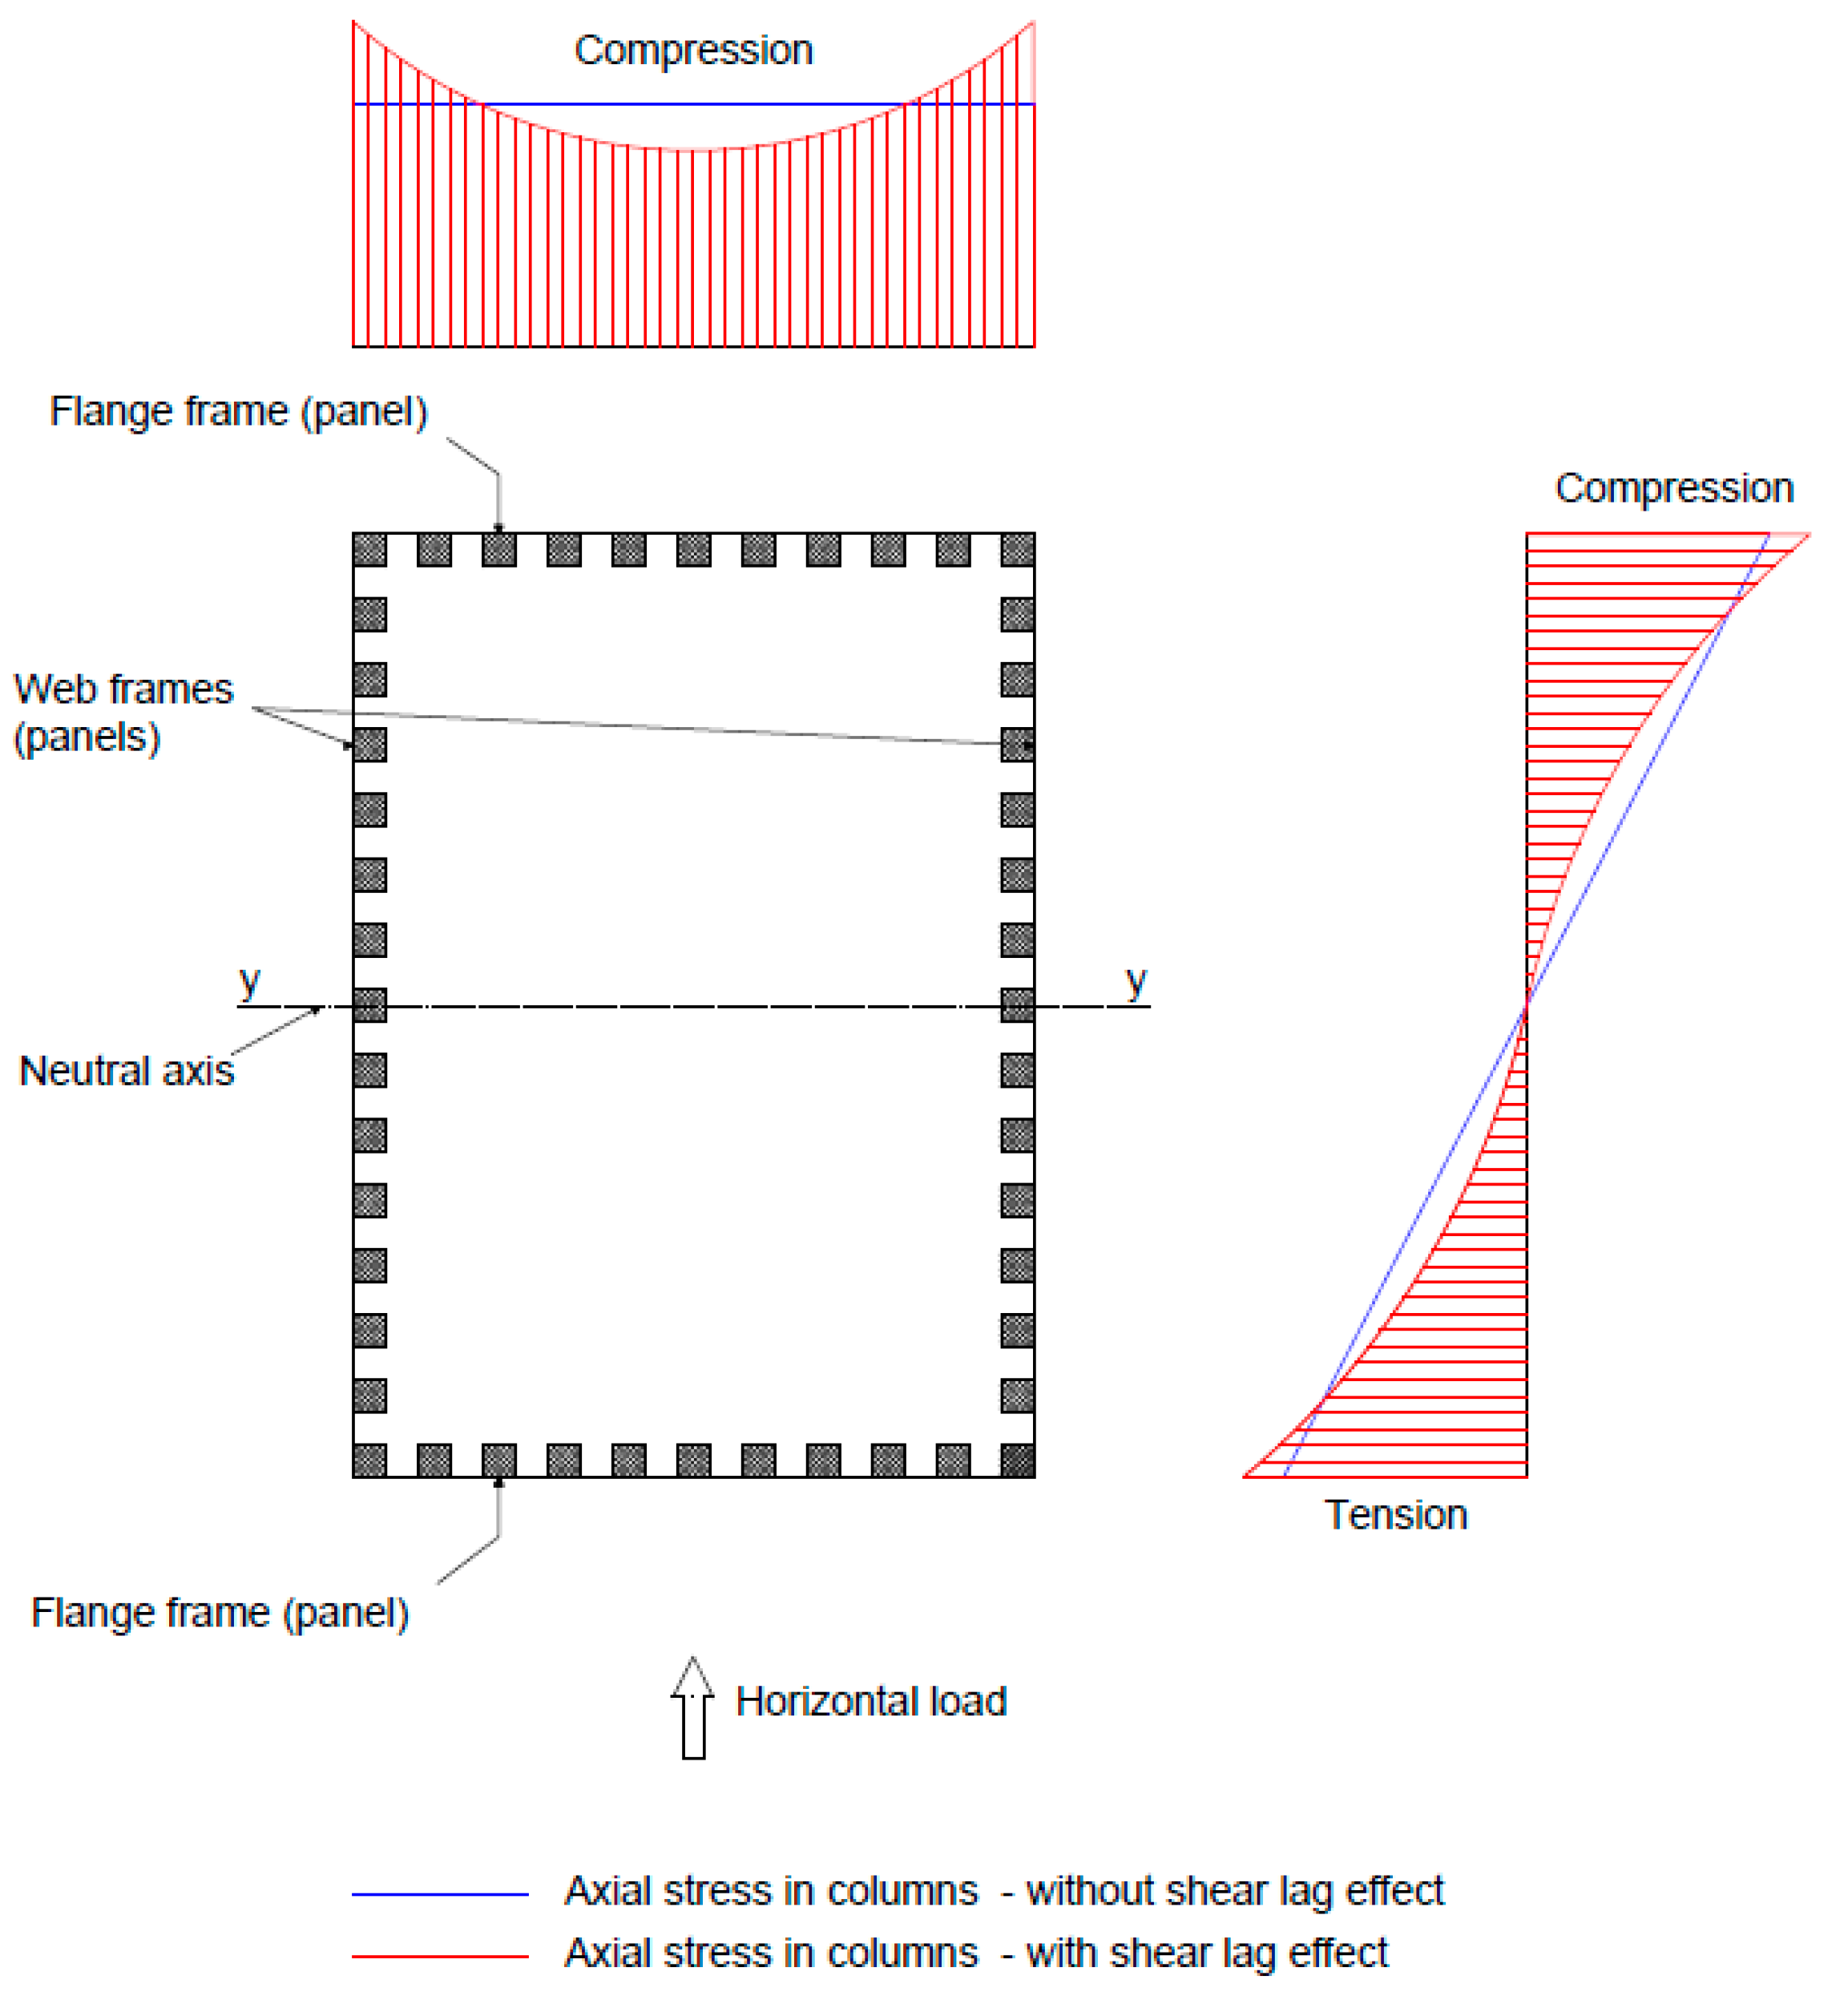
2. Shear Lag Effect in Tube Structural Systems

As mentioned previously, this type of structural system is derived from the rigid frame system, which implies that the exterior columns, which form the tube, are closely spaced and connected with high beams on every floor. So, it can be concluded that the tube system consists of multiple very rigid and connected frame panels which, while bending, act as webs and flanges of a tube cross section. During a horizontal load, due to their flexibility, beams in the web and flange frames deform in bending. This results in the increase of axial forces in the columns at the end of the frame panels and the decrease of axial forces in the columns towards the middle of the panel. Consequently, deformations occur in the floor slabs and the interior secondary elements which leads to the Euler-Bernoulli beam theory bending of cross sections being no longer valid. Hence, the distribution of stress becomes nonlinear and very complex [5]. The nonlinearity is found in the flange frames (frame panels perpendicular to the direction of the horizontal load) as well as in the web frames (frame panels parallel to the direction of the horizontal load). This phenomenon can be seen in Figure 1 and is known as the positive shear lag [6].
On the other hand, the negative shear lag effect is characterized with increased axial forces in the columns in the middle of the panels (Figure 2). To explain this phenomenon, a simple box section 5000 mm high cantilever model is used, loaded at mid-height by point load (Figure 3a) and uniform continuous load (Figure 3b). This model is introduced as an illustrative example, and as such it comprises a rectangular thin-walled steel section consisting of 1000 mm wide and 100 mm thick panels. These panels are modelled each with 10 shell elements along the panel width allowing an in-plane shear deformation which is responsible for shear lag effect. The stresses of the flange opposite to the load are shown in the graphic, ranging from zero (dark blue) to maximum compression (red). Iso-areas of the same color show matching stress levels on the panel surface, thus allowing sections with positive or negative shear lag to be recognized. Since the value of the bending moment and the shear force at the free end of the cantilever equal zero, the flange stays undeformed in this position. On the fixed end of the cantilever, positive shear lag occurs due to the longitudinal shear in the flange. Due to the compatibility of deformations for all adjacent sections between the beginning and the end of the cantilever, stresses of the opposite distribution occur along the height as we move away from the fixed edge (negative shear lag). On the quarter of the cantilever length, closer to the fixed end, the axial stresses are almost equal along the whole flange width for the point load, while for continuous load some negative shear lag occurs at that section. So, in conclusion, the negative shear lag effect is a result of the compatibility of displacements (the cross section at the end of the cantilever must be straight and in-plane) [7].
The first researches of the shear lag and the effect it has on different structural systems date back to the 1980s [8]. In the very beginning this phenomenon was examined in steel and concrete girders, mostly bridges. Researches involving steel box girders and bridges were the most prominent ones [8,9,10,11]. In [9,10] theoretical foundations for the shear lag effect are given with a special emphasis on steel box girders. At about the same time [8,10,11] basic mathematical models and formulas for the calculation of the shear lag effect in box girders were given. While in [8,11] the focus is set on the positive shear lag effect and the shear lag effect in general, in [10] the focus is set on the negative shear lag effect and the calculation methods that would best approximate it. However, this effect is quite a problem in tube structural systems of tall buildings as well. Although this effect was mostly examined in detail in box girders and bridges, the first mathematical expressions for tall buildings were set in the 1990s [12]. In [12] a mathematical model for the preliminary design of the shear lag effect in tall buildings is given. In the proposed method, independent distributions of axial displacements are used for the web and flange panels and thus the shear lag in each panel is individually allowed for. Lastly, it is deduced that the shear lag effect is dependent on the type of the horizontal load and that the positive shear lag effect is greater at the base of the building than the negative shear lag is at its top. A great advancement in theoretical knowledge is seen mostly in the complexity and preciseness of analytical methods like the one shown in [13]. In this research the shear lag effect in tall tube structures is shown regarding the axial stresses and displacements of columns. At the same time, the first computer-based models for this phenomenon are developed. According to [14] a simple model is developed for the purpose of the calculation and design of a tube structure under horizontal loads. Additionally, an expression to assess the horizontal displacement of a tall building is given with the shear lag effect considered while developing the said expression. In [5] a much more complex computer-based program is developed using a 40 storey tall tube structure. It is also confirmed that the positive shear lag effect is related to the lower storeys and that the negative shear lag is related to the higher storeys of the building. Finally, it is concluded that the positive shear lag is the source of the negative shear lag. At the beginning of the 2000s the analysis of this phenomenon is expanded to more complex structural systems like tube in tube structures [15,16,17] where it is deduced that the negative shear lag effect is more prominent at the lower part of the interior tube than at the lower parts of the exterior tube. Furthermore in [17] exact analytical expressions are given for the calculation of the shear lag effect in this type of structural system. On the other hand, in diagrid structural systems the shear lag effect is mainly influenced by two parameters, the angle under which the exterior diagonal columns cross each other and the way the shear lag effect is taken into account in the preliminary design of structural elements [2,18]. The next step in the research of the shear lag effect was the pursuit of ideas and ways to minimize its impact. In [6] the optimal angle under which the exterior bracings cross to minimize the shear lag effect is given. In [19] a similar analysis is conducted with the tube structural system and diagonal bracing where the shear lag effect in an ordinary tube structure is compared to its effect in a tube structure with diagonal bracing. It is deduced that the implementation of diagonal bracing has a great impact on the shear lag effect and that the angle at which the diagonals are placed is the most important factor to consider. Furthermore, according to [20] the use of two diagonals in an “X” like fashion is much more efficient than the use of one diagonal in any configuration regarding the decrease of the shear lag effect. The same principle of bracing can be used for tube in tube structural systems [21]. In recent years, the research conducted is mostly based on parametric analysis of different structural systems [22,23,24,25]. In [22] a parametric analysis is conducted where the main parameter being varied are the layout dimensions of the building. The main idea is to see how the ratio of the layout dimensions of a rectangular shaped building affects the buildings behavior when subjected to strong winds. Even though the shear lag effect is not addressed in this paper per se, an insight is given into the optimal ratio of layout dimensions for a tall tube structure. In [23] besides the ratio of layout dimensions of a tube structure, the effect of column spacing is also taken into account. In their research it is concluded that the layout dimensions of a tube structure have no or minimal impact on the shear lag effect. Furthermore, it is stated that the column spacing has a greater impact in the negative shear lag area of the building than in the positive shear lag area of the building. In the end, the impact that diagonal bracing placement on the exterior of the structure has on the shear lag effect is examined. A similar analysis is conducted in [24] where the use of mega bracing in tall buildings is studied with the conclusion that the X pattern diagonal bracing shows the most promising results regarding the reduction of the shear lag effect.
In this paper the impact of the negative and positive shear lag effect on a tall tube structure will be analyzed in detail. Using a computer-based model a parametric analysis will be conducted with a series of different parameters being varied with the main purpose of detecting the critical height of the tall building where the transfer from positive to negative shear lag occurs. Besides that, the impact of every parameter variation on the shear lag effect will be shown. The parameters that will be examined include the ratio of column spacing and column dimensions, the ratio of storey height and the height of connecting beams, the ratio of the layout dimensions of the entire building, and the type (profile) of horizontal load being used. In the end, the main goal is to find the optimal layout dimensions of a tall building with a tube structural system and the optimal dimensions of the structural elements that are used in it.

3. Overview of the Existing Tall Buildings with Tube Structural System

To set the boundaries of parameters for the computer-based model, an overview of the most significant buildings with the tube structural system is given. The parameters that were included are: material used, storey height, building height, layout dimensions, column spacing and column dimensions (Table 1). According to most used parameter values range, a computer-based template model is developed.

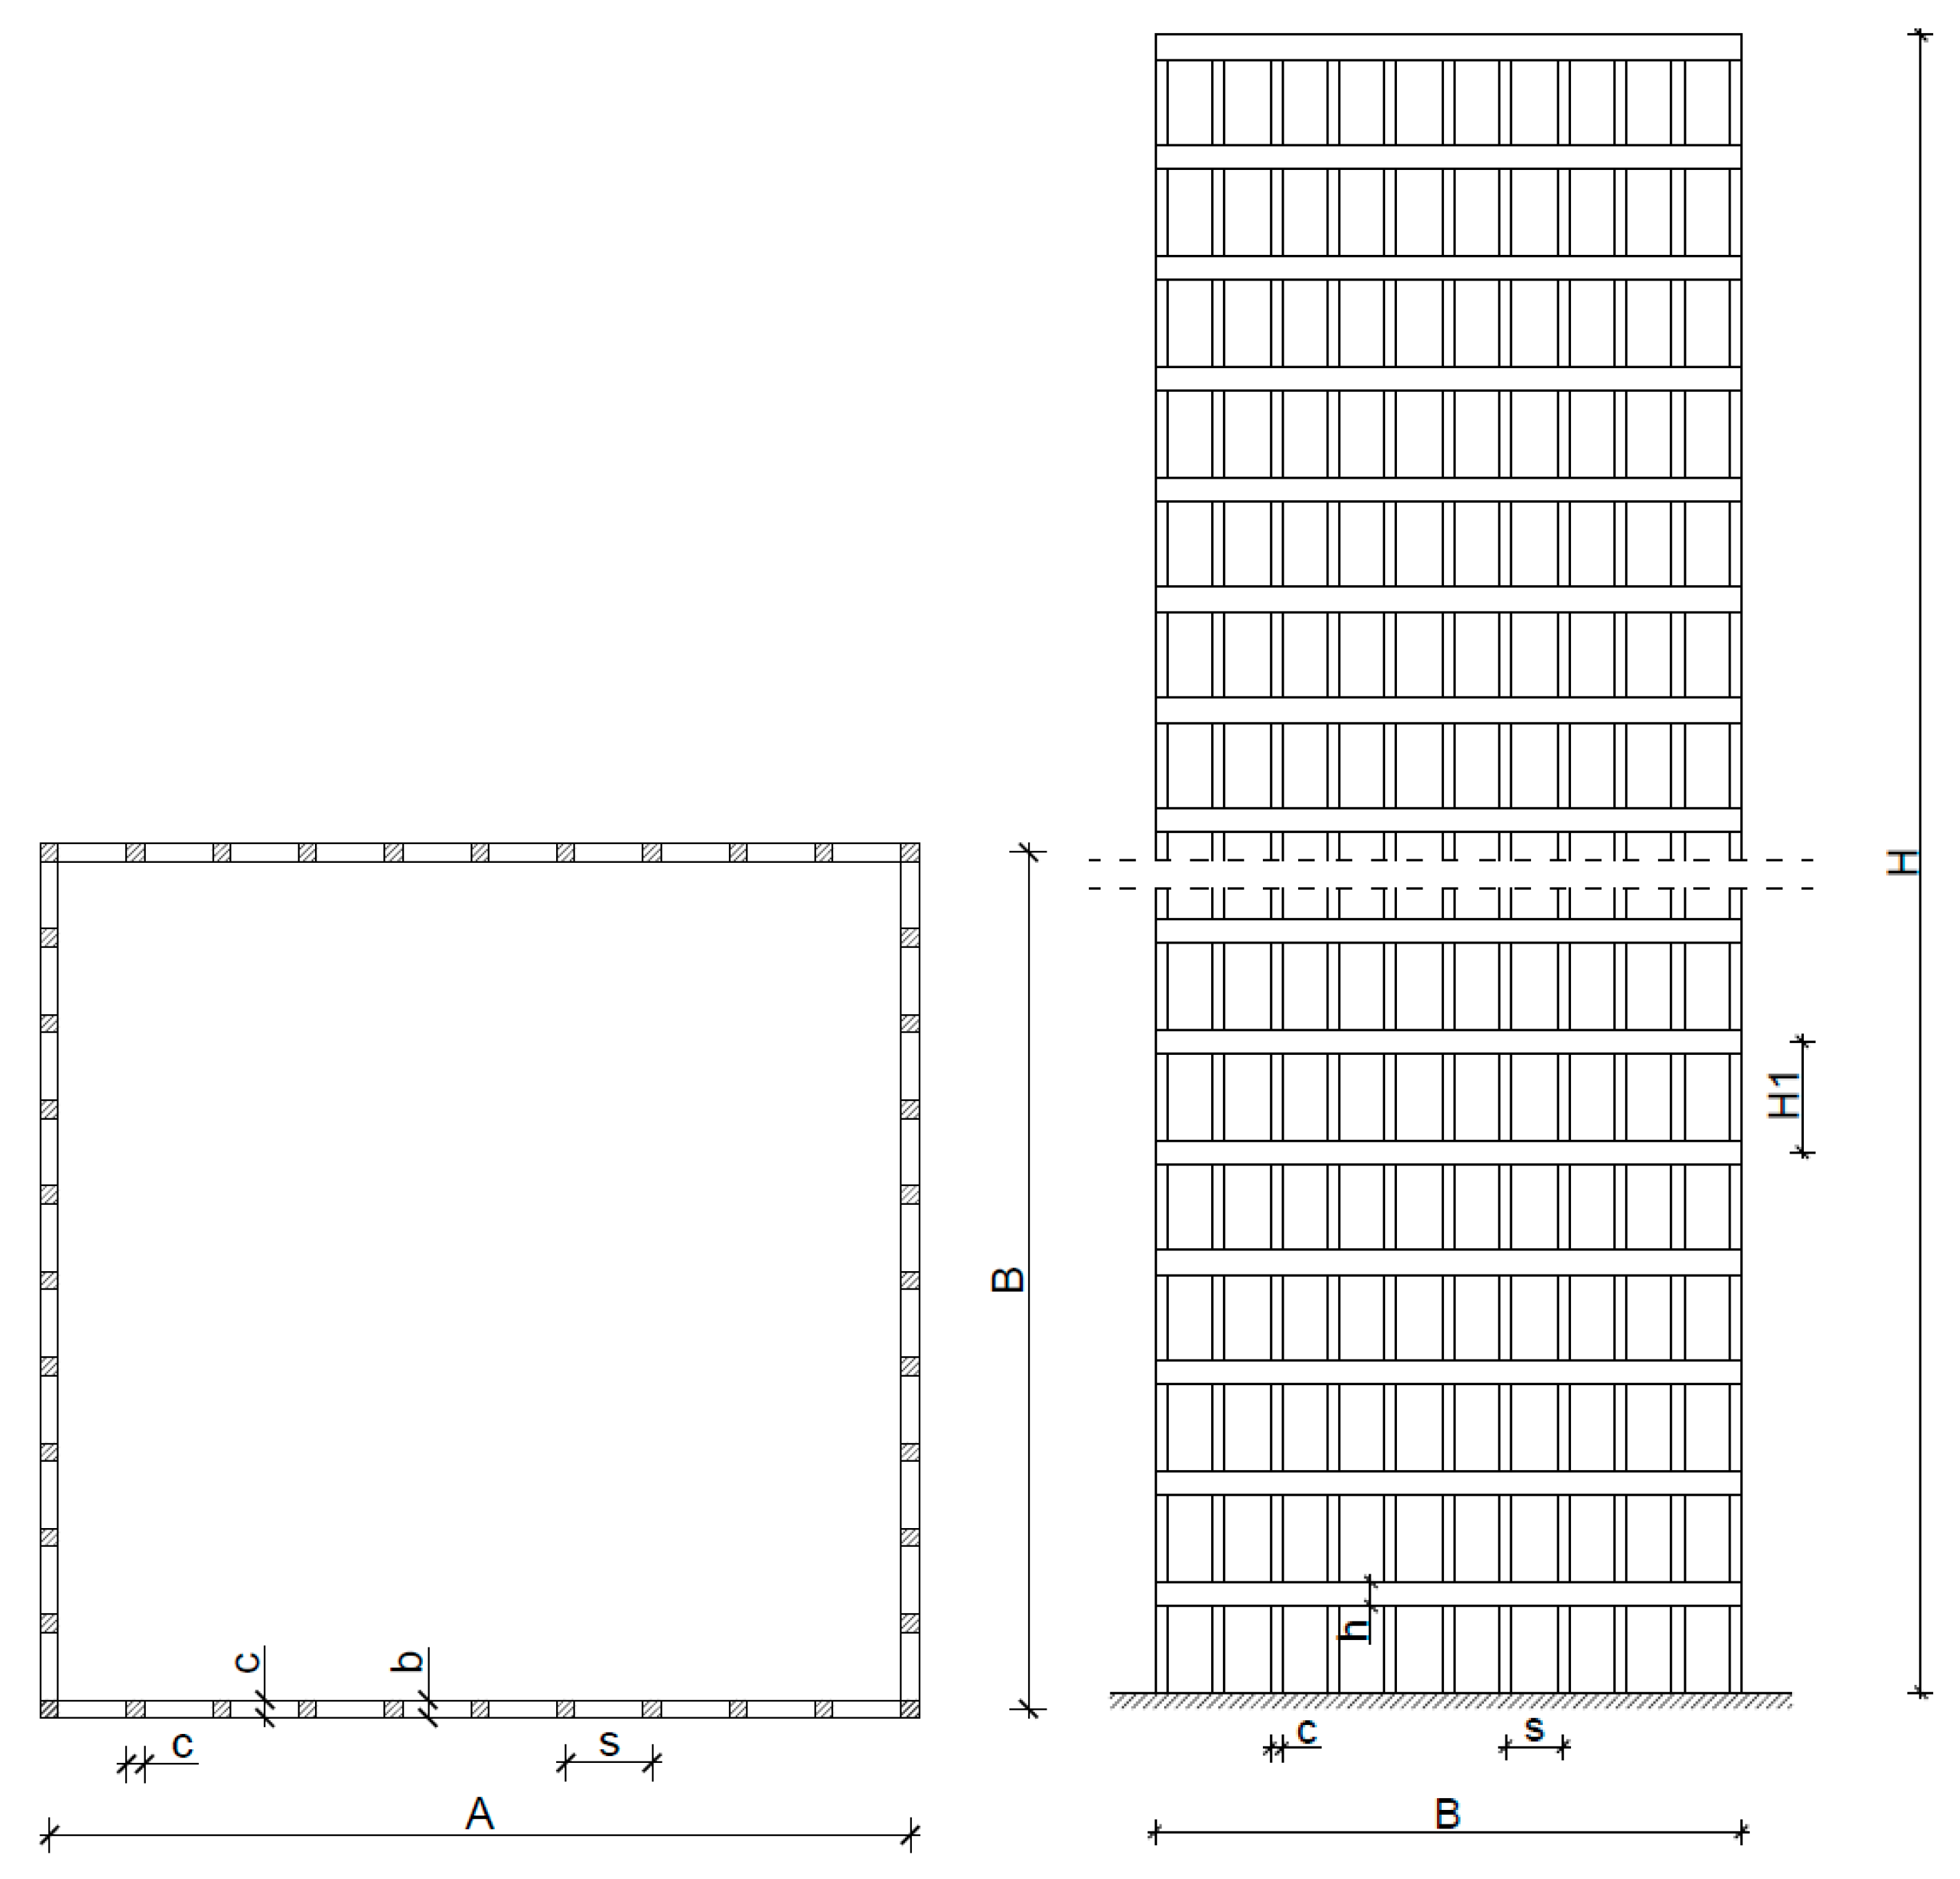
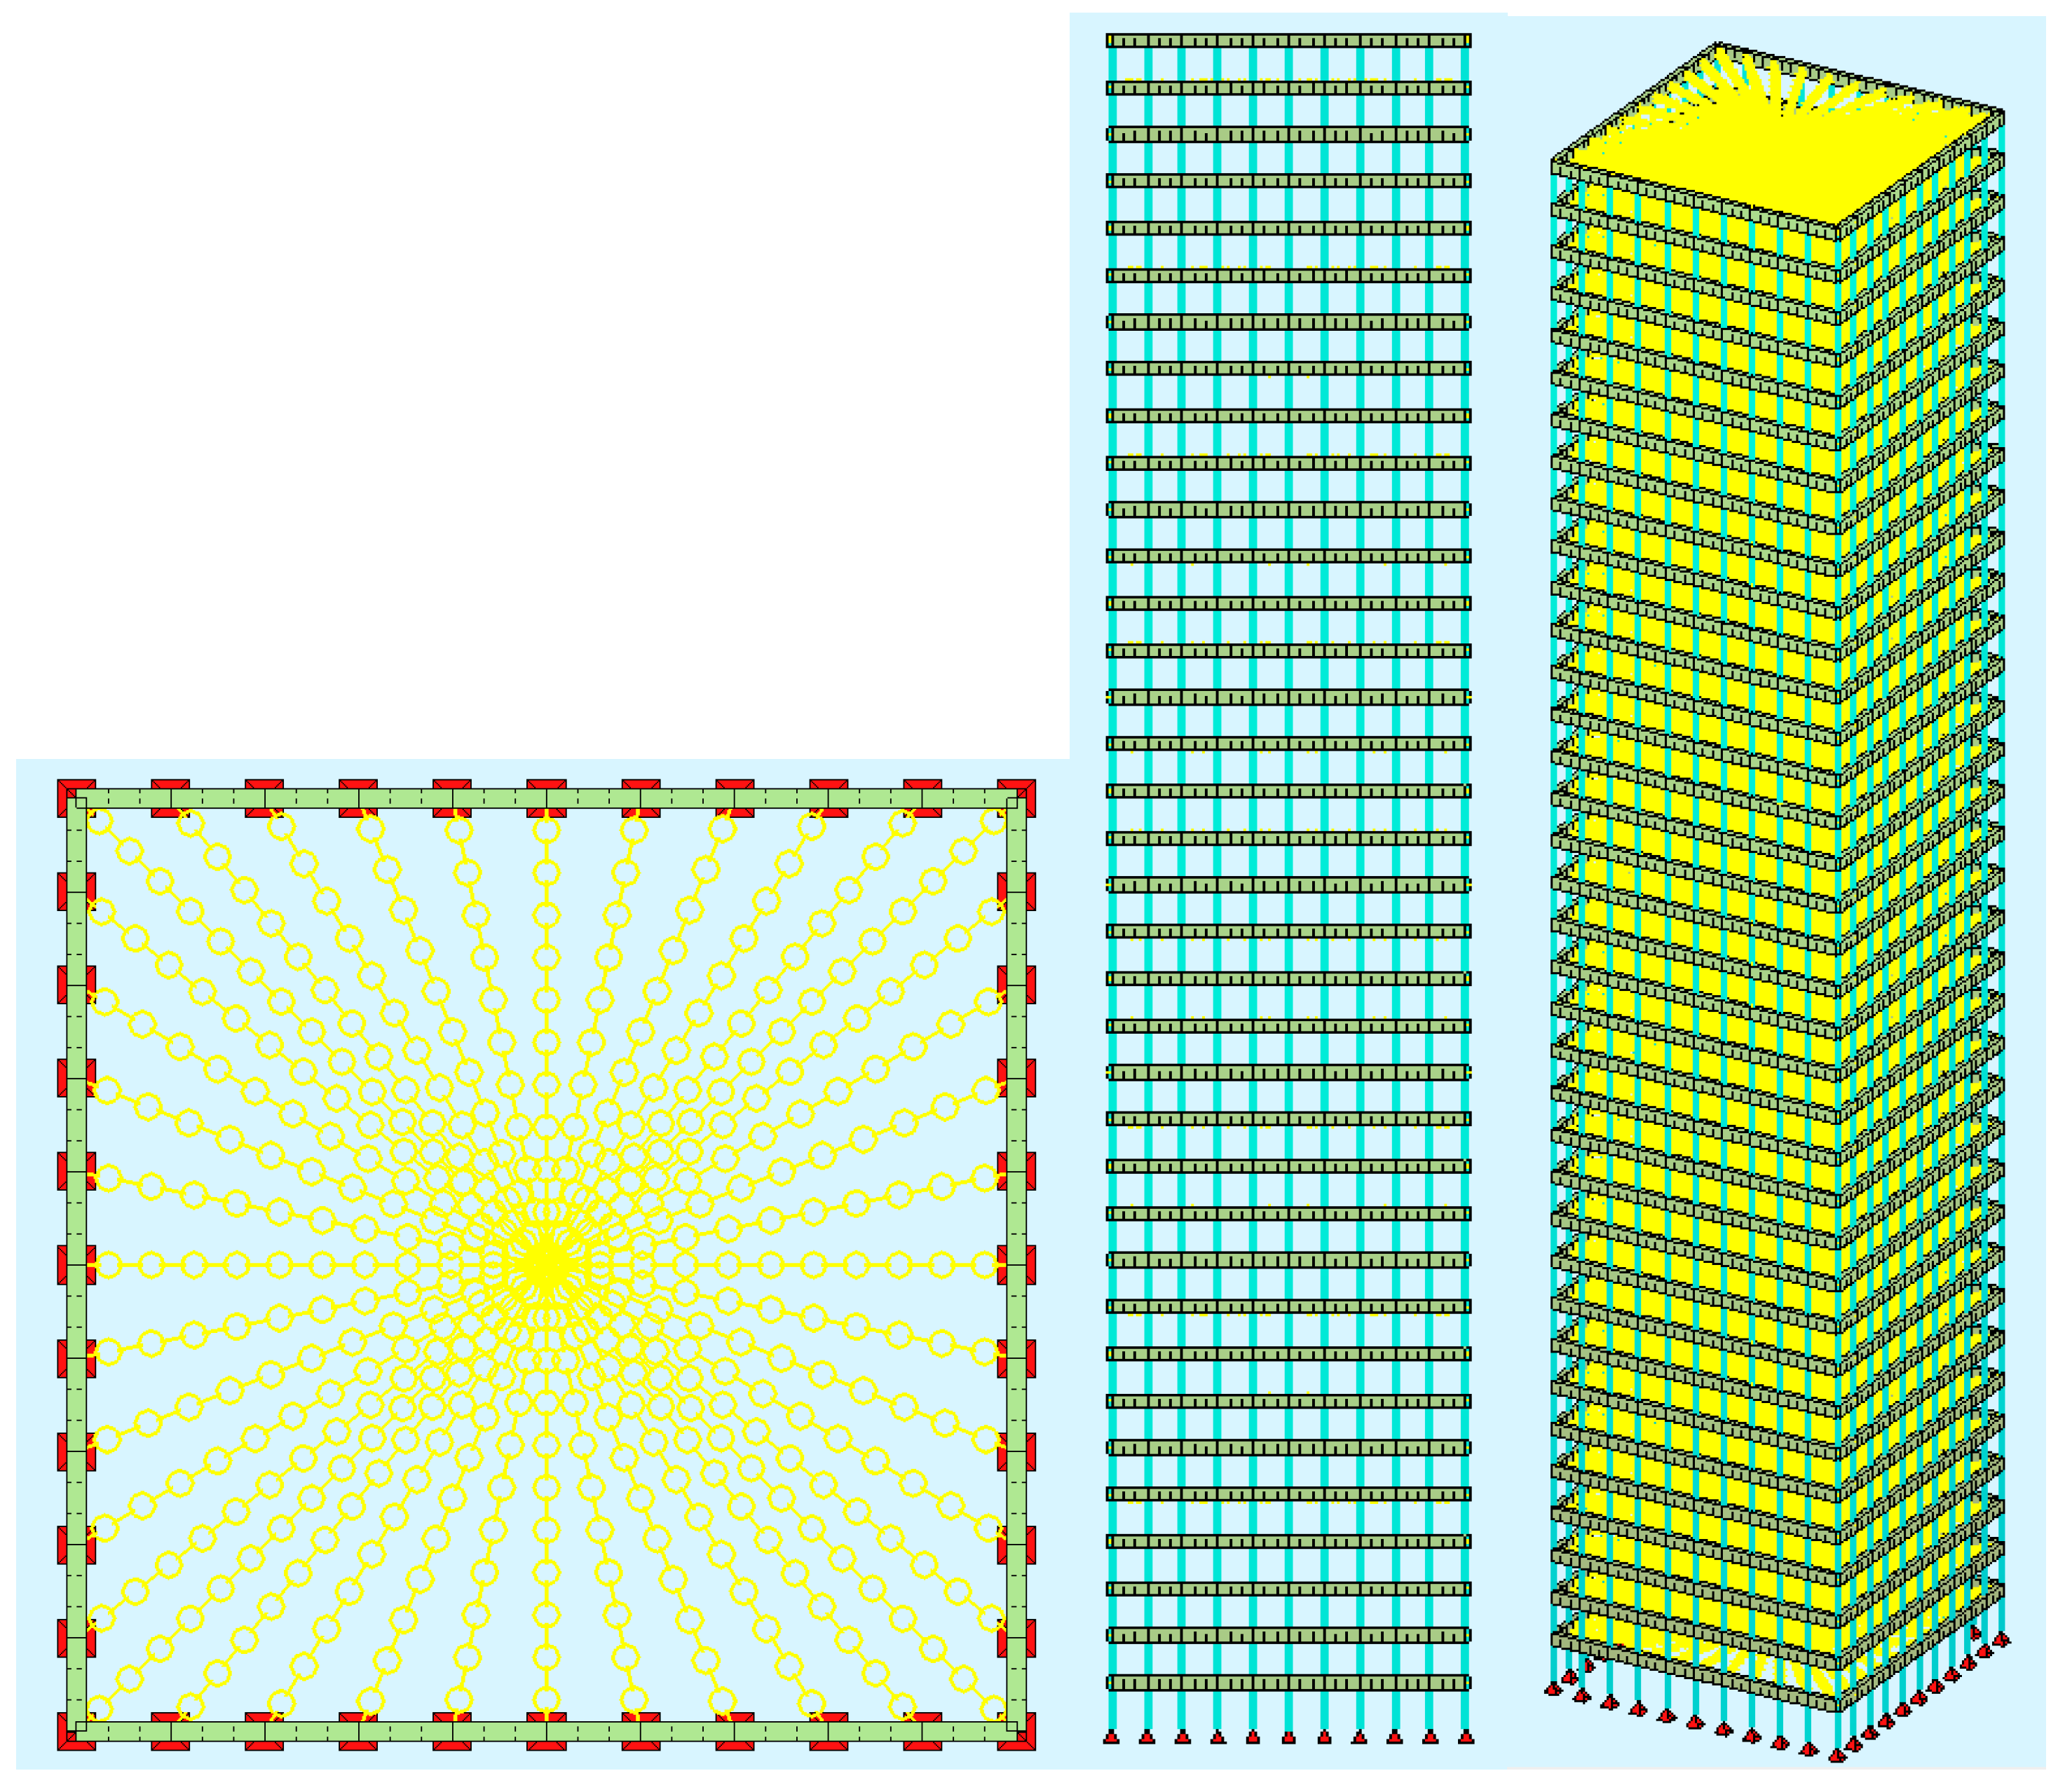
4. Computer-Based Model of the Tube Structure

A parametric analysis was conducted in SOFiSTiK 2020 software. Based on the preliminary analysis provided in the previous chapter, dimensions of the building and construction elements are chosen for the purposes of forming a computer-based model (Figure 4):
-
Layout dimensions of the building: A/B = 24 m/24 m
-
Connecting beam dimensions: b/h = 0.5 m/1.0 m
-
Square column edge dimension: c = 0.5 m
-
Column spacing: s = 2.4 m
-
Storey height: H1 = 3.5 m
-
Building height: H = 126.0 m
-
Number of storeys: 36
The columns and beams are modelled with one dimensional finite elements (6 degrees of freedom), and assigned a corresponding cross section properties (moment of inertia for both axis, sectional area, shear deformation area, torsional moment of inertia, warping modulus and concrete material linear properties) according to column or beam member dimensions. They are connected with a fixed connection at the intersection of their axes, allowing the transfer of moment, shear force and axial force. Floor slabs are modeled as rigid diaphragms (Figure 5), by coupling of the nodes in the same storey to joint in-plane movements and rotations (flexible slab—rigid disk behavior), as allowed and recommended by Eurocode design code A linear statical analysis is performed.
The building is loaded with the dead load (no additional vertical loads were considered besides the dead load) of all structural elements and wind load uniformly distributed along the height. The value of the uniformly distributed load is determined as the maximum expected value based on EN 1991-4 [26] while considering the top of the structure as a reference height. In addition, an actual wind profile will be used in the parametric analysis that is also calculated by EN 1991-1-4 [26]. The horizontal loads are concentrated at each intersection of beams and columns (Figure 6).
The shear lag effect is observed throughout the building’s height. In Figure 7 the shear lag effect is shown in seven characteristic storeys ranging from the 2nd to the 36th storey. On the horizontal axis from left to right eleven columns are placed and on the vertical axis the coefficient α is given. This coefficient shows the ratio of the compressive force in a given column to the compressive force in the middle column. Conclusively, the value α = 1 applies to the column in the very middle, that is to column number 6 (Figure 7). By the values shown in Figure 7 it is clear that in the lower storeys (2nd and 6th) the positive shear lag is prominent and by moving towards the building’s top its impact diminishes with the negative shear lag rapidly increasing. At the 12th storey it is noticeable that the shear lag effect is practically non-existent so at this position it is considered that the positive shear lag morphs into the negative shear lag.

5. Parametric Analysis

The parametric analysis will be conducted with four main parameters (Figure 4):
(1)
s/c—the ratio of column spacing perpendicular to the horizontal load direction and column dimension, ranging from 4 to 6, in every next model variation one column is removed to maintain a constant building layout)
(2)
H1/h—the ratio of storey height and beam height (ranging from 2.9 to 4.4 with the increment of 0.1 m)
(3)
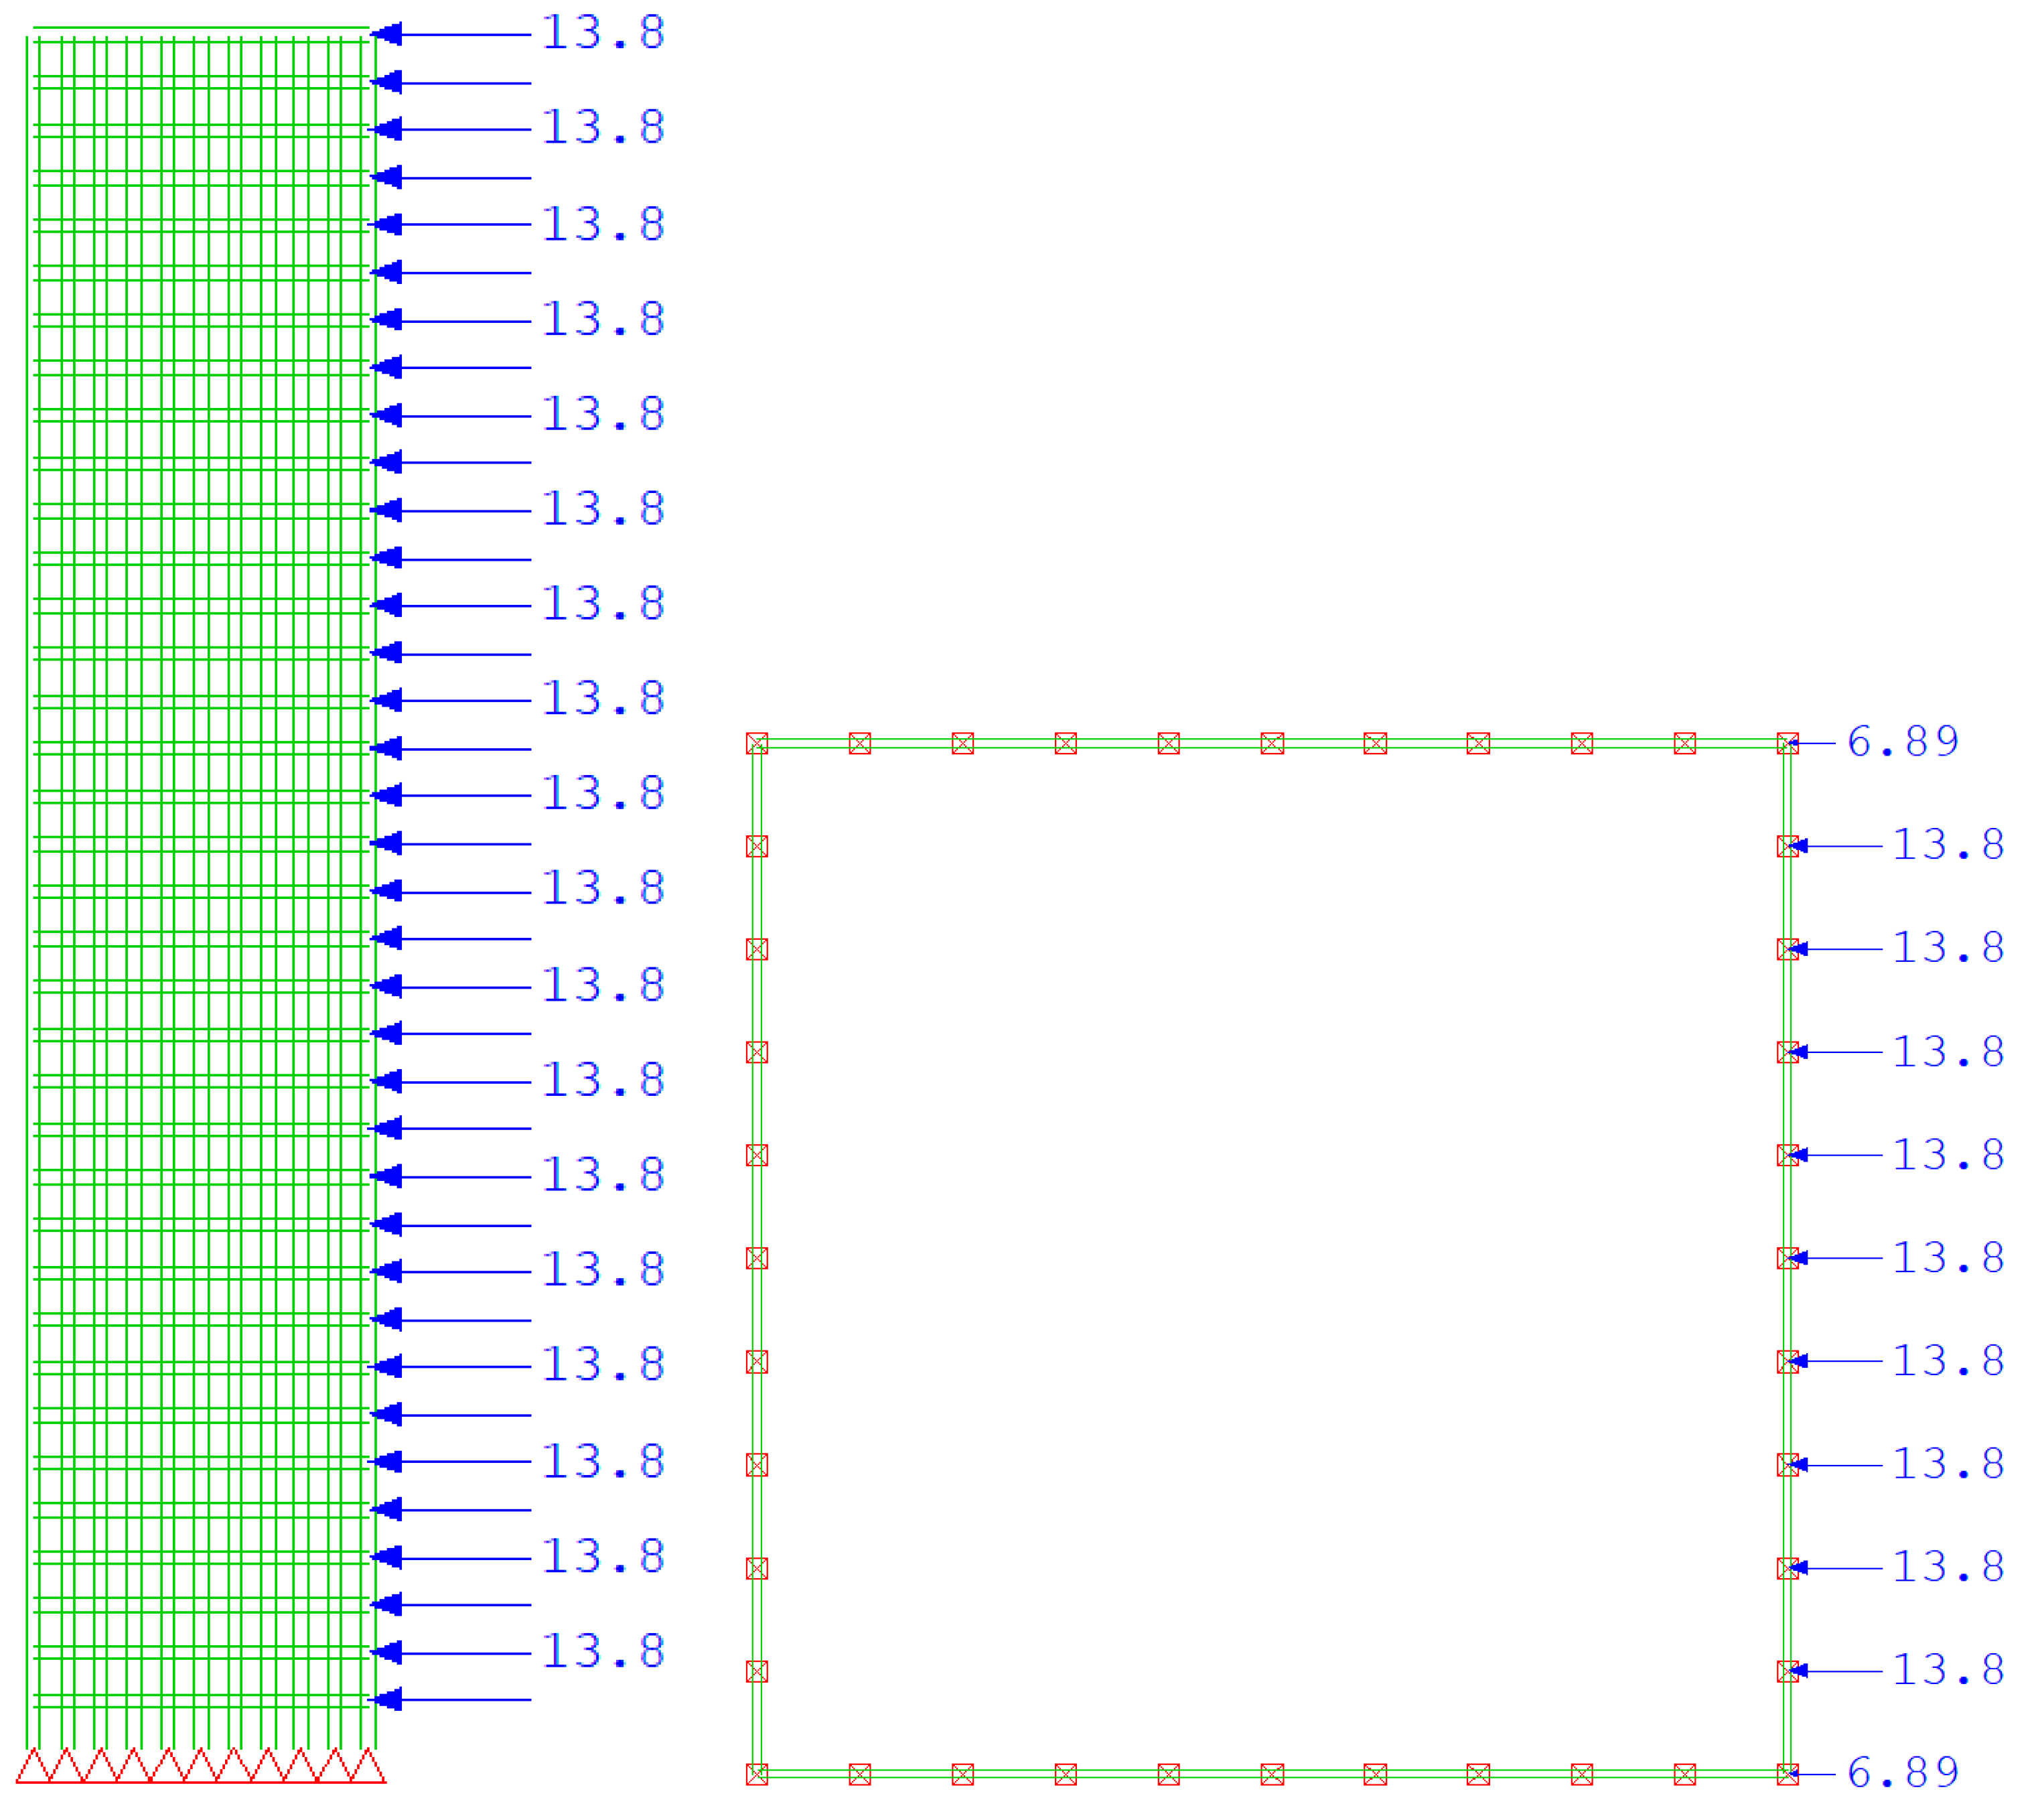
A/B—the ratio of building layout dimensions (ranging from 0.55 to 1.0, in each step two columns are removed on the side of the building perpendicular to the horizontal load to maintain constant column spacing
(4)
horizontal load profile
The parameters kept constant throughout the analysis are the column dimensions (c = 0.5 m), beam width (b = 0.5 m), storey height (H1 = 3.5 m), layout dimension of the building parallel to the horizontal load (A = 24 m) and the entire height of the building (H = 126 m). The rest of the parameters are variable. The results are shown in diagrams below. The variable parameters (s/c, H1/h, A/B) are shown on the X axis, and coefficient β on the Y axis. Coefficient β is defined on Figure 8. Half of the flange panel of the tube structure is observed (Figure 8, in red) that is located on the opposite side of the horizontal load. In Figure 8 the case of the positive shear lag is shown. The number of columns in this case is N = 5.
Coefficient β is defined as follows:
β = nβ/n,
where:
n—actual number of columns in half of the flange panel (in the case of uneven number of columns, a half of the column is used)
nβ—number of columns involved in the transfer of loads calculated in Equation (2) for half of the flange panel
nβ = ∑ Fi/F1,
where:
ΣFi—sum of axial compressive forces in columns (F1 to F5)
F1—compressive force in the edge (first or last) column of the flange panel
Therefore, if the axial force on the edge of the flange panel (F1) is the one with maximal value, then the flange panel is under positive shear lag. On the other hand, if the same force is given with its minimal value, then the flange panel is under negative shear lag. Additionally, it is then clear that the location with the value of coefficient β = 1 is the location in which no shear lag effect exists (the positive shear lag ends and the negative one begins). Accordingly, β < 1 applies to positive shear lag and β > 1 applies to negative shear lag. Finally, as the value of β moves away from the value equal to 1, either less or more, the shear lag positive or negative, increases. For the positive shear lag, it means that as the value of β decreases (moves away from the value equal to 1), the positive shear lag increases. For the negative shear lag, it means that as the value of β increases (moves away from the value equal to 1) the negative shear lag increases.

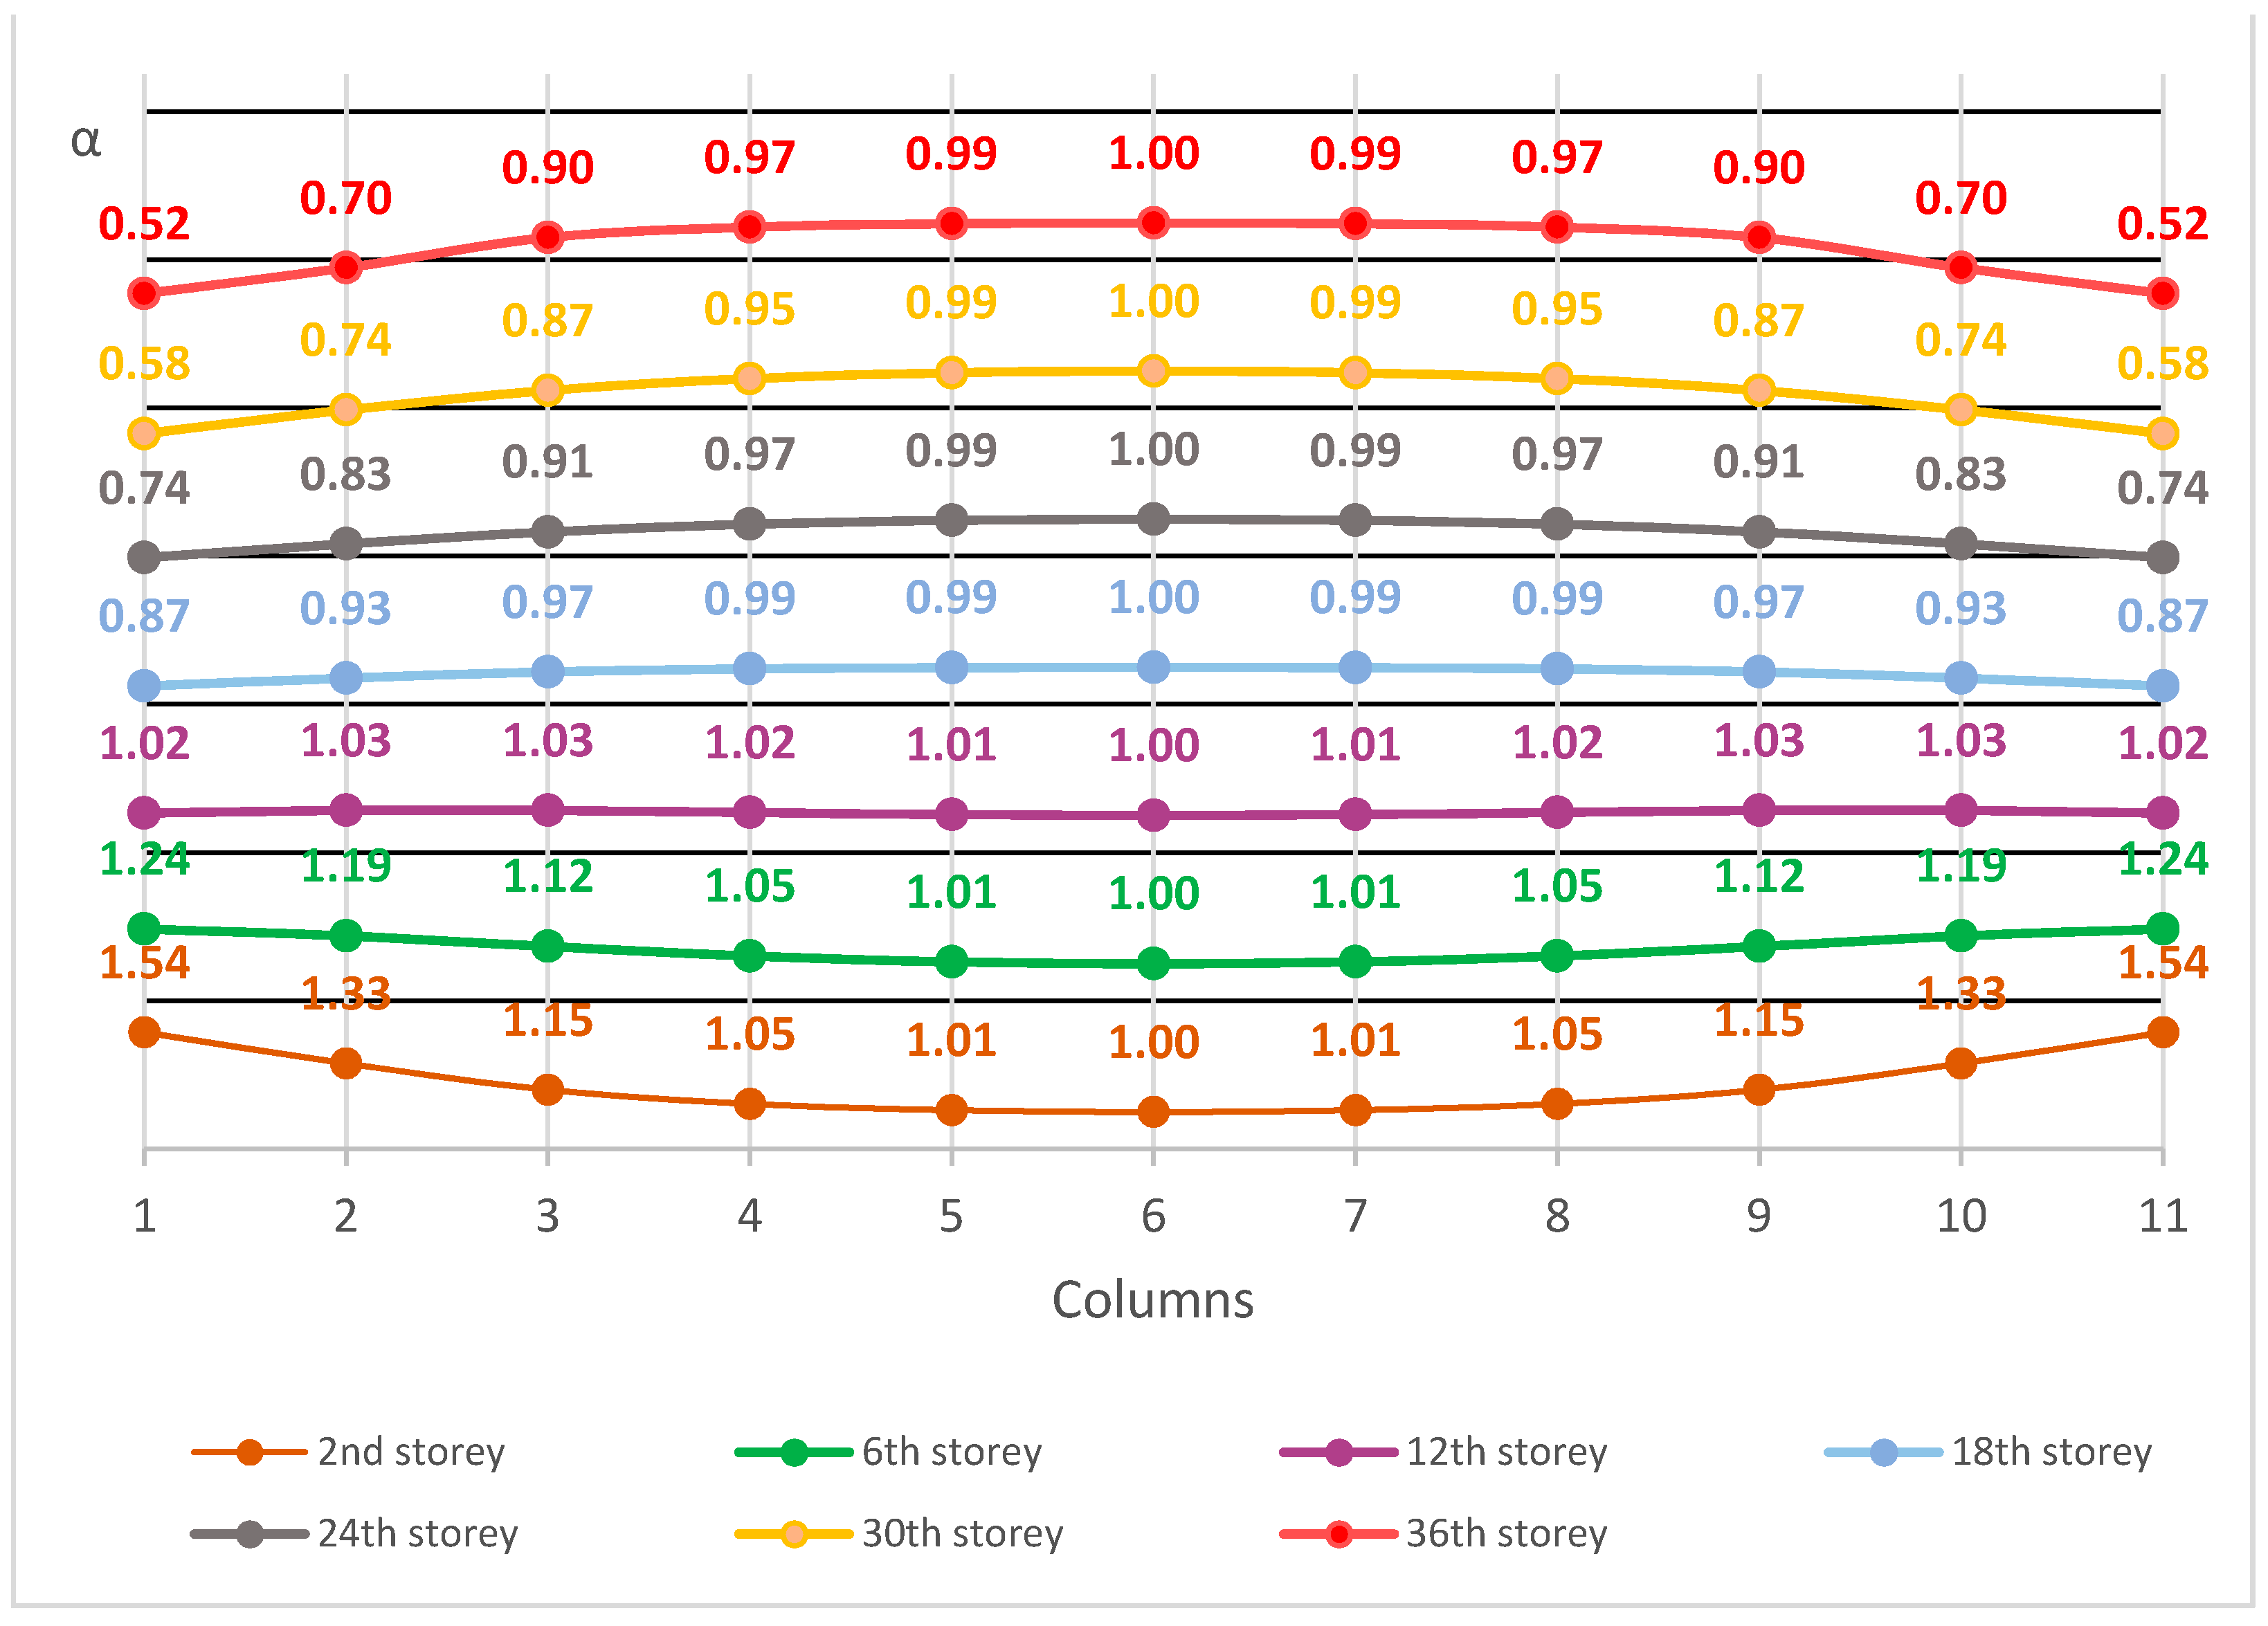
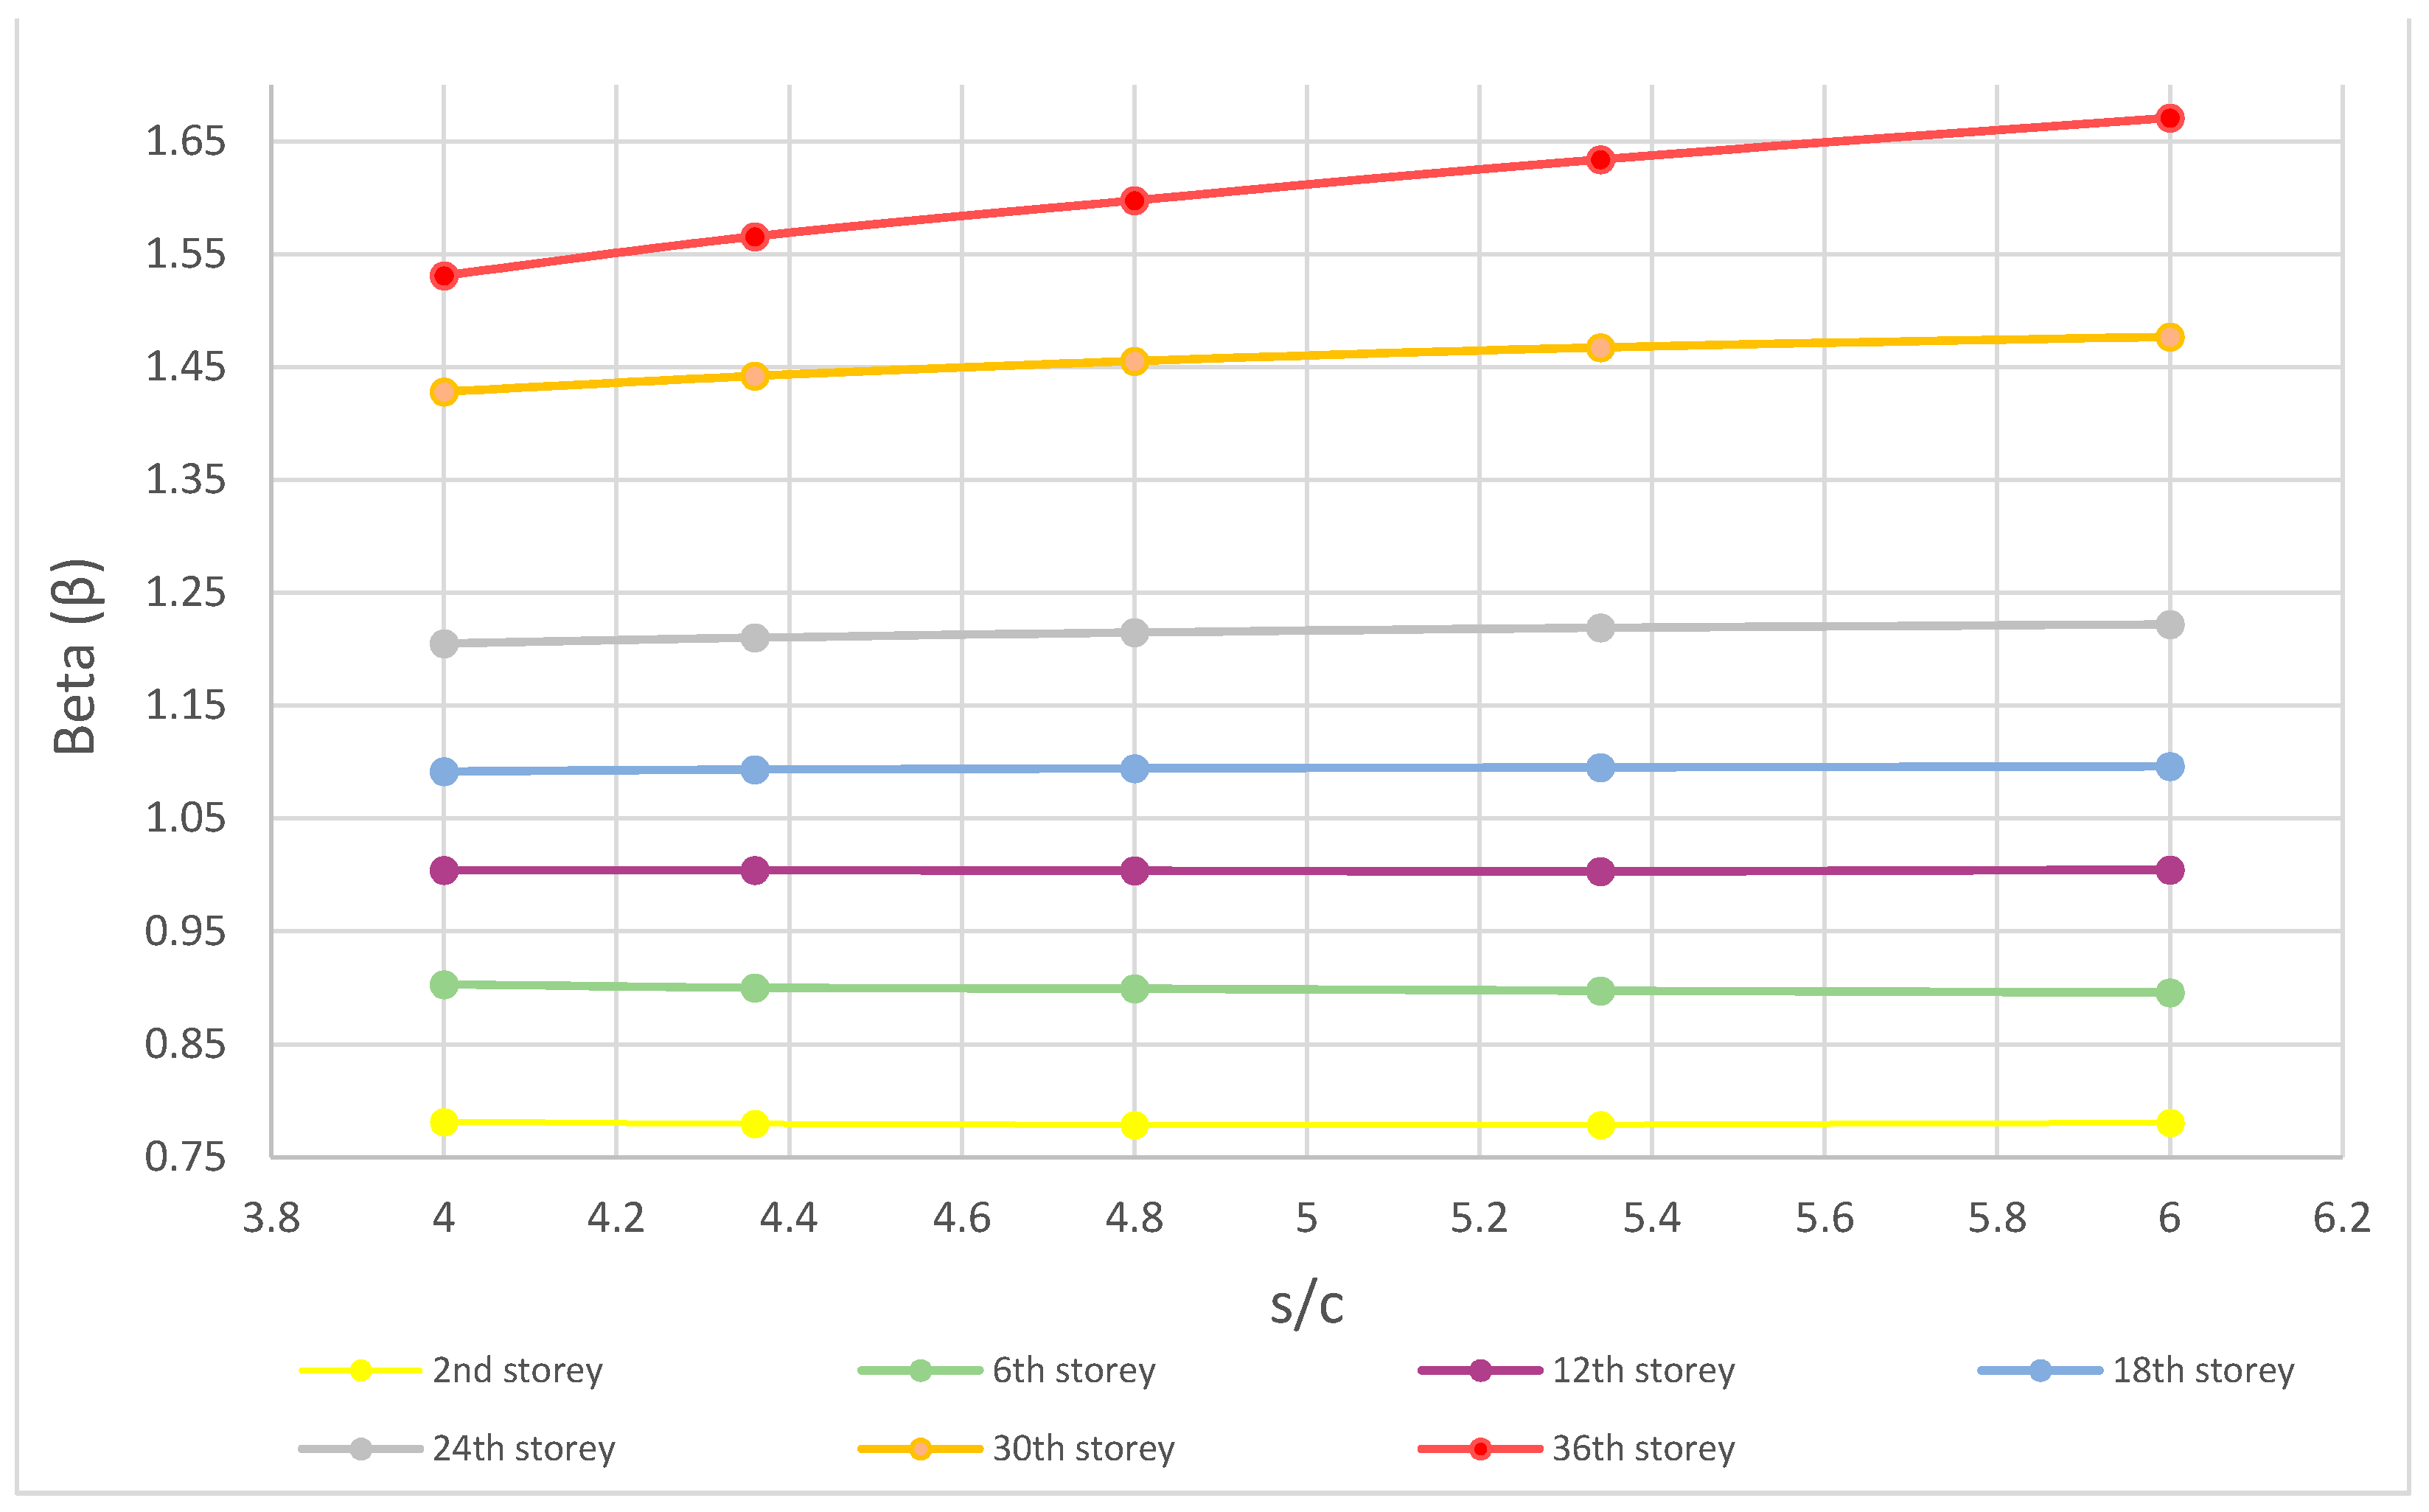
5.1. The Impact of Column Spacing on the Shear Lag Effect

In this chapter, the impact of exterior column spacing in a tube structure on the shear lag effect will be analyzed. As already stated, the column dimension perpendicular to the horizontal load direction will stay the same throughout the analysis (c = 0.5 m). The column spacing will be varied five times with values of s = 2.0 m, s = 2.18 m, s = 2.4 m, s = 2.67 m and s = 3.0 m while the layout dimensions stay constant A/B = 24 m/24 m (number of columns is varied). The entire building height and the storey height are constant. The same seven storeys as in chapter 4 will be analyzed. It is very important to note that as the column spacing is changed, the referent node area for point load changes. That means that for different column spacing the horizontal force in the nodes where beams and columns meet is different. The results of the analysis are shown in Figure 9.
According to the results (Figure 9) the following can be concluded:
(1)
All storeys bellow the 12th storey are in the positive shear lag effect area (β < 1). It is also clear that the column spacing for these storeys has no meaningful impact on the positive shear lag effect (the value of β for the 2nd, 6th and 12th storey is not changing).
(2)
The transition from the positive to the negative shear lag effect area for all column spacing variants is at the 12th storey (β = 1), which is approximately at 33% of the building height measured from the ground.
(3)
All storeys above the 12th storey are in the negative shear lag effect area (β > 1). It is also clear that the column spacing for these storeys has some impact on the negative shear lag effect. As the building rises, so does the coefficient β. Furthermore, the increase of coefficient β in one storey due to the variation of column spacing is more and more prominent as the building rises. While on the 18th storey this increase is mild, on the 36th storey the increase of coefficient β with the increase of column spacing is quite notable.
It can be deduced that the column spacing has practically no impact on the positive shear lag effect, while in the case of negative shear lag effect, the increase in column spacing results in the increase of this effect with this phenomenon being more prominent as the building rises.

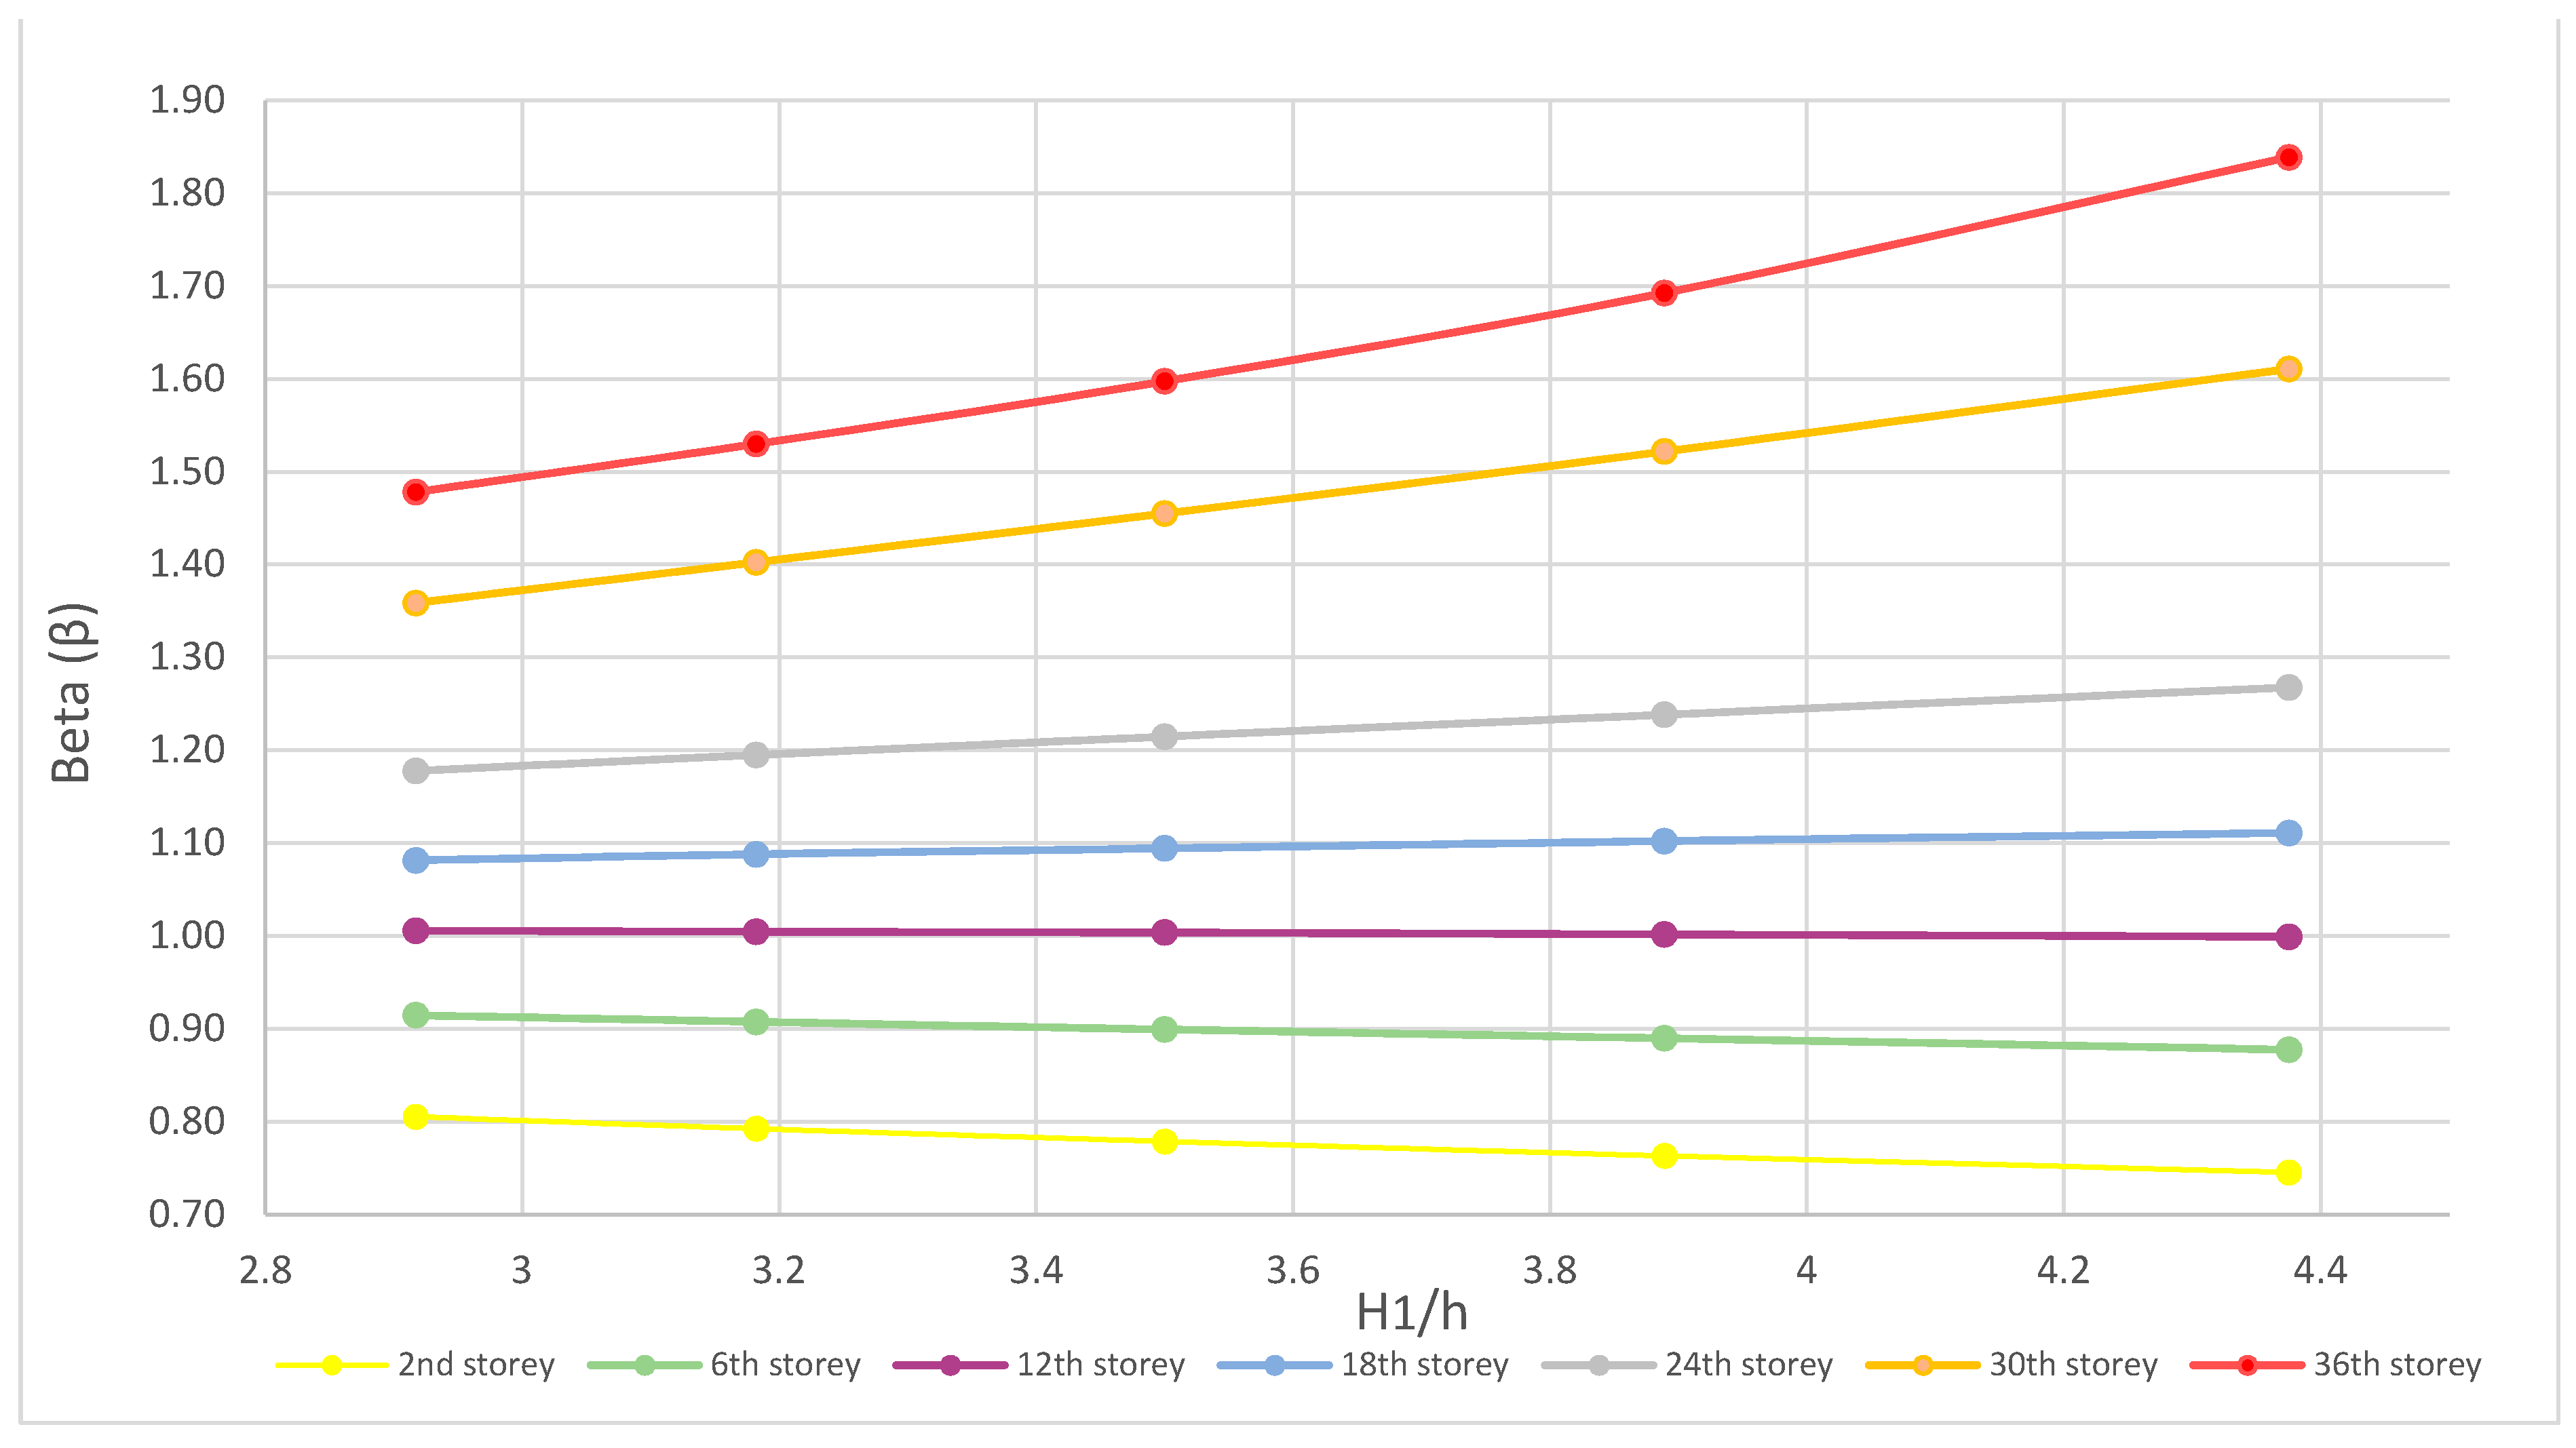
5.2. The Impact of Beam Height on the Shear Lag Effect

In this chapter, the impact of the beam height in a tube structure on the shear lag effect will be analyzed. While the beam height will be varied, the storey height will stay the same with the value of H1 = 3.5 m. The layout dimensions have constant values of A/B = 24 m/24 m, and the column spacing has a constant value of s = 2.4 m. The beam height will be varied five times with values of h = 1.2 m (H1/h = 2.92), h = 1.1 m (H1/h = 3.18), h = 1.0 m (H1/h = 3.50), h = 0.9 m (H1/h = 3.89) and h = 0.8 m (H1/h = 4.4). The height of the building stays the same. The results of the analysis are shown in Figure 10.
According to the results (Figure 10) the following can be concluded:
(1)
All storeys bellow the 12th storey are in the positive shear lag effect area (β < 1). For these storeys, by decreasing the beam height, the positive shear lag effect increases. Examining the curves in Figure 10 it can be concluded that the positive shear lag effect is more prominent for lower storeys of the building and that coefficient β is smallest for the ground storey.
(2)
The transition from the positive to the negative shear lag effect area for all beam height variants is at the 12th storey (β = 1), which is approximately at 33% of the building’s height measured from the ground.
(3)
All storeys above the 12th storey can be found in the negative shear lag effect area (β > 1). As the building rises, so does the coefficient β. Furthermore, the increase of coefficient β in one storey due to the variation of beam height is more and more prominent as the building rises. While on the 18th storey this increase is mild, on the 36th storey the increase of coefficient β with the decrease of beam height is quite notable.
It can be deduced that the decrease in beam height results in the increase of positive and negative shear lag effect in tall tube buildings.

5.3. The Impact of Layout Dimensions on the Shear Lag Effect

In this chapter, the impact of building layout dimensions on the shear lag effect will be analyzed. The parameters that are going to stay constant include the beams cross section dimensions b/h = 0.5 m/1.0 m, column cross section dimension c = 0.5 m, column spacing s = 2.4 m, storey height H1 = 3.5 m and the entire buildings height H = 126 m. The layout ratio of the building will be changed from a rectangular shape to a square shape starting from A/B = 24/43.2 = 0.56 and ending with the final ratio of A/B = 24/24 = 1.0. The value of A is the side of the building parallel to the horizontal load direction (web panel) and the value of B is the side of the building perpendicular to the horizontal load direction (flange panel). The results of the analysis are shown in Figure 11.
According to the results the following can be concluded:
(1)
The 2nd, 6th and 12th storey are in the positive shear lag effect area (β < 1). It can be concluded that the largest impact of the positive shear lag effect (lowest β) is seen in the rectangular shaped building with the ratio of floor dimensions of A/B = 0.56 and the smallest impact (highest β) is seen in the square shaped building with the ratio of floor dimensions of A/B = 1.0. In this area the positive shear lag effect is largest in the lowest storey of the building and change (increase) of coefficient β in one storey is more prominent at the lower parts of the building.
(2)
The transition from the positive to the negative shear lag effect area is no longer unambiguously determined with one location (12th storey in prior analyses). For the square shape of the building the value of coefficient β = 1 is reached at the 12th storey, while for the rectangular shape of the building this does not apply. The value of β = 1 for this type of floor dimensions is reached at higher storeys of the building.
(3)
The negative shear lag effect is largest for the building with the layout dimension ratio of A/B = 0.56 and the smallest for the ratio of A/B = 1.0. Furthermore, the change of coefficient β in one storey due to the variation of layout dimensions in the negative shear lag effect area is more and more prominent as the building rises.
It can be deduced that the positive and negative shear lag effect are increased with the increase of the building side on which the horizontal loads acts.

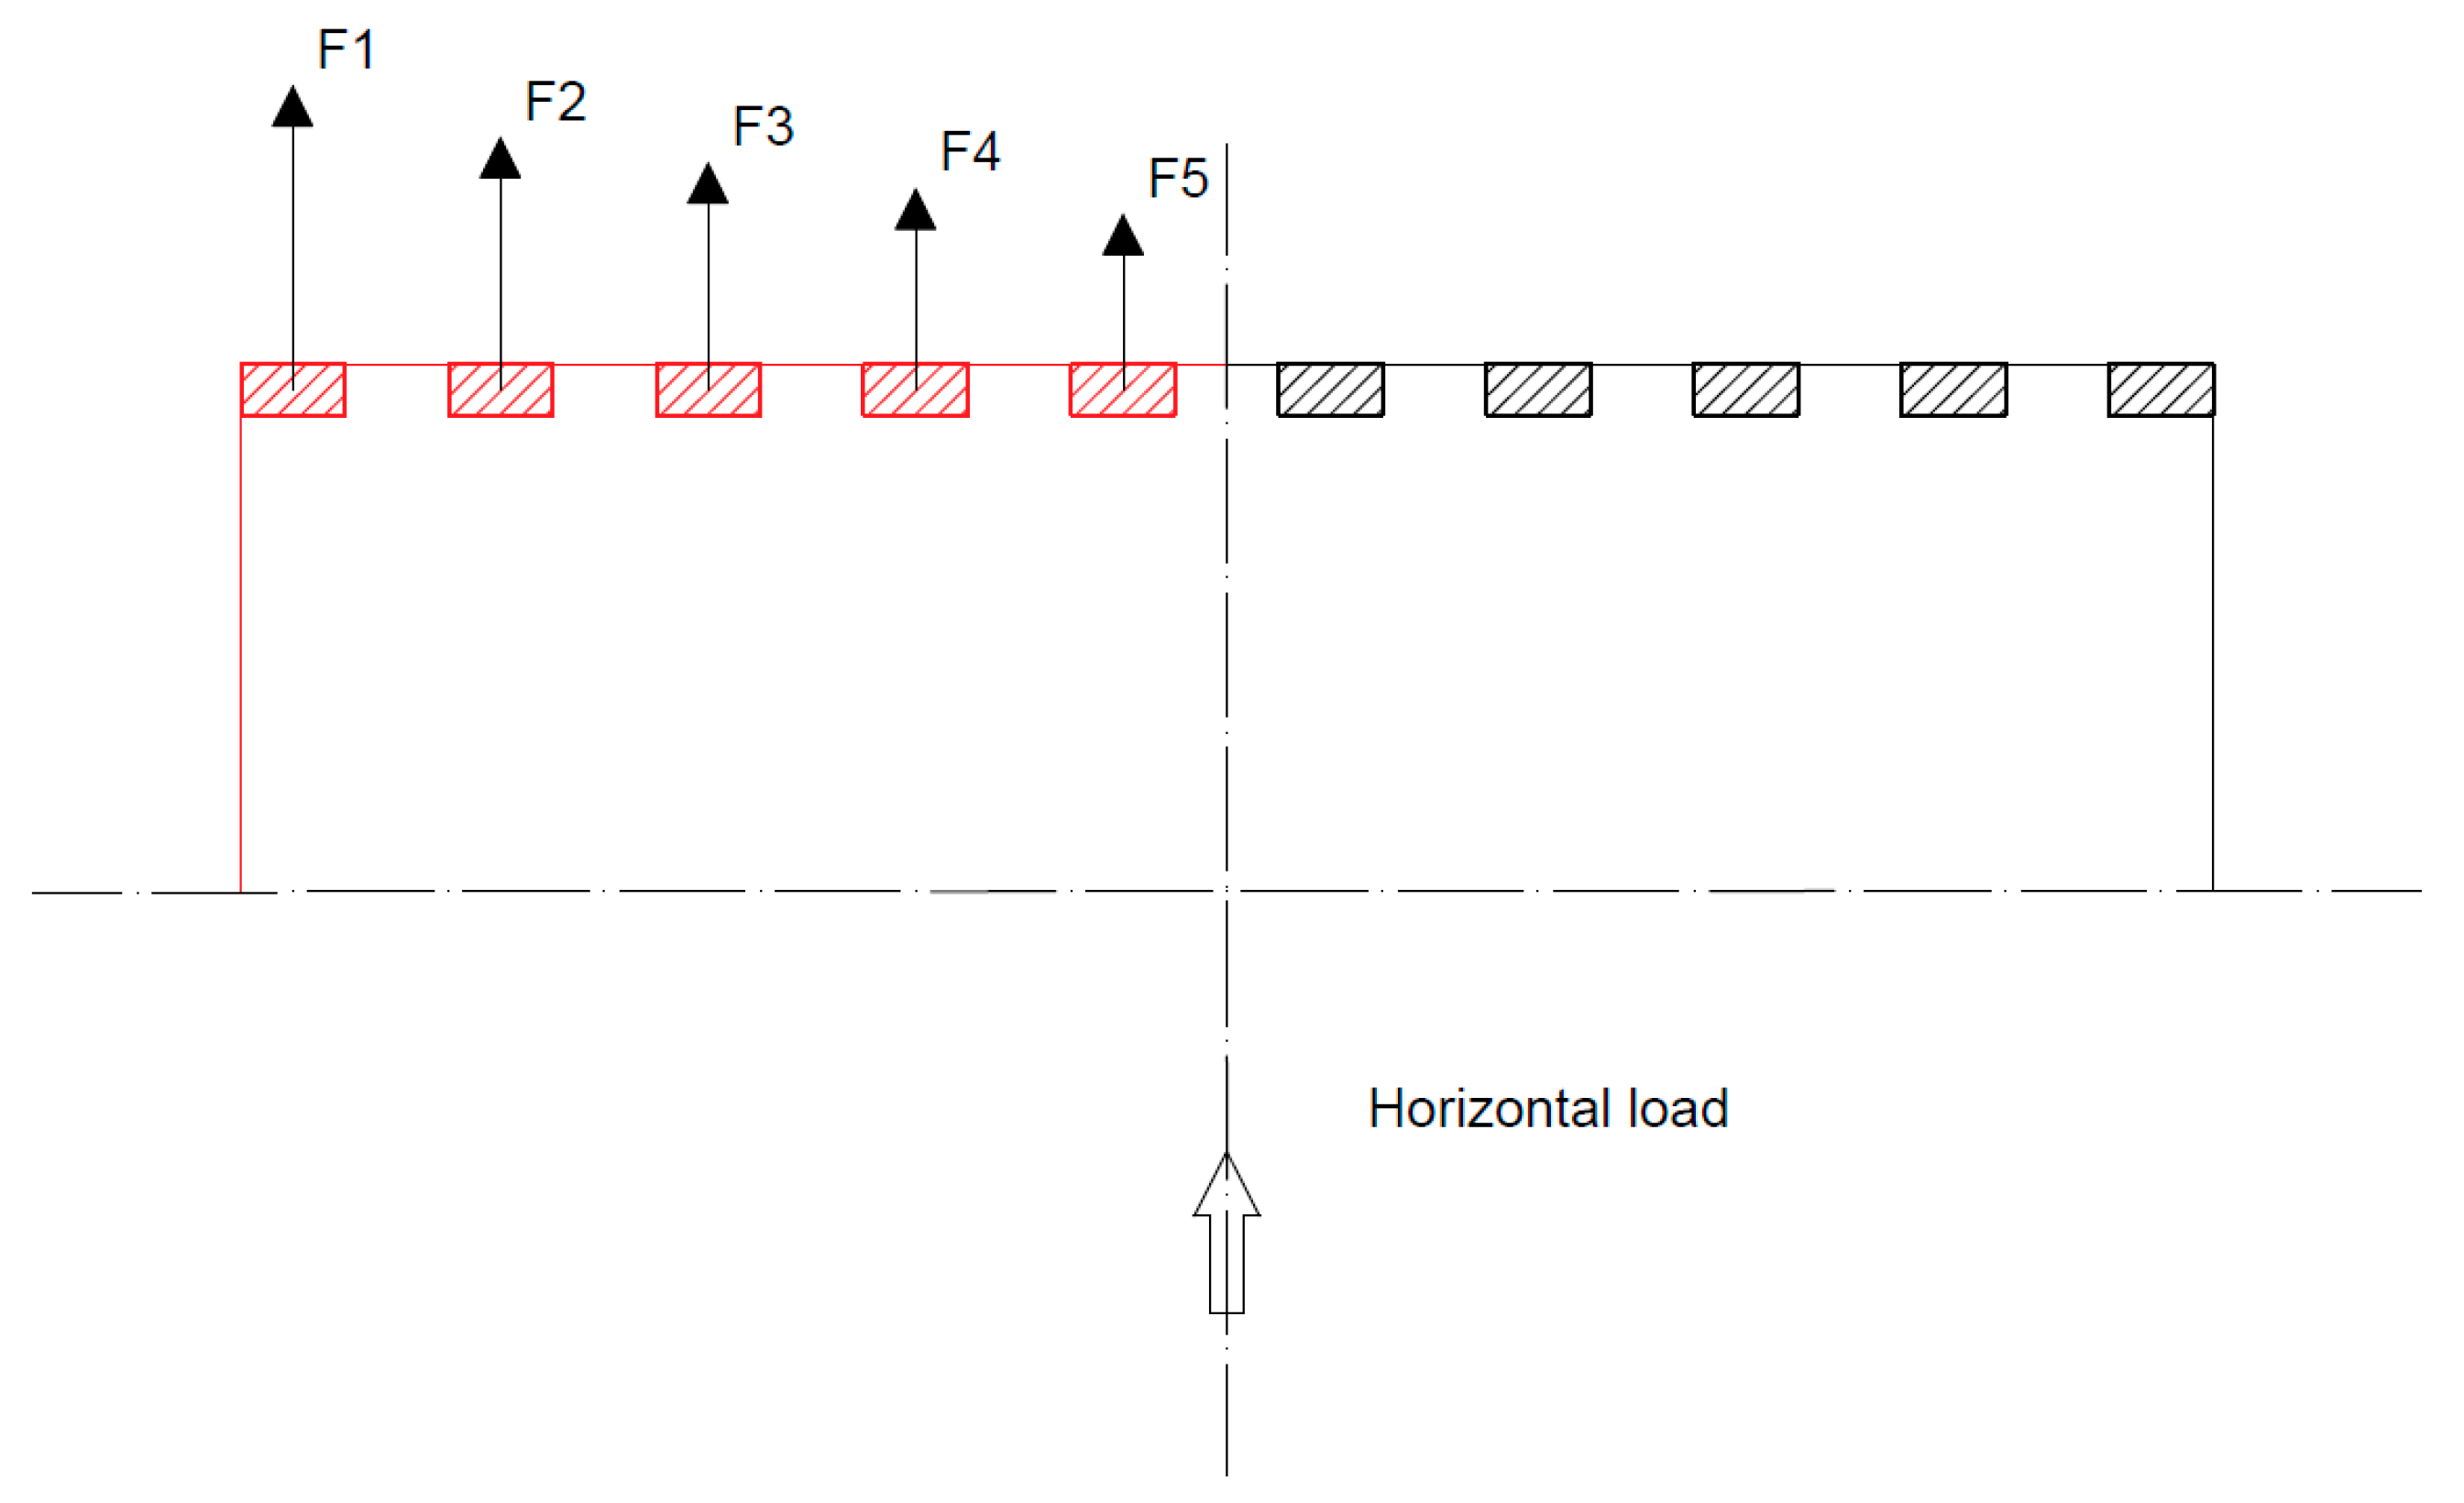
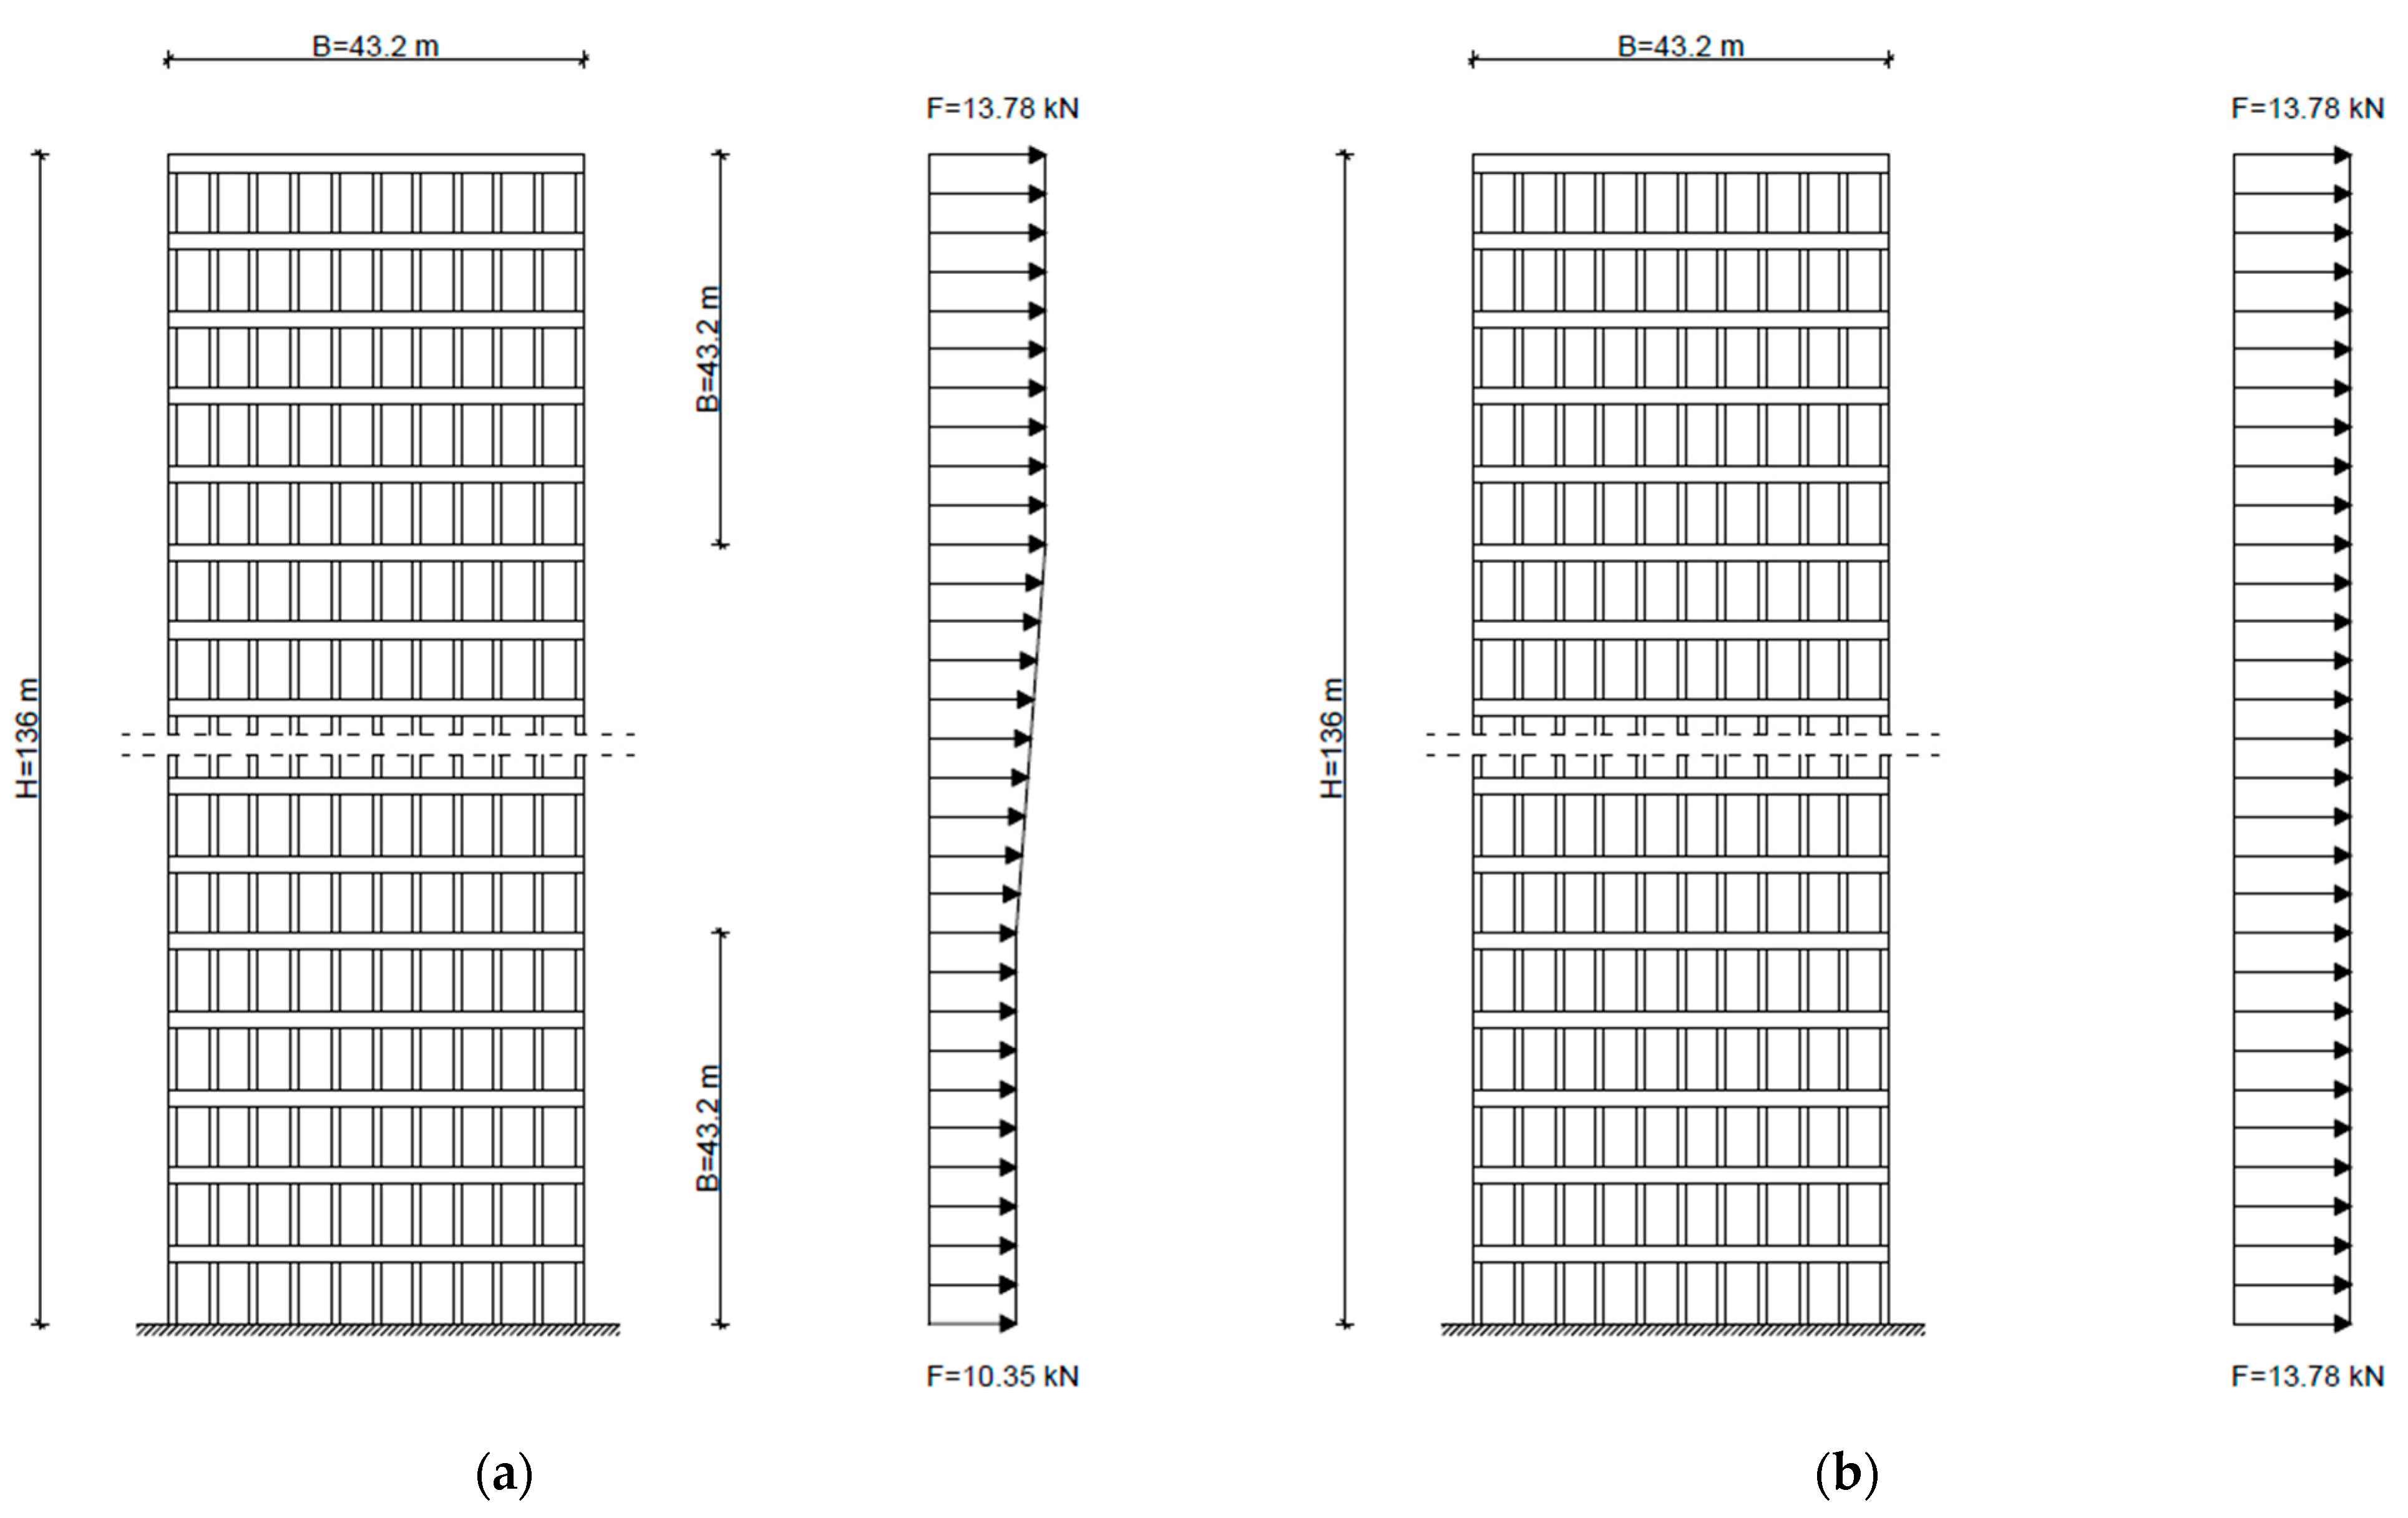
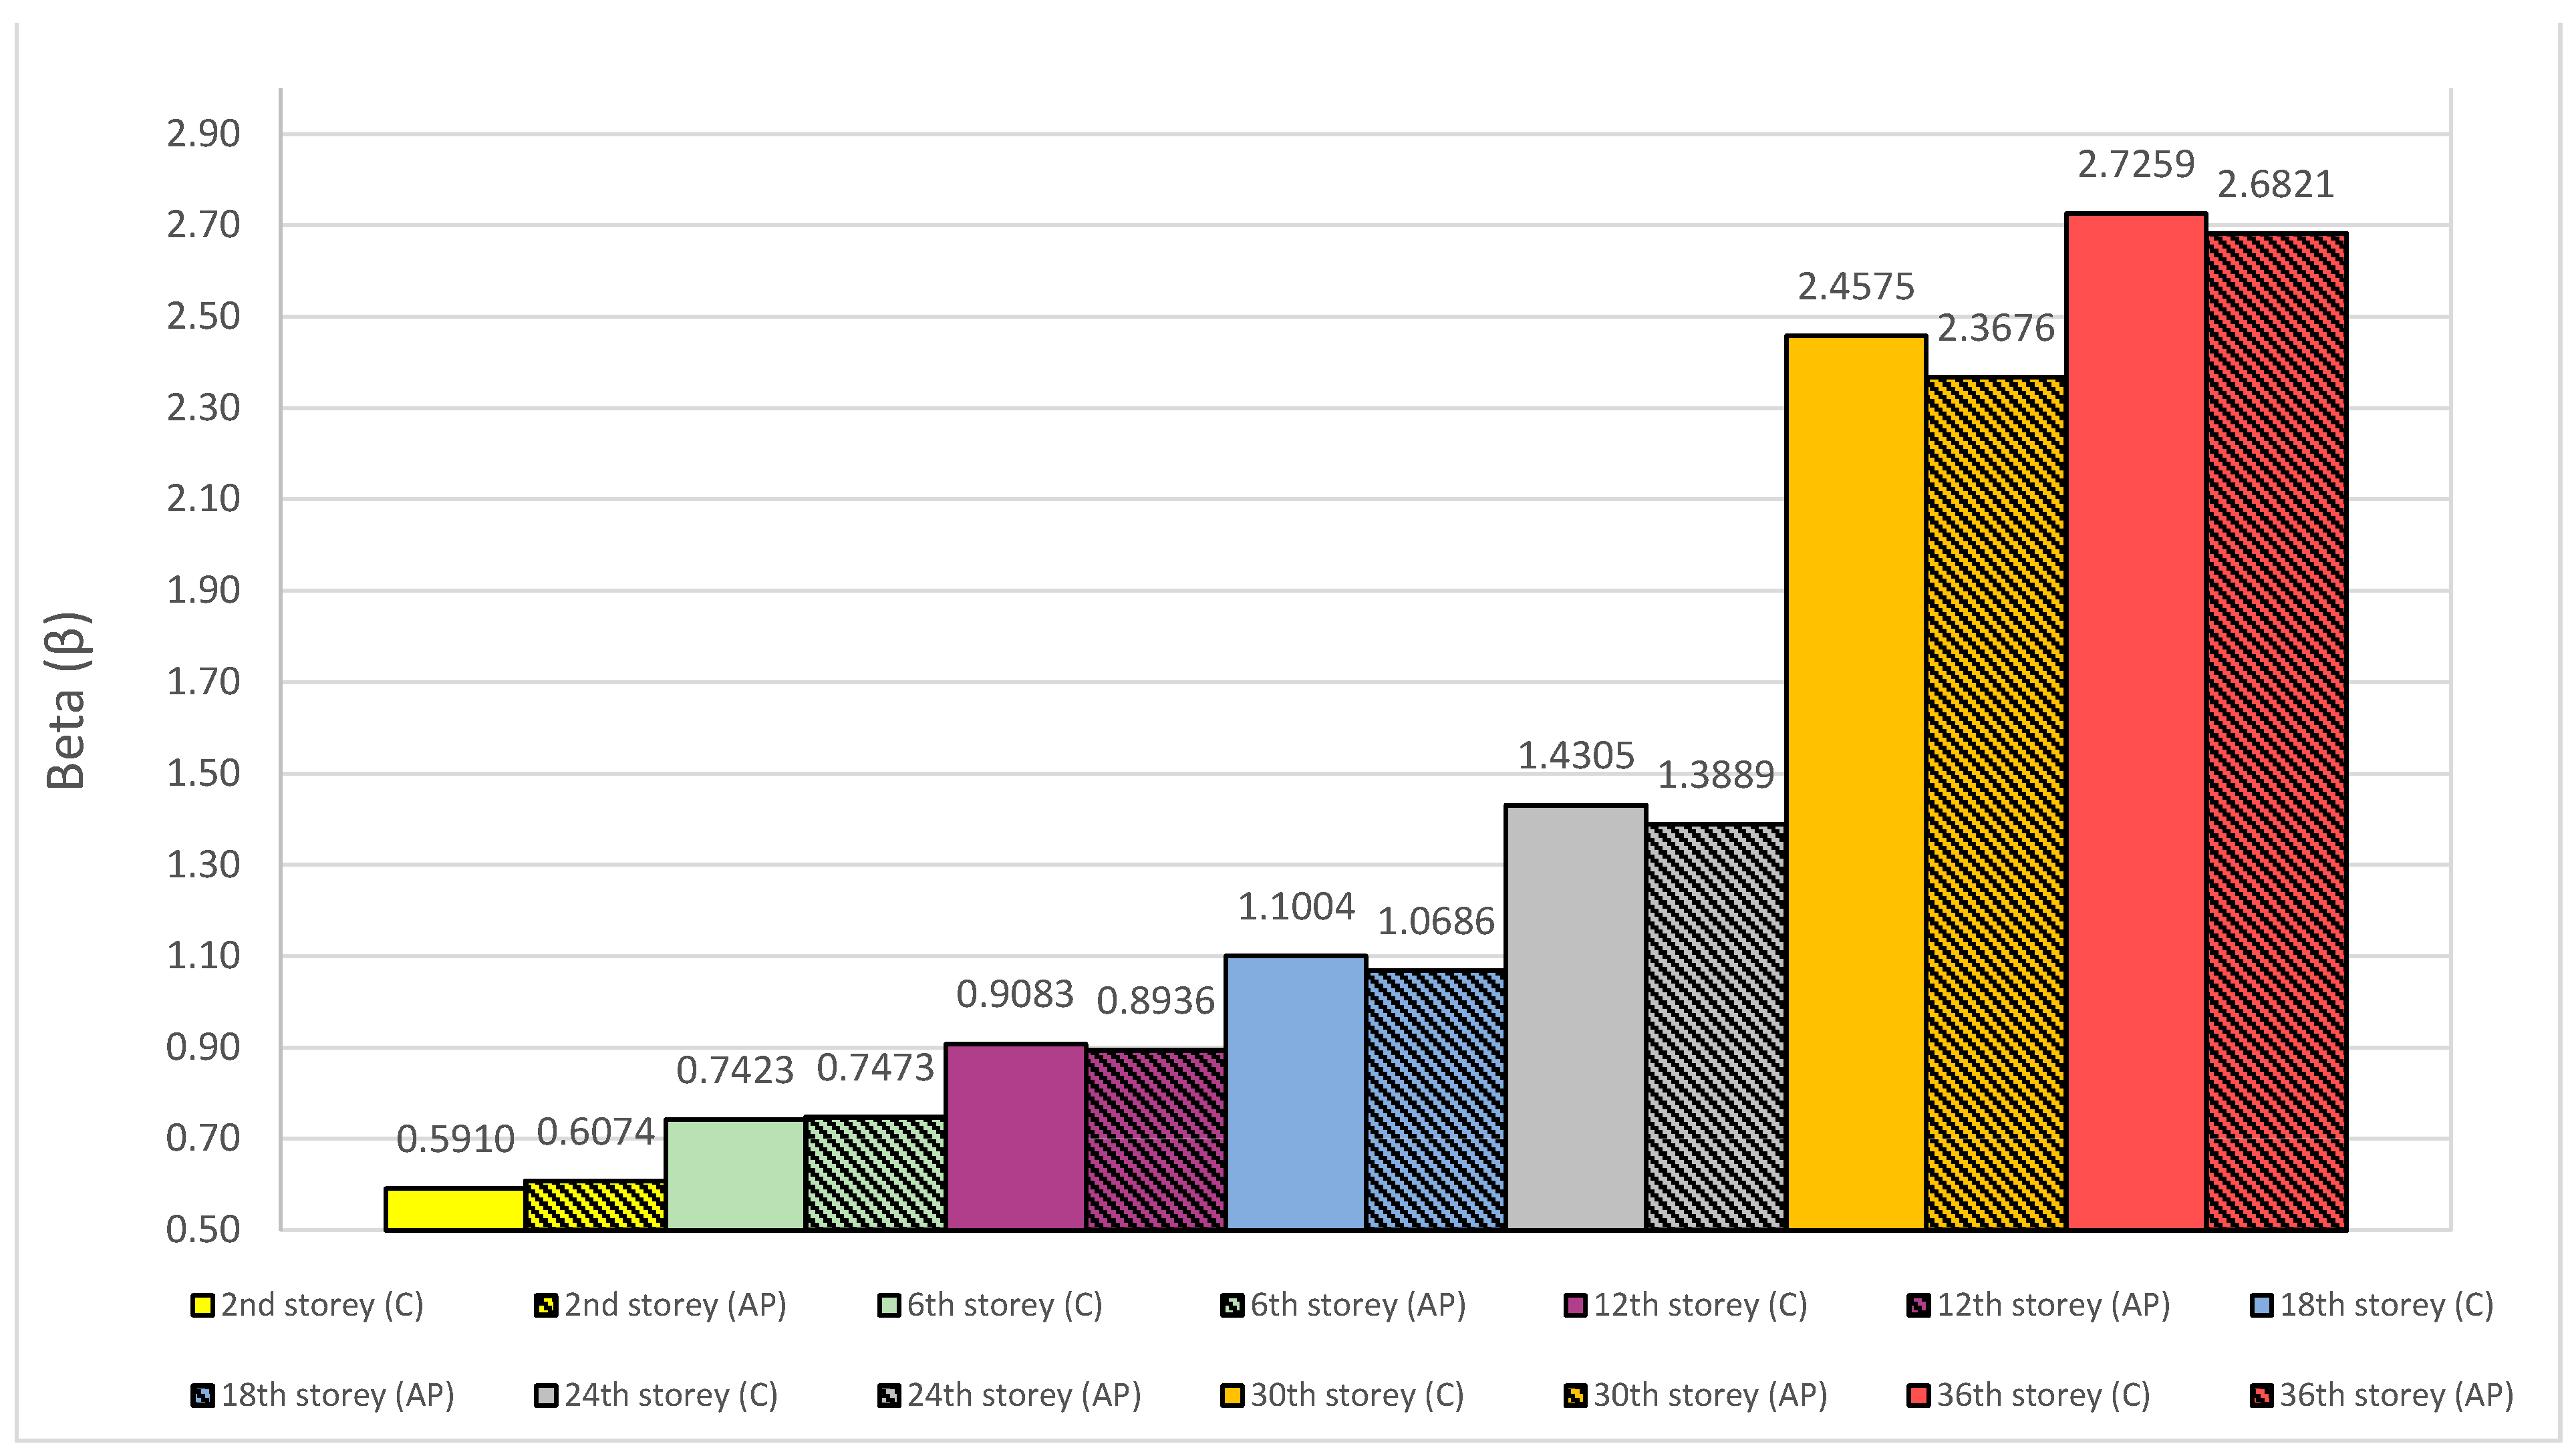
5.4. The Impact of Wind Load Type on the Shear Lag Effect

In this chapter, the impact of the type of the horizontal load profile on the shear lag effect will be analyzed. The constant parameters include the beams cross section dimensions b/h = 0.5 m/1.0 m, column cross section dimensions c = 0.5 m, column spacing s = 2.4 m, the entire buildings height H = 126 m, storey height H1 = 3.5 m and building layout dimensions A/B = 24 m/43.2 m. The building layout dimensions were chosen differently from the previous analyses, so that the difference in effect of different horizontal load profiles is most apparent. Two horizontal load profiles shall be considered: the continuous wind load with a constant value throughout the building’s height and the actual wind load profile calculated using EN 1991-1-4 [26]. The constant load profile includes the use of the maximum wind load force that is calculated for the top of the building after which that load is used throughout the building height (Figure 12b). The actual wind load profile (Figure 12a) is calculated using EN 1991-1-4 [26]. As it was the case in prior analysis, the same seven storeys will be considered. The results of the analysis are shown in Figure 13.
According to the results the following can be concluded:
(1)
The 2nd, 6th and 12th storey are found in the positive shear lag effect area (β < 1). In this area the shear lag effect is more significant (smaller β) for the constant value (C) of the wind load which is most clearly seen on the 2nd storey of the building. As the building rises the gap between two wind load profiles regarding the positive shear lag effect diminishes with the positive shear effect being more prominent for the actual wind load profile on the 12th storey.
(2)
All storeys above the 12th storey are found in the negative shear lag effect area (β > 1). In this area the shear lag effect is more significant (larger β) for the constant value (C) of the wind load than for the actual wind load profile. As the building rises, the gap between two wind load profiles regarding the negative shear lag effect increases until the 30th storey after which the gap slightly diminishes to the buildings top.
It can be deduced that the positive and negative shear lag effect are more significant for the continuous wind load with a constant value in most storeys of the structure.

6. Conclusions

The prototype structure of a 126 m high (36 storeys) tube structural system tall building was analyzed, comprising of a reinforced concrete column and beam panel members. For a varying set of parameters defining layout dimensions from 24 to 43 m, column spacing from 2 to 3 m, beam height from 0.8 to 1.2 m, and two different horizontal load profiles, following conclusions can be made regarding changes in the shear lag effect:
(1)
The positive shear lag effect is characteristic for the lower storeys of the structure and as the structure rises, the positive shear lag decreases and gradually transforms into negative shear lag which then increases to the buildings top. This transformation usually happens at around 33% of the building height measured from the bottom to the top except in the case of the variation of the layout dimensions where the transformation happens at 50% of the building height.
(2)
The increase of column spacing, with the layout dimensions of the building staying the same, has no major impact on the positive shear lag effect that is characteristic for the lower storeys of the building. The position of the change from the positive to the negative shear lag is also not conditioned by the column spacing. In upper storeys, where negative shear lag appears, with the increase in column spacing the negative shear lag increases.
(3)
The increase of beam height results in the decrease of positive and negative shear lag effect. During the horizontal loading of tube structures due to the flexibility of beams in flange and web panels they bend under horizontal loads which results in unequal distribution of axial forces in columns of the panel. Therefore, if the beam is higher, the deformation under horizontal loads is smaller and thus the shear lag effect decreases. The storey where the transformation from the positive to the negative shear lag occurs is not conditioned by the beam height.
(4)
The increase in the building layout dimension on which the horizontal load acts (flange panel) results in the increase of positive and negative shear lag effect. As the flange panel widens, the cumulative deformations of flexible beams increase. The transformation from the positive to the negative shear lag is conditioned by the layout dimensions ratio in tall tube structural systems. As the flange panel on which the horizontal load acts widens, the transformation from the positive to the negative shear lag happens on progressively higher storeys of the structure.
(5)
The positive and negative shear lag effects are more significant for the continuous horizontal load profile with a constant value than for the actual variable wind load profile.

Author Contributions

Conceptualization, I.H. and A.V.; methodology, A.V.; software, I.H. and A.V.; validation, A.V., T.K. and T.R.; formal analysis, I.H. and A.V.; investigation, I.H.; resources, I.H., A.V. and T.K.; data curation, A.V.; writing—original draft preparation, I.H.; writing—review and editing, A.V., T.K. and T.R.; visualization, I.H.; supervision, A.V. and T.K.; project administration, I.H. Please turn to the CRediT taxonomy for the term explanation. Authorship must be limited to those who have contributed substantially to the work reported. All authors have read and agreed to the published version of the manuscript.

Funding

This research received no external funding.

Institutional Review Board Statement

Not applicable.

Informed Consent Statement

Not applicable.

Data Availability Statement

The data presented in this study are available on request from the corresponding author. The data are not publicly available due to privacy restrictions.

Conflicts of Interest

The authors declare no conflict of interest. The funders had no role in the design of the study; in the collection, analyses, or interpretation of data; in the writing of the manuscript, or in the decision to publish the results.

References

  1. Vlašić, A.; Puž, G.; Skokandić, D. University Manual for Tall Buildings; University of Zagreb, Faculty of Civil Engineering: Zagreb, Croatia, 2018. [Google Scholar]
  2. Shi, Q.; Zhang, F. Simplified calculation of shear lag effect for high-rise diagrid tube structures. J. Build. Eng. 2019, 22, 486–495. [Google Scholar] [CrossRef]
  3. Ghasemi, H.A. Optimal design of high-rise building bundled tube systems. Adv. Sci. Technol. Res. J. 2016, 10, 96–102. [Google Scholar] [CrossRef] [Green Version]
  4. Zhang, Z.; Li, B. Effects of the shear lag on longitudinal strain and flexural stiffness of flanged RC structural walls. Eng. Struct. 2018, 156, 130–144. [Google Scholar] [CrossRef]
  5. Singh, B. Negative shear lag in framed-tube buildings. J. Struct. Eng. 1995, 120, 3105–3121. [Google Scholar] [CrossRef]
  6. Leonard, J. Investigation of Shear Lag Effect in High-rise Buildings with Diagrid System. Master’s Thesis, Massachusetts Institute of Technology, Cambridge, MA, USA, 21 May 2007. [Google Scholar]
  7. Lee, S.C.; Yoo, C.H.; Yoon, D.Y. Analysis of shear lag anomaly in box girders. J. Struct. Eng. 2002, 128, 1379–1386. [Google Scholar] [CrossRef]
  8. Chang, T.S.; Yun, D. Shear lag effect in box girder with varying depth. J. Struct. Eng. 1989, 114, 2280–2292. [Google Scholar] [CrossRef]
  9. Machacek, J.; Studnička, J.; Kristek, V. Coupled instability and negative shear lag phenomenon in box girders. Thin-Walled Struct. 1994, 20, 73–82. [Google Scholar] [CrossRef]
  10. Shushkevvich, K.W. Negative Shear Lag Explained. J. Struct. Eng. 1991, 117, 3543–3545. [Google Scholar] [CrossRef]
  11. Luo, Q.; Wu, Y.; Li, Q.; Tang, J.; Liu, G. A finite segment model for shear lag analysis. Eng. Struct. 2004, 26, 2113–2124. [Google Scholar] [CrossRef]
  12. Kwan, A.K.H. Simple method for approximate analysis of framed tube structures. J. Struct. Eng. 1994, 120, 1221–1239. [Google Scholar] [CrossRef]
  13. Haji-Kazemi, H.; Company, M. Exact method of analysis of shear lag in framed tube structures. Struct. Des. Tall Build. 2002, 11, 375–388. [Google Scholar] [CrossRef]
  14. Connor, J.J. Simple model for design of framed-tube structure. J. Struct. Eng. 1992, 117, 3623–3644. [Google Scholar] [CrossRef]
  15. Guan, H.; Loo, Y.-C.; Lee, K.-K. Simplified analysis of shear-lag in framed-tube structures with multiple internal tubes. Comput. Mech. 2000, 26, 447–458. [Google Scholar] [CrossRef] [Green Version]
  16. Lee, K.-K.; Lee, L.-H.; Lee, E.-J. Prediction of shear-lag effects in framed-tube structures with internal tube(s). Struct. Des. Tall Build. 2002, 11, 73–92. [Google Scholar] [CrossRef]
  17. Lee, K.-K.; Loo, Y.-C.; Guan, H. Simple analysis of framed-tube structures with multiple internal tubes. J. Struct. Eng. 2001, 127, 450–460. [Google Scholar] [CrossRef] [Green Version]
  18. Samat, R.A.; Chua, F.T.; Mustakim, N.A.H.M.; Saad, S.; Abu Bakar, S. Lateral displacement and shear lag effect of combination of diagrid-frame. E3S Web Conf. 2018, 34, 01009. [Google Scholar] [CrossRef] [Green Version]
  19. Nouri, F.; Ashtari, P. Investigation of the shear lag phenomenon and structural behavior of framed-tube and braced-tube tall structures. In Proceedings of the International Conference on Civil Engineering Architecture & Urban Sustainable Development, Tabriz, East Azarbaijan, Iran, 11–12 December 2013. [Google Scholar]
  20. Mazinani, I.; Jumaat, M.Z.; Ismail, Z.; Chao, O.Z. Comparison of shear lag in structural steel building with framed tube and braced tube. Struct. Eng. Mech. 2014, 49, 297–309. [Google Scholar] [CrossRef]
  21. Gaur, H.; Goliya, R.K. Mitigating shear lag in tall buildings. Int. J. Adv. Struct. Eng. 2015, 7, 269–279. [Google Scholar] [CrossRef] [Green Version]
  22. Liu, Y.; Kopp, G.A.; Chen, S.-F. Effects of plan dimensions on gust wind loads for high-rise buildings. J. Wind. Eng. Ind. Aerodyn. 2019, 194, 103980. [Google Scholar] [CrossRef]
  23. Dat, B.T.; Traykov, A.; Traykova, M. Shear-lag effect and its effect on the design of high-rise buildings. E3S Web Conf. 2018, 33, 02001. [Google Scholar] [CrossRef] [Green Version]
  24. Zahiri-Hashemi, R.; Kheyroddin, A.; Farhadi, B. Effective number of mega-bracing, in order to minimize shear lag. Struct. Eng. Mech. 2013, 48, 173–193. [Google Scholar] [CrossRef]
  25. Pejovic, J.; Stepinac, M.; Serdar, N.; Jevric, M. Improvement of Eurocode 8 Seismic Design Envelope for Bending Moments in RC Walls of High-rise Buildings. J. Earthq. Eng. 2020. [Google Scholar] [CrossRef]
  26. EN 1991-1-4 “Eurocode 1: Actions on Structures—Part 1-4: General Actions: Wind Actions”. Available online: https://www.phd.eng.br/wp-content/uploads/2015/12/en.1991.1.4.2005.pdf (accessed on 4 June 2004).
Figure 1. Shear lag effect in a tube structural system (positive shear lag effect).
Applsci 11 00278 g001
Figure 2. Shear lag effect in a tube structural system (negative shear lag effect).
Applsci 11 00278 g002
Figure 3. (a) Box section cantilever stress distribution for point load and (b) continuous load.
Applsci 11 00278 g003aApplsci 11 00278 g003b
Figure 4. Layout of the building dimensions and the dimensions of structural elements.
Applsci 11 00278 g004
Figure 5. The floor layout, side view and the axonometry of the computer model (red—pinned supports at the location of columns, green—beams, yellow—rigid diaphragm, light blue—columns).
Applsci 11 00278 g005
Figure 6. The display of horizontal load distribution (in kN).
Applsci 11 00278 g006
Figure 7. Shear lag effect on seven characteristic storeys in the flange panel (panel parallel to the panel on which the horizontal loads act).
Applsci 11 00278 g007
Figure 8. Layout for the calculation of β coefficient.
Applsci 11 00278 g008
Figure 9. The change in the shear lag effect with the variation of column spacing (β—s/c diagram).
Applsci 11 00278 g009
Figure 10. The change in the shear lag effect with the variation of beam height (β—H1/h diagram).
Applsci 11 00278 g010
Figure 11. The change in the shear lag effect with the variation of floor dimensions (β—A/B diagram).
Applsci 11 00278 g011
Figure 12. (a) The actual wind load profile and (b) the constant wind load profile.
Applsci 11 00278 g012
Figure 13. The change in the shear lag effect with the variation of the wind load profile (C-continuous wind load with a constant value, AP-actual wind load profile).
Applsci 11 00278 g013
Table 1. Structural parameters of some well-known tall buildings with tube structural system.
BuildingMaterial UsedH1/HA/B (Squared Shape)A/B (Rectangular Shape)s/c
1. The Plaza on Dewitt (Chicago)Concrete2.8/120.4 = 0.0233-38/24 = 1.581.7/0.5 = 3.4
2. World Trade Center (New York)Steel3.8/417 = 0.009163.4/63.4 = 1.00-1.1/0.6 = 1.83
3. Aon Center (Chicago)Steel3.86/346 = 0.011259.1/59.1 = 1.00-3.0/1.0 = 3.0
4. Hancock Whitney Center (New Orleans)Concrete/Steel4.15/212 = 0.0196-58.0/40.0 = 1.451.8/1.0 = 1.8
5. The Urban Hive (Seoul)Concrete3.50/60 = 0.058324.0/24.0 = 1.00-1.6/0.5 = 3.2
6. Hopewell Centre (Hong Kong)Concrete3.40/222 = 0.01531.00 (circular)-6.0/3.0 = 2.0
7. Maya Akar business center 1 (Istanbul)Concrete3.25/110 = 0.0296-31.75/24.75 = 1.283.5/1.0 = 3.5
8. Maya Akar business center 2 (Istanbul)Concrete3.25/60 = 0.0542-33.50/29.45 = 1.143.5/1.0 = 3.5
THE AVERAGE VALUE-3.50/126 = 0.02761.001.362.75/1 = 2.75
H1—storey height (m). H—building height (m). A, B—floor dimensions of the building (m). s—axial distance of columns (m). c—column dimension parallel to the slab edge (m).
Publisher’s Note: MDPI stays neutral with regard to jurisdictional claims in published maps and institutional affiliations.

