Geochemical Characteristics of the Lower Cretaceous HengTongshan Formation in the Tonghua Basin, Northeast China: Implications for Depositional Environment and Shale Oil Potential Evaluation


Abstract
1. Introduction
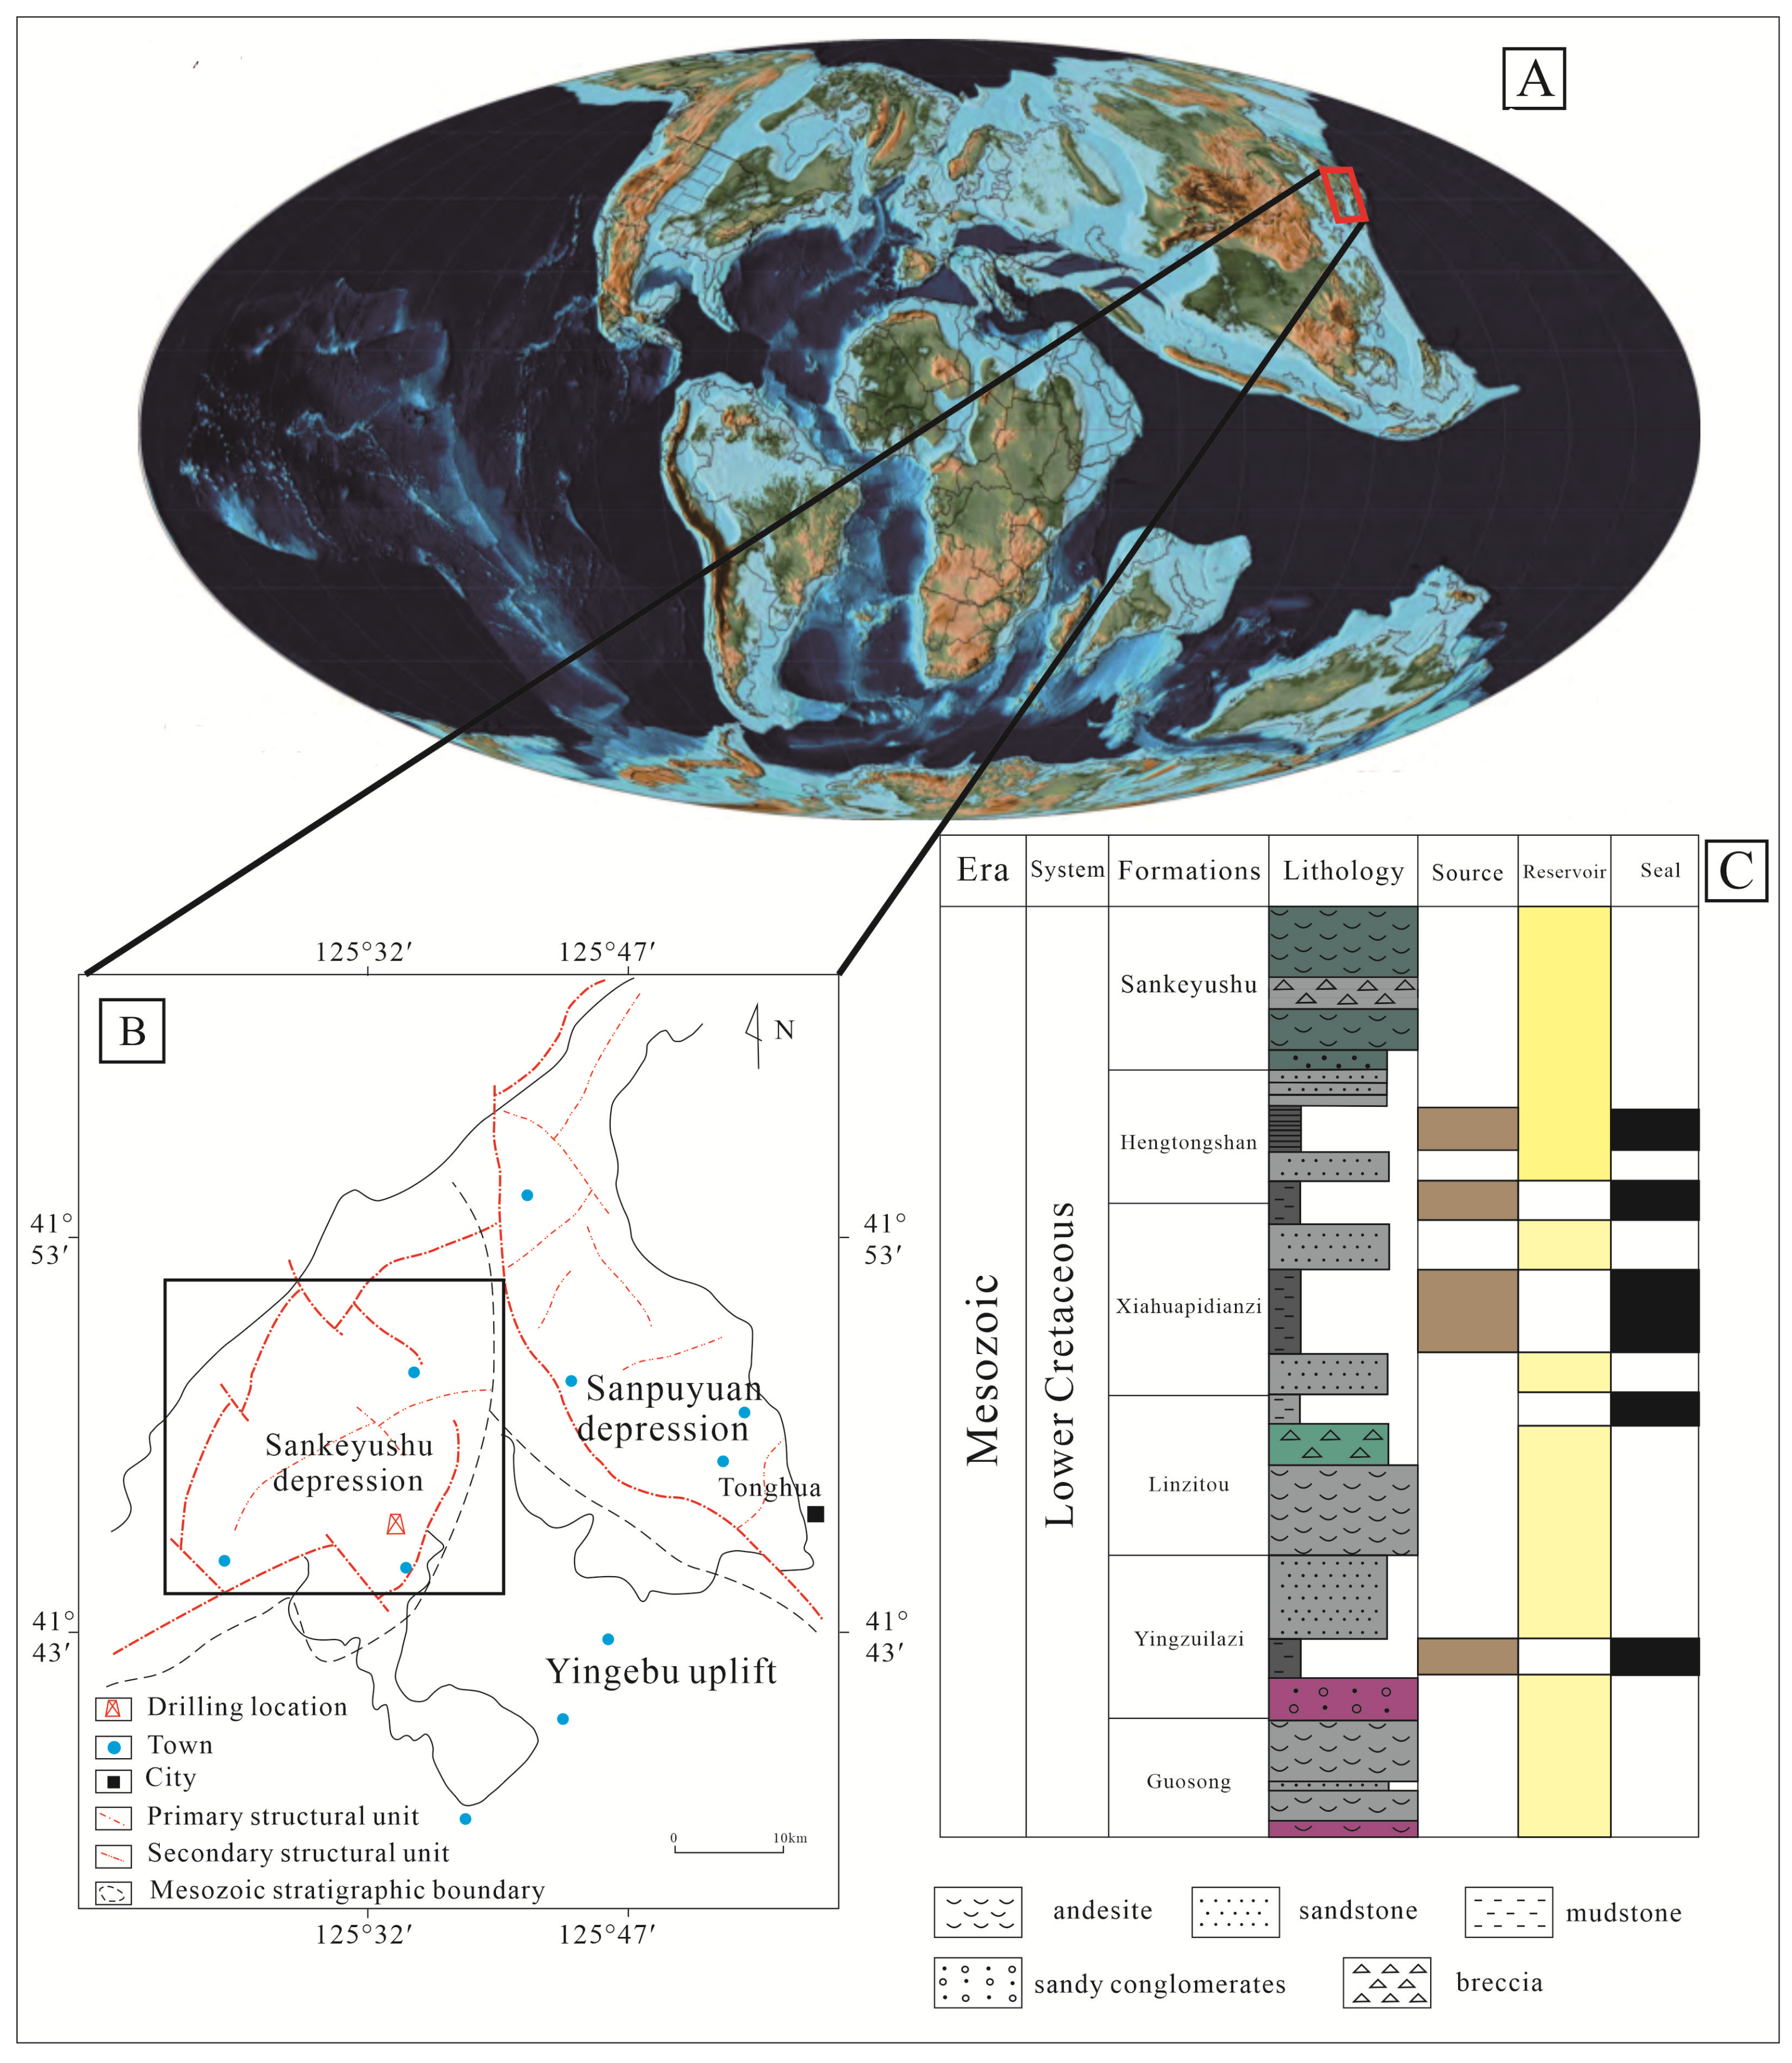
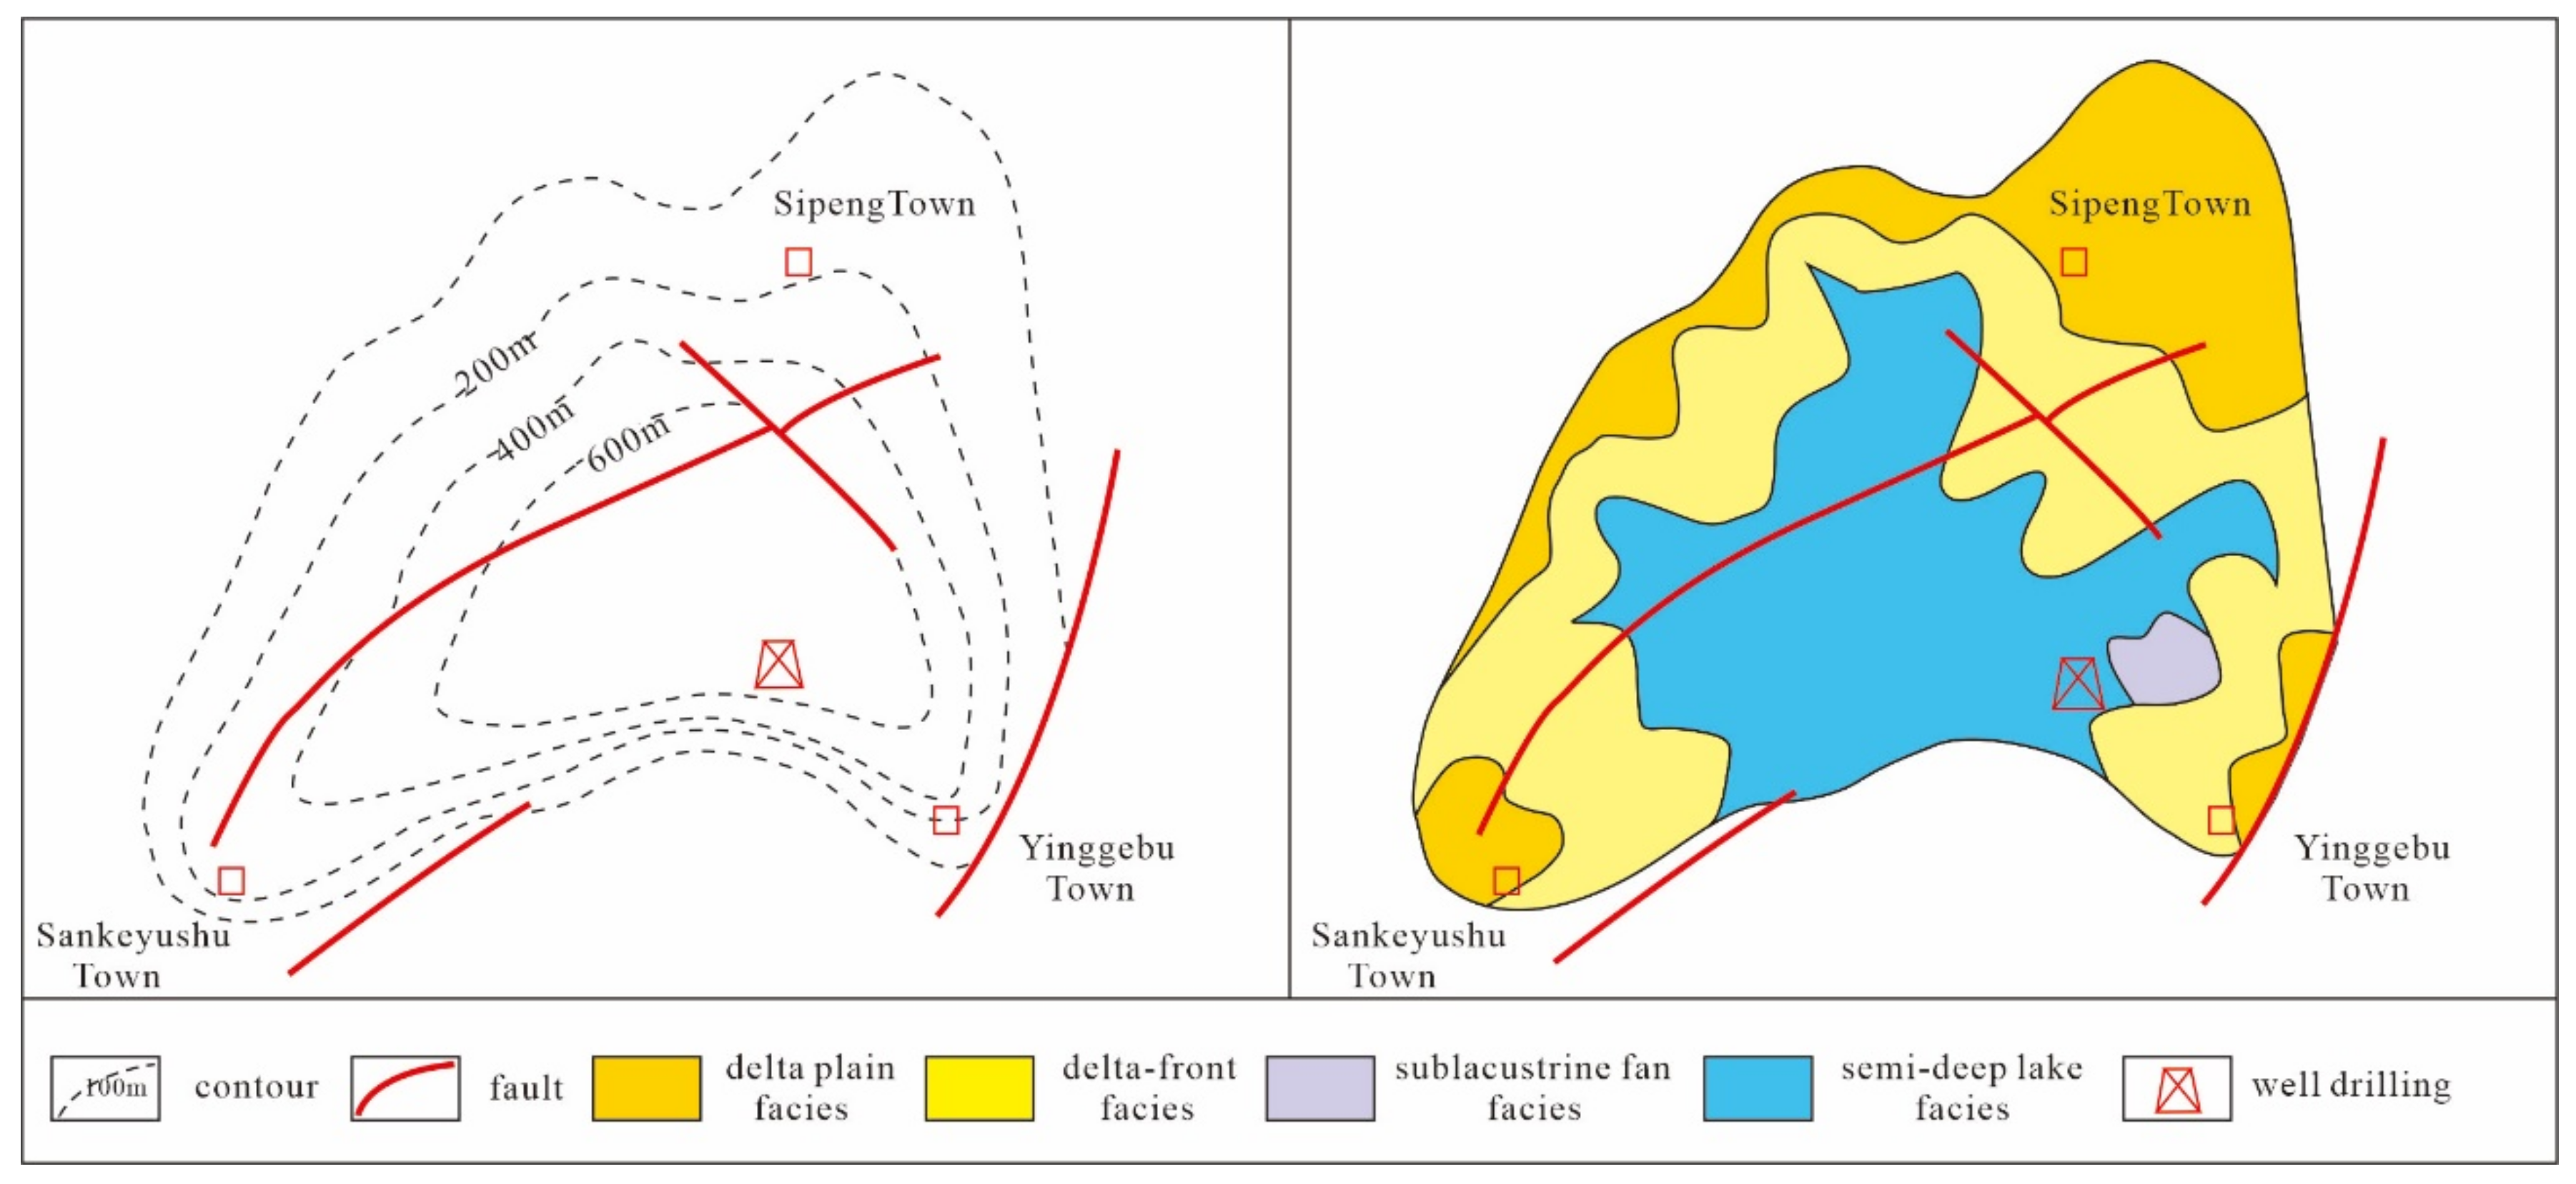
2. Geological Background
3. Samples and Test Methods
3.1. Samples
3.2. Experimental Methods
4. Results and Interpretation
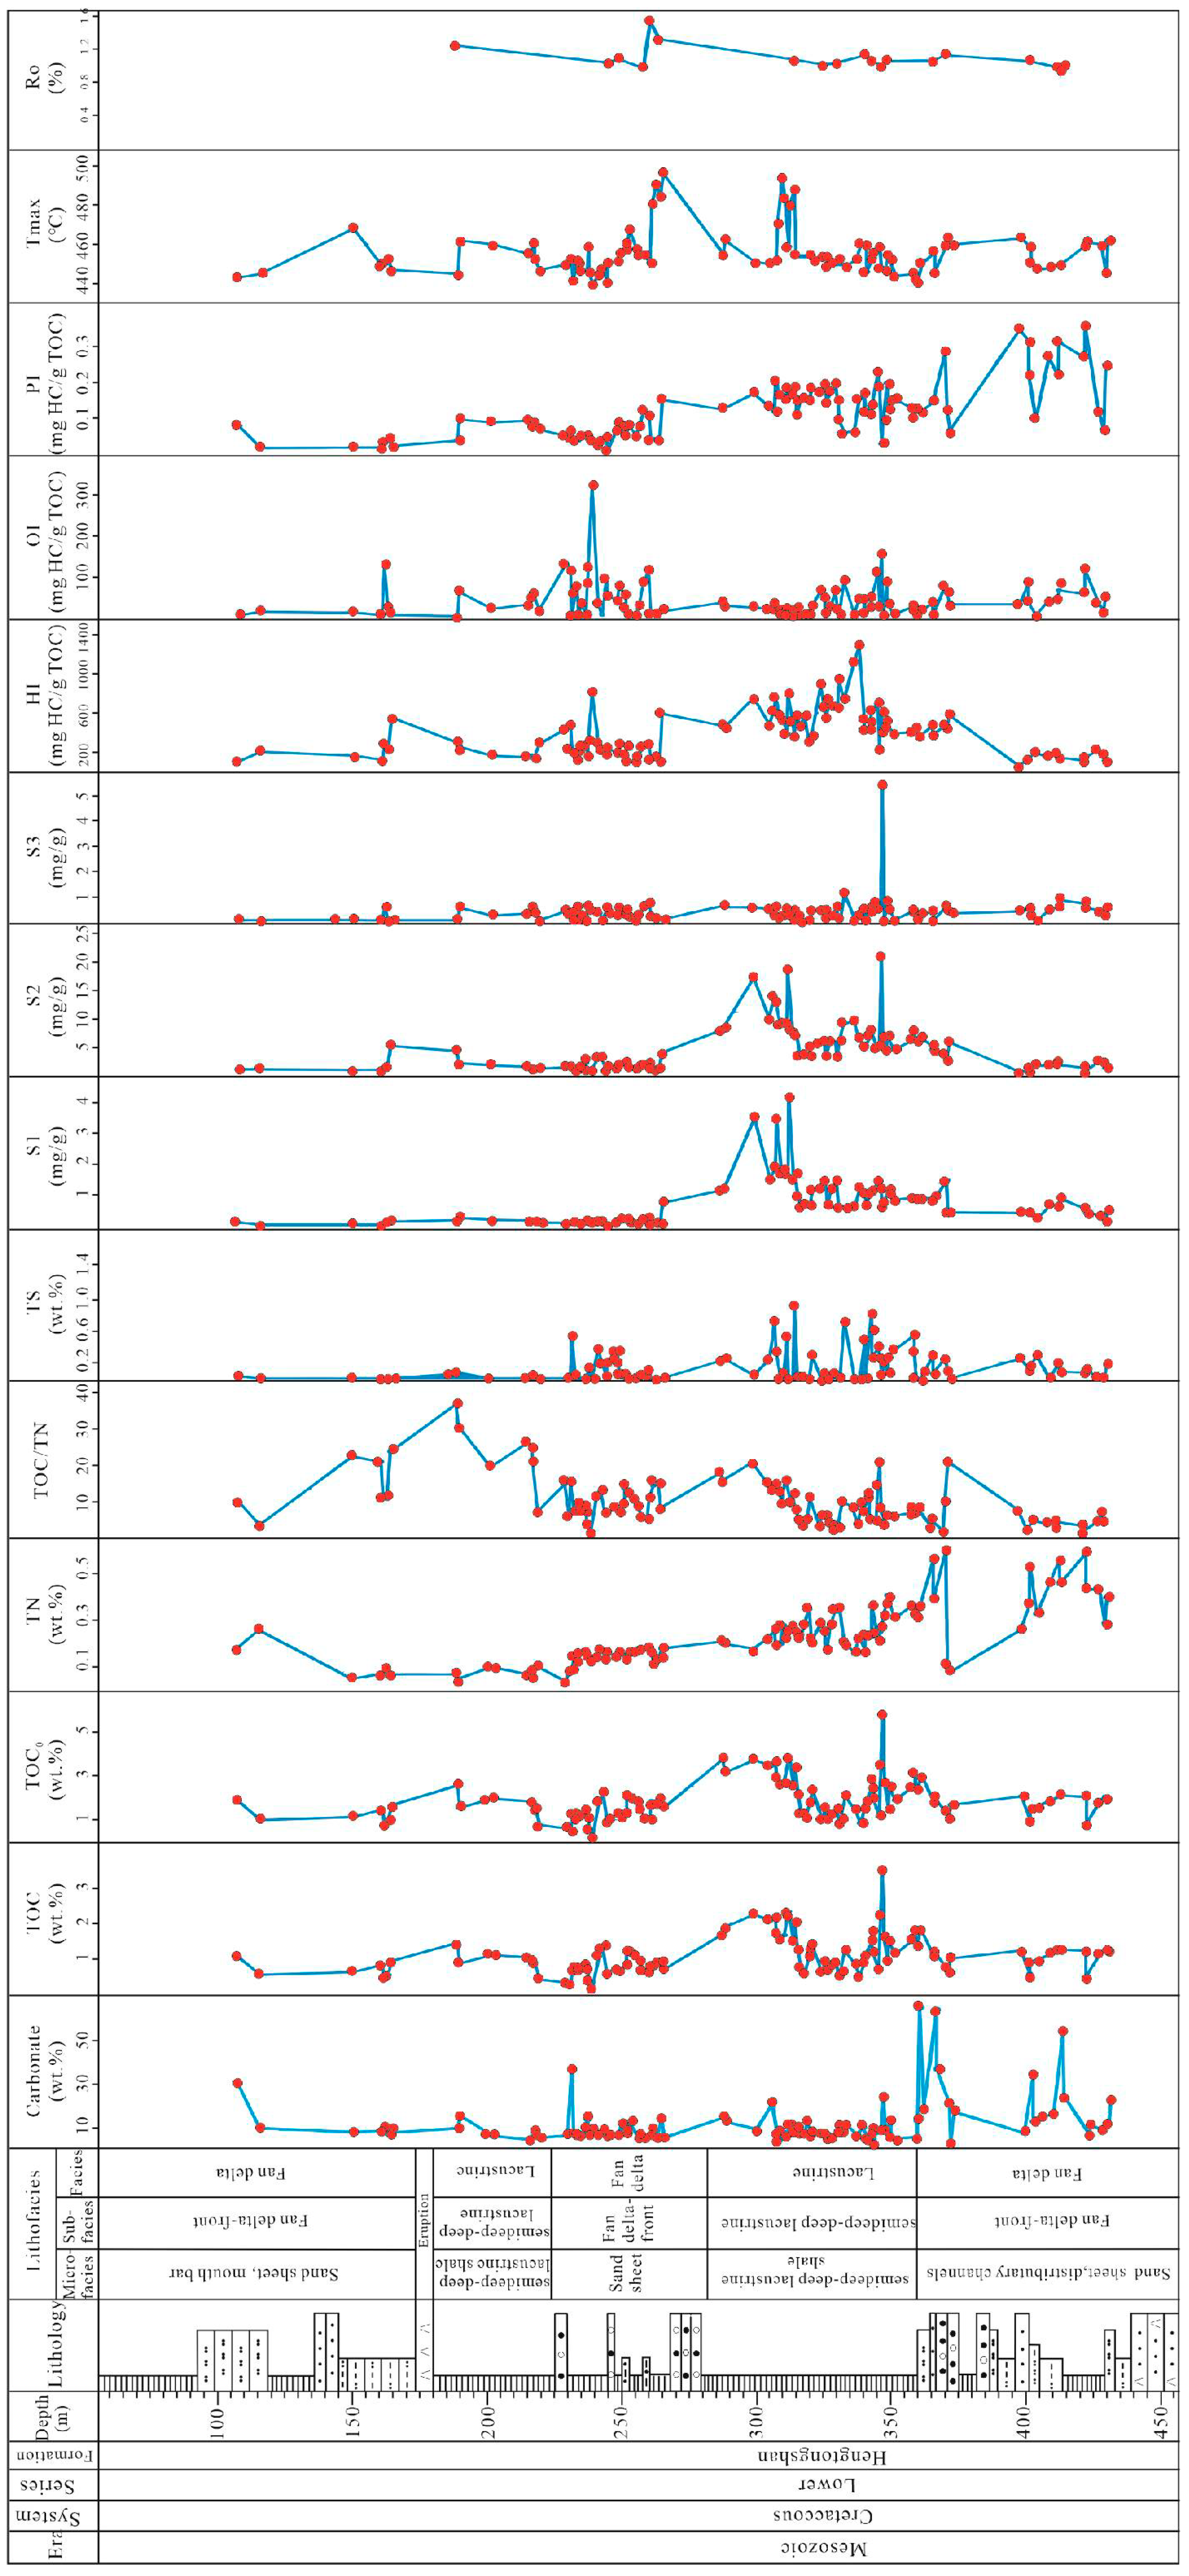
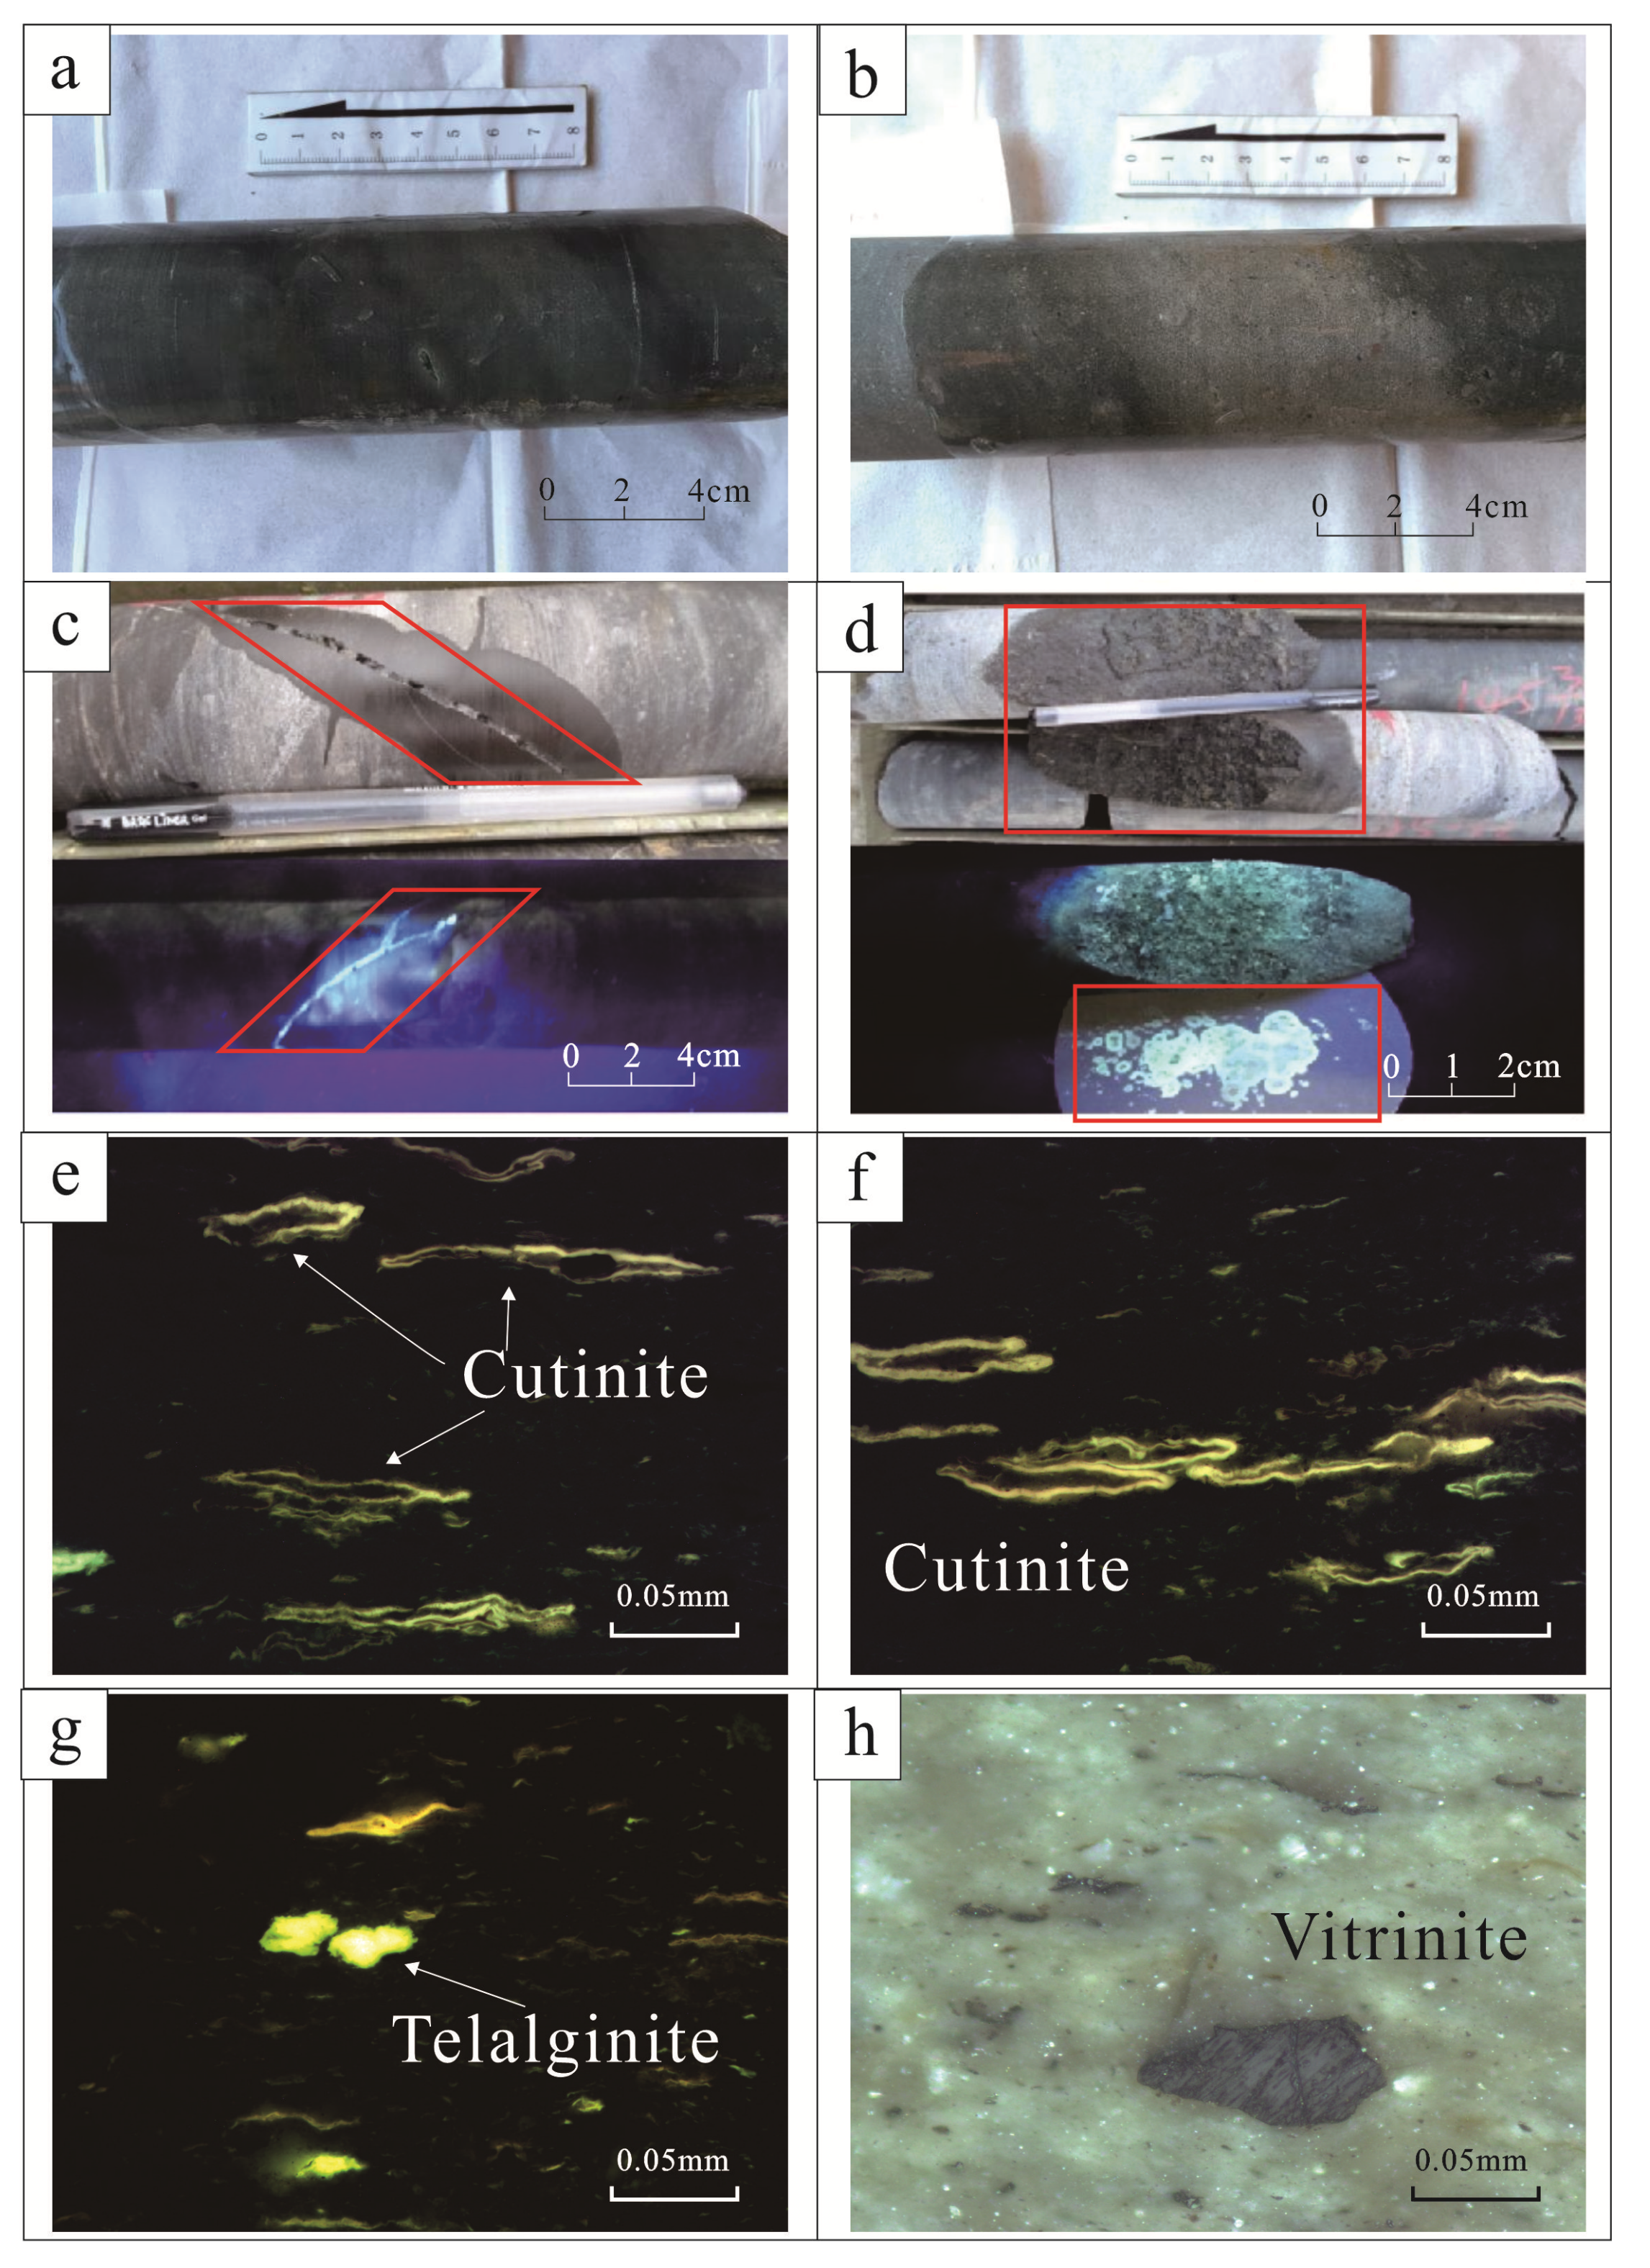
4.1. Lithology
4.2. Minerals
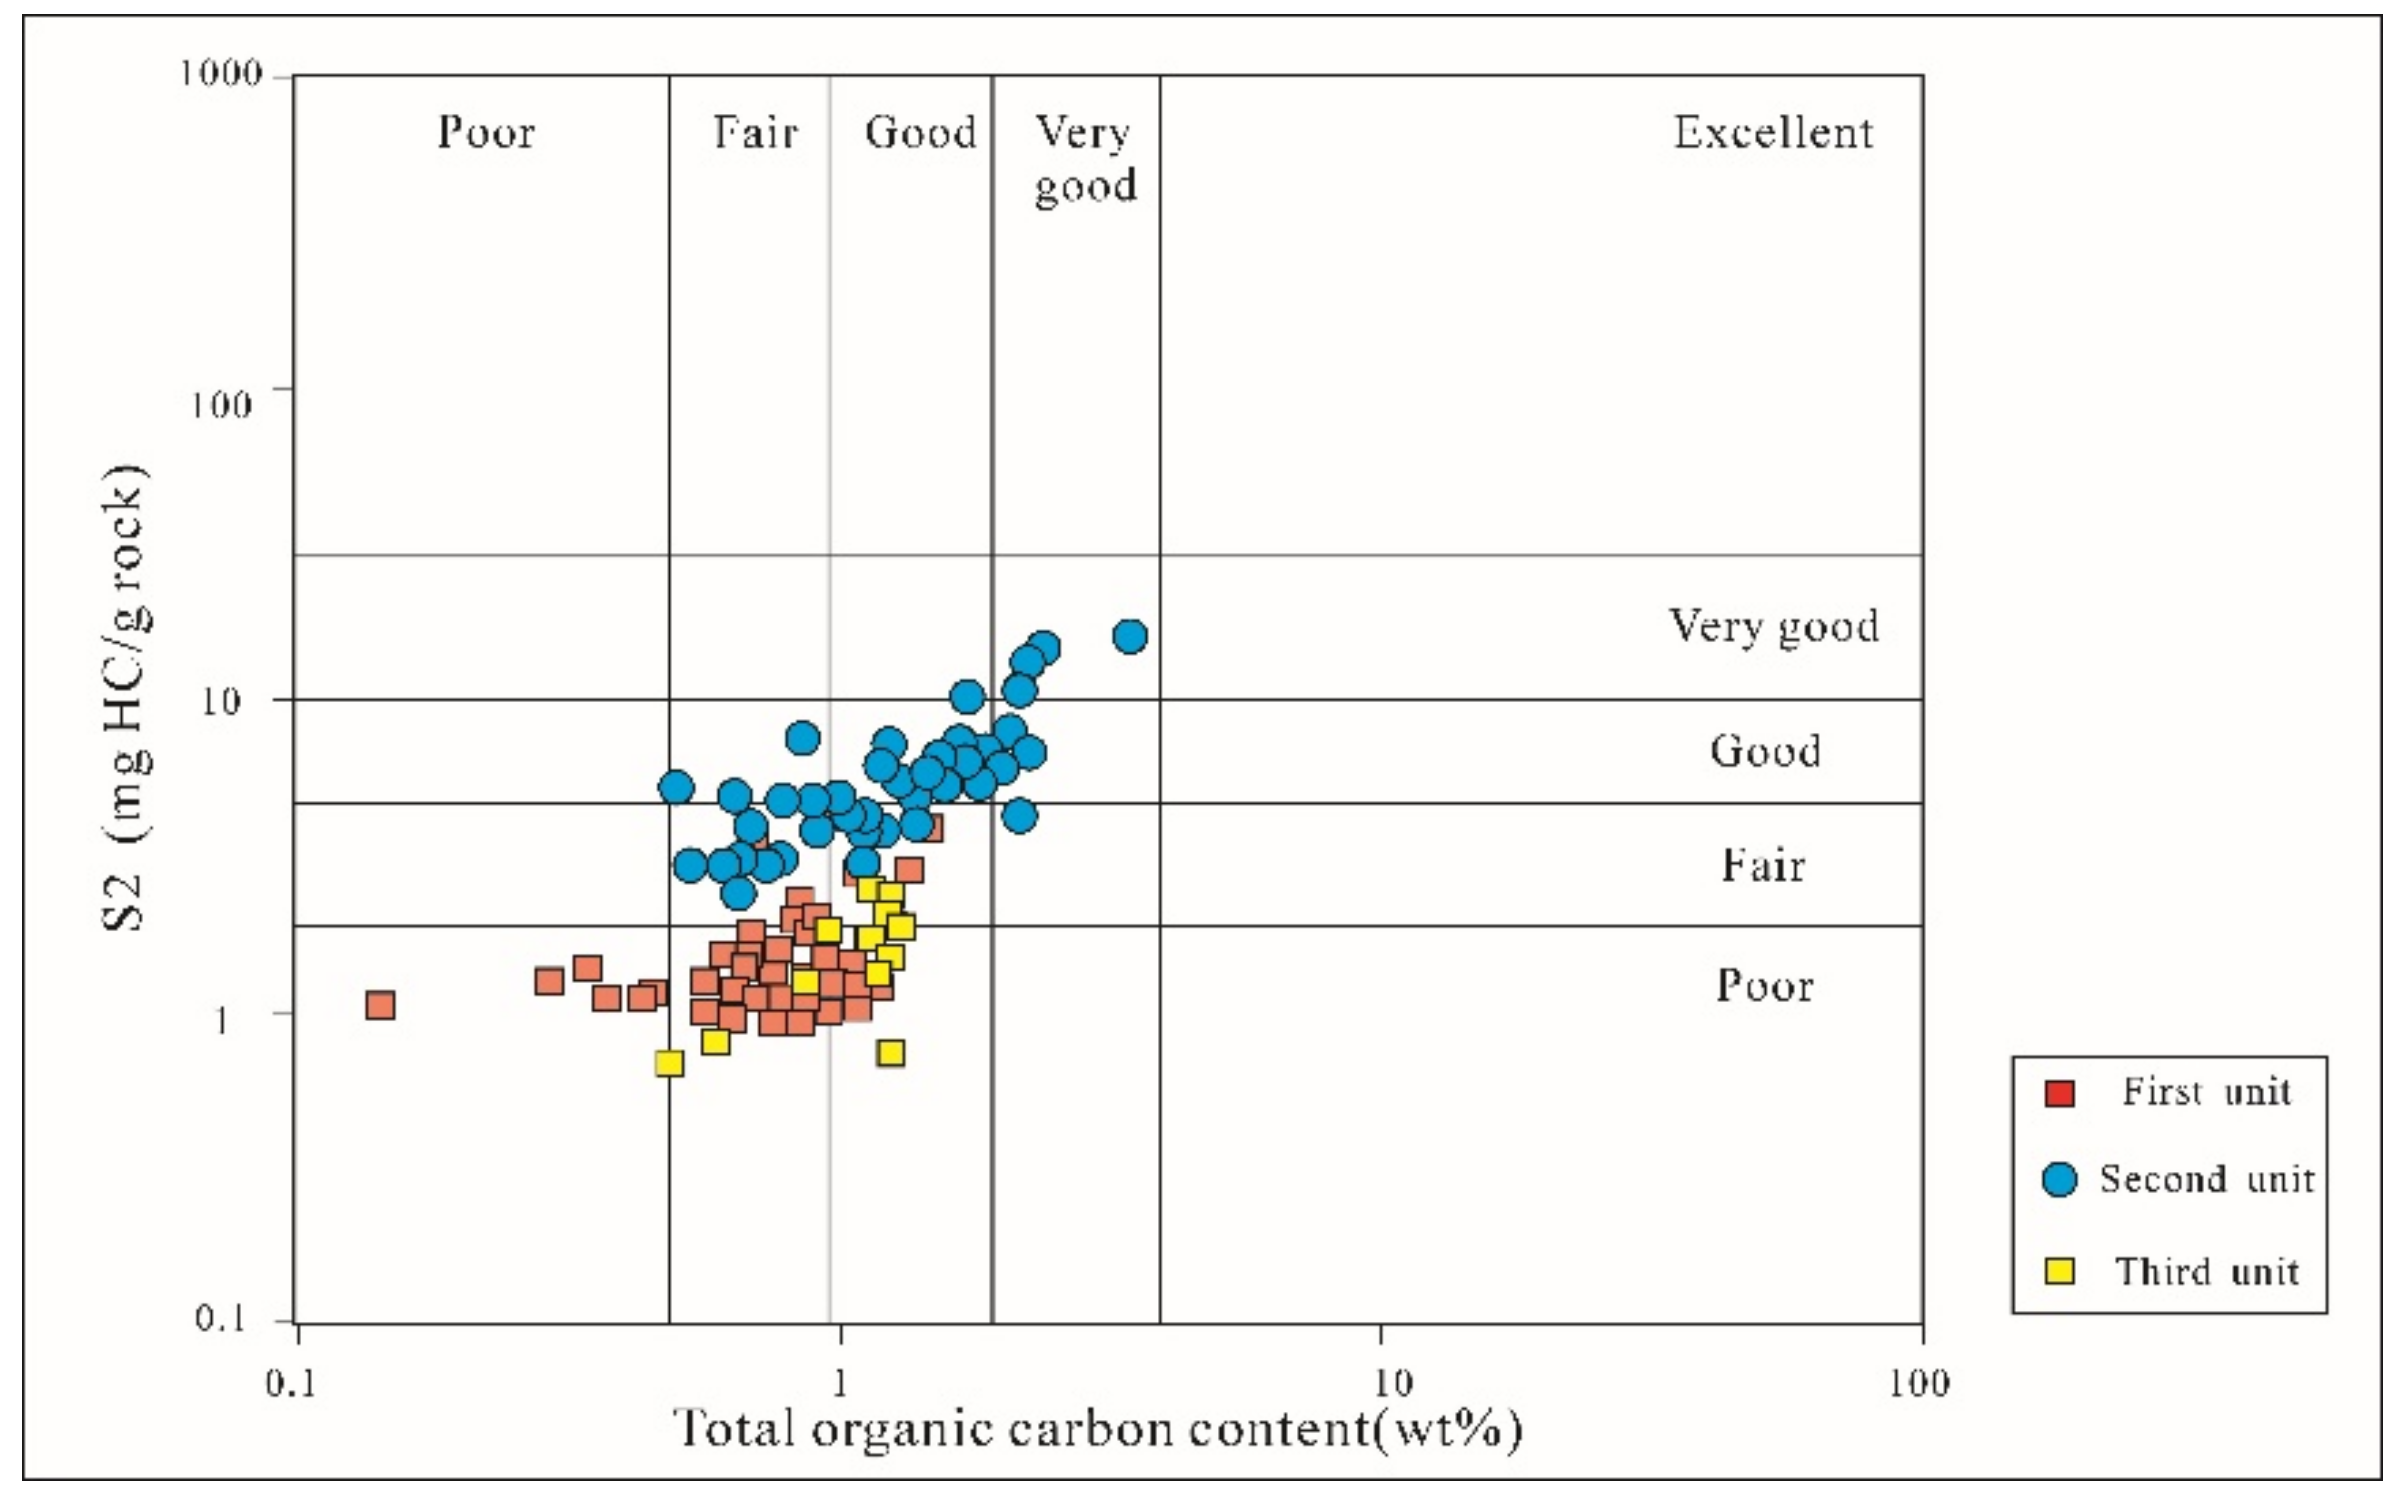
4.3. Bulk Geochemical Parameters
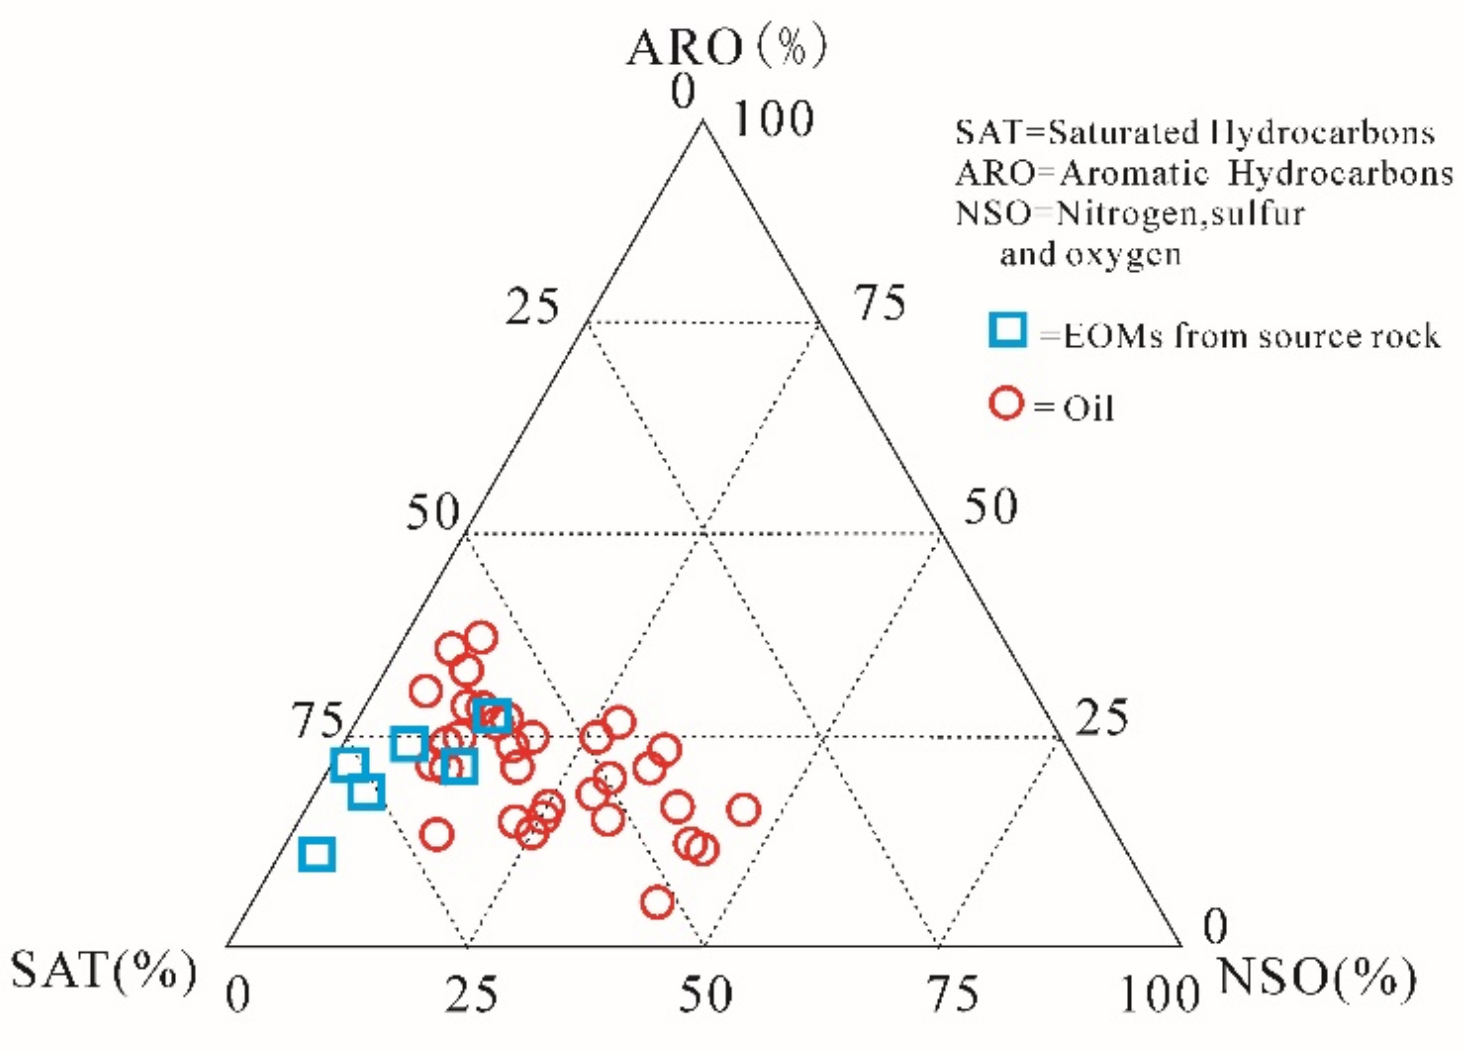
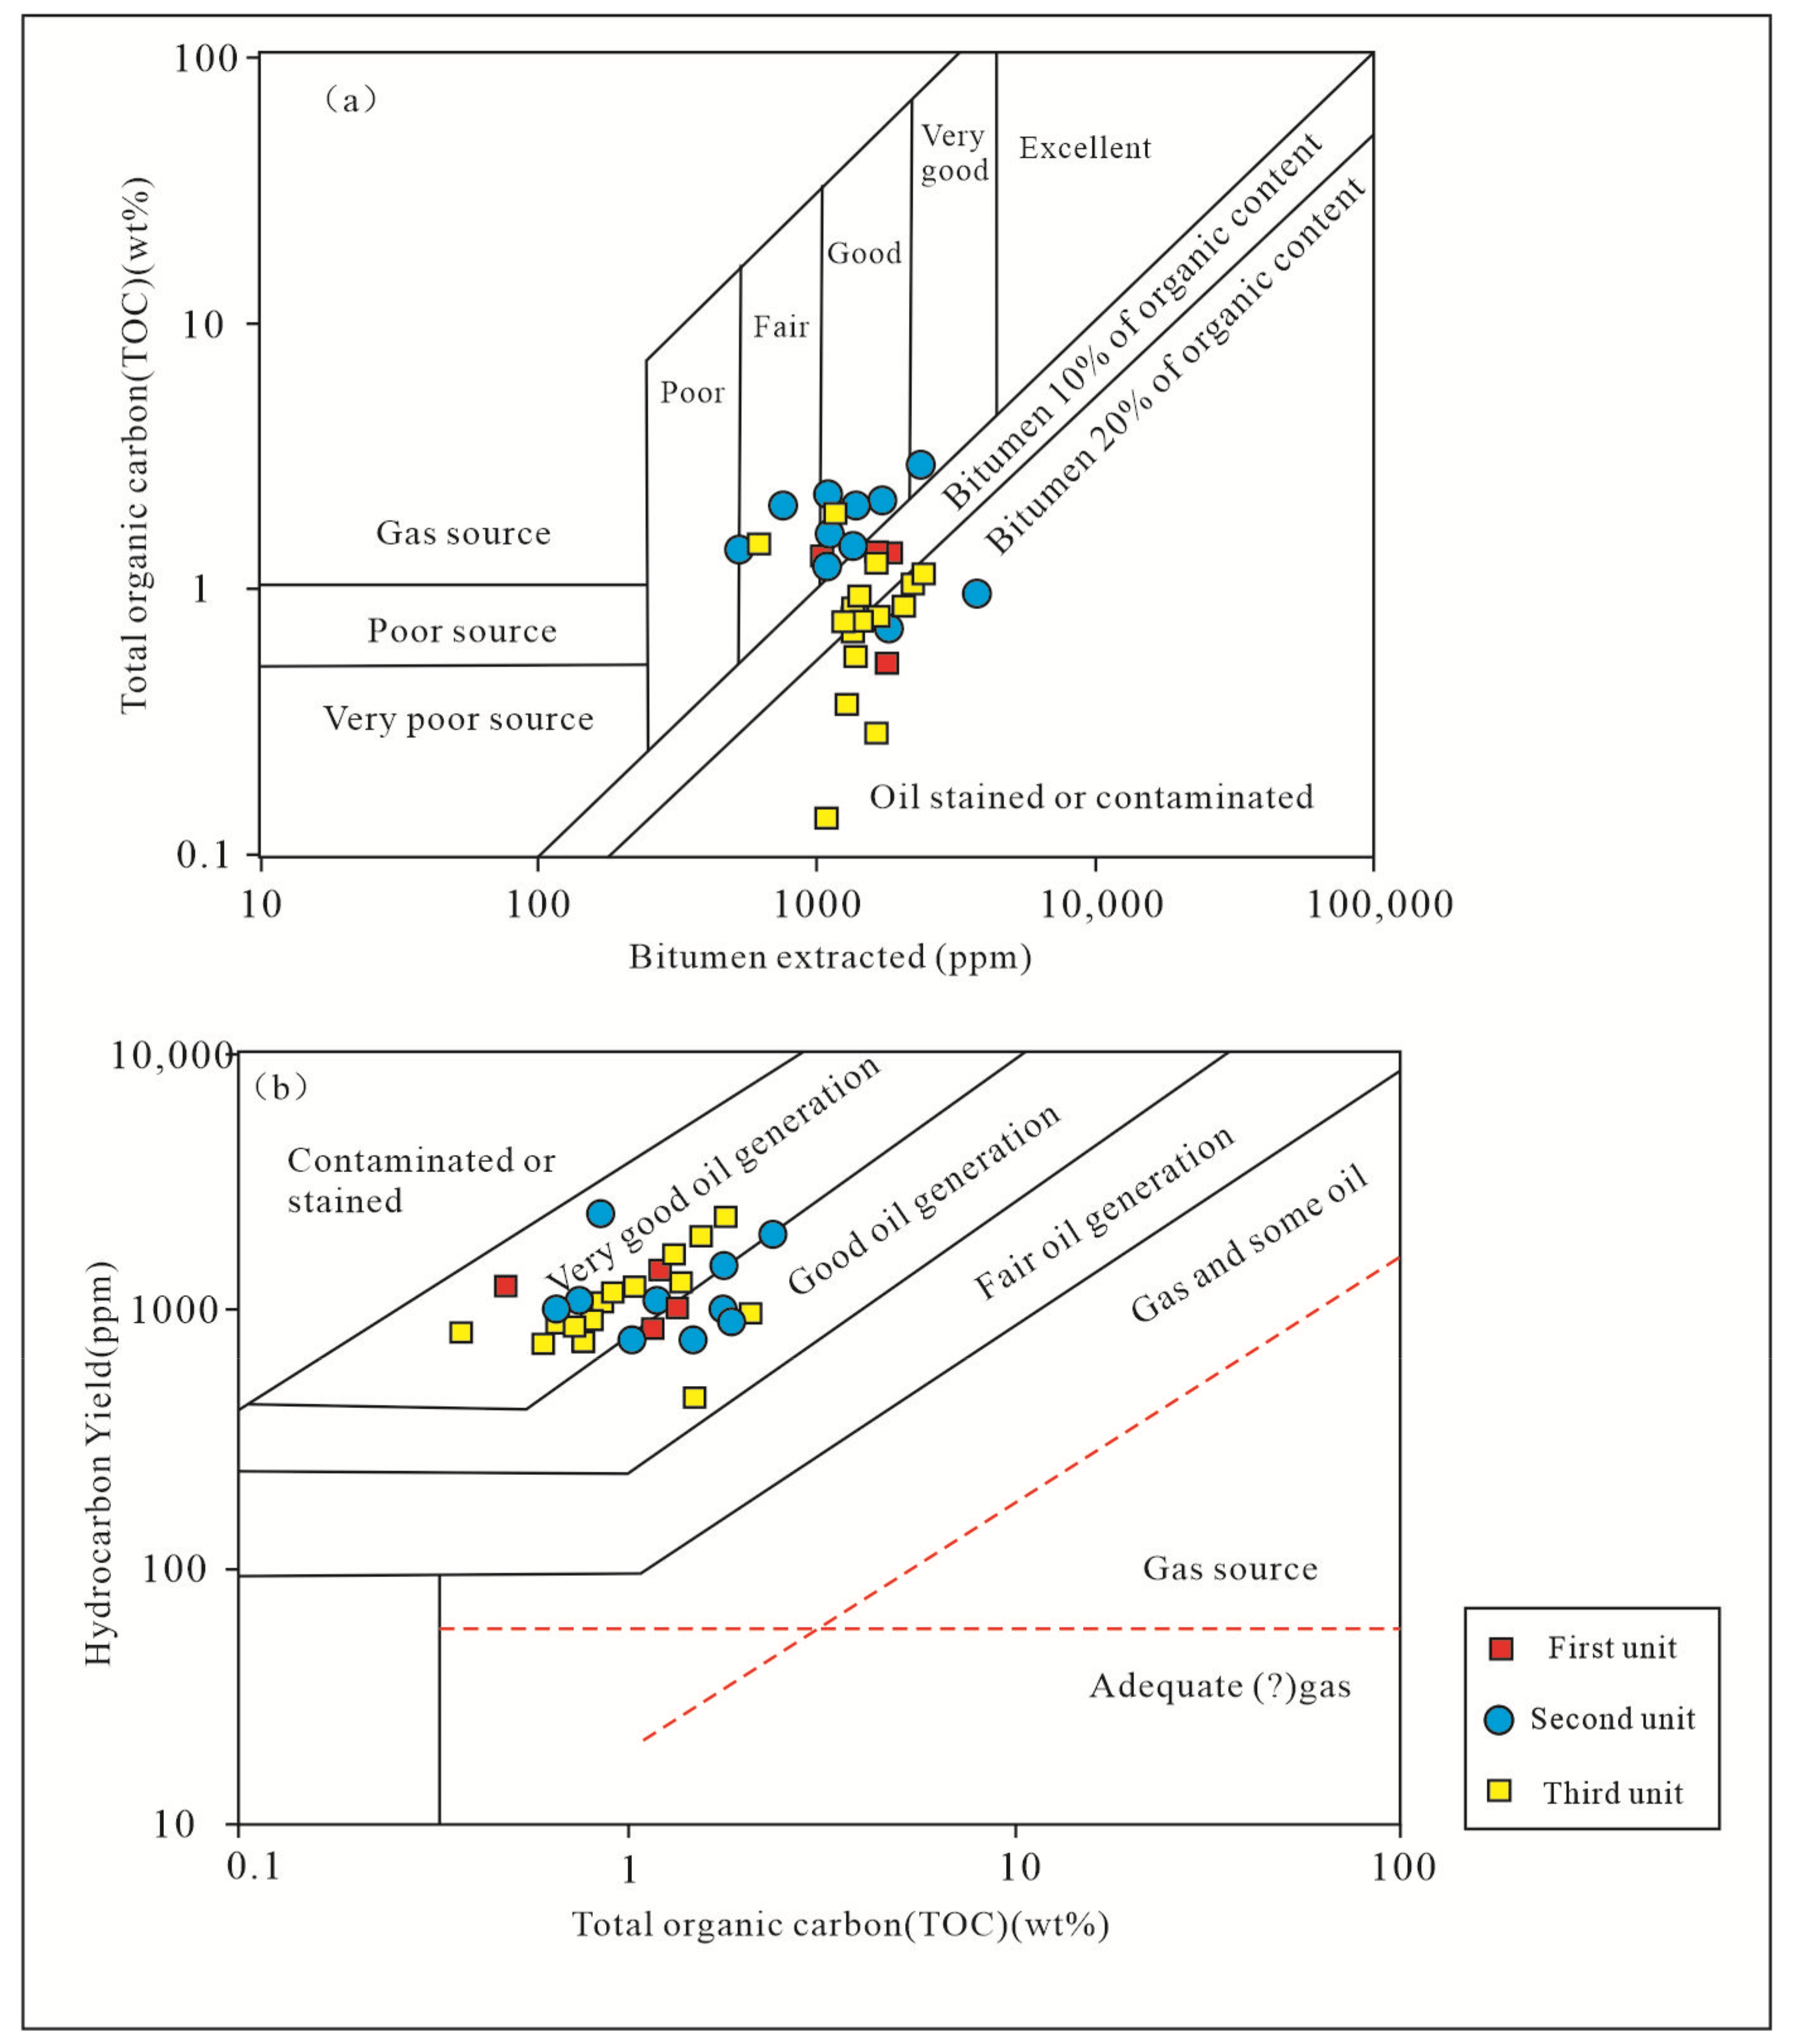
4.4. Bitumen Bulk Geochemical Parameters
4.5. Organic Geochemistry
4.5.1. n-Alkanes and Isoprenoids
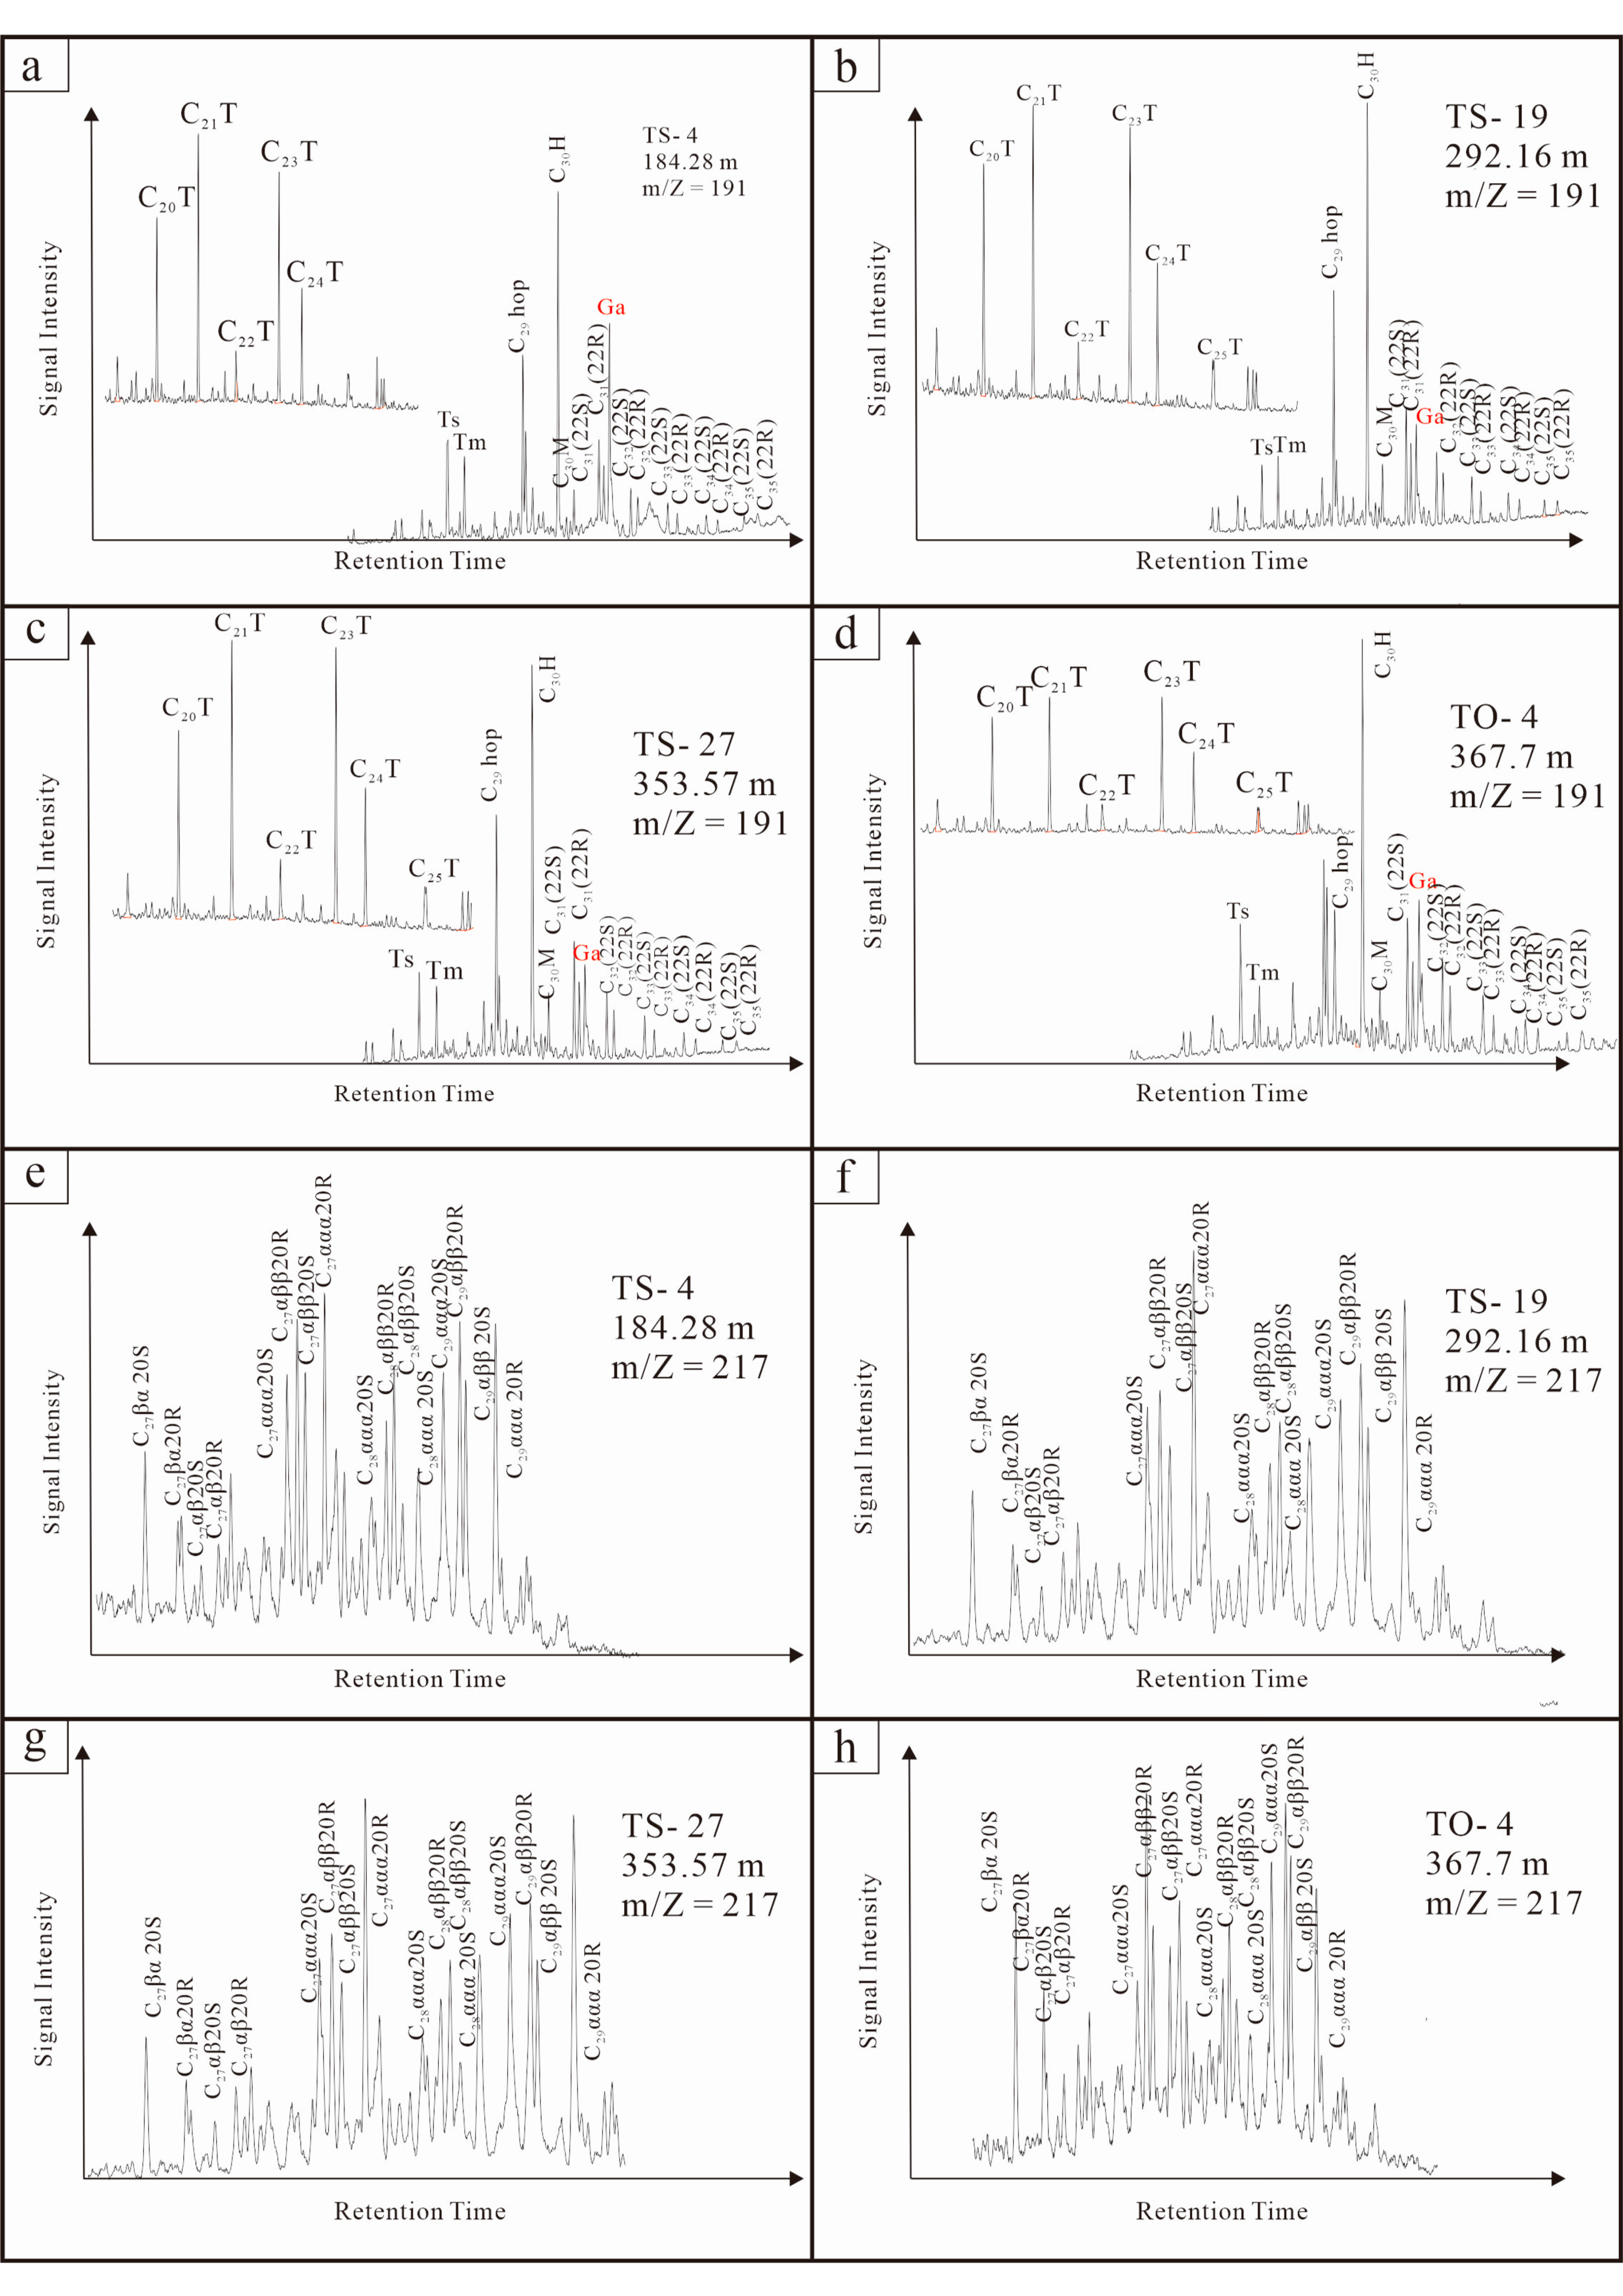
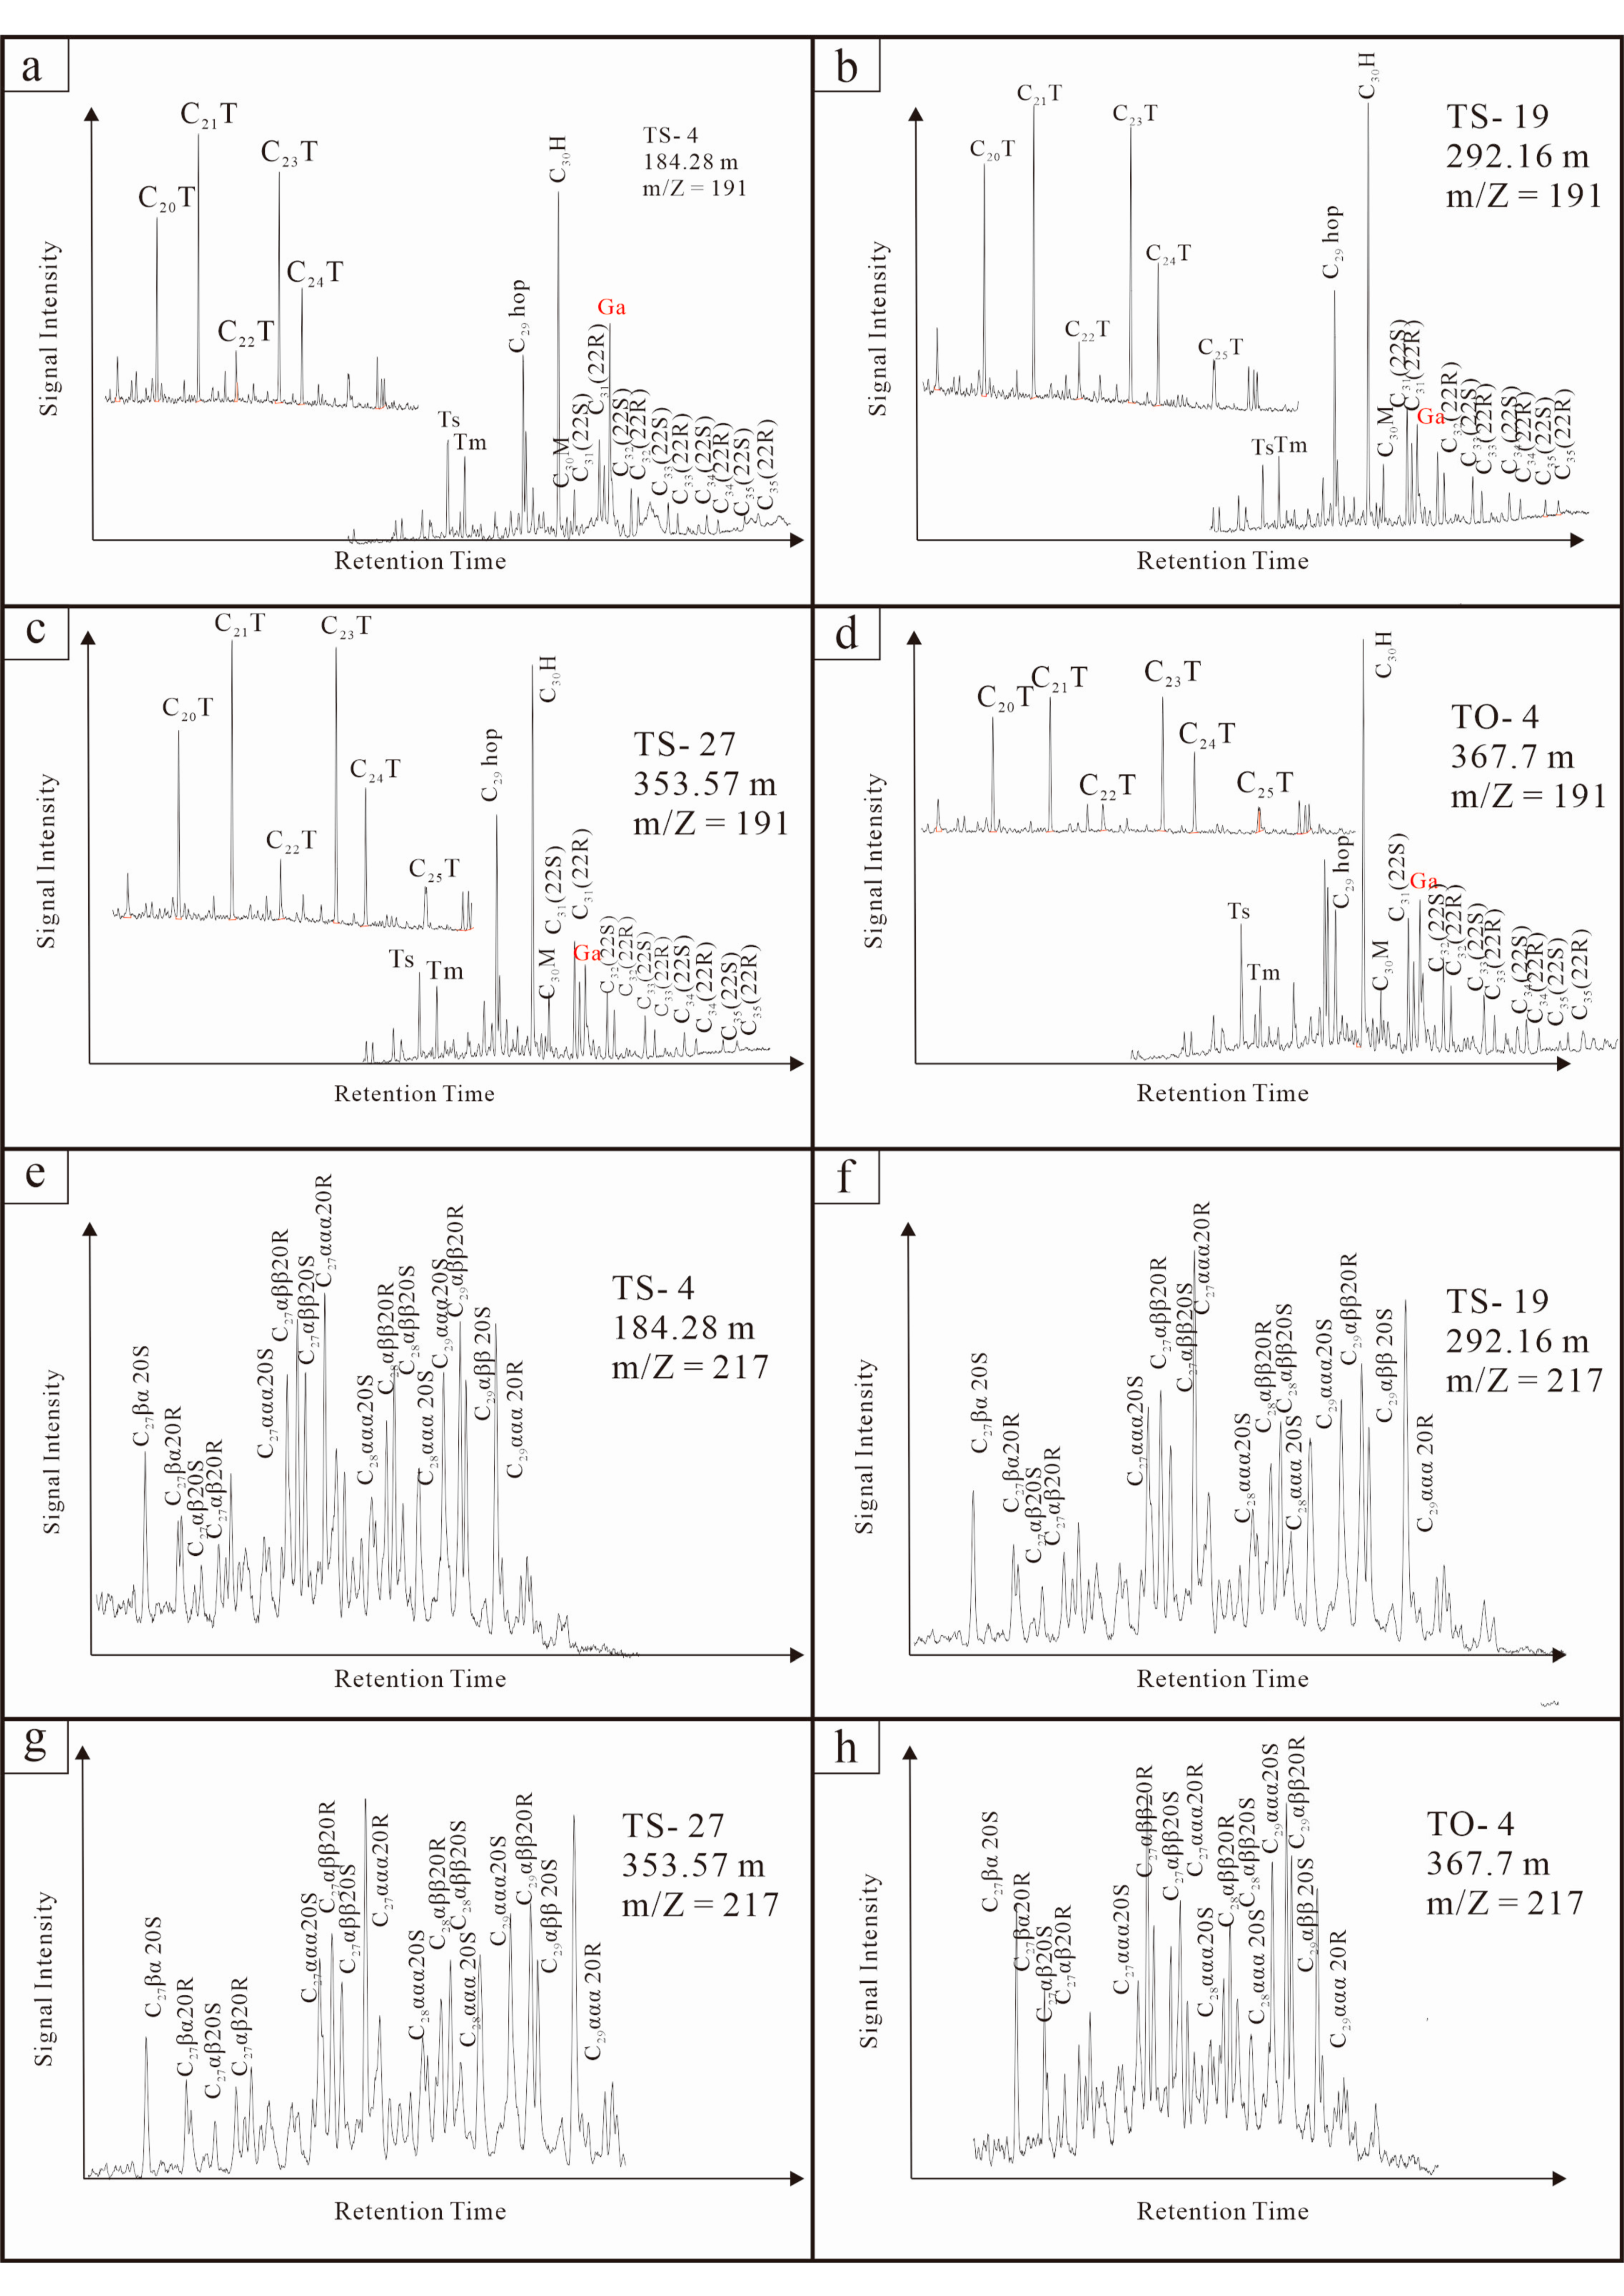
4.5.2. Hopanoids and Steroids
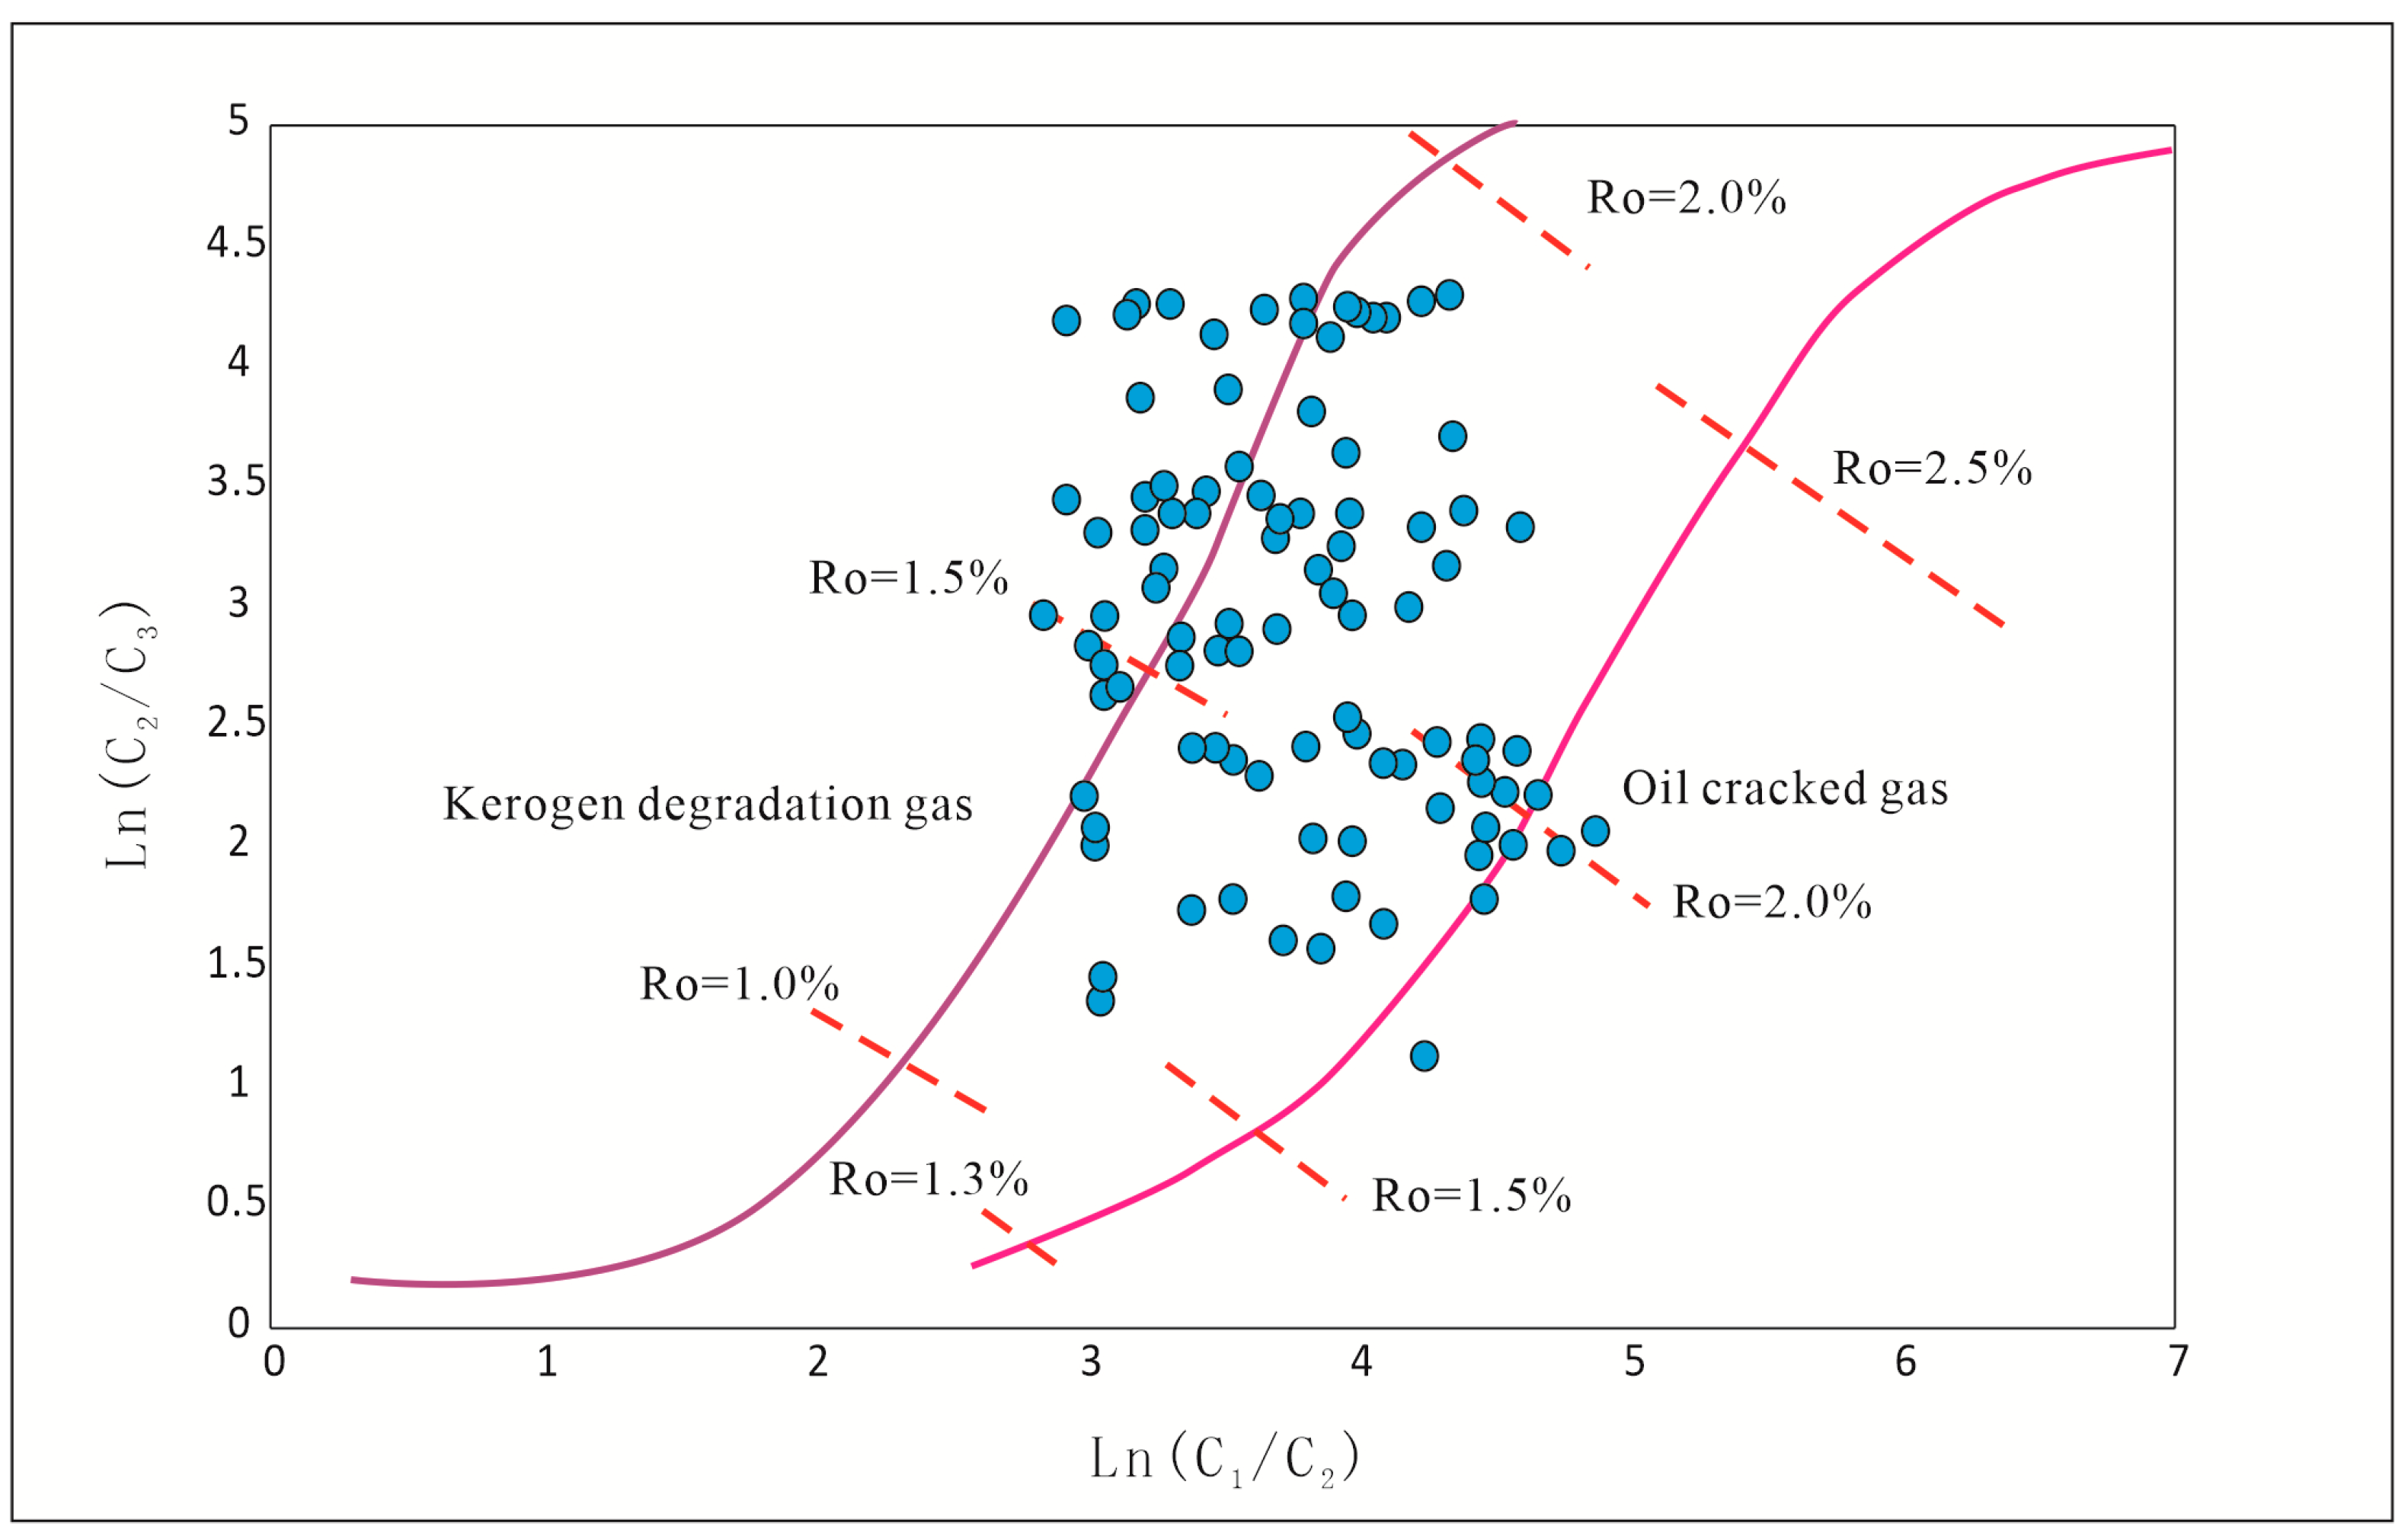
4.6. Natural Gas Geochemical Characteristics
5. Discussion
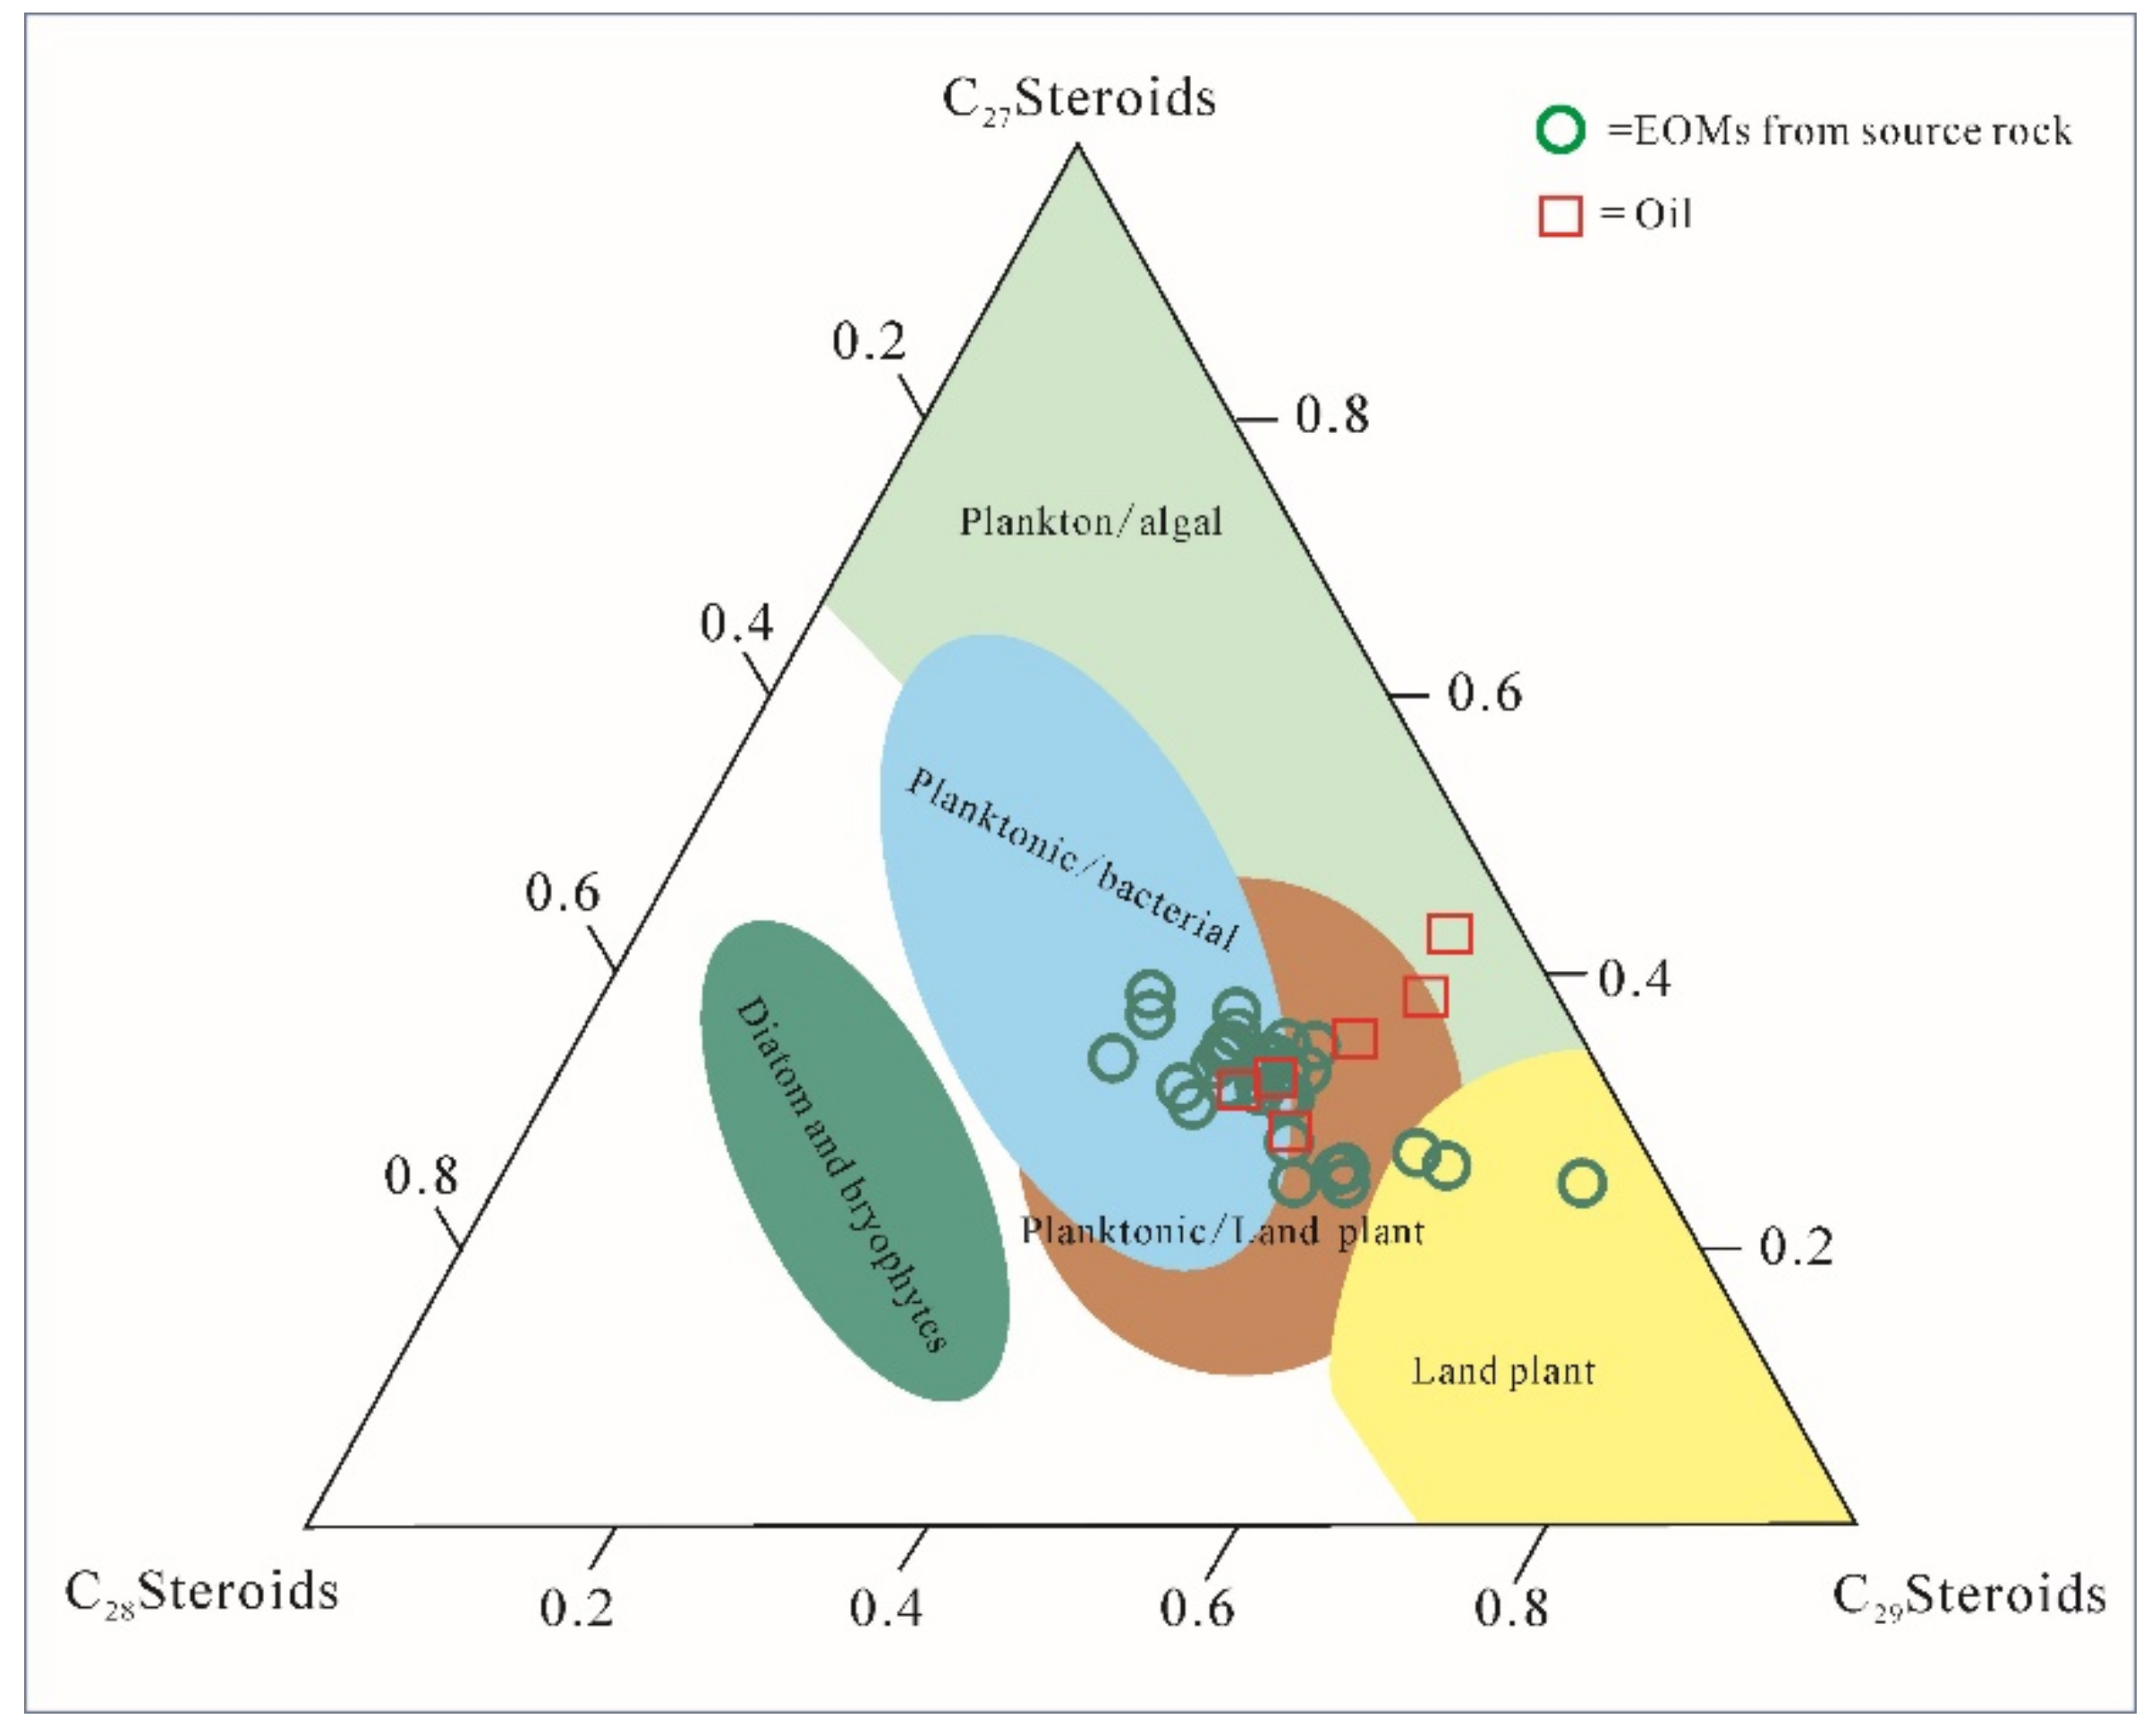
5.1. Oil Source Input
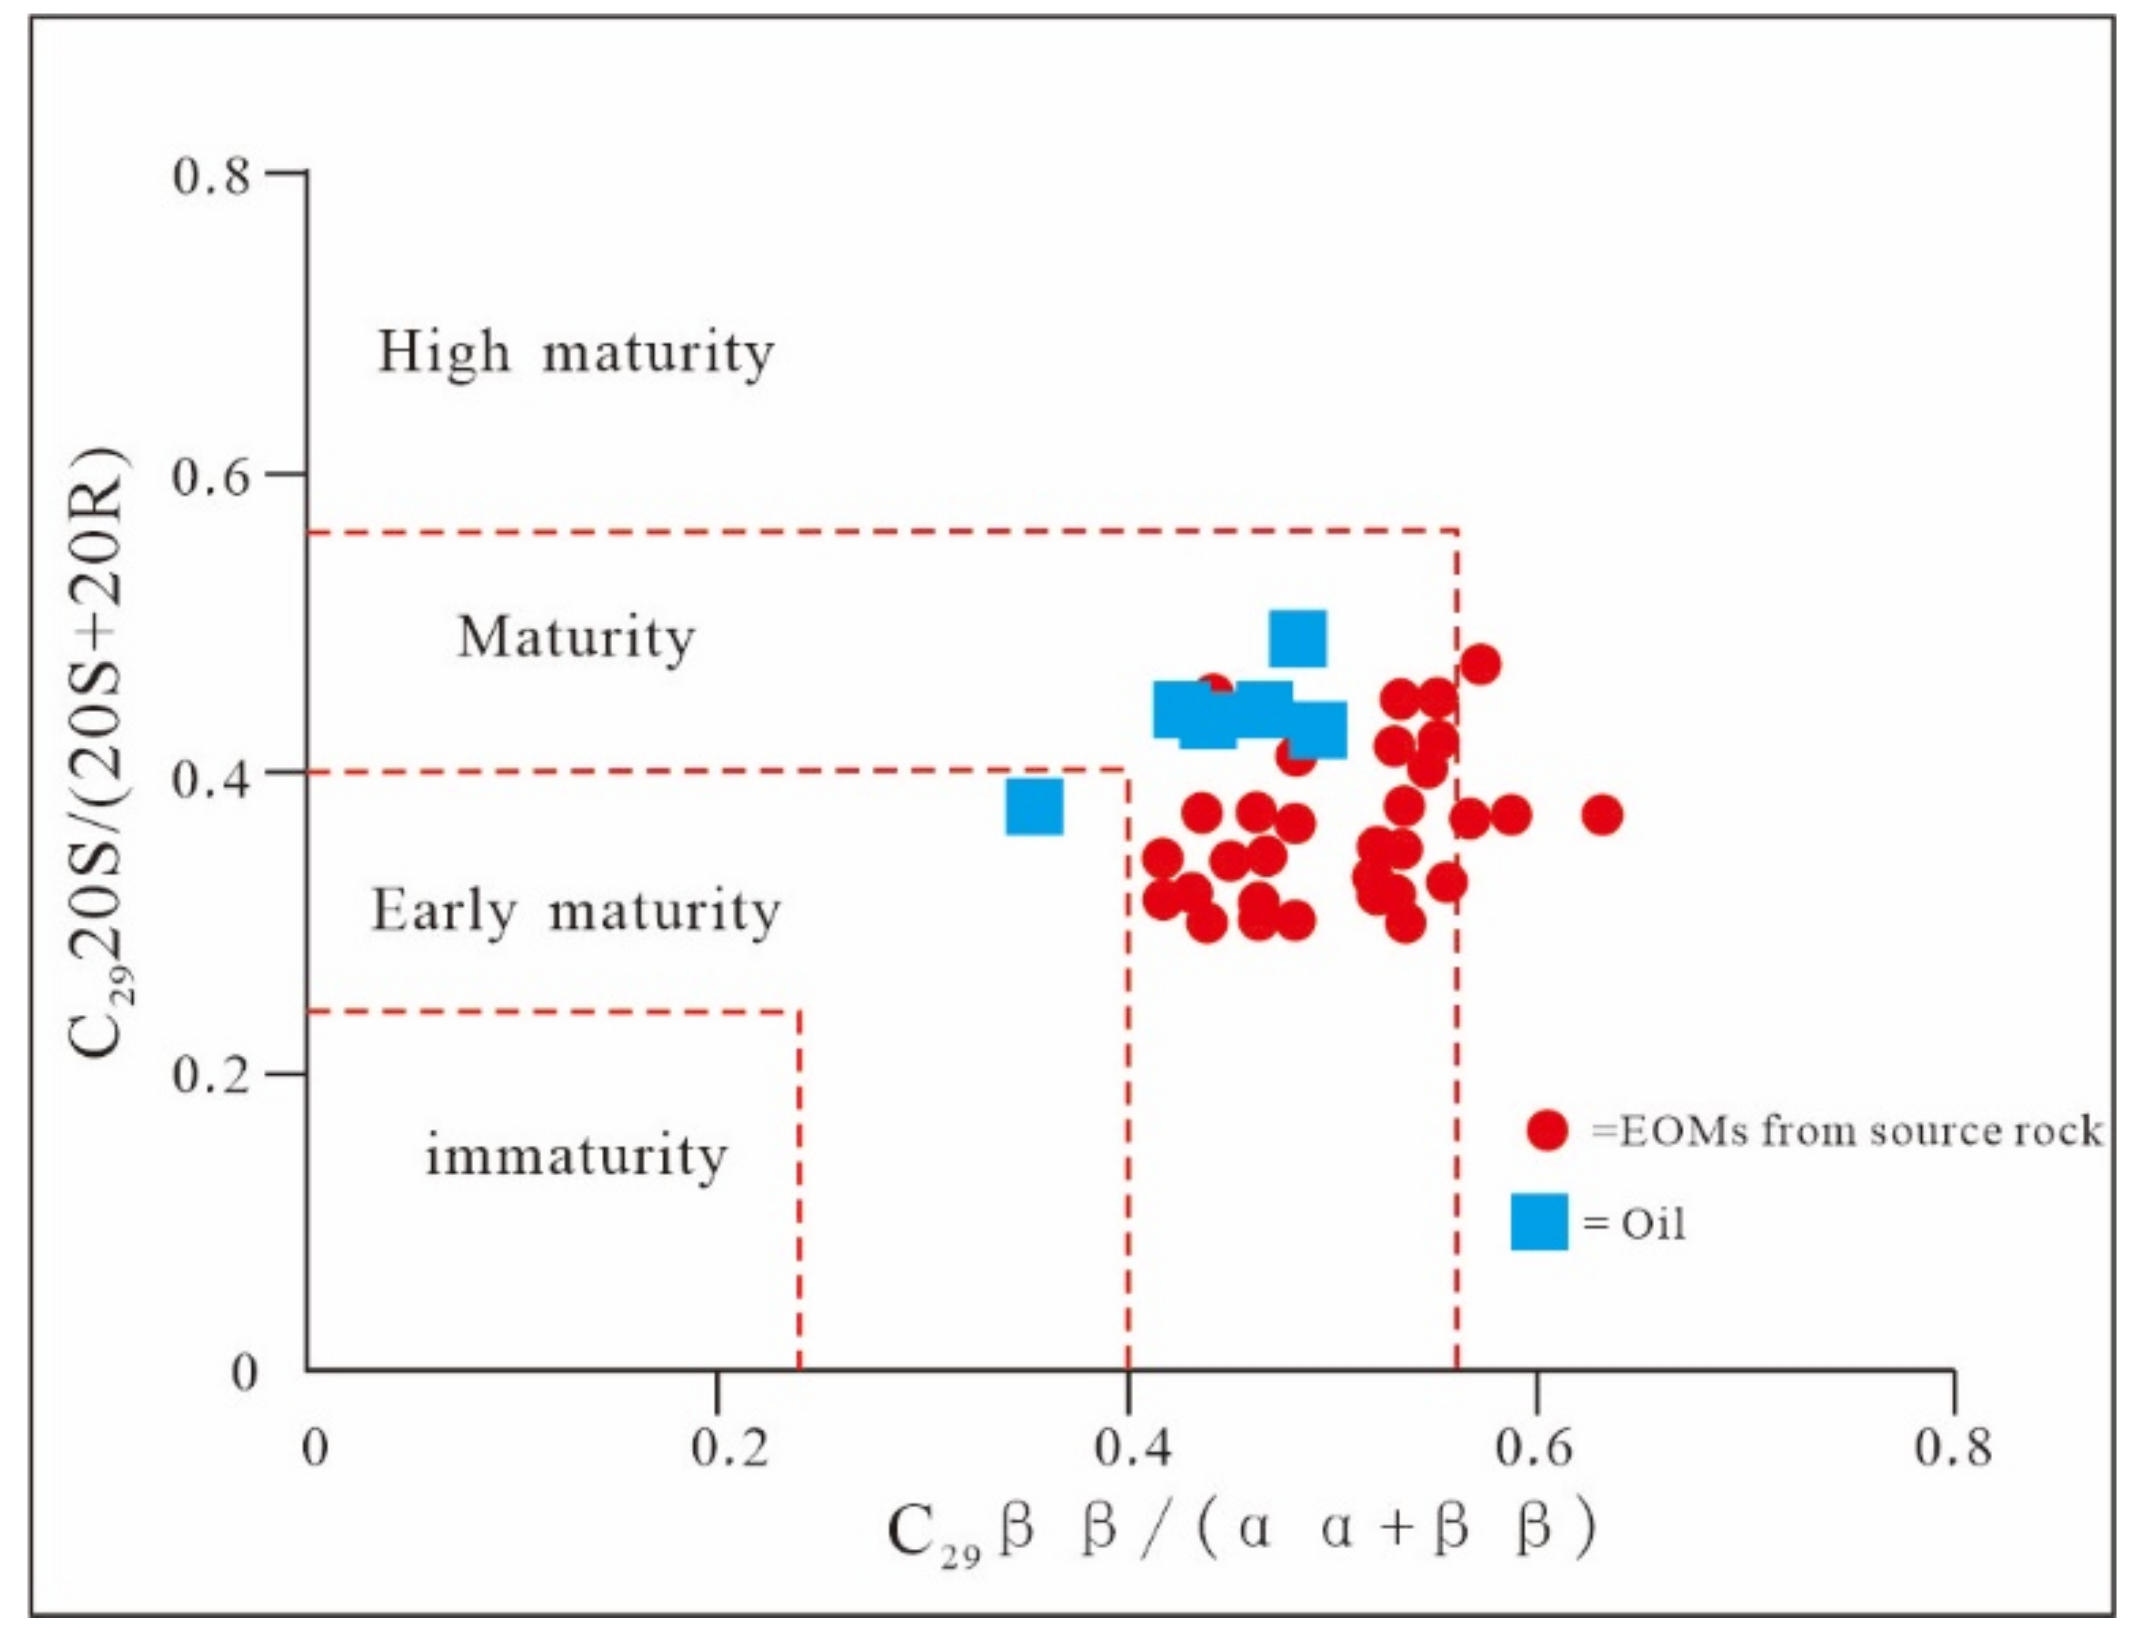
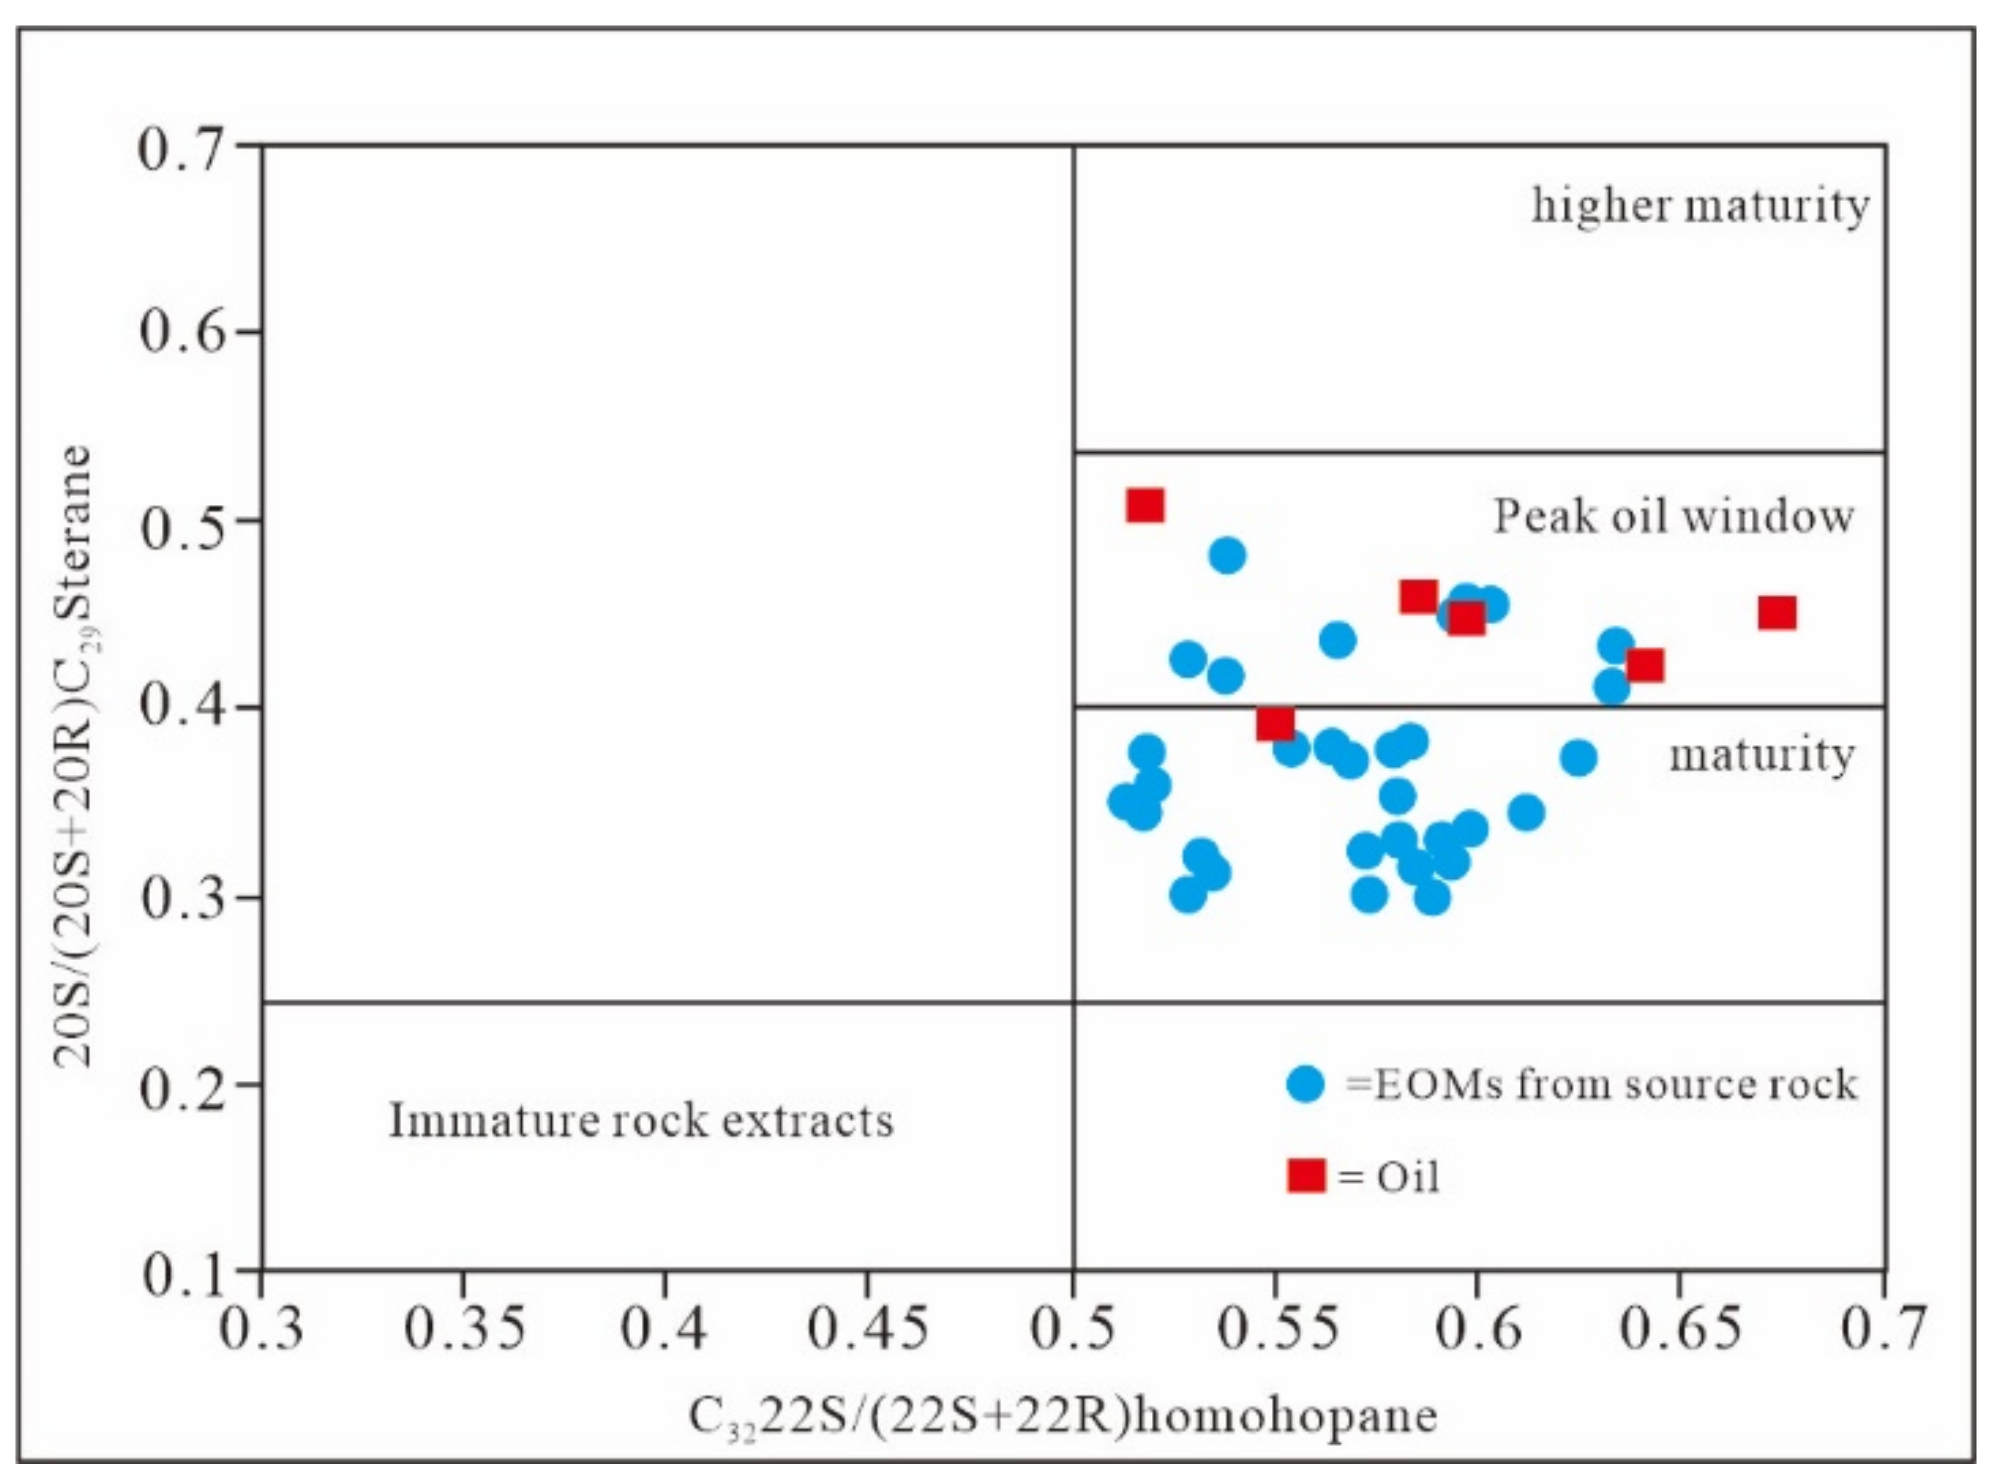
5.2. Maturity
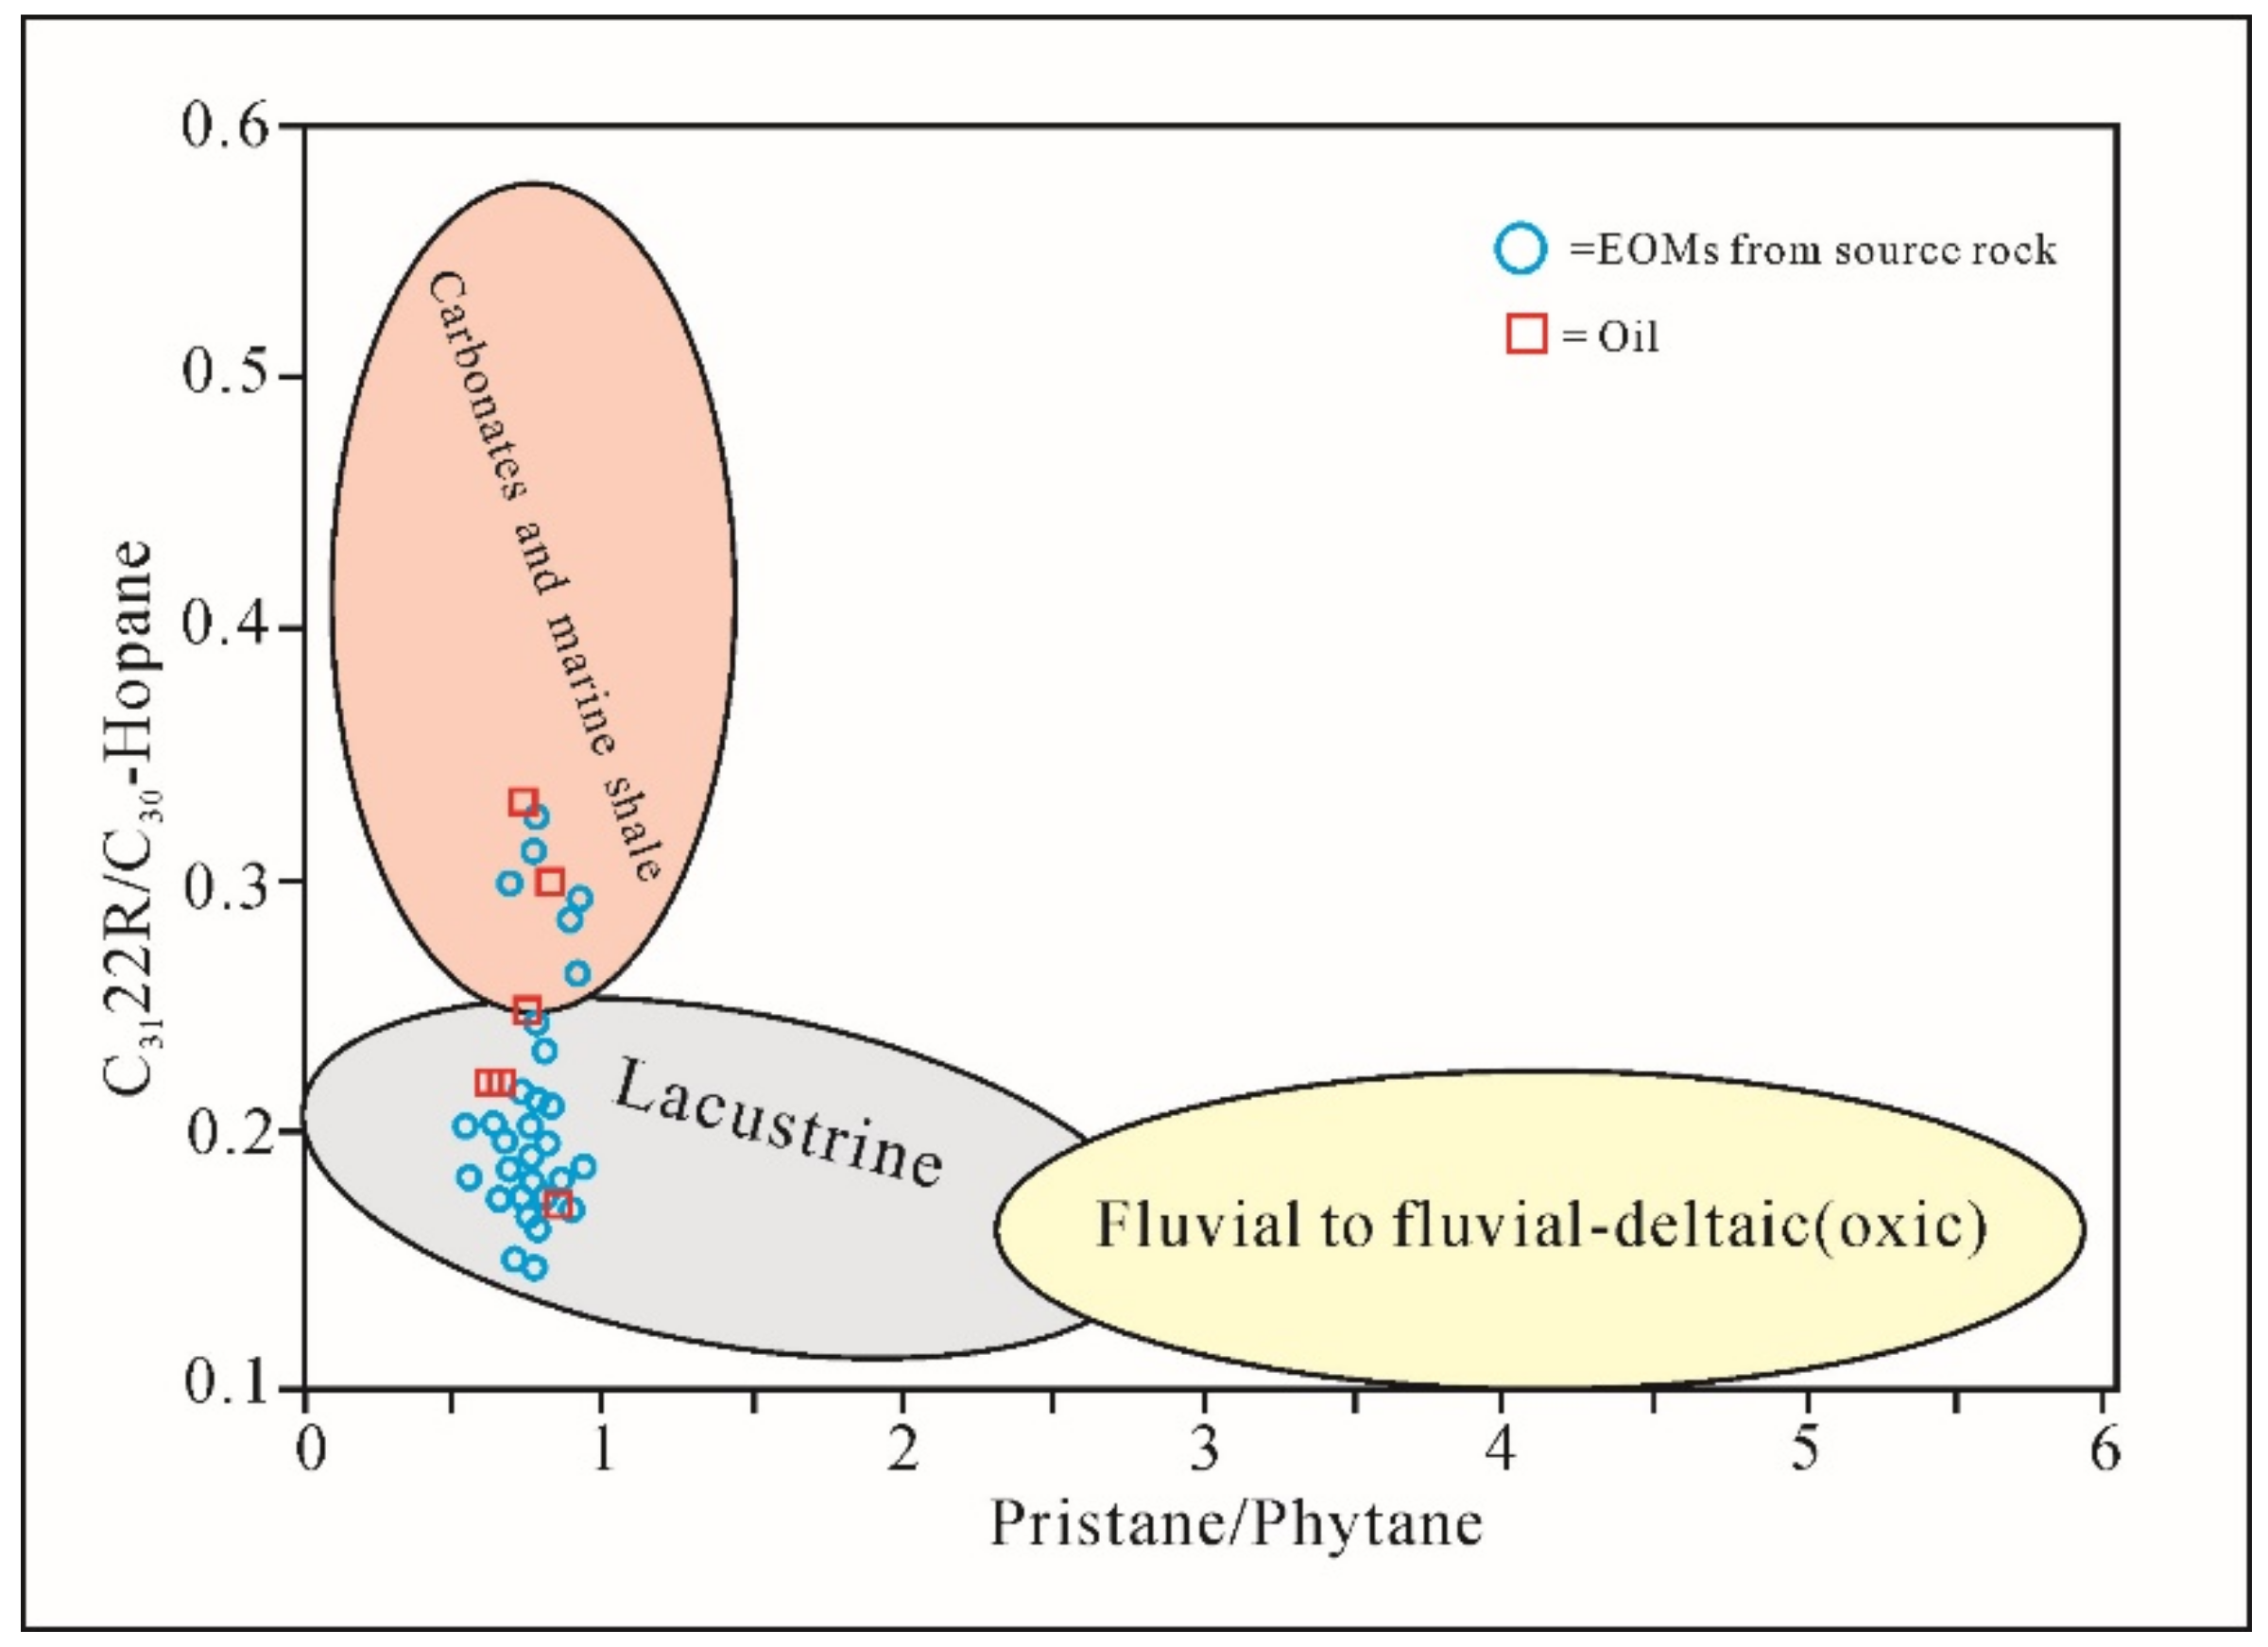
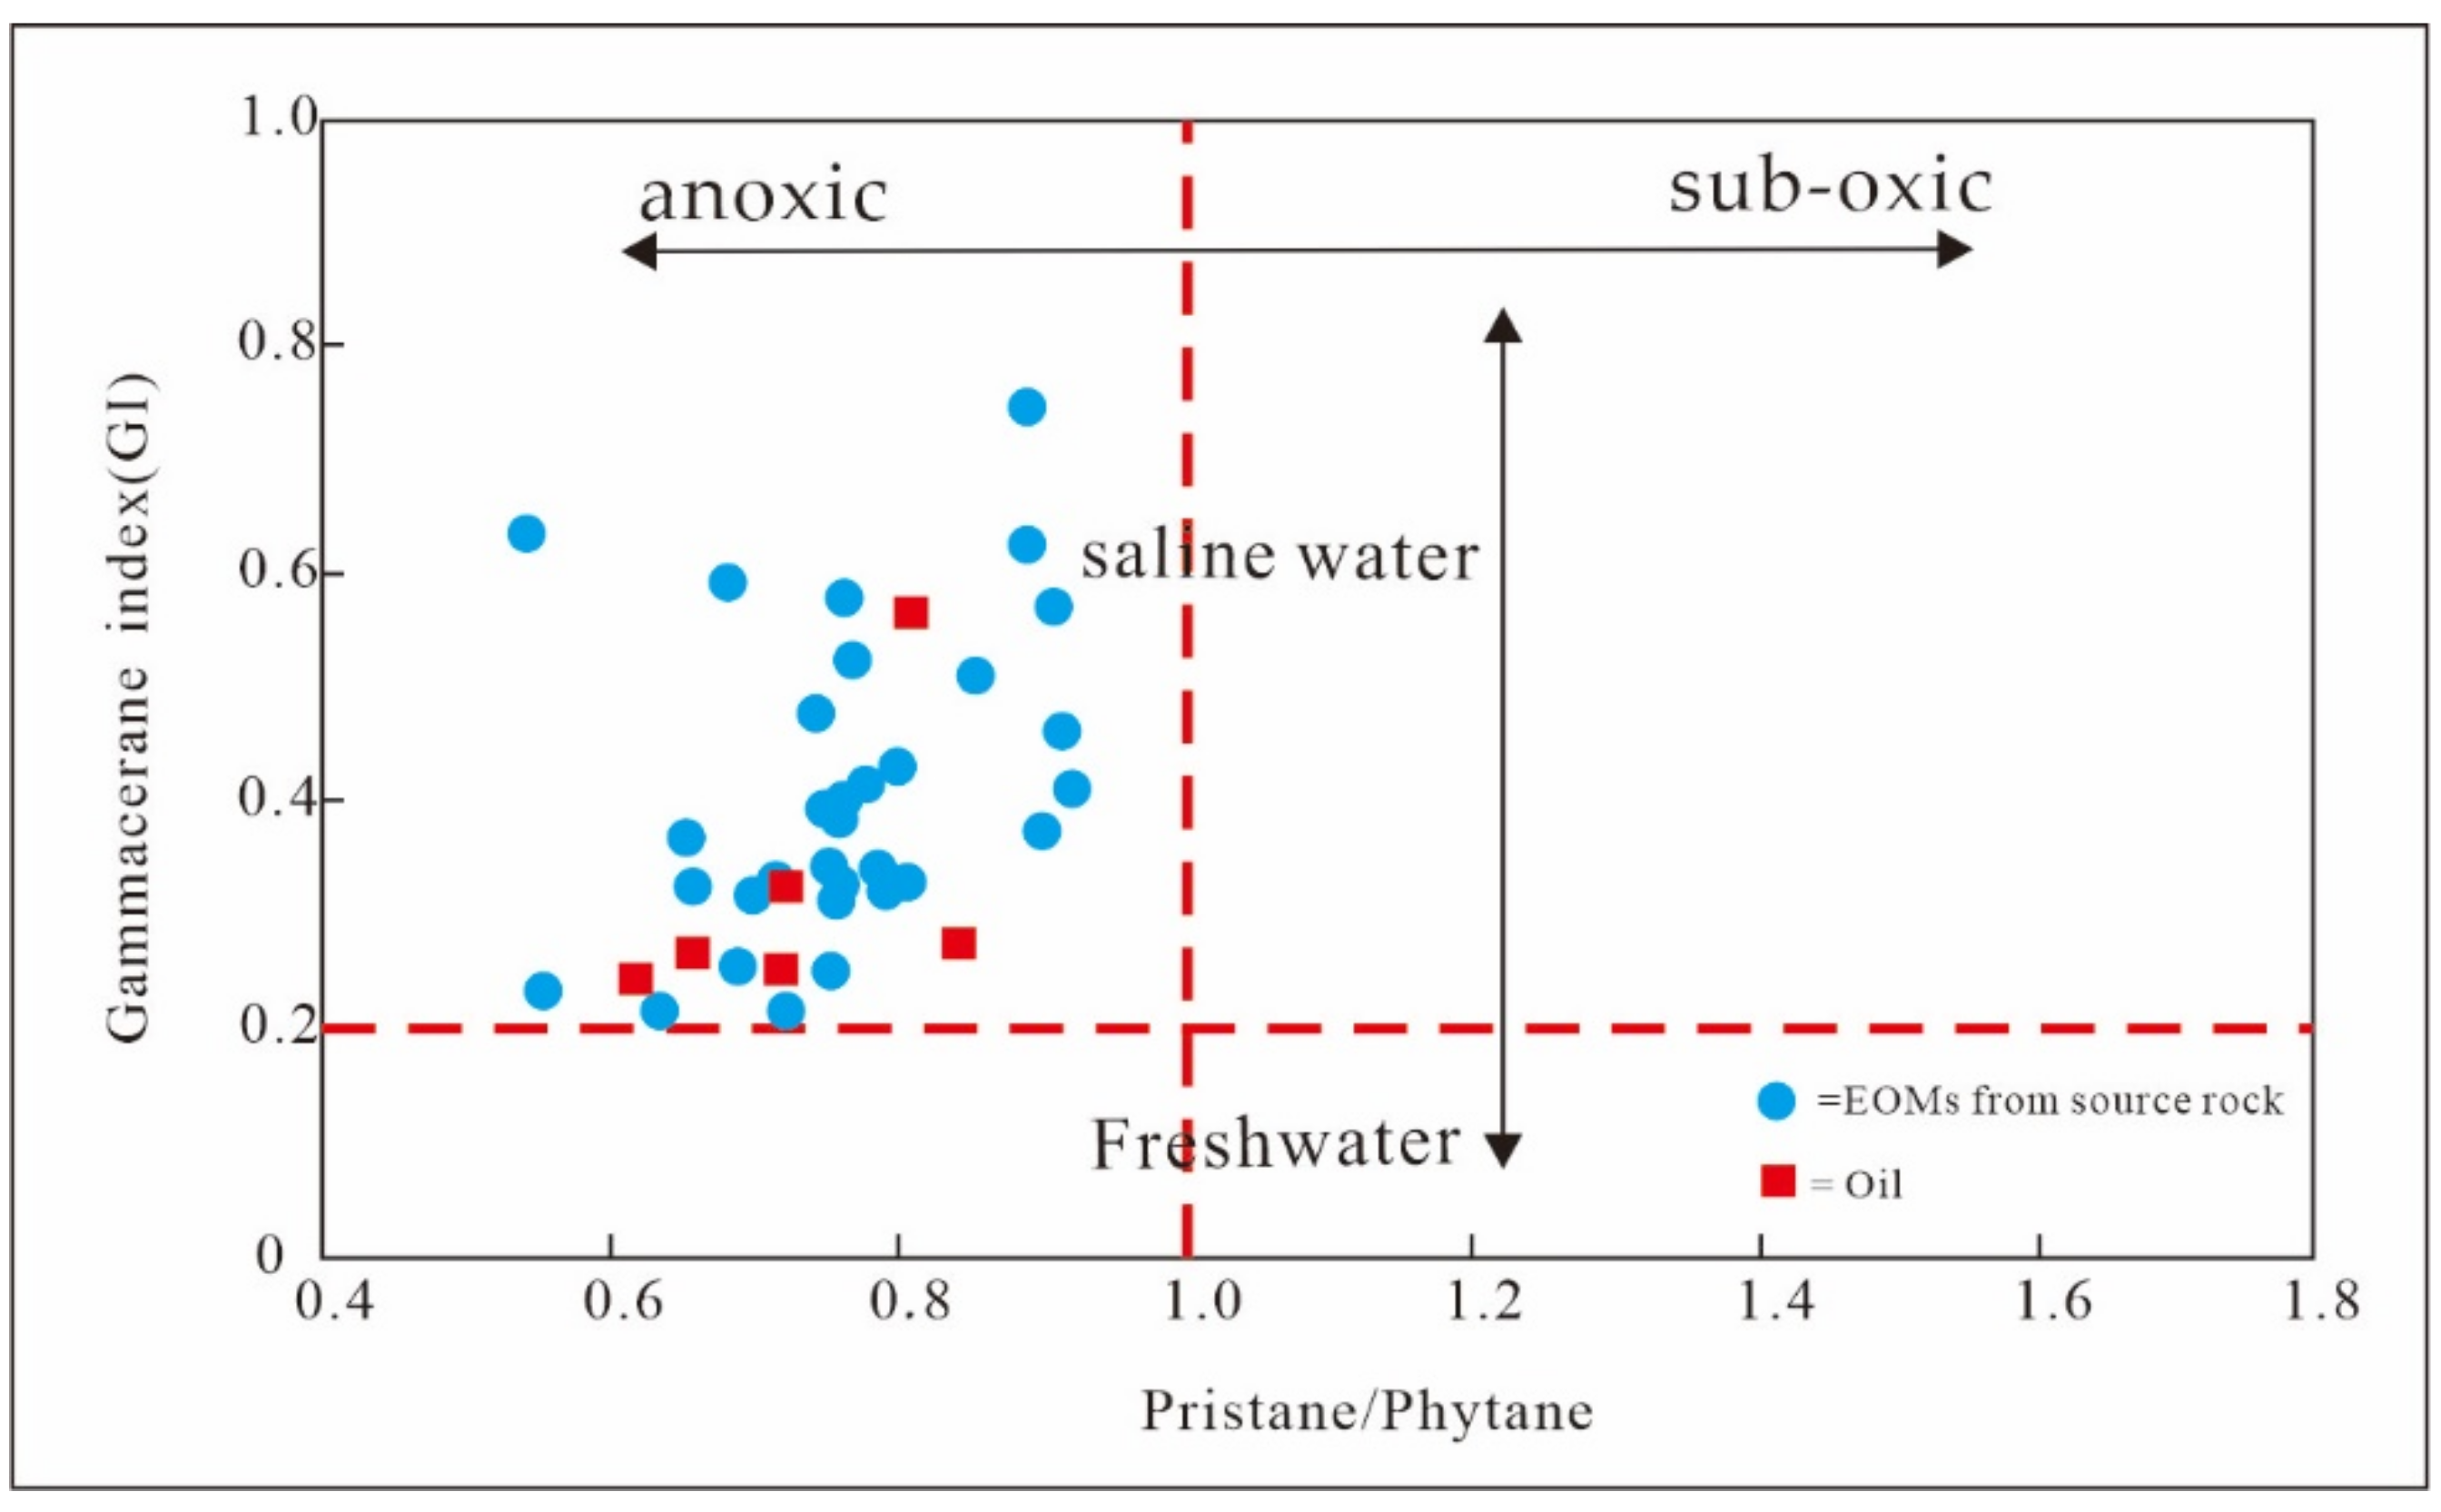
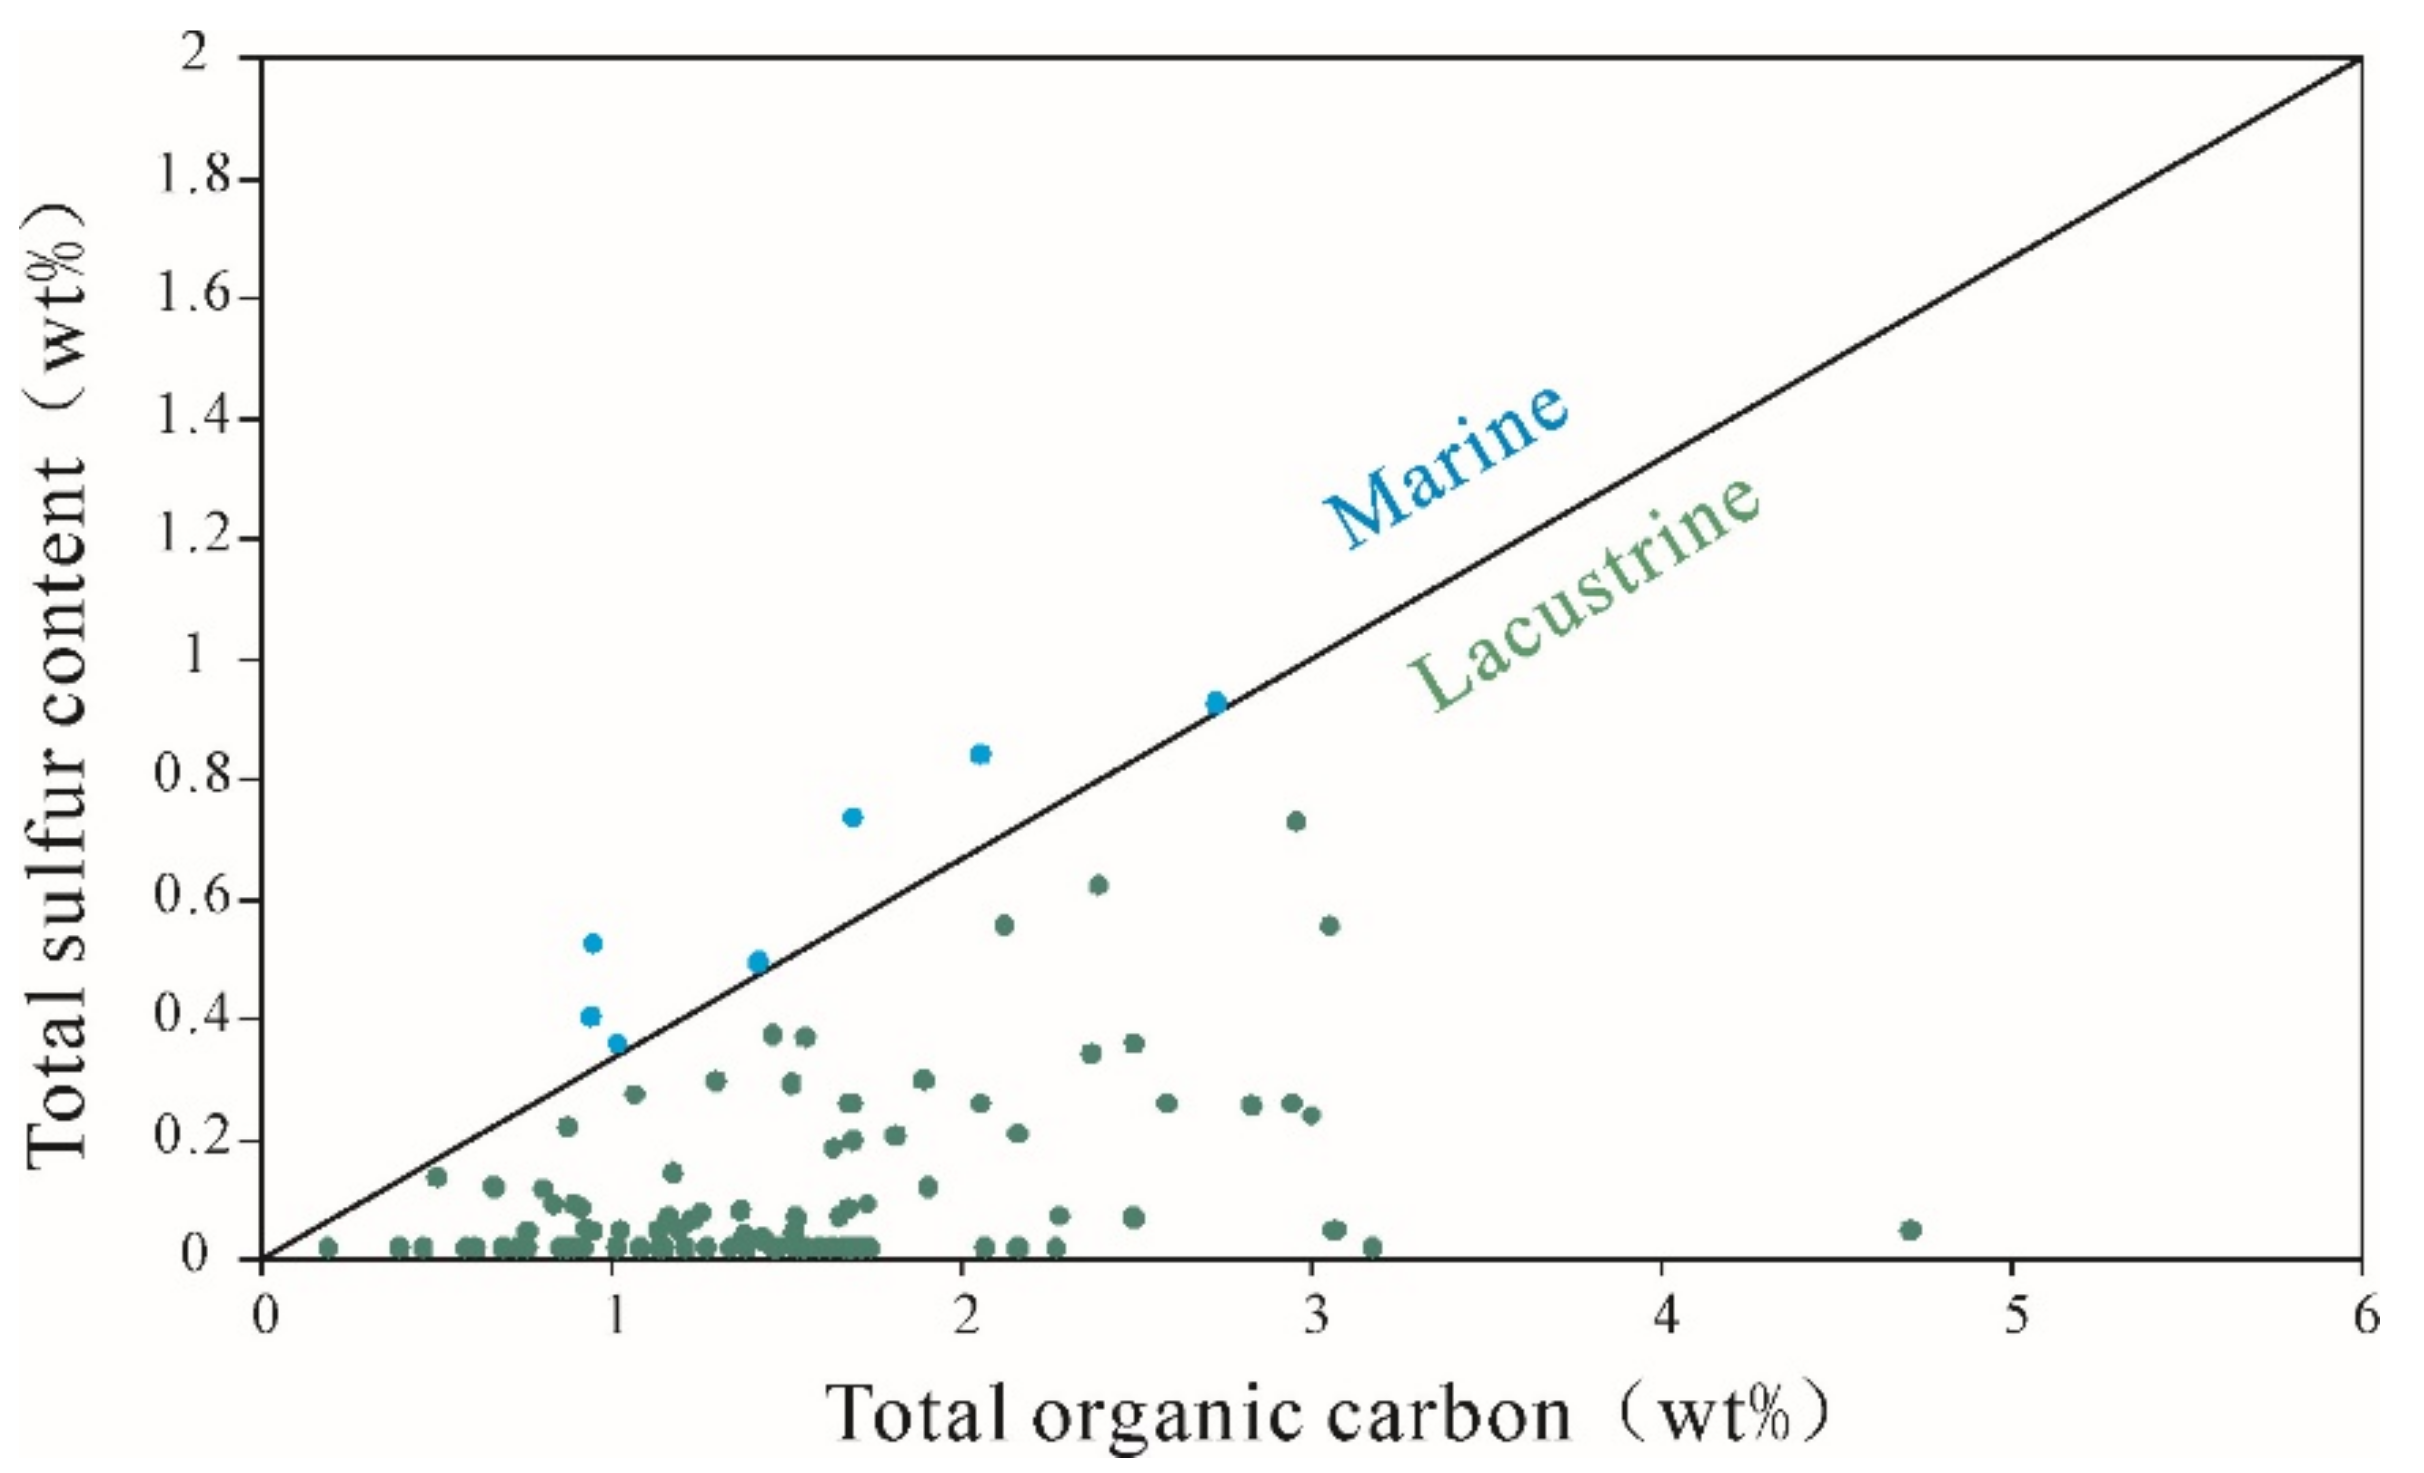
5.3. Depositional Environment
5.4. Resource Potential of the Shale Oil
6. Conclusions
Author Contributions
Funding
Acknowledgments
Conflicts of Interest
References
- Dandan, W.; Xingui, Z.; Shizhen, L.; Wenhao, Z.; Weibin, L.; Yanhua, L. Petroleum geologic features and generation potential of the Lower Cretaceous hydrocarbon source rocks in the Tonghua Basin. Acta Geol. Sin. 2017, 91, 2119–2130, (In Chinese with English abstract). [Google Scholar]
- Hunt, J.M. Petroleum Geochemistry and Geology, 2nd ed.; W.H. Freeman and Company: San Francisco, CA, USA, 1996; p. 743. [Google Scholar]
- Yubo, W.; Kan, G.; Dingding, L.; Yang, W. Mineral resources evaluation and status, important metallogenic belt and the dominant mineral resource potential of Tonghua City, Jilin Province. Jilin Geol. 2011, 30, 137–144, (In Chinese with English abstract). [Google Scholar]
- Xinpeng, H.; Guoli, H.; Chao, L.; Yanbo, L.I.; Changcheng, L. Petroleum geologic features and petroleum resources potential in Tonghua Basin. Glob. Geol. 2013, 32, 337–343, (In Chinese with English abstract). [Google Scholar]
- Shan, X.; Du, S.; Guo, X. Characteristics and evaluation of the high-quality source rocks of cretaceous continental shale oil in Tonghua Basin. Acta Geol. Sin. 2019, 93, 146–154. [Google Scholar] [CrossRef]
- Bingyi, Z.; Xiaodong, Z. Paleoproterozoic strata sequence and tectonic setting in southern Jilin Province. Glob. Geol 2009, 28, 424–429, (In Chinese with English abstract). [Google Scholar]
- Guangming, Z. Petroleum Geology of China 1996, Volume 1, p. 5122013517.
- Dongjin, L.; Penji, Z.; Chuntian, Z.N.L.; Jiaru, S.; Penji, C.; Fengzhen, M. Evolution and changes of faunas across Jurassic Cretaceous boundary at Sankeyushu, Tonghua, Jilin. Acta Palaeontol. Sin. 1998, 27, 684–693, (In Chinese with English abstract). [Google Scholar]
- Yueqiao, Z.; Shuwen, D.; Yue, Z. Jurassic tectonics of North China: A synthetic view. Acta Geol. Sin 2007, 81, 142–148, (In Chinese with English abstract). [Google Scholar] [CrossRef]
- Chengdong, Q.; Yujing, P.; Changjian, Y.; Xiaoping, L.; Xiaodong, Z. Relationship of granite type with basin evolution and its metallogenetic specialization of Global Province in Late Triassic-Early Cretaceous. Glob. Geol 2009, 28, 166–170, (In Chinese with English abstract). [Google Scholar]
- Nesbitt, H.W.; Markovics, G. Weathering of granodioritic crust, longterm storage of elements in weathering profiles, and petrogenesis of siliciclastic sediments. Geochim. Cosmochim. Acta 1997, 61, 1653–1670. [Google Scholar] [CrossRef]
- Tissot, B.P.; Welte, D.H. Petroleum Formation and Occurrence; Springer-Verlag: Berlin, Germany, 1978; pp. 1–554. [Google Scholar]
- Hunt, J.M. Petroleum Geoehemistry and Geology, 1st ed.; W.H. Freeman and Company: New York, NY, USA, 1979; pp. 261–273. [Google Scholar]
- Krishnamurthy, R.V.; Bhattacharya, S.K.; Kusumgar, S. Palaeoclimatic changs deduced from 13C/12C and C/N ratios of Karewa Lake sediments, India. Nature 1986, 323, 150–152. [Google Scholar] [CrossRef]
- Mustapha, K.A.; Abdullah, W.H. Petroleum source rock evaluation of the Sebahat and Ganduman Formations, Dent Peninsula, Eastern Sabah, Malaysia. J. Asian Earth Sci. 2013, 76, 346–355. [Google Scholar] [CrossRef]
- Peters, K.E.; Walters, C.C.; Moldowan, J.M. The Biomarker Guide. Biomarkers and Isotopes in Petroleum Exploration and Earth History. Cambridge University Press: New York, NY, USA, 2005; Volumes 1 and 2. [Google Scholar]
- Baker, D.R. Organic geochemistry and geological interpretations. J. Geol. Edu. 1972, 20, 221–234. [Google Scholar] [CrossRef]
- Tissot, B.P.; Welte, D.H. Petroleum Formation and Occurrence; Springer-Verlag: Berlin, Germany, 1984; p. 699. [Google Scholar]
- Powell, T.G.; Mckirdy, D.M. Relationship between ratio of pristane to phytane, crude oil composition and geological environment in Australia. Nature Phys. Sci. 1973, 243, 37–39. [Google Scholar] [CrossRef]
- Chandra, K.; Mishra, C.S.; Samanta, U.; Gupta, A.; Mehrotra, K.L. Correlation of different maturity parameters in the Ahmedabad-Mehsana block of the Cambay basin. Org. Geochem. 1994, 21, 313–321. [Google Scholar] [CrossRef]
- Peters, K.E.; Moldowan, J.M. The Biomarker Guide: Interpreting Molecular Fossils in Petroleum and Ancient Sediments. Choice Reviews Online; Prentice Hall: Englewood Cliffs, NJ, USA, 1993; Volume 30, pp. 30–2690. [Google Scholar]
- Lijmbach, G.W. On the origin of Petroleum. In Proceedings of the 9th World Petroleum Congress 2, Tokyo, Japan, 11–16 May; Applied Science Publishers: London, UK, 1975; pp. 357–369. [Google Scholar]
- Shanmugam, G. Significance of coniferous rainforests and related organic matter in generating commercial quantities of oil, Gipps-land Basin, Australia. Am. Assoc. Pet. Geol. Bull. 1985, 69, 1241–1254. [Google Scholar]
- Makeen, Y.M.; Abdullah, W.H.; Hakimi, M.H. Biological markers and organic petrology study of organic matter in the Lower Cretaceous Abu Gabra sediments (Muglad Basin, Sudan): Origin, type and palaeoenvironmental conditions. Arab. J. Geosci. 2015, 8, 489–506. [Google Scholar] [CrossRef]
- Makeen, Y.M.; Abdullah, W.H.; Hakimi, M.H. The origin, type and preservation of organic matter of the Barremiane Aptian organic-rich shales in the Muglad Basin, Southern Sudan, and their relation to paleoenvironmental and paleoclimate conditions. Mar. Petrol. Geol. 2015, 65, 187–197. [Google Scholar] [CrossRef]
- Makeen, Y.M.; Abdullah, W.H.; Hakimi, M.H.; Elhassan, O.M.A. Organic geochemical characteristics of the lower Cretaceous Abu Gabra formation in the great Moga oilfield, Muglad Basin, Sudan: Implications for depositional environment and oil-generation potential. J. Afr. Earth Sci. 2015, 103, 102–112. [Google Scholar] [CrossRef]
- Peters, K.E.; Walters, C.C.; Moldowan, J.M. The Biomarker Guide; Cambridge University Press: Cambridge, UK, 2004. [Google Scholar]
- Qin, J.; Wang, S.; Sanei, H.; Jiang, C.; Chen, Z.; Ren, S.; Xu, X.; Yang, J.; Zhong, N. Revelation of organic matter sources and sedimentary environment characteristics for shale gas formation by petrographic analysis of middle Jurassic Dameigou formation, northern Qaidam Basin, China. Int. J. Coal Geol. 2018, 195, 373–385. [Google Scholar] [CrossRef]
- Gürgey, K. Geochemical characteristics and thermal maturity of oils from the Thrace Basin (western Turkey) and western Turkmenistan. J. Pet. Geol 1999, 22, 167–189. [Google Scholar]
- Brassell, S.C.; McEvoy, J.; Hoffman, C.F.; Lamb, N.A.; Peakman, T.M.; Maxwell, J.R. Isomerisation rearrangement and aromatisation of steroids in distinguishing early stages of diagenesis. Org. Geochem. 1984, 6, 11–23. [Google Scholar] [CrossRef]
- Seifert, W.K.; Moldowan, J.M. Applications of steranes, terpanes and monoaromatics to the maturation, migration and source of crude oils. Geochim. Cosmochim. Acta 1978, 42, 77–95. [Google Scholar] [CrossRef]
- Sinninghe-Damste, J.S.; Kenig, F.; Koopmans, M.P.; Koster, J.; Schouten, S.; Hayes, J.M.; De Leeuw, J.W. Evidence for gammacerane as an indicator of water column stratification. Geochim. Cosmochim. Actavol 1995, 59, 1895–1900. [Google Scholar] [CrossRef]
- Huang, W.Y.; Meinschein, W.G. Sterols as ecological indicators. Geochim. Cosmochim. Acta 1979, 43, 739–745. [Google Scholar] [CrossRef]
- Volkman, J.K.; Maxwell, J.R. Acyclic isoprenoids as biological markers. In Biological Markers in the Sedimentary Record; Johns, R.B., Ed.; Elsevier: Amsterdam, The Netherlands, 1986; pp. 1–42. [Google Scholar]
- Mackenzie, A.S.; Patience, R.L.; Maxwell, J.R.; Vandenbroucke, M.; Durand, B. Molecular parameters of maturation in the Toarcian shales, Paris Basin, France I. Changes in the configurations of acyclic isoprenoid alkanes, steranes, and triterpanes. Geochim. Cosmochim. Acta 1980, 44, 1709–1721. [Google Scholar] [CrossRef]
- Finlay, J.C.; Kendall, C. Stable isotope tracing of temporal and spatial variability in organic matter sources to freshwater ecosystems. In Stable Isotopes in Ecology and Environmental Science, 2nd ed.; Michener, R., Lajtha, K., Eds.; Blackwell Publishing: Oxford, UK, 2007; pp. 283–333. [Google Scholar]
- Li, Z.Y.; Jia, G.D. Separation of total nitrogen into organic and inorganic forms from sediments for isotopic analysis. Org. Gechem. 2011, 42, 296–299. [Google Scholar] [CrossRef]
- Bechtel, A.; Gratzer, R.; Sachsenhofer, R.F. Chemical characteristics of upper cretaceous (Turonian) jet of the Gosau group of Gams/Hieflau (Styria, Austria). Int. J. Coal Geol. 2001, 46, 27–49. [Google Scholar] [CrossRef]
- Bordenave, M.L. Applied Petroleum Geochemistry; Technip: Paris, France, 1993. [Google Scholar]
- Xie, Z.Y.; Li, Z.S.; Wei, G.Q.; Li, J.; Wang, D.L.; Wang, Z.H.; Dong, C.Y. Experimental research on the potential of sapropelic kerogen degradation gas and discrimination of oil cracking gas. J. Nat. Gas Geosci. 2016, 27, 1057–1066. [Google Scholar] [CrossRef]
- Berner, R.A.; Raiswell, R. Burial of organic carbon and pyrite sulfur in sediments over Phanerozoic time: A new theory. Geochim. Cosmochim. Acta 1983, 47, 855–862. [Google Scholar] [CrossRef]
- Mohialdeen, I.M.J.; Hakimi, M.H.; Al-Beyati, F.M. Geochemical and petrographic characterization of Late Jurassic-Early Cretaceous Chia Gara Formation in Northern Iraq: Palaeoenvironment and oil-generation potential. Mar. Petrol. Geol. 2013. [Google Scholar] [CrossRef]
- Peters, K.E.; Cassa, M.R. Applied source rock geochemistry. In The Petroleum System—From Source to Trap; Magoon, L.B., Dow, W.G., Eds.; American Association of Petroleum Geologists Memoir: Tulsa, OK, USA, 1994; Volume 60, pp. 93–120. [Google Scholar]
- Othman, R.S. Petroleum Geology of Gunnedah–Bowen–Surat Basins, Northern New Wales (Stratigraphy, Organic Petrology and Organic Geochemistry). Ph.D. Thesis, University of New South Wales, Kensington, Australia, 2003; p. 312. [Google Scholar]


| Sample ID | Depth (m) | Total Clay (wt%) | Quartz (wt%) | K-Feldspar (wt% | Plagioclase (wt%) | Calcite (wt%) | Dolomite (wt%) | Pyrite (wt%) |
|---|---|---|---|---|---|---|---|---|
| TD1-163 | 288 | 46 | 32 | 1 | 7 | 14 | ||
| TD1-171 | 278 | 43 | 37 | 2 | 7 | 11 | ||
| TD1-172 | 287 | 35 | 31 | 2 | 8 | 24 | ||
| TH-9 | 152.8 | 28 | 34 | 12 | 9 | 15 | 0 | 2 |
| TH-34 | 224.54 | 45 | 29 | 1 | 8 | 16 | 0 | 1 |
| TH-46 | 284.26 | 43 | 26 | 1 | 8 | 15 | 5 | 2 |
| TH-49 | 289.06 | 41 | 35 | 12 | 2 | 7 | 2 | 1 |
| TH-51 | 291.8 | 28 | 37 | 5 | 6 | 17 | 7 | 0 |
| TH-76 | 331.05 | 37 | 39 | 3 | 5 | 15 | 0 | 1 |
| TH-83 | 345.46 | 41 | 35 | 4 | 4 | 16 | 0 | 0 |
| TH-93 | 394.33 | 43 | 42 | 4 | 2 | 9 | 0 | 0 |
| TH-101 | 426.1 | 38 | 42 | 2 | 7 | 7 | 1 | 3 |
| TH-102 | 426.8 | 34 | 43 | 1 | 6 | 15 | 0 | 1 |
| average | 38.62 | 35.54 | 3.85 | 6.08 | 13.92 | 1.50 | 1.10 | |
| Sample ID | Depth (m) | TIC (wt.%) | TOC (wt.%) | TN (wt.%) | TS (wt.%) | Pyrolysis Data | Ro (%) | TOC/TN | TOC/TS | |||||||
|---|---|---|---|---|---|---|---|---|---|---|---|---|---|---|---|---|
| S1 (mg/g) | S2 (mg/g) | S3 (mg/g) | S2/S3 (mg/g) | HI | OI | PI (mg/g) | Tmax | |||||||||
| TH-1 | 59.26 | 30.11 | 1.06 | 0.18 | 0.02 | 0.10 | 1.16 | 0.08 | 14.50 | 109.54 | 7.55 | 0.08 | 443.00 | 5.88 | 59.57 | |
| TH-2 | 68.51 | 9.64 | 0.56 | 0.26 | 0.01 | 0.02 | 1.15 | 0.09 | 12.78 | 205.36 | 16.07 | 0.02 | 445.00 | 2.15 | 75.60 | |
| TH-3 | 107.84 | 7.92 | 0.64 | 0.05 | 0.01 | 0.02 | 1.06 | 0.09 | 11.78 | 165.63 | 14.06 | 0.02 | 468.00 | 12.80 | 86.40 | |
| TH-4 | 120.04 | 8.50 | 0.84 | 0.04 | 0.01 | 0.02 | 1.05 | 0.07 | 15.00 | 125.00 | 8.33 | 0.02 | 449.00 | 21.00 | 113.40 | |
| TH-5 | 121.04 | 9.20 | 0.45 | 0.04 | 0.01 | 0.04 | 1.25 | 0.58 | 2.16 | 277.78 | 128.89 | 0.03 | 450.00 | 11.25 | 60.75 | |
| TH-6 | 122.54 | 7.13 | 0.56 | 0.05 | 0.01 | 0.06 | 1.36 | 0.08 | 17.00 | 242.86 | 14.29 | 0.04 | 452.00 | 11.20 | 86.80 | |
| TH-7 | 124.04 | 7.60 | 0.95 | 0.07 | 0.01 | 0.12 | 5.25 | 0.08 | 65.63 | 552.63 | 8.42 | 0.02 | 447.00 | 13.57 | 147.25 | |
| TH-8 | 152.00 | 9.58 | 1.47 | 0.07 | 0.06 | 0.17 | 4.36 | 0.08 | 54.50 | 296.60 | 5.44 | 0.04 | 445.00 | 21.00 | 36.75 | |
| TH-9 | 152.80 | 15.48 | 0.88 | 0.05 | 0.07 | 0.24 | 2.25 | 0.57 | 3.95 | 255.39 | 64.70 | 0.10 | 462.00 | 1.24 | 17.62 | 19.15 |
| TH-10 | 166.60 | 6.10 | 1.12 | 0.10 | 0.01 | 0.18 | 1.85 | 0.26 | 7.12 | 165.18 | 23.21 | 0.09 | 460.00 | 11.20 | 173.60 | |
| TH-11 | 182.47 | 4.28 | 1.05 | 0.07 | 0.01 | 0.16 | 1.55 | 0.36 | 4.31 | 147.62 | 34.29 | 0.09 | 455.00 | 15.00 | 162.75 | |
| TH-12 | 184.28 | 6.18 | 0.86 | 0.06 | 0.01 | 0.13 | 1.40 | 0.45 | 3.11 | 162.41 | 52.20 | 0.08 | 460.00 | 14.37 | 133.61 | |
| TH-13 | 184.30 | 7.80 | 0.98 | 0.08 | 0.03 | 0.11 | 1.33 | 0.57 | 2.33 | 135.85 | 58.22 | 0.08 | 452.00 | 12.24 | 45.57 | |
| TH-14 | 186.68 | 5.16 | 0.43 | 0.10 | 0.01 | 0.09 | 1.23 | 0.09 | 13.67 | 286.05 | 20.93 | 0.07 | 447.00 | 4.30 | 58.05 | |
| TH-15 | 198.12 | 6.44 | 0.34 | 0.04 | 0.01 | 0.08 | 1.50 | 0.45 | 3.33 | 441.18 | 132.35 | 0.05 | 450.00 | 8.50 | 45.90 | |
| TH-16 | 199.92 | 36.49 | 0.29 | 0.08 | 0.01 | 0.08 | 1.35 | 0.35 | 3.86 | 465.52 | 120.69 | 0.06 | 452.00 | 3.63 | 39.15 | |
| TH-17 | 200.62 | 7.86 | 0.70 | 0.08 | 0.52 | 0.07 | 1.46 | 0.07 | 20.86 | 208.57 | 10.00 | 0.05 | 442.00 | 8.75 | 1.83 | |
| TH-18 | 202.12 | 7.30 | 0.65 | 0.15 | 0.01 | 0.06 | 1.25 | 0.40 | 3.13 | 192.31 | 61.54 | 0.05 | 450.00 | 4.33 | 87.75 | |
| TH-19 | 202.70 | 5.85 | 0.76 | 0.15 | 0.04 | 0.04 | 1.03 | 0.57 | 1.81 | 135.88 | 75.20 | 0.04 | 451.00 | 5.05 | 26.93 | |
| TH-20 | 203.45 | 7.16 | 0.75 | 0.13 | 0.01 | 0.07 | 1.60 | 0.09 | 17.78 | 213.33 | 12.00 | 0.04 | 449.00 | 5.77 | 101.25 | |
| TH-21 | 204.50 | 6.86 | 0.68 | 0.16 | 0.01 | 0.09 | 1.80 | 0.23 | 7.83 | 264.71 | 33.82 | 0.05 | 447.00 | 4.25 | 91.80 | |
| TH-22 | 206.48 | 13.86 | 0.85 | 0.16 | 0.01 | 0.12 | 2.34 | 0.10 | 23.40 | 275.29 | 11.76 | 0.05 | 446.00 | 5.31 | 114.75 | |
| TH-23 | 207.20 | 7.11 | 0.68 | 0.15 | 0.04 | 0.06 | 1.17 | 0.61 | 1.92 | 171.30 | 89.31 | 0.05 | 458.00 | 4.55 | 21.95 | |
| TH-24 | 207.45 | 6.29 | 0.37 | 0.14 | 0.13 | 0.05 | 1.15 | 0.45 | 2.56 | 310.81 | 121.62 | 0.04 | 445.00 | 2.64 | 3.96 | |
| TH-25 | 209.10 | 8.49 | 0.14 | 0.13 | 0.01 | 0.04 | 1.12 | 0.45 | 2.49 | 800.00 | 321.43 | 0.03 | 440.00 | 1.08 | 18.90 | |
| TH-26 | 211.76 | 6.52 | 1.08 | 0.15 | 0.36 | 0.09 | 3.05 | 0.36 | 8.47 | 282.41 | 33.33 | 0.03 | 445.00 | 7.20 | 4.02 | |
| TH-27 | 213.39 | 7.85 | 1.34 | 0.17 | 0.20 | 0.13 | 3.13 | 0.13 | 24.08 | 233.58 | 9.70 | 0.04 | 448.00 | 7.88 | 9.28 | |
| TH-28 | 215.30 | 6.19 | 0.56 | 0.14 | 0.04 | 0.05 | 1.07 | 0.55 | 1.95 | 190.39 | 97.86 | 0.04 | 441.00 | 1.04 | 4.01 | 20.34 |
| TH-29 | 215.48 | 5.96 | 0.65 | 0.16 | 0.21 | 0.01 | 1.52 | 0.34 | 4.47 | 234.93 | 52.55 | 0.01 | 450.00 | 4.04 | 4.16 | |
| TH-30 | 219.77 | 6.59 | 0.75 | 0.15 | 0.35 | 0.12 | 1.52 | 0.35 | 4.34 | 202.13 | 46.54 | 0.07 | 452.00 | 5.01 | 2.90 | |
| TH-31 | 220.80 | 11.78 | 0.70 | 0.16 | 0.04 | 0.18 | 1.93 | 0.54 | 3.57 | 275.32 | 77.03 | 0.09 | 455.00 | 1.08 | 4.38 | 25.86 |
| TH-32 | 223.50 | 6.86 | 0.84 | 0.15 | 0.04 | 0.18 | 2.23 | 0.46 | 4.85 | 266.43 | 54.96 | 0.07 | 458.00 | 5.58 | 29.20 | |
| TH-33 | 223.59 | 7.66 | 1.25 | 0.15 | 0.01 | 0.12 | 2.05 | 0.25 | 8.20 | 164.00 | 20.00 | 0.06 | 460.00 | 8.33 | 168.75 | |
| TH-34 | 224.54 | 12.32 | 1.18 | 0.16 | 0.01 | 0.11 | 1.29 | 0.16 | 8.06 | 109.32 | 13.56 | 0.08 | 467.00 | 7.38 | 159.30 | |
| TH-35 | 227.75 | 5.02 | 1.08 | 0.17 | 0.01 | 0.07 | 1.24 | 0.11 | 11.27 | 114.81 | 10.19 | 0.05 | 457.00 | 6.35 | 145.80 | |
| TH-36 | 228.85 | 6.85 | 0.94 | 0.18 | 0.01 | 0.13 | 1.62 | 0.25 | 6.48 | 172.34 | 26.60 | 0.07 | 455.00 | 5.22 | 126.90 | |
| TH-37 | 231.00 | 5.53 | 0.68 | 0.18 | 0.07 | 0.24 | 1.75 | 0.59 | 2.97 | 259.26 | 87.41 | 0.12 | 454.00 | 0.97 | 3.75 | 12.18 |
| TH-38 | 233.10 | 5.82 | 0.62 | 0.18 | 0.08 | 0.21 | 1.68 | 0.71 | 2.37 | 272.29 | 115.07 | 0.11 | 451.00 | 3.43 | 10.23 | |
| TH-39 | 233.96 | 8.62 | 0.84 | 0.17 | 0.01 | 0.05 | 1.14 | 0.13 | 8.77 | 135.71 | 15.48 | 0.04 | 480.00 | 1.53 | 4.94 | 147.00 |
| TH-40 | 235.69 | 5.44 | 0.79 | 0.12 | 0.01 | 0.05 | 1.14 | 0.11 | 10.36 | 144.30 | 13.92 | 0.04 | 490.00 | 6.58 | 138.25 | |
| TH-41 | 237.75 | 13.39 | 0.95 | 0.14 | 0.01 | 0.04 | 1.12 | 0.12 | 9.33 | 117.89 | 12.63 | 0.03 | 485.00 | 1.32 | 6.79 | 166.25 |
| TH-42 | 238.85 | 5.32 | 0.69 | 0.18 | 0.01 | 0.73 | 4.09 | 0.12 | 34.08 | 592.75 | 17.39 | 0.15 | 496.00 | 3.83 | 120.75 | |
| TH-43 | 264.20 | 14.61 | 1.71 | 0.21 | 0.23 | 1.15 | 8.07 | 0.65 | 12.42 | 470.83 | 37.92 | 0.12 | 455.00 | 8.16 | 13.10 | |
| TH-44 | 264.95 | 12.37 | 1.92 | 0.20 | 0.25 | 1.23 | 8.51 | 0.60 | 14.18 | 444.39 | 31.33 | 0.13 | 462.00 | 9.58 | 10.34 | |
| TH-45 | 277.70 | 9.30 | 2.27 | 0.18 | 0.04 | 3.50 | 17.12 | 0.59 | 29.02 | 754.19 | 25.99 | 0.17 | 451.00 | 12.61 | 79.19 | |
| TH-46 | 284.26 | 20.91 | 2.09 | 0.23 | 0.25 | 1.53 | 10.13 | 0.50 | 20.26 | 483.76 | 23.88 | 0.13 | 450.00 | 9.10 | 11.49 | |
| TH-47 | 286.40 | 7.12 | 2.19 | 0.26 | 0.72 | 1.87 | 13.81 | 0.58 | 23.81 | 630.59 | 26.48 | 0.12 | 451.00 | 8.42 | 4.11 | |
| TH-48 | 287.00 | 4.17 | 1.76 | 0.20 | 0.33 | 3.43 | 13.13 | 0.32 | 41.03 | 748.15 | 18.23 | 0.21 | 470.00 | 8.78 | 7.14 | |
| TH-49 | 289.06 | 7.89 | 1.60 | 0.20 | 0.01 | 1.74 | 9.03 | 0.21 | 43.00 | 564.38 | 13.13 | 0.16 | 494.00 | 8.00 | 216.00 | |
| TH-50 | 290.23 | 5.94 | 1.68 | 0.28 | 0.01 | 1.80 | 9.10 | 0.30 | 30.33 | 541.67 | 17.86 | 0.17 | 483.00 | 6.00 | 226.80 | |
| TH-51 | 291.80 | 12.40 | 2.26 | 0.23 | 0.54 | 1.62 | 8.72 | 0.50 | 17.44 | 385.84 | 22.12 | 0.16 | 479.00 | 9.83 | 5.61 | |
| TH-52 | 292.16 | 10.55 | 2.35 | 0.25 | 0.01 | 4.13 | 18.44 | 0.20 | 92.20 | 784.68 | 8.51 | 0.18 | 480.00 | 9.40 | 317.25 | |
| TH-53 | 294.20 | 8.71 | 1.53 | 0.26 | 0.01 | 1.52 | 8.01 | 0.14 | 57.21 | 523.53 | 9.15 | 0.16 | 488.00 | 5.88 | 206.55 | |
| TH-54 | 294.80 | 9.43 | 2.02 | 0.27 | 0.92 | 1.69 | 7.52 | 0.44 | 17.09 | 372.28 | 21.78 | 0.18 | 454.00 | 1.08 | 7.48 | 2.98 |
| TH-55 | 296.00 | 6.51 | 1.27 | 0.26 | 0.01 | 0.92 | 7.13 | 0.32 | 22.28 | 561.42 | 25.20 | 0.11 | 454.00 | 4.88 | 171.45 | |
| TH-56 | 297.46 | 6.44 | 0.75 | 0.22 | 0.01 | 0.62 | 3.54 | 0.09 | 39.33 | 472.00 | 12.00 | 0.15 | 454.00 | 3.41 | 101.25 | |
| TH-57 | 299.13 | 12.16 | 0.63 | 0.29 | 0.01 | 0.66 | 3.58 | 0.08 | 44.75 | 568.25 | 12.70 | 0.16 | 454.00 | 2.17 | 85.05 | |
| TH-58 | 301.06 | 6.73 | 1.13 | 0.35 | 0.01 | 0.62 | 3.59 | 0.14 | 25.64 | 317.70 | 12.39 | 0.15 | 454.00 | 3.23 | 152.55 | |
| TH-59 | 302.20 | 7.46 | 1.40 | 0.21 | 0.29 | 1.12 | 5.03 | 0.42 | 11.98 | 359.29 | 30.00 | 0.18 | 452.00 | 6.67 | 6.56 | |
| TH-60 | 306.11 | 6.70 | 0.65 | 0.29 | 0.01 | 1.23 | 5.73 | 0.43 | 13.33 | 881.54 | 66.15 | 0.18 | 453.00 | 2.24 | 87.75 | |
| TH-61 | 307.60 | 6.94 | 0.91 | 0.25 | 0.06 | 1.41 | 5.90 | 0.44 | 13.41 | 649.06 | 48.40 | 0.19 | 453.00 | 1.01 | 3.64 | 21.99 |
| TH-62 | 308.46 | 4.09 | 0.66 | 0.17 | 0.01 | 0.64 | 3.72 | 0.11 | 33.82 | 563.64 | 16.67 | 0.15 | 449.00 | 3.88 | 89.10 | |
| TH-63 | 310.21 | 5.76 | 0.80 | 0.28 | 0.01 | 1.23 | 5.91 | 0.21 | 28.14 | 738.75 | 26.25 | 0.17 | 450.00 | 2.86 | 108.00 | |
| TH-64 | 312.30 | 8.58 | 0.88 | 0.35 | 0.04 | 1.42 | 5.89 | 0.58 | 10.16 | 667.80 | 65.76 | 0.19 | 450.00 | 1.04 | 2.52 | 30.30 |
| TH-65 | 313.24 | 11.75 | 0.54 | 0.34 | 0.01 | 0.62 | 3.58 | 0.11 | 32.55 | 662.96 | 20.37 | 0.15 | 452.00 | 1.59 | 72.90 | |
| TH-66 | 314.00 | 7.11 | 0.65 | 0.35 | 0.01 | 0.63 | 6.06 | 0.08 | 75.75 | 932.31 | 12.31 | 0.09 | 450.00 | 1.86 | 87.75 | |
| TH-67 | 315.90 | 10.90 | 1.25 | 0.21 | 0.73 | 0.59 | 9.18 | 1.12 | 8.20 | 734.40 | 89.60 | 0.06 | 449.00 | 5.95 | 2.33 | |
| TH-68 | 320.22 | 6.35 | 0.86 | 0.16 | 0.06 | 0.65 | 9.50 | 0.11 | 86.36 | 1104.65 | 12.79 | 0.06 | 452.00 | 5.38 | 19.35 | |
| TH-69 | 322.42 | 10.20 | 0.51 | 0.23 | 0.01 | 1.20 | 6.51 | 0.23 | 28.30 | 1276.47 | 45.10 | 0.16 | 460.00 | 2.22 | 68.85 | |
| TH-70 | 324.70 | 4.61 | 1.05 | 0.17 | 0.49 | 1.08 | 5.37 | 0.49 | 10.96 | 511.43 | 46.67 | 0.17 | 459.00 | 1.13 | 6.18 | 2.92 |
| TH-71 | 324.77 | 5.08 | 1.13 | 0.24 | 0.06 | 0.69 | 4.97 | 0.13 | 38.23 | 439.82 | 11.50 | 0.12 | 446.00 | 4.71 | 25.43 | |
| TH-72 | 327.40 | 9.42 | 1.52 | 0.23 | 0.83 | 1.09 | 7.07 | 0.47 | 15.04 | 465.13 | 30.92 | 0.13 | 453.00 | 1.08 | 6.61 | 2.47 |
| TH-73 | 327.50 | 1.91 | 1.77 | 0.24 | 0.61 | 1.02 | 7.86 | 0.49 | 16.04 | 444.07 | 27.68 | 0.11 | 455.00 | 1.06 | 7.38 | 3.90 |
| TH-74 | 327.60 | 7.61 | 1.24 | 0.36 | 0.25 | 1.18 | 7.63 | 0.58 | 13.16 | 615.32 | 46.77 | 0.13 | 453.00 | 3.44 | 6.70 | |
| TH-75 | 330.30 | 9.06 | 0.70 | 0.22 | 0.40 | 1.41 | 4.81 | 0.77 | 6.25 | 692.09 | 110.79 | 0.23 | 458.00 | 3.16 | 2.38 | |
| TH-76 | 331.05 | 23.13 | 2.18 | 0.25 | 0.25 | 1.23 | 5.19 | 0.58 | 8.95 | 238.07 | 26.61 | 0.19 | 448.00 | 8.72 | 11.77 | |
| TH-77 | 331.90 | 9.69 | 3.49 | 0.28 | 0.04 | 0.63 | 21.14 | 5.37 | 3.94 | 605.73 | 153.87 | 0.03 | 448.00 | 1.00 | 12.46 | 123.34 |
| TH-78 | 332.50 | 8.47 | 1.60 | 0.33 | 0.20 | 0.71 | 6.64 | 0.09 | 73.78 | 415.00 | 5.63 | 0.10 | 447.00 | 4.85 | 10.85 | |
| TH-79 | 334.20 | 13.43 | 0.93 | 0.38 | 0.07 | 1.17 | 4.71 | 0.80 | 5.89 | 506.45 | 86.02 | 0.20 | 454.00 | 1.06 | 2.45 | 18.82 |
| TH-80 | 334.30 | 4.72 | 1.52 | 0.41 | 0.25 | 1.03 | 7.12 | 0.56 | 12.71 | 468.42 | 36.84 | 0.13 | 452.00 | 3.71 | 8.21 | |
| TH-81 | 337.15 | 4.92 | 1.15 | 0.31 | 0.36 | 0.83 | 4.55 | 0.11 | 41.36 | 395.65 | 9.57 | 0.15 | 444.00 | 3.71 | 4.31 | |
| TH-82 | 345.40 | 5.64 | 1.57 | 0.37 | 0.55 | 0.91 | 6.32 | 0.46 | 13.74 | 402.55 | 29.30 | 0.13 | 445.00 | 4.24 | 3.88 | |
| TH-83 | 345.46 | 13.15 | 1.85 | 0.37 | 0.35 | 0.91 | 7.75 | 0.32 | 24.22 | 419.83 | 17.33 | 0.11 | 443.00 | 4.99 | 7.12 | |
| TH-84 | 346.31 | 65.17 | 1.41 | 0.32 | 0.11 | 0.90 | 6.08 | 0.16 | 38.00 | 431.21 | 11.35 | 0.13 | 441.00 | 4.41 | 17.30 | |
| TH-85 | 348.12 | 19.21 | 1.85 | 0.37 | 0.06 | 0.90 | 6.78 | 0.31 | 21.87 | 367.48 | 16.80 | 0.12 | 450.00 | 4.99 | 41.51 | |
| TH-86 | 353.50 | 64.06 | 1.12 | 0.56 | 0.28 | 0.87 | 5.21 | 0.41 | 12.71 | 465.18 | 36.61 | 0.14 | 456.00 | 1.07 | 2.00 | 5.36 |
| TH-87 | 353.57 | 36.84 | 1.22 | 0.39 | 0.06 | 0.79 | 4.59 | 0.09 | 51.00 | 376.23 | 7.38 | 0.15 | 446.00 | 3.13 | 27.00 | |
| TH-88 | 358.80 | 21.18 | 0.79 | 0.60 | 0.27 | 1.46 | 3.69 | 0.61 | 6.05 | 468.27 | 77.41 | 0.28 | 460.00 | 1.13 | 1.31 | 4.01 |
| TH-89 | 359.50 | 3.47 | 0.66 | 0.11 | 0.08 | 0.41 | 2.83 | 0.43 | 6.58 | 428.79 | 65.15 | 0.13 | 463.00 | 6.00 | 10.97 | |
| TH-90 | 360.82 | 17.11 | 1.02 | 0.08 | 0.03 | 0.42 | 5.85 | 0.35 | 16.71 | 573.53 | 34.31 | 0.07 | 460.00 | 12.75 | 45.90 | |
| TH-91 | 390.43 | 7.45 | 1.25 | 0.26 | 0.25 | 0.40 | 0.75 | 0.43 | 1.74 | 60.00 | 34.40 | 0.35 | 463.00 | 4.81 | 6.75 | |
| TH-92 | 394.20 | 34.48 | 0.60 | 0.37 | 0.11 | 0.38 | 0.82 | 0.51 | 1.61 | 137.82 | 85.71 | 0.32 | 458.00 | 1.06 | 1.61 | 7.44 |
| TH-93 | 394.33 | 12.71 | 0.87 | 0.54 | 0.13 | 0.35 | 1.26 | 0.34 | 3.71 | 144.83 | 39.08 | 0.22 | 450.00 | 1.61 | 8.76 | |
| TH-94 | 397.23 | 14.90 | 0.96 | 0.33 | 0.29 | 0.20 | 1.85 | 0.08 | 23.13 | 192.71 | 8.33 | 0.10 | 447.00 | 2.91 | 4.53 | |
| TH-95 | 402.73 | 16.07 | 1.15 | 0.46 | 0.01 | 0.65 | 1.75 | 0.50 | 3.50 | 152.17 | 43.48 | 0.27 | 448.00 | 2.50 | 155.25 | |
| TH-96 | 406.64 | 53.45 | 1.25 | 0.56 | 0.19 | 0.65 | 2.32 | 0.62 | 3.74 | 185.60 | 49.60 | 0.22 | 450.00 | 2.23 | 9.02 | |
| TH-97 | 407.10 | 24.57 | 1.28 | 0.46 | 0.08 | 0.86 | 1.89 | 0.87 | 2.17 | 147.66 | 67.97 | 0.31 | 450.00 | 0.98 | 2.78 | 20.84 |
| TH-98 | 418.00 | 6.44 | 1.24 | 0.59 | 0.07 | 0.53 | 1.44 | 0.74 | 1.95 | 116.13 | 59.68 | 0.27 | 460.00 | 2.10 | 22.62 | |
| TH-99 | 418.10 | 10.97 | 0.49 | 0.44 | 0.11 | 0.39 | 0.71 | 0.58 | 1.22 | 144.90 | 118.37 | 0.35 | 461.00 | 1.06 | 1.11 | 6.01 |
| TH-100 | 423.80 | 8.79 | 1.15 | 0.43 | 0.01 | 0.35 | 2.51 | 0.46 | 5.46 | 218.83 | 40.10 | 0.12 | 460.00 | 2.67 | 154.85 | |
| TH-101 | 426.00 | 11.53 | 1.24 | 0.29 | 0.01 | 0.16 | 2.13 | 0.22 | 9.68 | 171.77 | 17.74 | 0.07 | 446.00 | 4.28 | 167.40 | |
| TH-102 | 426.80 | 21.65 | 1.21 | 0.40 | 0.18 | 0.46 | 1.38 | 0.60 | 2.30 | 114.05 | 49.59 | 0.25 | 462.00 | 1.09 | 3.03 | 9.33 |
| Sample ID | Depth (m) | Bitumen Extraction and Chromatographic Fractions (ppm of Whole Rocks) | HCs/EOM | Chromatographic Fractions of Bitumen Extraction (EOM wt.%) | TOC (wt.%) | |||||||
|---|---|---|---|---|---|---|---|---|---|---|---|---|
| EOM | Sat. | Aro. | NSO | HCs | Sat./EOM | Aro./EOM | NSO/EOM | HCs | ||||
| TS-1 | 152 | 623.11 | 285.24 | 166.73 | 171.14 | 451.97 | 0.73 | 45.78% | 26.76% | 27.47% | 72.53% | 1.47 |
| TS-2 | 166.6 | 2354.70 | 1384.70 | 801.26 | 168.74 | 2185.96 | 0.93 | 58.81% | 34.03% | 7.17% | 92.83% | 1.12 |
| TS-3 | 182.47 | 2215.95 | 1359.00 | 681.26 | 175.69 | 2040.26 | 0.92 | 61.33% | 30.74% | 7.93% | 92.07% | 1.05 |
| TS-4 | 184.28 | 2050.95 | 1284.56 | 432.65 | 333.74 | 1717.21 | 0.84 | 62.63% | 21.10% | 16.27% | 83.73% | 0.862 |
| TS-5 | 199.92 | 1642.18 | 826.32 | 201.13 | 614.73 | 1027.45 | 0.63 | 50.32% | 12.25% | 37.43% | 62.57% | 0.29 |
| TS-6 | 200.62 | 1315.13 | 684.29 | 341.53 | 289.31 | 1025.82 | 0.78 | 52.03% | 25.97% | 22.00% | 78.00% | 0.7 |
| TS-7 | 202.12 | 1412.64 | 570.71 | 250.95 | 590.98 | 821.66 | 0.58 | 40.40% | 17.76% | 41.84% | 58.16% | 0.758 |
| TS-8 | 206.48 | 1355.67 | 729.62 | 343.53 | 282.52 | 1073.15 | 0.79 | 53.82% | 25.34% | 20.84% | 79.16% | 0.85 |
| TS-9 | 207.45 | 1282.74 | 513.26 | 315.35 | 454.13 | 828.61 | 0.65 | 40.01% | 24.58% | 35.40% | 64.60% | 0.37 |
| TS-10 | 209.1 | 1085.16 | 784.62 | 152.03 | 148.51 | 936.65 | 0.86 | 72.30% | 14.01% | 13.69% | 86.31% | 0.14 |
| TS-11 | 215.48 | 1379.15 | 717.39 | 255.36 | 406.40 | 972.75 | 0.71 | 52.02% | 18.52% | 29.47% | 70.53% | 0.562 |
| TS-12 | 219.77 | 1248.24 | 742.27 | 199.41 | 306.56 | 941.68 | 0.75 | 59.47% | 15.98% | 24.56% | 75.44% | 0.752 |
| TS-13 | 223.59 | 1643.01 | 975.56 | 350.95 | 316.50 | 1326.51 | 0.81 | 59.38% | 21.36% | 19.26% | 80.74% | 1.25 |
| TS-14 | 228.85 | 1422.85 | 813.73 | 458.60 | 150.52 | 1272.33 | 0.89 | 57.19% | 32.23% | 10.58% | 89.42% | 0.94 |
| TS-15 | 235.69 | 1664.29 | 831.76 | 335.23 | 497.30 | 1166.99 | 0.70 | 49.98% | 20.14% | 29.88% | 70.12% | 0.79 |
| TS-16 | 264.95 | 1165.22 | 645.22 | 317.43 | 202.57 | 962.65 | 0.83 | 55.37% | 27.24% | 17.38% | 82.62% | 1.915 |
| TS-17 | 287 | 1389.45 | 701.75 | 268.13 | 419.57 | 969.88 | 0.70 | 50.51% | 19.30% | 30.20% | 69.80% | 1.755 |
| TS-18 | 290.23 | 1675.00 | 918.30 | 486.07 | 270.63 | 1404.37 | 0.84 | 54.82% | 29.02% | 16.16% | 83.84% | 1.68 |
| TS-19 | 292.16 | 2350.98 | 1286.23 | 651.25 | 413.50 | 1937.48 | 0.82 | 54.71% | 27.70% | 17.59% | 82.41% | 2.35 |
| TS-20 | 297.46 | 1339.35 | 865.32 | 333.65 | 140.38 | 1198.97 | 0.90 | 64.61% | 24.91% | 10.48% | 89.52% | 0.75 |
| TS-21 | 299.13 | 1744.25 | 926.22 | 93.28 | 724.75 | 1019.50 | 0.58 | 53.10% | 5.35% | 41.55% | 58.45% | 0.63 |
| TS-22 | 301.06 | 1479.29 | 920.70 | 217.29 | 341.30 | 1137.99 | 0.77 | 62.24% | 14.69% | 23.07% | 76.93% | 1.13 |
| TS-23 | 320.15 | 3589.26 | 1918.64 | 563.96 | 1106.66 | 2482.60 | 0.69 | 53.46% | 15.71% | 30.83% | 69.17% | 0.86 |
| TS-24 | 345.46 | 744.25 | 326.22 | 93.28 | 324.75 | 419.50 | 0.56 | 43.83% | 12.53% | 43.63% | 56.37% | 1.846 |
| TS-25 | 346.31 | 1070.15 | 656.51 | 145.65 | 267.99 | 802.16 | 0.75 | 61.35% | 13.61% | 25.04% | 74.96% | 1.41 |
| TS-26 | 348.12 | 1016.11 | 617.38 | 293.71 | 105.02 | 911.09 | 0.90 | 60.76% | 28.91% | 10.34% | 89.66% | 1.845 |
| TS-27 | 353.57 | 512.15 | 329.13 | 112.18 | 70.84 | 441.31 | 0.86 | 64.26% | 21.90% | 13.83% | 86.17% | 1.22 |
| TS-28 | 360.82 | 984.11 | 517.36 | 368.69 | 98.06 | 886.05 | 0.90 | 52.57% | 37.46% | 9.96% | 90.04% | 1.02 |
| TS-29 | 402.73 | 1011.84 | 598.40 | 258.28 | 155.16 | 856.68 | 0.85 | 59.14% | 25.53% | 15.33% | 84.67% | 1.15 |
| TS-30 | 406.64 | 1554.28 | 742.27 | 264.21 | 547.80 | 1006.48 | 0.65 | 47.76% | 17.00% | 35.24% | 64.76% | 1.25 |
| TS-31 | 418 | 1662.22 | 992.23 | 254.14 | 415.85 | 1246.37 | 0.75 | 59.69% | 15.29% | 25.02% | 74.98% | 0.49 |
| TS-32 | 426.1 | 1721.88 | 985.75 | 418.28 | 317.85 | 1404.03 | 0.82 | 57.25% | 24.29% | 18.46% | 81.54% | 1.24 |
| average | 1490.80 | 826.58 | 325.80 | 338.42 | 1152.38 | 0.77 | 0.55 | 0.22 | 0.23 | 0.77 | 1.08 | |
| TO-1 | 289.45 | 1339.35 | 865.32 | 333.65 | 140.38 | 1198.97 | 0.90 | 64.61% | 24.91% | 10.48% | 89.52% | |
| TO-2 | 327.5 | 2350.98 | 1286.23 | 651.25 | 413.50 | 1937.48 | 0.82 | 54.71% | 27.70% | 17.59% | 82.41% | |
| TO-3 | 367.7 | 1984.11 | 1517.36 | 368.69 | 98.06 | 1886.05 | 0.95 | 76.48% | 18.58% | 4.94% | 95.06% | |
| TO-4 | 387.8 | 2744.25 | 1726.22 | 593.28 | 424.75 | 2319.50 | 0.85 | 62.90% | 21.62% | 15.48% | 84.52% | |
| TO-5 | 418.3 | 1756.59 | 1455.18 | 208.58 | 92.83 | 1663.76 | 0.95 | 82.84% | 11.87% | 5.28% | 94.72% | |
| TO-6 | 423.2 | 2158.62 | 1668.04 | 458.22 | 32.36 | 2126.26 | 0.99 | 77.27% | 21.23% | 1.50% | 98.50% | |
| average | 2055.65 | 1419.73 | 435.61 | 200.31 | 1855.34 | 0.91 | 0.70 | 0.21 | 0.09 | 0.91 | 2055.65 | |
| Samples ID | Depth (m) | n-Alkane and Isoprenoids | Triterpanes and Terpanes (m/z191) | Steranes and Diasteranes (m/z217) | Di-asterane/Sterane | Sterane/Hopane | |||||||||||||
|---|---|---|---|---|---|---|---|---|---|---|---|---|---|---|---|---|---|---|---|
| Pr/Ph | Pr/C17 | Ph/C18 | CPI | C32 22S/(22S + 22R) | C29/C30 | C31R/C30H | C30M/C30H | Ga/C30H | Ts/(Ts+Tm) | C29 20S/(20S + 20R) | C29ββ/(αα+ββ) | C27/C29 | Regular Steranes (%) | ||||||
| C27 | C28 | C29 | |||||||||||||||||
| TS-1 | 152.00 | 0.78 | 0.51 | 0.76 | 1.06 | 0.61 | 0.45 | 0.18 | 0.16 | 0.42 | 0.85 | 0.35 | 0.45 | 0.50 | 0.28 | 0.15 | 0.56 | 0.56 | 0.32 |
| TS-2 | 166.60 | 0.85 | 0.43 | 0.56 | 1.04 | 0.53 | 0.51 | 0.18 | 0.14 | 0.51 | 0.86 | 0.31 | 0.53 | 0.90 | 0.35 | 0.26 | 0.39 | 0.71 | 0.33 |
| TS-3 | 182.47 | 0.76 | 0.56 | 0.69 | 1.10 | 0.59 | 0.42 | 0.18 | 0.13 | 0.40 | 0.62 | 0.32 | 0.53 | 0.50 | 0.27 | 0.20 | 0.53 | 0.66 | 0.21 |
| TS-4 | 184.28 | 0.77 | 0.52 | 0.85 | 1.11 | 0.63 | 0.46 | 0.16 | 0.14 | 0.53 | 0.73 | 0.38 | 0.56 | 0.43 | 0.26 | 0.13 | 0.61 | 0.65 | 0.46 |
| TS-5 | 199.92 | 0.92 | 0.55 | 0.71 | 1.12 | 0.52 | 0.48 | 0.19 | 0.14 | 0.41 | 0.77 | 0.36 | 0.52 | 0.47 | 0.25 | 0.22 | 0.53 | 0.82 | 0.30 |
| TS-6 | 200.62 | 0.76 | 0.41 | 0.67 | 1.03 | 0.60 | 0.50 | 0.15 | 0.14 | 0.40 | 0.73 | 0.46 | 0.53 | 0.50 | 0.26 | 0.21 | 0.52 | 0.65 | 0.35 |
| TS-7 | 202.12 | 0.70 | 0.52 | 0.93 | 1.06 | 0.58 | 0.49 | 0.15 | 0.14 | 0.32 | 0.55 | 0.32 | 0.46 | 0.72 | 0.33 | 0.22 | 0.46 | 0.96 | 0.32 |
| TS-8 | 206.48 | 0.75 | 0.24 | 0.74 | 1.06 | 0.54 | 0.45 | 0.17 | 0.13 | 0.35 | 0.83 | 0.42 | 0.48 | 0.83 | 0.37 | 0.19 | 0.44 | 0.92 | 0.51 |
| TS-9 | 207.45 | 0.65 | 0.60 | 0.53 | 1.10 | 0.60 | 0.44 | 0.18 | 0.13 | 0.37 | 0.45 | 0.46 | 0.55 | 0.48 | 0.26 | 0.20 | 0.54 | 1.03 | 0.31 |
| TS-10 | 209.10 | 0.80 | 0.52 | 0.86 | 1.08 | 0.53 | 0.45 | 0.20 | 0.13 | 0.43 | 0.73 | 0.32 | 0.42 | 0.54 | 0.27 | 0.22 | 0.51 | 1.21 | 0.24 |
| TS-11 | 215.48 | 0.89 | 0.58 | 0.35 | 1.09 | 0.57 | 0.51 | 0.17 | 0.15 | 0.75 | 0.89 | 0.30 | 0.47 | 0.72 | 0.33 | 0.21 | 0.46 | 1.25 | 0.38 |
| TS-12 | 219.77 | 0.54 | 0.53 | 0.65 | 1.08 | 0.51 | 0.54 | 0.20 | 0.13 | 0.64 | 0.84 | 0.35 | 0.46 | 0.85 | 0.36 | 0.22 | 0.42 | 0.86 | 0.23 |
| TS-13 | 223.59 | 0.74 | 0.63 | 0.82 | 1.09 | 0.53 | 0.52 | 0.21 | 0.13 | 0.48 | 0.72 | 0.30 | 0.48 | 0.79 | 0.35 | 0.21 | 0.44 | 0.80 | 0.24 |
| TS-14 | 228.85 | 0.79 | 0.51 | 0.97 | 1.01 | 0.55 | 0.53 | 0.24 | 0.13 | 0.33 | 0.80 | 0.38 | 0.53 | 0.51 | 0.26 | 0.22 | 0.52 | 0.88 | 0.34 |
| TS-15 | 235.69 | 0.75 | 0.64 | 0.70 | 1.02 | 0.58 | 0.51 | 0.19 | 0.14 | 0.25 | 0.47 | 0.38 | 0.43 | 0.73 | 0.34 | 0.20 | 0.46 | 0.75 | 0.27 |
| TS-16 | 264.95 | 0.69 | 0.60 | 0.72 | 1.15 | 0.57 | 0.52 | 0.19 | 0.14 | 0.26 | 0.53 | 0.33 | 0.43 | 0.39 | 0.23 | 0.19 | 0.58 | 0.75 | 0.31 |
| TS-17 | 287.00 | 0.72 | 0.52 | 0.73 | 1.06 | 0.52 | 0.49 | 0.18 | 0.14 | 0.22 | 0.61 | 0.38 | 0.46 | 0.46 | 0.24 | 0.24 | 0.52 | 0.97 | 0.38 |
| TS-18 | 290.23 | 0.55 | 0.65 | 0.81 | 1.06 | 0.59 | 0.50 | 0.18 | 0.14 | 0.24 | 0.55 | 0.30 | 0.44 | 0.51 | 0.27 | 0.20 | 0.53 | 0.75 | 0.26 |
| TS-19 | 292.16 | 0.66 | 0.51 | 0.30 | 1.13 | 0.53 | 0.42 | 0.20 | 0.12 | 0.33 | 0.56 | 0.43 | 0.53 | 0.47 | 0.25 | 0.21 | 0.54 | 1.16 | 0.17 |
| TS-20 | 297.46 | 0.63 | 0.56 | 0.49 | 1.08 | 0.59 | 0.48 | 0.20 | 0.15 | 0.22 | 0.46 | 0.45 | 0.43 | 0.66 | 0.31 | 0.23 | 0.47 | 0.95 | 0.13 |
| TS-21 | 299.13 | 0.78 | 0.54 | 0.34 | 1.10 | 0.63 | 0.39 | 0.21 | 0.11 | 0.34 | 0.77 | 0.41 | 0.54 | 0.64 | 0.31 | 0.21 | 0.49 | 1.29 | 0.17 |
| TS-22 | 301.06 | 0.80 | 0.56 | 0.42 | 1.18 | 0.54 | 0.49 | 0.21 | 0.12 | 0.33 | 0.84 | 0.48 | 0.57 | 0.78 | 0.33 | 0.25 | 0.42 | 0.95 | 0.26 |
| TS-23 | 320.15 | 0.90 | 0.43 | 0.32 | 1.19 | 0.63 | 0.46 | 0.31 | 0.13 | 0.38 | 0.61 | 0.44 | 0.55 | 0.85 | 0.36 | 0.23 | 0.42 | 0.92 | 0.23 |
| TS-24 | 345.46 | 0.72 | 0.43 | 0.31 | 1.09 | 0.57 | 0.42 | 0.22 | 0.12 | 0.33 | 0.73 | 0.37 | 0.48 | 0.79 | 0.35 | 0.20 | 0.45 | 1.27 | 0.25 |
| TS-25 | 346.31 | 0.76 | 0.56 | 0.38 | 1.11 | 0.57 | 0.41 | 0.25 | 0.16 | 0.58 | 0.75 | 0.44 | 0.48 | 0.79 | 0.33 | 0.24 | 0.43 | 1.19 | 0.11 |
| TS-26 | 348.12 | 0.91 | 0.49 | 0.32 | 1.17 | 0.58 | 0.44 | 0.26 | 0.14 | 0.57 | 0.79 | 0.35 | 0.53 | 0.70 | 0.32 | 0.21 | 0.46 | 1.21 | 0.32 |
| TS-27 | 353.57 | 0.68 | 0.42 | 0.43 | 1.08 | 0.58 | 0.41 | 0.30 | 0.13 | 0.60 | 0.85 | 0.33 | 0.52 | 0.72 | 0.33 | 0.20 | 0.46 | 1.42 | 0.19 |
| TS-28 | 360.82 | 0.89 | 0.62 | 0.22 | 1.09 | 0.58 | 0.44 | 0.29 | 0.13 | 0.63 | 0.58 | 0.38 | 0.58 | 0.88 | 0.36 | 0.23 | 0.41 | 1.61 | 0.12 |
| TS-29 | 402.73 | 0.91 | 0.43 | 0.32 | 1.07 | 0.60 | 0.42 | 0.29 | 0.13 | 0.46 | 0.63 | 0.34 | 0.52 | 1.07 | 0.38 | 0.27 | 0.35 | 1.25 | 0.23 |
| TS-30 | 406.64 | 0.76 | 0.53 | 0.25 | 1.08 | 0.59 | 0.41 | 0.33 | 0.12 | 0.39 | 0.79 | 0.33 | 0.55 | 0.70 | 0.34 | 0.18 | 0.48 | 1.86 | 0.31 |
| TS-31 | 418.00 | 0.76 | 0.64 | 0.22 | 1.08 | 0.56 | 0.46 | 0.32 | 0.16 | 0.33 | 0.84 | 0.38 | 0.63 | 1.15 | 0.39 | 0.28 | 0.34 | 1.29 | 0.21 |
| TS-32 | 426.10 | 0.75 | 0.63 | 0.32 | 1.06 | 0.52 | 0.43 | 0.32 | 0.15 | 0.32 | 0.75 | 0.35 | 0.42 | 0.83 | 0.34 | 0.24 | 0.42 | 1.61 | 0.32 |
| TO-1 | 289.45 | 0.61 | 0.34 | 0.85 | 1.17 | 0.55 | 0.46 | 0.22 | 0.11 | 0.23 | 0.70 | 0.39 | 0.35 | 0.58 | 0.30 | 0.18 | 0.52 | 1.16 | 0.18 |
| TO-2 | 327.50 | 0.84 | 0.36 | 0.56 | 1.07 | 0.58 | 0.45 | 0.17 | 0.18 | 0.28 | 0.55 | 0.46 | 0.44 | 0.73 | 0.32 | 0.25 | 0.43 | 1.25 | 0.22 |
| TO-3 | 367.70 | 0.72 | 0.23 | 0.56 | 1.12 | 0.59 | 0.38 | 0.25 | 0.19 | 0.32 | 0.76 | 0.45 | 0.43 | 0.83 | 0.42 | 0.09 | 0.50 | 1.54 | 0.25 |
| TO-4 | 387.80 | 0.66 | 0.35 | 0.42 | 1.18 | 0.52 | 0.45 | 0.22 | 0.14 | 0.26 | 0.68 | 0.51 | 0.48 | 0.61 | 0.29 | 0.22 | 0.48 | 1.25 | 0.17 |
| TO-5 | 418.30 | 0.81 | 0.54 | 0.38 | 1.15 | 0.64 | 0.45 | 0.30 | 0.13 | 0.56 | 0.83 | 0.43 | 0.49 | 0.74 | 0.36 | 0.16 | 0.48 | 1.68 | 0.16 |
| TO-6 | 423.20 | 0.73 | 0.25 | 0.16 | 1.17 | 0.67 | 0.44 | 0.33 | 0.19 | 0.25 | 0.64 | 0.45 | 0.46 | 0.73 | 0.38 | 0.10 | 0.52 | 1.64 | 0.32 |
| Depth (m) | TG (%) | C1 (%) | C2 (%) | C3 (%) | In(c1/c2) | In(c2/c3) | Non-Hydrocarbon (%) |
|---|---|---|---|---|---|---|---|
| 222 | 1.29 | 1.27 | 0.01 | 0.00 | 4.57 | 2.39 | 0.01 |
| 224 | 1.20 | 1.17 | 0.01 | 0.00 | 4.66 | 2.22 | 0.01 |
| 237 | 1.02 | 0.93 | 0.02 | 0.00 | 3.90 | 4.12 | 0.07 |
| 249 | 1.56 | 1.43 | 0.02 | 0.00 | 4.31 | 2.17 | 0.07 |
| 250 | 1.74 | 1.64 | 0.04 | 0.00 | 3.63 | 2.32 | 0.03 |
| 253 | 1.59 | 1.45 | 0.07 | 0.01 | 2.99 | 2.22 | 0.03 |
| 257 | 1.35 | 1.29 | 0.04 | 0.00 | 3.45 | 2.43 | 0.01 |
| 258 | 2.81 | 2.70 | 0.08 | 0.00 | 3.50 | 2.85 | 0.01 |
| 259 | 0.56 | 0.52 | 0.02 | 0.00 | 3.05 | 2.94 | 0.01 |
| 260 | 1.20 | 1.15 | 0.04 | 0.00 | 3.35 | 2.87 | 0.01 |
| 264 | 0.83 | 0.76 | 0.04 | 0.00 | 2.92 | 3.45 | 0.03 |
| 265 | 2.10 | 2.07 | 0.02 | 0.00 | 4.46 | 2.01 | 0.00 |
| 268 | 2.28 | 2.18 | 0.07 | 0.01 | 3.40 | 2.42 | 0.01 |
| 271 | 1.22 | 1.13 | 0.06 | 0.00 | 3.02 | 2.82 | 0.03 |
| 272 | 1.38 | 1.31 | 0.06 | 0.00 | 3.04 | 3.30 | 0.00 |
| 273 | 0.41 | 0.37 | 0.01 | 0.00 | 3.56 | 2.36 | 0.06 |
| 274 | 2.89 | 2.75 | 0.11 | 0.00 | 3.26 | 3.08 | 0.01 |
| 275 | 3.22 | 3.17 | 0.04 | 0.00 | 4.35 | 3.71 | 0.00 |
| 277 | 2.32 | 2.14 | 0.08 | 0.00 | 3.25 | 3.35 | 0.04 |
| 278 | 3.86 | 3.77 | 0.07 | 0.00 | 3.95 | 3.64 | 0.01 |
| 284 | 1.98 | 1.87 | 0.06 | 0.00 | 3.41 | 3.43 | 0.03 |
| 285 | 0.96 | 0.87 | 0.01 | 0.00 | 4.10 | 1.68 | 0.07 |
| 287 | 1.06 | 1.01 | 0.02 | 0.00 | 3.95 | 1.80 | 0.02 |
| 288 | 1.37 | 1.32 | 0.02 | 0.00 | 4.48 | 2.07 | 0.02 |
| 295 | 0.94 | 0.86 | 0.01 | 0.00 | 4.15 | 2.35 | 0.07 |
| 296 | 2.89 | 2.79 | 0.05 | 0.00 | 3.98 | 2.96 | 0.01 |
| 297 | 2.36 | 2.29 | 0.02 | 0.00 | 4.86 | 2.09 | 0.02 |
| 308 | 1.14 | 1.04 | 0.01 | 0.00 | 4.42 | 2.43 | 0.07 |
| 311 | 2.21 | 2.06 | 0.02 | 0.00 | 4.54 | 2.25 | 0.06 |
| 316 | 6.16 | 5.91 | 0.08 | 0.01 | 4.29 | 2.44 | 0.02 |
| 321 | 6.24 | 5.91 | 0.11 | 0.01 | 3.97 | 2.52 | 0.03 |
| 325 | 1.56 | 1.48 | 0.02 | 0.00 | 4.46 | 2.31 | 0.04 |
| 326 | 0.92 | 0.85 | 0.01 | 0.00 | 4.44 | 2.41 | 0.06 |
| 327 | 1.64 | 1.54 | 0.02 | 0.00 | 4.56 | 2.04 | 0.05 |
| 328 | 2.27 | 2.16 | 0.02 | 0.00 | 4.77 | 2.00 | 0.04 |
| 329 | 2.69 | 2.58 | 0.08 | 0.00 | 3.53 | 2.90 | 0.01 |
| 331 | 3.33 | 3.25 | 0.08 | 0.00 | 3.70 | 2.91 | 0.00 |
| 334 | 3.35 | 3.18 | 0.07 | 0.00 | 3.85 | 3.15 | 0.03 |
| 336 | 4.74 | 4.65 | 0.07 | 0.00 | 4.24 | 3.33 | 0.01 |
| 337 | 3.16 | 3.05 | 0.07 | 0.01 | 3.83 | 2.04 | 0.01 |
| 339 | 5.37 | 5.08 | 0.07 | 0.00 | 4.32 | 3.18 | 0.04 |
| 340 | 3.30 | 3.13 | 0.07 | 0.00 | 3.83 | 3.82 | 0.03 |
| 341 | 2.53 | 2.42 | 0.07 | 0.00 | 3.56 | 3.59 | 0.02 |
| 346 | 2.60 | 2.35 | 0.07 | 0.00 | 3.52 | 3.90 | 0.07 |
| 350 | 3.00 | 2.88 | 0.07 | 0.00 | 3.71 | 3.30 | 0.02 |
| 351 | 3.86 | 3.60 | 0.07 | 0.01 | 3.98 | 2.03 | 0.05 |
| 352 | 1.27 | 1.19 | 0.07 | 0.00 | 2.83 | 2.98 | 0.01 |
| 354 | 1.53 | 1.43 | 0.07 | 0.00 | 3.01 | 2.84 | 0.02 |
| 355 | 2.73 | 2.46 | 0.07 | 0.00 | 3.55 | 2.84 | 0.07 |
| 357 | 1.54 | 1.43 | 0.07 | 0.01 | 3.03 | 2.05 | 0.02 |
| 358 | 1.66 | 1.53 | 0.07 | 0.00 | 3.12 | 2.67 | 0.04 |
| 360 | 1.59 | 1.49 | 0.07 | 0.02 | 3.06 | 1.41 | 0.00 |
| 363 | 4.01 | 3.83 | 0.07 | 0.01 | 3.98 | 2.49 | 0.03 |
| 376 | 2.83 | 2.63 | 0.07 | 0.00 | 3.68 | 3.32 | 0.04 |
| 379 | 1.67 | 1.58 | 0.07 | 0.00 | 3.16 | 3.86 | 0.02 |
| 383 | 3.07 | 2.90 | 0.07 | 0.00 | 3.78 | 4.20 | 0.03 |
| 384 | 3.57 | 3.40 | 0.07 | 0.00 | 3.94 | 3.27 | 0.03 |
| 386 | 1.16 | 1.06 | 0.02 | 0.00 | 3.91 | 3.06 | 0.06 |
| 387 | 4.03 | 3.79 | 0.07 | 0.00 | 4.04 | 4.20 | 0.04 |
| 388 | 4.12 | 3.96 | 0.07 | 0.00 | 4.08 | 4.20 | 0.02 |
| 389 | 1.34 | 1.24 | 0.03 | 0.00 | 3.75 | 3.37 | 0.05 |
| 390 | 5.08 | 4.90 | 0.07 | 0.00 | 4.23 | 4.27 | 0.02 |
| 391 | 1.72 | 1.61 | 0.07 | 0.00 | 3.16 | 4.23 | 0.02 |
| 392 | 5.80 | 5.42 | 0.07 | 0.00 | 4.32 | 4.27 | 0.05 |
| 395 | 1.33 | 1.23 | 0.07 | 0.00 | 2.93 | 4.19 | 0.02 |
| 396 | 3.23 | 3.13 | 0.07 | 0.00 | 3.79 | 4.26 | 0.01 |
| 397 | 1.33 | 1.21 | 0.03 | 0.00 | 3.64 | 3.46 | 0.07 |
| 398 | 3.97 | 3.74 | 0.07 | 0.00 | 4.00 | 4.23 | 0.04 |
| 399 | 2.83 | 2.68 | 0.07 | 0.00 | 3.66 | 4.24 | 0.03 |
| 400 | 1.62 | 1.53 | 0.03 | 0.00 | 3.96 | 3.38 | 0.04 |
| 401 | 4.01 | 3.64 | 0.07 | 0.00 | 3.97 | 4.23 | 0.07 |
| 402 | 2.04 | 1.92 | 0.07 | 0.00 | 3.30 | 4.26 | 0.02 |
| 403 | 1.76 | 1.66 | 0.07 | 0.00 | 3.17 | 4.24 | 0.02 |
| 404 | 4.81 | 4.62 | 0.07 | 0.02 | 4.24 | 1.14 | 0.02 |
| 409 | 4.37 | 4.19 | 0.17 | 0.01 | 3.21 | 3.32 | 0.00 |
| 410 | 1.67 | 1.56 | 0.07 | 0.00 | 3.08 | 2.72 | 0.02 |
| 411 | 1.26 | 1.17 | 0.03 | 0.00 | 3.81 | 2.43 | 0.05 |
| 412 | 4.51 | 4.37 | 0.07 | 0.01 | 4.10 | 2.36 | 0.01 |
| 413 | 1.62 | 1.51 | 0.07 | 0.01 | 3.04 | 2.67 | 0.02 |
| 415 | 4.90 | 4.63 | 0.07 | 0.00 | 4.19 | 3.00 | 0.04 |
| 416 | 1.89 | 1.77 | 0.07 | 0.00 | 3.29 | 3.16 | 0.03 |
| 417 | 1.31 | 1.20 | 0.03 | 0.01 | 3.54 | 1.79 | 0.05 |
| 418 | 5.23 | 5.04 | 0.16 | 0.00 | 3.47 | 4.14 | 0.01 |
| 419 | 2.14 | 2.04 | 0.07 | 0.00 | 3.43 | 3.45 | 0.02 |
| 420 | 3.21 | 3.02 | 0.07 | 0.01 | 3.73 | 1.62 | 0.03 |
| 421 | 1.82 | 1.72 | 0.06 | 0.00 | 3.32 | 3.39 | 0.02 |
| 422 | 1.75 | 1.62 | 0.07 | 0.00 | 3.21 | 3.44 | 0.03 |
| 423 | 5.55 | 5.28 | 0.07 | 0.00 | 4.39 | 3.39 | 0.04 |
| 424 | 1.86 | 1.73 | 0.06 | 0.00 | 3.34 | 2.78 | 0.03 |
| 425 | 1.72 | 1.62 | 0.06 | 0.00 | 3.28 | 3.47 | 0.02 |
| 426 | 7.23 | 7.00 | 0.08 | 0.01 | 4.44 | 2.36 | 0.02 |
| 427 | 1.33 | 1.28 | 0.01 | 0.00 | 4.46 | 1.79 | 0.02 |
| 428 | 1.30 | 1.18 | 0.04 | 0.01 | 3.40 | 1.76 | 0.06 |
| 429 | 1.27 | 1.18 | 0.02 | 0.01 | 3.86 | 1.58 | 0.04 |
| 430 | 6.56 | 6.39 | 0.06 | 0.00 | 4.60 | 3.33 | 0.02 |
Publisher’s Note: MDPI stays neutral with regard to jurisdictional claims in published maps and institutional affiliations. |
© 2020 by the authors. Licensee MDPI, Basel, Switzerland. This article is an open access article distributed under the terms and conditions of the Creative Commons Attribution (CC BY) license (http://creativecommons.org/licenses/by/4.0/).
Share and Cite
He, W.; Sun, Y.; Shan, X. Geochemical Characteristics of the Lower Cretaceous HengTongshan Formation in the Tonghua Basin, Northeast China: Implications for Depositional Environment and Shale Oil Potential Evaluation. Appl. Sci. 2021, 11, 23. https://doi.org/10.3390/app11010023
He W, Sun Y, Shan X. Geochemical Characteristics of the Lower Cretaceous HengTongshan Formation in the Tonghua Basin, Northeast China: Implications for Depositional Environment and Shale Oil Potential Evaluation. Applied Sciences. 2021; 11(1):23. https://doi.org/10.3390/app11010023
Chicago/Turabian StyleHe, Wentong, Youhong Sun, and Xuanlong Shan. 2021. "Geochemical Characteristics of the Lower Cretaceous HengTongshan Formation in the Tonghua Basin, Northeast China: Implications for Depositional Environment and Shale Oil Potential Evaluation" Applied Sciences 11, no. 1: 23. https://doi.org/10.3390/app11010023
APA StyleHe, W., Sun, Y., & Shan, X. (2021). Geochemical Characteristics of the Lower Cretaceous HengTongshan Formation in the Tonghua Basin, Northeast China: Implications for Depositional Environment and Shale Oil Potential Evaluation. Applied Sciences, 11(1), 23. https://doi.org/10.3390/app11010023