Abstract
Reliable geology prediction is of great importance in ensuring the stability and safety of tunnels and other underground engineering projects. This paper presents basic neural network and deep neural network models using a genetic algorithm (GA) to predict geological conditions for tunneling. Batch normalization and GA optimization approaches are employed in the deep neural network. A case study of the Jiudingshan Tunnel on the Chuxiong–Dali Highway in Yunnan, China, shows that the neural network method can predict geological conditions well, especially for rock types with voluminous data, for which predictive accuracy exceeds 90%. These results suggest that an appropriately trained neural network can reliably and accurately predict the geological conditions behind the tunnel face. The area under the curve (AUC) and confusion matrix evaluations show that the accuracy performance of the deep neural network exceeds that of the basic neural network. The feature importance of each drilling parameter was also analyzed; the results indicate that a neural network model for geology prediction can achieve predictive accuracy with few drilling parameters. The neural network geology prediction method provides reliable results for dynamic tunnel design.
1. Introduction
Drilling is one of the most common, necessary, and important operations in geotechnical engineering. In addition to its primary purpose, drilling can also be considered an in-situ measurement technique for ground characterization [1]. The drilling test is a procedure for continuously obtaining information on the drill or bit during drilling; this information can be used for geology prediction. The use of drilling test techniques to assess the quality of a rock mass dates back to Horner and Sherrell’s 1977 study [2]. Since then, many studies have shown that rock information can be determined from the rock’s mechanical response to the drill during the drilling process. A significant body of research has been published on quantitative models used to characterize the rock information using drilling parameters such as drilling speed, thrust, torque, and rotational velocity. Statistics and machine learning methods have also been used by certain researchers to characterize rocks.
Researchers have also used statistics and machine learning methods to characterize rocks. Simon [3] quantified the energy of drilling and measured the bit efficiency using a mechanical specific energy index. Teale [4] introduced the concept of the specific energy of rock drilling, which is influenced by a variety of factors including thrust, torque, rotational velocity, unconfined compressive strength of rock, and bit type. The specific energy of rock drilling is closely correlated with the properties of the rock. Many studies have drawn on the work of Teale. Hoberrock et al. [5] verified the relationship between specific energy and rock strength. Finfinger [6] used the average specific energy to determine the average unconfined compressive strength. Hamrick [7] improved the computing method for mechanical specific energy by reevaluating the weight of the bit parameter. Since 1996, Finfinger et al. [6,8] have conducted a series of experiments to characterize roof rock properties including fractures, joints, voids, rock layer boundary locations, and rock strength using drilling test parameters such as thrust, torque, penetration rate, and rotational velocity. Schunnesson [9,10] has focused on rock characterization using drilling parameters and the principal component analysis (PCA) method. The main drilling parameters used to characterize the rock type were drill length, torque pressure, penetration rate, rotation speed, thrust, and percussive pressure. Schunnesson [10] introduced a method to normalize the drill parameters and analyzed the rock breaking mechanism, finding that systematic variation and rock type-dependent variation occur in the relationships among drilling parameters. Schunnesson normalized the systematic variation in several steps and used the normalized data to predict a rock quality designation (RQD) value. His results revealed that the predicted value has the same trend as the true value. Navarro et al. [11] applied Schunnesson’s drilling parameter normalization method to normalize measurement while drilling (MWD) data and to detect potential overbreak zones in tunnel blasting. Yue et al. [1,12,13] invented an automatic drilling process monitoring (DPM) technique, which easily measures and calculates the curve of the drilling speed. Yue concluded that each type of rock has a gradient of constant slope. Qin et al. [14] recorded vibrational and acoustic data during the drilling process, showing that both the vibrational spectral data and the acoustic spectral data can be used to identify various rock types. Lv et al. [15,16] introduced an equation relating the bearing capacity of the soil to the bit torque. LaBelle et al. [17] introduced the use of neural networks to classify rocks, obtaining a 95.5% classification accuracy in their laboratory drilling experiments. Asadi [18] used an artificial neural network to predict the uniaxial compressive strength (UCS) of formation rocks in petroleum fields. Vezhapparambu et al. [19] used multivariate analysis, neuro-adaptive learning algorithms, and machine learning to differentiate among lithologies. Klyuchnikov et al. [20] compared various machine learning algorithms to classify rock types based on drilling data, obtaining a classification accuracy of 91% at best. Romanenkova et al. [21] classified rock types using machine learning and gradient boosted decision trees based on MWD data. Gurina et al. [22] used MWD data and a machine learning algorithm model to detect anomalies in directional drilling. Zhou et al. [23,24] classified rock types based on Gaussian processes and the unsupervised clustering of MWD data. They also illustrated a method for using unsupervised learning together with the specific energy of rock drilling to optimize the penetration rate.
Many researchers have concluded that strong relationships exist between drilling test data and rock properties. Due to the uncertainties in the drilling process, such as variations in drilling devices, bit conditions, and operator habits, drilling test data usually exhibit randomness. Currently available drilling mechanics and drilling energy analysis methods show difficulty in obtaining a clear quantitative correspondence between drilling parameters and rock properties. Machine learning neural networks constitute an appropriate method of classification for systems with complex relationships among many variables. This technique can rapidly acquire the nonlinear mapping relationships between drilling test data and rock properties. Only a few researchers have applied machine learning to drilling tests for tunnel geology prediction in civil engineering. Most such research has used machine learning methods in the mining and petroleum industries, focusing on only one or two types of rock prediction. Geology prediction in tunnel drilling is more complicated than in the mining and petroleum industries, which must acquire more accurate and detailed rock information. Given that most machine learning studies have focused on elaborate laboratory drilling tests, the question of these methods’ validity when applied to drilling data obtained from practical civil engineering warrants further study. Moreover, current instrumented drilling test applications of machine learning are based on basic machine learning model structures that lack an optimized learning model, notably for instrumented drilling tests in civil engineering.
This paper presents a basic neural network and a deep neural network model using a genetic algorithm (GA) to predict geological conditions for tunneling. The deep neural network method contains two components: (1) a normalization layer of the drilling parameters and (2) a GA optimization of the hyperparameters. Batch normalization is used in the normalization layer to accelerate the training process, enable higher learning rates, and improve the generalization accuracy. Optimized hyperparameters can be obtained via the GA optimization approach. Here a case study of the Jiudingshan Tunnel on the Chuxiong–Dali Highway in Yunnan, China, is provided to demonstrate the application of the method in tunnel geology prediction. In the case study, the feasibility and effectiveness of the neural network model based on instrumented drilling test data are verified. The feature importance of each drilling parameter is also analyzed. This neural network method based on instrumented drilling test data can make tunnel geological condition prediction more efficient and economical.
2. Data Overview
The Jiudingshan Tunnel on the Chuxiong–Dali highway in Yunnan, China, is 7575 m long. The depth is 570 m, and the maximum excavation width is 17.34 m. The tunnel is located on composite site with various rock structures. Moreover, the tunnel has poor surrounding rock stability and passes through geology of poor structural competence, such as karst, a fault fracture zone, and a contact zone between limestone and granite porphyry. A geological survey was conducted; the geologic map in Figure 1 shows the boreholes. Since the tunnel is so long and the number of boreholes is limited, it was difficult to obtain a completer picture of the actual geological conditions prior to tunnel excavation. It was necessary to design the tunnel dynamically according to the geology prediction results, so advanced horizontal drilling testing was conducted.
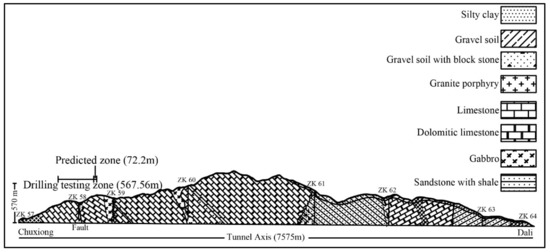
Figure 1.
Geological cross-section of the tunnel’s route (ZK57—64: the location of eight boreholes).
An RPD-180CBR multifunctional drill rig (KOKEN, Japan) was used for the horizontal advanced drilling testing. The drilling speed, torque, rotation speed, propulsion, blow energy, blow number, water supply rate, water supply pressure, and EV energy (i.e., the energy required to break out a unit volume of rock, is a function of blow energy, blow number, drilling speed, and bit diameter) data were recorded every 2 cm during the horizontal drilling. Actual geological conditions were recorded as tunnel excavation proceeded.
Horizontal advanced drilling testing was conducted for 10 boreholes, and the cumulative depth of the boreholes was 567.56 m. The first nine borehole drilling data sets were used to perform the neural network training, while the tenth data set was used for the testing. In total, there were 33,113 groups of training data and 3611 groups of testing data. Fractured limestone, limestone, clay, and soft interlayer were the four rock types encountered in this part of the tunnel. Figure 2 shows one set of drilling data and the actual geological profile for a borehole 69.86 m deep. Inconspicuous relationships were found between the geological profile and the drilling parameters. For example, the drilling speed increased when soft interlayers were encountered. However, an accurate quantitative relationship between the rocks and the drilling data could not be obtained through observation. To determine the complex nonlinear relationships between the drilling test data and geological conditions, the neural network method with machine learning was introduced for tunnel geology prediction, and the deep neural network method with the GA algorithm was introduced to improve the accuracy of the tunnel geology prediction.
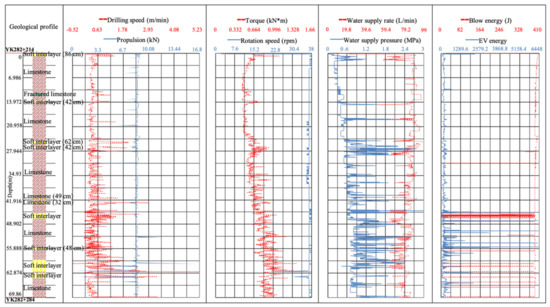
Figure 2.
Drilling test records from Chainage no. YK282 + 214 to YK202 + 284.
3. Methodology for Tunnel Geology Prediction Based on Instrumented Drilling Tests
3.1. Basic Neural Network
To construct the complex nonlinear relationships between the drilling data parameters and the actual rock types, the basic neural network method was used. Figure 3 shows a schematic diagram of a basic neural network with a single hidden layer.
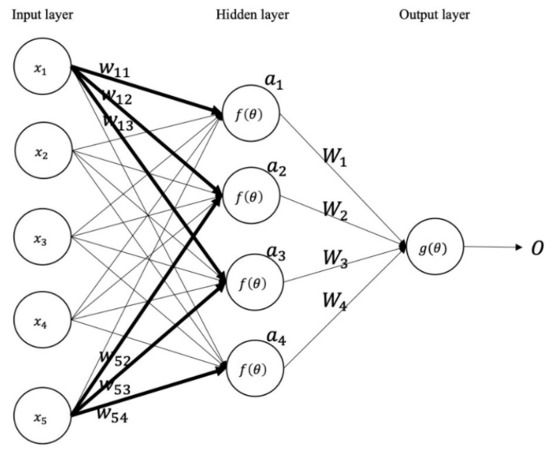
Figure 3.
Schematic diagram of a basic neural network (: input data of hidden layer, and : weight value between one node in one layer and another node in other layer, : activation function of hidden layer, : input data of output layer, : activation function of output layer, : output value).
The input layer takes the raw data or preprocessed data vector into the hidden layer using a weight value vector where means the input layer node label, means the hidden layer node label, and superscript T means the transpose. The hidden layer processing units calculate the sum of the weighted values and add the threshold value (see Equation (1)).
where means the number of input layer nodes.
The calculated results are sent to the activation function to obtain the output layer’s input vector . An activation function normalizes the output of each node to a range or to a probability distribution. Many activation functions, such as ReLU and SoftMax, have been introduced to suit different neural network problems. The ReLU activation function returns 0 if it receives any negative input, but for any positive value it returns input value back. The SoftMax activation function converts a vector of numbers into a vector of probabilities, where the probabilities of each value are proportional to the relative scale of each value in the vector. The SoftMax activation function is often used in the output layer of classification problems.
The output layer uses the input vector , weight value vector where means the number of hidden layer nodes, threshold value , and activation function to obtain the final output value (see Equation (2)).
where means the number of input layer nodes.
Depending on the value, the loss function calculates the gaps between the actual value and output value as the loss value, which is used to adjust all the weights and threshold values to obtain an optimal value. The loss function is a method of evaluating a specific algorithm’s performance. Many types of loss functions are available, such as the cross-entropy loss function. The output of the cross-entropy method is a probability value between 0 and 1 that measures the performance of a classification model, namely:
where is the number of classification classes, is the predicted probability for class label c, and is the binary indicator, where is 1 if the class label c is the correct classification.
The basic neural network structure used in tunnel geology prediction had two hidden layers. There were 18 nodes in each hidden layer, the ReLU activation function was used in the normalization of each layer’s output, and the cross-entropy loss function was used to evaluate the loss values. The drilling parameters used in training the neural network model were the drilling speed, torque, rotation speed, propulsion, blow energy, blow number, water supply rate, water supply pressure, and EV energy data.
3.2. Deep Neural Network
A deep neural network can implement functions of higher complexity than a shallow neural network when the same number of resources is used [25]. The difference between a basic neural network and a deep neural network lies in the depth and complexity of the model. This complexity is attributed to the elaborate patterns of information flow throughout the model. Because of the complexity of the relationships between rock properties and drilling test data, the use of a deep neural network may enhance predictive accuracy. The deep neural network model used to train the drilling test data is shown in Figure 4. There were nine input parameters: drilling speed, torque, rotation speed, propulsion, blow energy, blow number, water supply rate, water supply pressure, and EV energy data. In the normalization layer, batch normalization was used to normalize the input data for each batch and to normalize the distribution of data so that the mean of the data would approximate 0 and the standard deviation of the data would approximate 1. This approach enables higher learning rates, and improves the generalization accuracy [26]. There were three fully connected hidden layers, with each weight connected to all the outputs of the previous layer. The information flow was as follows. First, in order to reduce overfitting, two fully connected hidden layers randomly drop out the processing units in each epoch, where one epoch is defined as one pass of the entire dataset through the neural network. Overfitting occurs when the prediction result corresponds too closely to a particular set of data and fails to fit additional data. Overfitting can be determined through comparison with the training accuracy and validation accuracy curve, as shown in Figure 5. If the gap between the training accuracy and the validation accuracy curve is large, then overfitting has occurred. The output layers used the SoftMax activation function [27] to output the predicted value.
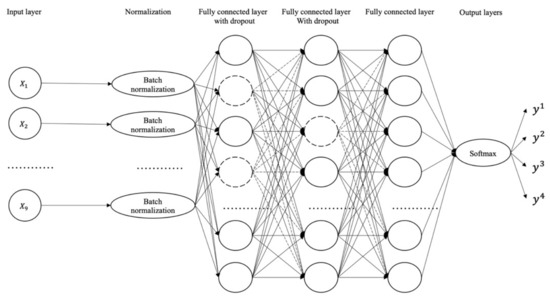
Figure 4.
Deep neural network model (: input data, : predicted probabilities of each value).
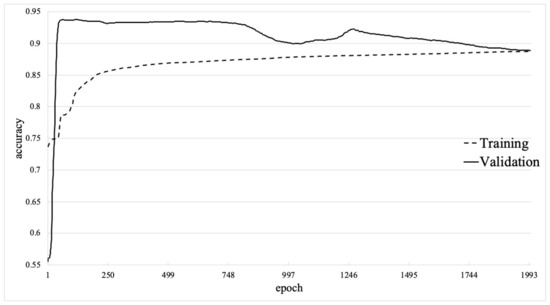
Figure 5.
Basic neural network learning curve.
In the fields of speech recognition, computer vision, and natural language processing, deep neural networks have already delivered significant improvements. This progress notwithstanding, deep neural networks often require years of experience to effectively choose optimal hyperparameters. The hyperparameters of the deep neural network, such as the number of hidden layer processing units, the choice of activation function for each hidden layer, and the loss function for the output value for geology prediction, are difficult to select empirically but which can be obtained using optimization algorithms.
3.3. GA for Hyperparameter Optimization
The search algorithms widely used in hyperparameter selection for deep neural networks are grid search and random search [28]. Grid search is widely used because it is quick to implement, and it explores the entire search space. However, grid search is computationally expensive and time-consuming, wasting resources exploring what could ultimately be unimportant dimensions of the hyperparameter space [29]. Random search is much more efficient in exploring the search space. A GA simulates the natural selection of Darwinian biological evolution and the genetic mechanism of the biological evolutionary process. This algorithm evolves optimized solution to the problem through selection, crossover, mutation, and reproduction (Figure 6). It offers the opportunity to both search the hyperparameter space in a random fashion and use the previous results to direct the search [29]. First, the GA randomly generates a population as the initial solution to the problem and evaluates the population fitness using the predefined deep neural network model (Figure 6). The fitness indicates the predictive accuracy of the validation data with respect to the actual geology. If the predictive accuracy does not meet the desired accuracy, then the selection, crossover, and mutation steps are processed. Selection is defined as the selection of certain individuals with higher fitness in the population. Crossover is defined as the random combination of certain hyperparameters of individuals to become new individuals. Mutation is defined as the changes in certain hyperparameter values of selected individuals. The hyperparameters and optimal options are listed in Table 1. The configuration of the GA analysis was as follows: 200 epochs for each deep neural network learning, 10 populations, 100 generations, and 10% of the drilling test data reserved for use in validation.
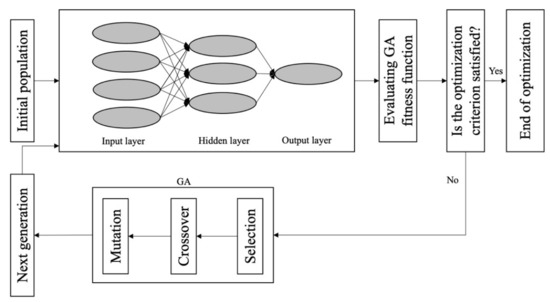
Figure 6.
Schematic of genetic algorithm (GA).

Table 1.
Optimization of hyperparameters.
4. Tunnel Geology Prediction Performance
4.1. Basic Neural Network
The training set accuracy curve and validation set accuracy curve of the basic neural network crossed at approximately 2000 epochs, at 88.7% accuracy. Figure 5 shows the learning curve of the basic neural network. Since no large gap was observed between the training accuracy and validation accuracy curves, no overfitting is interpreted as having occurred, making the neural network model quite effective for geology prediction.
4.2. Deep Neural Network with GA Optimization
The results of the deep neural network with optimized hyperparameter values show that the validation data reached a peak accuracy of 92% for 200 epochs of training. The optimized hyperparameter values provided by the GA are listed in Table 2. These hyperparameters were used in the deep neural network training with additional epochs.

Table 2.
GA optimization results.
Figure 7, which shows the learning curve for 5000 epochs of training, indicates that the validation data accuracy curve and training data accuracy curve cross at approximately 815 epochs. By stopping the deep neural network training at 815 epochs, overfitting problems can be avoided. Figure 8 shows the learning curve for 815 epochs. Since no large gap was noted between the training set accuracy and validation set accuracy, the neural network model was interpreted as effective and not overfitted. The training set accuracy was 92.69%, while the validation set accuracy was 93.25%. Compared with the basic neural network, the predictive accuracy of the training set was 3.99% higher, while that of the validation set was 4.55% higher. Moreover, the deep neural network reached that accuracy for 815 epochs of training which is approximately 2.5 times more efficient than the basic neural network.
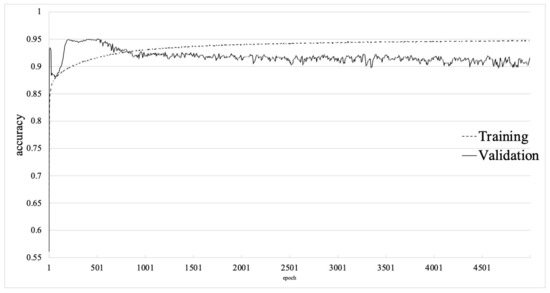
Figure 7.
Deep neural network learning curve for 5000 epochs.
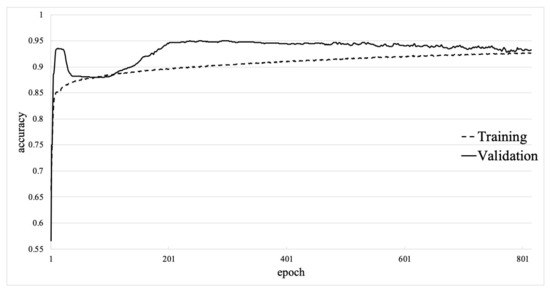
Figure 8.
Deep neural network learning curve for 815 epochs.
4.3. Neural Network Model Performance Comparison
The performances of the basic neural network and the deep neural network with GA optimization were compared based on their predictive accuracies and their receiver operating characteristic (ROC) curves. An ROC curve shows the performance of a prediction model at each threshold. Lowering of the threshold causes additional data to be marked as positive. The X-axis shows the false positive rate, while the Y-axis denotes the true positive rate; these are defined as follows:
With respect to the ROC curve, the area under the curve (AUC) serves as a general measure of predictive performance. The larger the area, the higher the model accuracy.
Figure 9 presents the average ROC curves for both the basic neural network and the deep neural network model. The AUC of the deep neural network is larger than the AUC of the basic neural network; this finding indicates that the deep neural network model offers greater accuracy than the basic neural network.
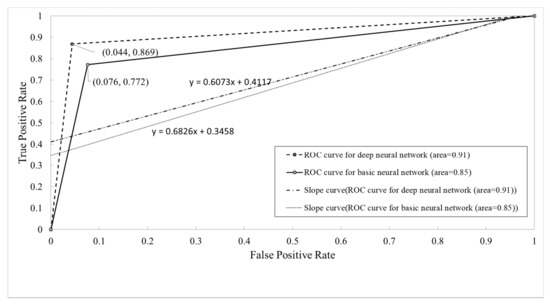
Figure 9.
Receiver operating characteristic (ROC) curves of the deep neural network and the basic neural network.
To analyze the performance of the neural network model for each rock type, a confusion matrix was constructed. A confusion matrix shows the number of correct and incorrect predictions for each rock type.
Figure 10 shows the confusion matrix for the training data. The diagonal elements represent the count of rock units whose types were perfectly predicted, while the off-diagonal elements indicate the counts of incorrectly predicted rock types. The deep neural network model performed better than the basic neural network for every rock type, and it showed higher accuracy overall. The basic neural network performed well in predicting label 2 (i.e., limestone; 92.23% accuracy) because numerous examples of limestone were encountered. The basic neural network performed poorly in predicting label 1 (i.e., fractured limestone; 47.13% accuracy), label 3 (i.e., clay; 47% accuracy), and label 4 (i.e., soft interlayer; 63.22% accuracy) because relatively little few samples were encountered for these rock types. The deep neural network confusion matrix exhibited higher predictive accuracy than the basic neural network for label 1 (67.69% accuracy), label 2 (98.67% accuracy), label 3 (99.48% accuracy), and label 4 (88.40% accuracy). In both neural network models, label 1 showed a relatively low predictive accuracy compared with the other rock types. The percentage of fractured limestone units incorrectly predicted as limestone was approximately 45.20% for the basic neural network and 32.04% the deep neural network. These high misidentification rates were likely due to fractured limestone and limestone ultimately represent the same rock compositional type under different structural conditions.
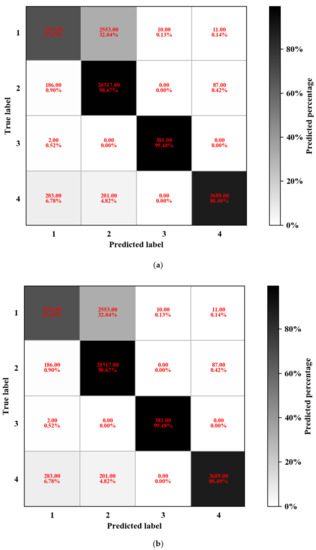
Figure 10.
Confusion matrices: (a) basic neural network confusion matrix (b) deep neural network confusion matrix.
5. Geology Prediction: Results from Borehole Testing Data
The trained basic and deep neural network models were used to predict geological conditions from 3611 data points of testing data obtained from a borehole into the tunnel face. The predictive accuracy of the basic neural network was 90.55%, while that of the deep neural network was 91.68%. Figure 11 shows a comparison of the predicted geological profile and the actual geological profile. The geological profiles predicted by the basic and deep neural networks both matched the actual geological profile quite well. The deep neural network model outperformed the basic neural network in predicting occurrences of clay and soft interlayers. For both neural network models, most of the incorrect predictions occurred at rock interfaces and weak interlayers. Some incorrect predictions occurred at interfaces between fractured limestone and non-fractured limestone units since fractured limestone and limestone ultimately represent the same rock compositional type under different structural conditions. The phenomenon is the same as that observed in the neural network training confusion matrix (Figure 10).
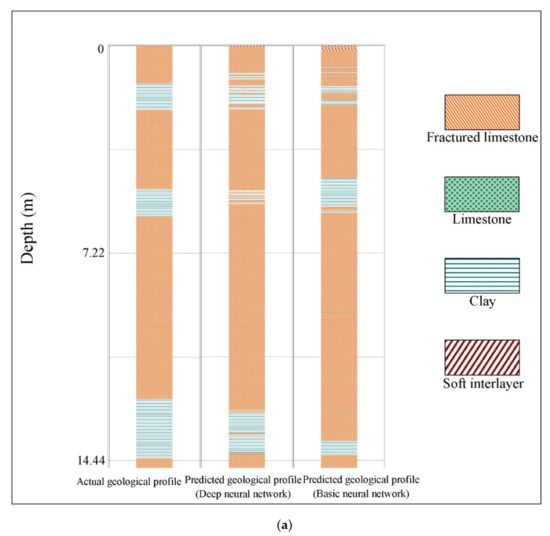
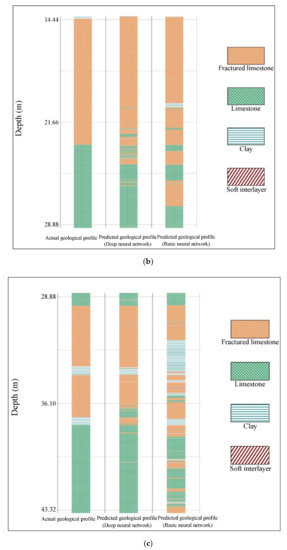
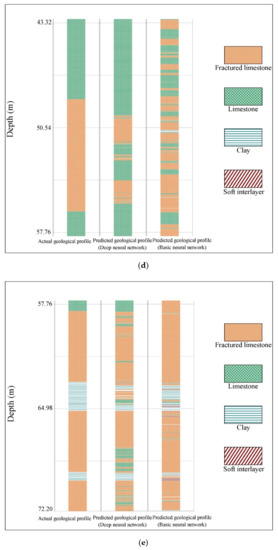
Figure 11.
Comparison of the neural network prediction results and the actual geological profile: (a) 0–14.44 m, (b) 14.44–28.88 m, (c) 28.88–43.32 m, (d) 43.32–57.76 m, (e) 57.76–72.20 m.
6. Feature Importance of Each Drilling Parameter
Although tunnel geology conditions were predicted well by the neural network model, we do not know which drilling parameters played relatively important roles. Many drilling parameters can be acquired by a drilling rig, and it can be difficult to find a quantitative model to effectively characterize rock properties when too many drilling parameters are used. If we can determine which drilling parameters play relatively important roles, then geology predictions can be achieved by a more concise and more easily applicable neural network model. To determine the most important drilling parameters for geological prediction, a permutation feature importance analysis was performed. Permutation feature importance is defined as the decrease in a model’s score when a single feature value is randomly shuffled [30]. The greater decrease in model accuracy, the more importance is attributed to the parameter.
Table 3 lists the feature importance of each drilling parameter. The water supply rate showed the greatest impacts on predictive accuracy, while the water supply pressure showed the third greatest impact. These results can be explained by the higher water flow required by the drilling rig when discontinuities or soft rock are drilled, due to the quantities of drill cuttings and/or water leakage into the discontinuities [11]. EV energy was the second most important factor impacting predictive accuracy, thus affirming the usefulness of drilling energy analysis methods for geology prediction [3,4,5,6]. Table 4 and Table 5 list the top ten features and their importance to permutate two-parameter and three-parameter groupings. These lists also indicate that water supply rate, EV energy, and water supply pressure substantially influenced predictive accuracy. Other drilling parameters, when combined with EV energy, water supply pressure, and water supply rate, also significantly influenced predictive accuracy.

Table 3.
Feature importance.

Table 4.
Top ten two-parameter combinations.

Table 5.
Top ten three-parameter combinations.
7. Conclusions
Basic and deep neural network methods for geology prediction based on instrumented drilling test data were presented, along with an application to a case study. Nine drilling parameters were used for neural network training: drilling speed, torque, rotation speed, propulsion, blow energy, blow number, water supply rate, water supply pressure, and EV energy. Batch normalization of drilling parameters and GA optimization of hyperparameters were employed in the deep neural network model.
A case study on Jiudingshan Tunnel showed that the neural network method predicted geological conditions well. Predictions matched the actual geological profile well, especially for frequently encountered rock types. On the other hand, the prediction was relatively poor for infrequently encountered rock types, as is typical for neural networks. Relatively low predictive accuracy also occurred at rock interfaces; such situations deserve further study. AUC and the confusion matrix evaluation showed that the deep neural network model displayed a higher accuracy than the basic neural network. Taking the number of epochs of training as a comparison, deep neural network was approximately 2.5 times more efficient than the basic neural network. If more data are available for training, the deep neural network will have more advantages in training efficiency and prediction accuracy. The feature importance of each drilling parameters was analyzed; the results indicate that a neural network model for geology prediction can perform well using fewer drilling parameters.
In general, the neural network approach to geology prediction can be regarded as a useful complement to traditional geology prediction methods used during tunnel construction, providing reliable results for dynamic tunnel design.
Author Contributions
Methodology, Y.F. and Z.W.; software, Y.F.; validation, Q.S., H.T.; resources, D.L.; writing—original draft preparation, Y.F.; writing—review and editing, Z.W.; supervision, Q.S.; All authors have read and agreed to the published version of the manuscript.
Funding
This research was funded by Traffic Science and Technology Project of Yunnan Province, China ([2018]18).
Data Availability Statement
The data presented in this study are available on request from the corresponding author. The data are not publicly available due to privacy.
Conflicts of Interest
The authors declare no conflict of interest.
References
- Yue, Z.Q.; Lee, C.F.; Law, K.T.; Tham, L.G. Automatic Monitoring of Rotary-Percussive Drilling for Ground Characterization—Illustrated by a Case Example in Hong Kong. Int. J. Rock Mech. Min. Sci. 2004, 41, 573–612. [Google Scholar] [CrossRef]
- Horner, P.C.; Sherrell, F.W. Application of Air-Flush Rotary-Percussion Techniques in Site Investigation. Am. J. Pathol. 1977, 10, 207–220. [Google Scholar] [CrossRef]
- Simon, R. Energy Balance in Rock Drilling. Soc. Pet. Eng. J. 1963, 3, 298–306. [Google Scholar] [CrossRef]
- Teale, R. The Concept of Specific Energy in Rock Drilling. Int. J. Rock Mech. Min. Sci. Geomech. Abstr. 1965, 2, 57–73. [Google Scholar] [CrossRef]
- Hoberock, L.L.; Bratcher, G.J. A New Approach for Determining In-Situ Rock Strength While Drilling. J. Energy Res. Technol. 1996, 118, 249–255. [Google Scholar] [CrossRef]
- Finfinger, G.L. A Methodology for Determining the Character of Mine Roof Rocks. Ph.D. Thesis, West Virginia University, Morgantown, WV, USA, 2003. [Google Scholar]
- Hamrick, T. Optimization of Operating Parameters for Minimum Mechanical Specific Energy in Drilling. Ph.D. Thesis, National Energy Technology Laboratory (NETL), Pittsburgh, PA, USA, Morgantown, WV, USA, 1 January 2011. [Google Scholar]
- Finfinger, G.L.; Peng, S.; Gu, Q.; Wilson, G.; Thomas, B. An Approach to Identifying Geological Properties from Roof Bolter Drilling Parameters. In Proceedings of the 19th International Conference on Ground Control in Mining, Morgantown, WV, USA, 8–10 August 2000; pp. 1–11. [Google Scholar]
- Schunnesson, H.; Schunnesson, R.Q.D. Predictions Based on Drill Performance Parameters. Tunn. Undergr. Space Technol. 1996, 11, 345–351. [Google Scholar] [CrossRef]
- Schunnesson, H. Rock Characterisation Using Percussive Drilling. Int. J. Rock Mech. Min. Sci. 1998, 35, 711–725. [Google Scholar] [CrossRef]
- Navarro, J.; Sanchidrián, J.A.; Segarra, P.; Castedo, R.; Costamagna, E.; López, L.M. Detection of Potential Overbreak Zones in Tunnel Blasting from MWD Data. Tunn. Undergr. Space Technol. 2018, 82, 504–516. [Google Scholar] [CrossRef]
- Yue, Q.Z.Q.; Lee, C.F.; Law, K.T.; Tham, L.G.; Sugawara, J. HKU Drilling Process Monitor and Its Applications to Slope Stabilization. In Proceedings of the Annual Conference—Works Bureau and Ministry of Construction on the Development and Co-operation of the Construction Industry of the Mainland and Hong Kong, Kunming, China, 20–21 September 2001; pp. II35–II46. [Google Scholar]
- Yue, Q.Z.Q.; Guo, J.; Tham, L.G.; Lee, C.F. Application of HKU DPM in Automation of Geotechnical Design and Construction. In Proceedings of the 2003 Chinese national congress on Geo Engineering, Beijing, China, 22–25 October 2003; pp. 147–155. [Google Scholar]
- Qin, M.; Wang, K.; Pan, K.; Sun, T.; Liu, Z. Analysis of Signal Characteristics from Rock Drilling Based on Vibration and Acoustic Sensor Approaches. Appl. Acoust. 2018, 140, 275–282. [Google Scholar] [CrossRef]
- Lv, X.; Zhou, H.; Xu, L. Study on the Quantitative Relationship between Soil in Situ Strength and Drilling Parameters. Environ. Earth Sci. 2018, 77, 469.1–469.13. [Google Scholar] [CrossRef]
- Lv, X.; Zhang, S.; Zhou, H. Experimental Study on Manufactured Sand-Soil Bearing Capacity WT-BC Model Based on Mechanical Response of Rotary Penetration. Adv. Mater. Sci. Eng. 2019, 2019. [Google Scholar] [CrossRef]
- LaBelle, D.; Bares, J.; Nourbakhsh, I. Material Classification by Drilling. In Proceedings of the 17th International Symposium on Automation and Robotics in Construction. (International Association for Automation and Robotics in Construction), Taipei, Taiwan, 18–20 September 2000; Citeseer: State College, PA, USA, 2000; Volume 10. [Google Scholar]
- Asadi, A. Application of Artificial Neural Networks in Prediction of Uniaxial Compressive Strength of Rocks Using Well Logs and Drilling Data. Proced. Eng. 2017, 191, 279–286. [Google Scholar] [CrossRef]
- Vezhapparambu, V.S.; Eidsvik, J.; Ellefmo, S.L. Rock Classification Using Multivariate Analysis of Measurement While Drilling Data: Towards a Better Sampling Strategy. Minerals 2018, 8, 384. [Google Scholar] [CrossRef]
- Klyuchnikov, N.; Zaytsev, A.; Gruzdev, A.; Ovchinnikov, G.; Antipova, K.; Ismailova, L.; Muravleva, E.; Burnaev, E.; Semenikhin, A.; Cherepanov, A. Data-Driven Model for the Identification of the Rock Type at a Drilling Bit. J. Pet. Sci. Eng. 2019, 178, 506–516. [Google Scholar] [CrossRef]
- Romanenkova, E.; Zaytsev, A.; Klyuchnikov, N.; Gruzdev, A.; Koroteev, D.; Ismailova, L.; Burnaev, E.; Semenikhin, A.; Koryabkin, V.; Simon, I. Real-Time Data-Driven Detection of the Rock-Type Alteration During a Directional Drilling. IEEE Geosci. Remote Sens. Lett. 2019. [Google Scholar] [CrossRef]
- Gurina, E.; Klyuchnikov, N.; Zaytsev, A.; Romanenkova, E.; Antipova, K.; Simon, I.; Makarov, V.; Koroteev, D. Application of Machine Learning to Accidents Detection at Directional Drilling. J. Pet. Sci. Eng. 2020, 184, 106519. [Google Scholar] [CrossRef]
- Zhou, H.; Hatherly, P.; Ramos, F.; Nettleton, E. An Adaptive Data Driven Model for Characterizing Rock Properties from Drilling Data. In Proceedings of the 2011 IEEE International Conference on Robotics and Automation, Shanghai, China, 9–13 May 2011; pp. 1909–1915. [Google Scholar] [CrossRef]
- Zhou, H.; Hatherly, P.; Monteiro, S.T.; Ramos, F.; Oppolzer, F.; Nettleton, E. A Hybrid GP Regression and Clustering Approach for Characterizing Rock Properties from Drilling Data; ACFR-TR-2011-001; The University of Sydney: Camperdown, Australia, 2011; pp. 1–11. [Google Scholar]
- Bianchini, M.; Scarselli, F. On the Complexity of Neural Network Classifiers: A Comparison between Shallow and Deep Architectures. IEEE Trans. Neural Netw. Learn. Syst. 2014, 25, 1553–1565. [Google Scholar] [CrossRef]
- Ioffe, S.; Szegedy, C. Batch Normalization: Accelerating Deep Network Training by Reducing Internal Covariate Shift. arXiv 2015, arXiv:1502.03167. [Google Scholar]
- Oshea, T.; Hoydis, J. An Introduction to Deep Learning for the Physical Layer. IEEE Trans. Cognitive Commun. Netw. 2017, 3, 563–575. [Google Scholar] [CrossRef]
- Bergstra, J.; Bengio, Y. Random Search for Hyper-Parameter Optimization. J. Mach. Learn. Res. 2012, 13, 281–305. [Google Scholar]
- Young, S.R.; Rose, D.C.; Karnowski, T.P.; Lim, S.-H.; Patton, R.M. Optimizing Deep Learning Hyper-Parameters through an Evolutionary Algorithm. In Proceedings of the Workshop on Machine Learning in High-Performance Computing Environments, Austin, TX, USA, 15 November 2015; pp. 1–5. [Google Scholar]
- Breiman, L. Random Forests. Mach. Learn. 2001, 45, 5–32. [Google Scholar] [CrossRef]
Publisher’s Note: MDPI stays neutral with regard to jurisdictional claims in published maps and institutional affiliations. |
© 2020 by the authors. Licensee MDPI, Basel, Switzerland. This article is an open access article distributed under the terms and conditions of the Creative Commons Attribution (CC BY) license (http://creativecommons.org/licenses/by/4.0/).