Article

GMM-Based Evaluation of Synthetic Speech Quality Using 2D Classification in Pleasure-Arousal Scale †

by
Jiří Přibil
1,2,*,
Anna Přibilová
1 and
Jindřich Matoušek
2
1
Institute of Measurement Science, Slovak Academy of Sciences, 841 04 Bratislava, Slovakia
2
Faculty of Applied Sciences, UWB, 306 14 Pilsen, Czech Republic
*
Author to whom correspondence should be addressed.
This paper is an extended version of our paper published on the occasion of the 43rd International Conference on Telecommunications and Signal Processing (TSP2020), Milan, Italy, 7–9 July 2020.
Appl. Sci. 2021, 11(1), 2; https://doi.org/10.3390/app11010002
Submission received: 29 November 2020 / Revised: 17 December 2020 / Accepted: 18 December 2020 / Published: 22 December 2020

Abstract

:
The paper focuses on the description of a system for the automatic evaluation of synthetic speech quality based on the Gaussian mixture model (GMM) classifier. The speech material originating from a real speaker is compared with synthesized material to determine similarities or differences between them. The final evaluation order is determined by distances in the Pleasure-Arousal (P-A) space between the original and synthetic speech using different synthesis and/or prosody manipulation methods implemented in the Czech text-to-speech system. The GMM models for continual 2D detection of P-A classes are trained using the sound/speech material from the databases without any relation to the original speech or the synthesized sentences. Preliminary and auxiliary analyses show a substantial influence of the number of mixtures, the number and type of the speech features used the size of the processed speech material, as well as the type of the database used for the creation of the GMMs on the P-A classification process and on the final evaluation result. The main evaluation experiments confirm the functionality of the system developed. The objective evaluation results obtained are principally correlated with the subjective ratings of human evaluators; however, partial differences were indicated, so a subsequent detailed investigation must be performed.

1. Introduction

At present, many different subjective and objective methods and criteria for quality evaluation of synthetic speech produced by text-to-speech (TTS) systems are used. For the subjective assessment of synthesis quality, listening tests are generally acknowledged. The conventional listening tests usually involve a comparison category rating on a scale from “much better” to “much worse” than high-quality reference speech [1]. Perceptual characteristics may be divided into five basic dimensions—(1) naturalness of voice, and its pleasantness, (2) prosodic quality including accentuation, rhythm, and intonation, (3) fluency and intelligibility, (4) absence of disturbances, (5) calmness—with the first three being the best for capturing the integral quality [2]. Apart from the naturalness and understandability of contents, listening tests can also measure the distinguishability of characters or the degree of entertainment [3]. The subjective scales for rating the synthesized speech may include only a few scored parameters, such as an overall impression by a mean opinion score (MOS) describing the perceived speech quality from poor to excellent, a valence from negative to positive, and an arousal from unexcited to excited [4]. The MOS scale can be used not only for naturalness, but for different dimensions, such as affect (from negative to positive) or speaking style (from irritated to calm) as well [5]. The comparison of a pair of utterances synthesized by different methods or originating from different speech inventories is often carried out by a preference listening test [6]. For objective speech quality estimation of the TTS voice, various speech features extracted from the natural and synthetic speech are evaluated. In [7] the mel frequency cepstral coefficients (MFCC) and the modified group delay function were used as a dynamic time warping (DTW)-based fusion of magnitude and phase features. The DTW alignment of reference and synthesized spectral sequences was also carried out in combination with the average spectral distortion [8]. In addition to the MFCC distance, pitch frequency (F0) related features can be used to compare a reference natural signal with a copy-synthesis: voicing accuracy, a gross pitch error, and a fine pitch error [9]. The synthetic speech quality may be predicted by a mix of several prosodic properties (slope of F0, F0 range, jitter, shimmer, vocalic durations, intervocalic durations) and articulation-associated properties (discrete-cosine-transform coefficients of the mel-cepstrum, their delta, and delta-delta values) [2].
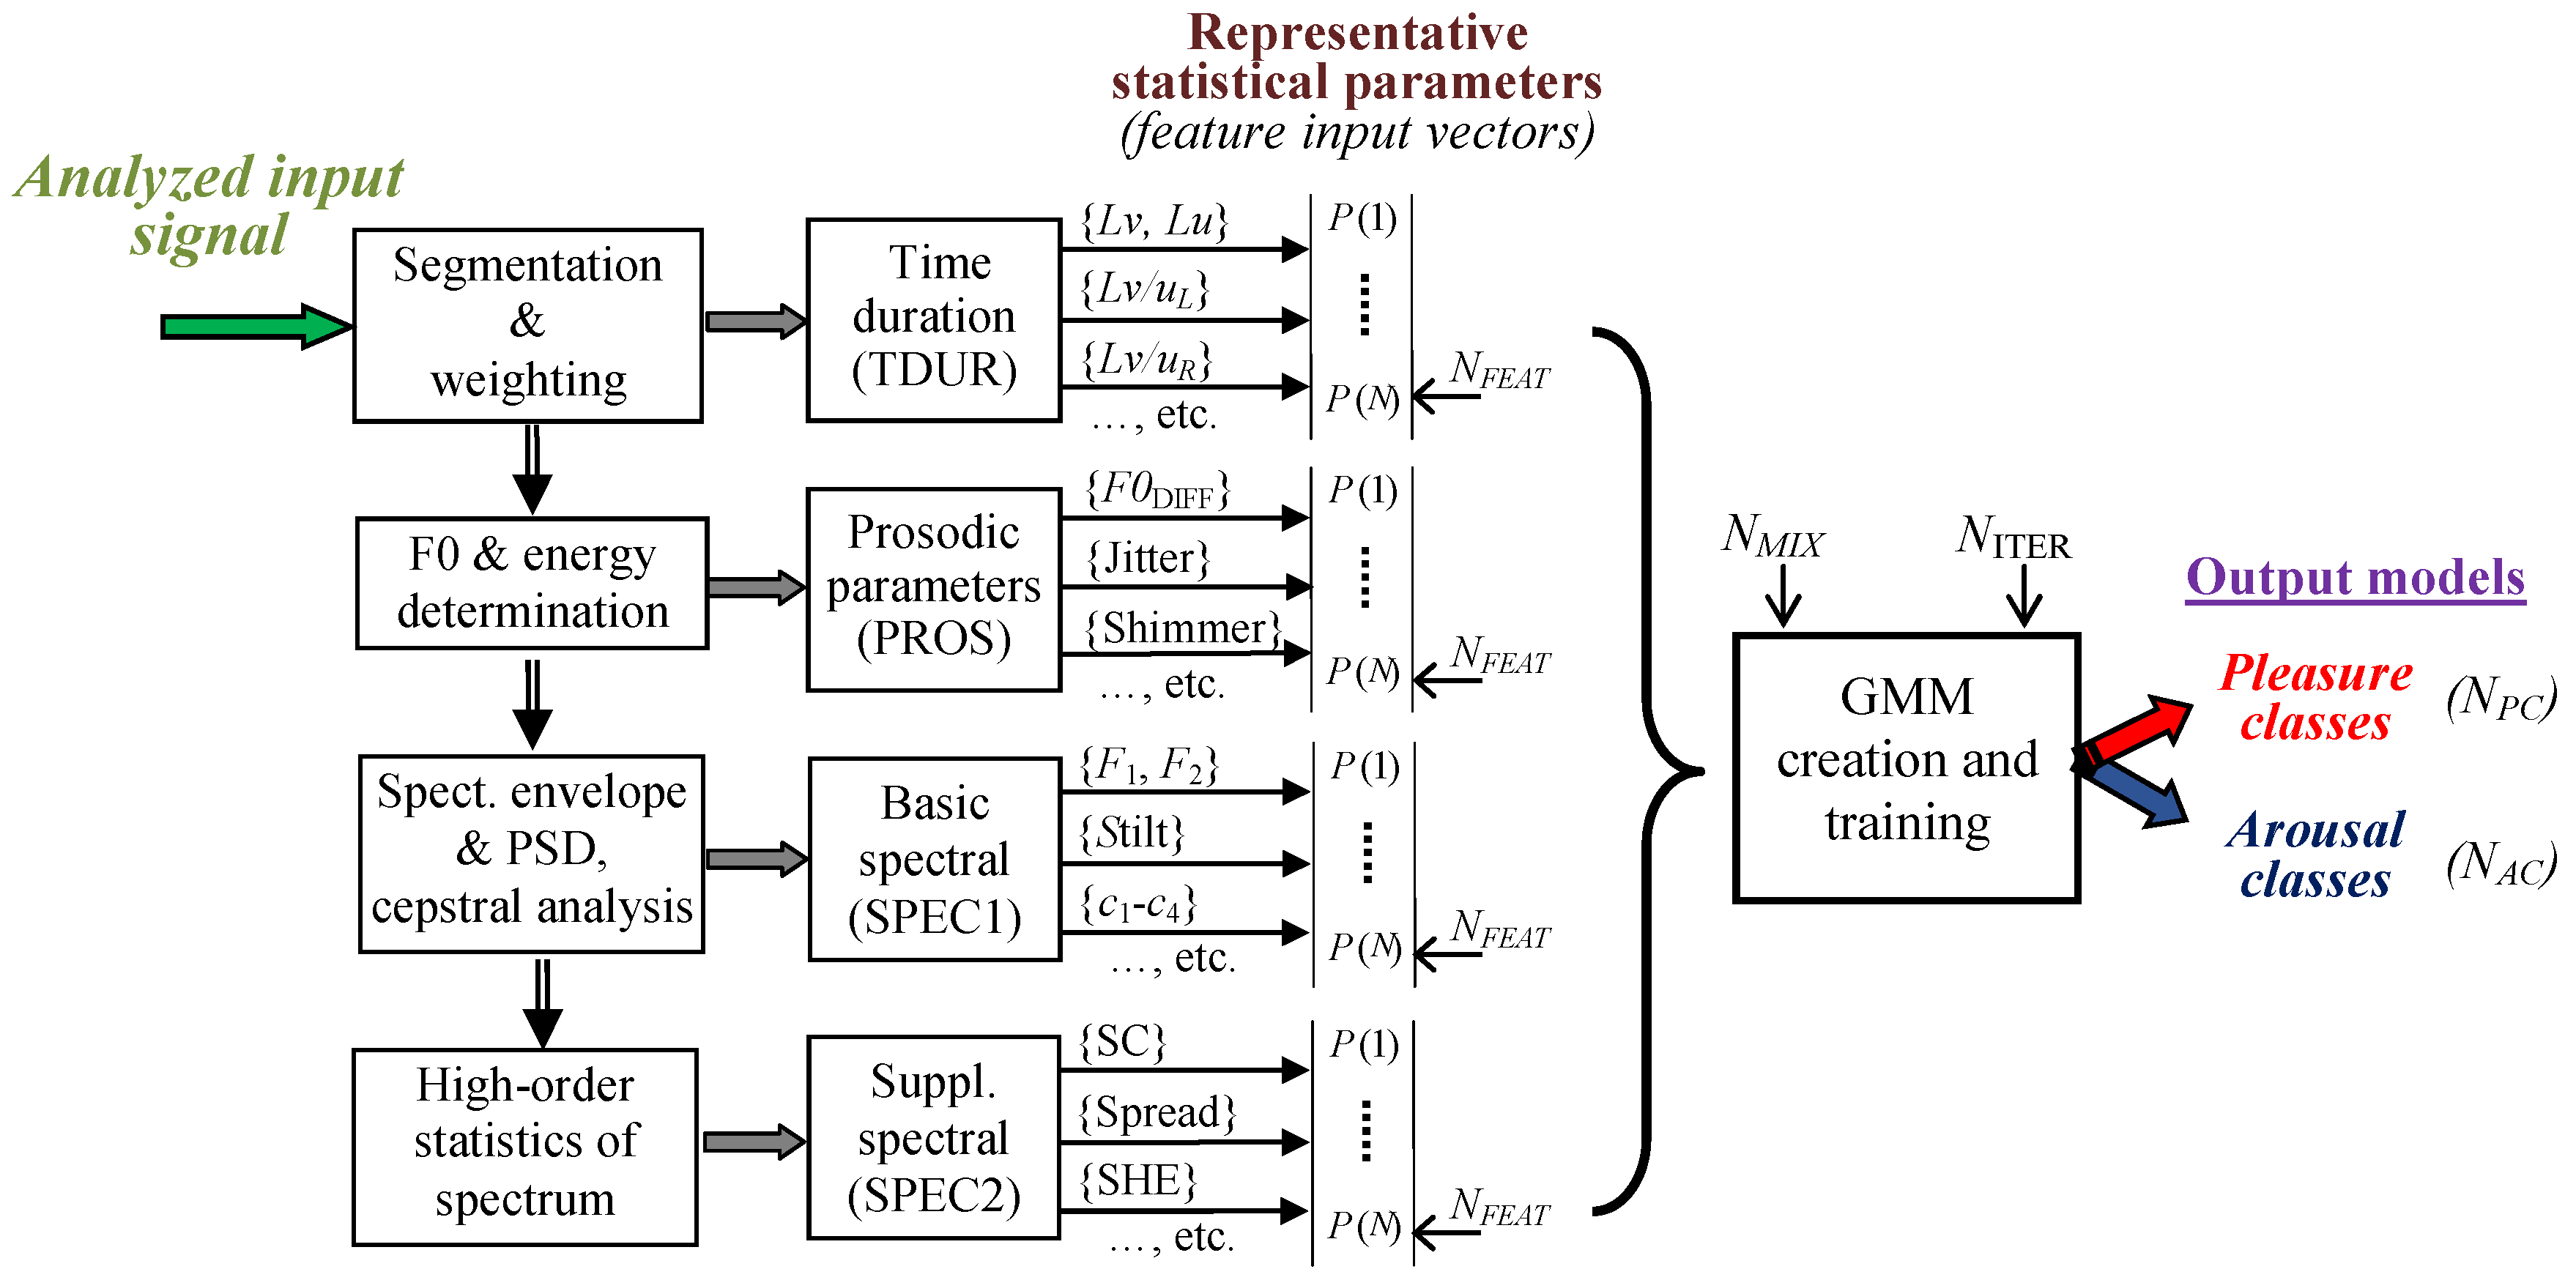
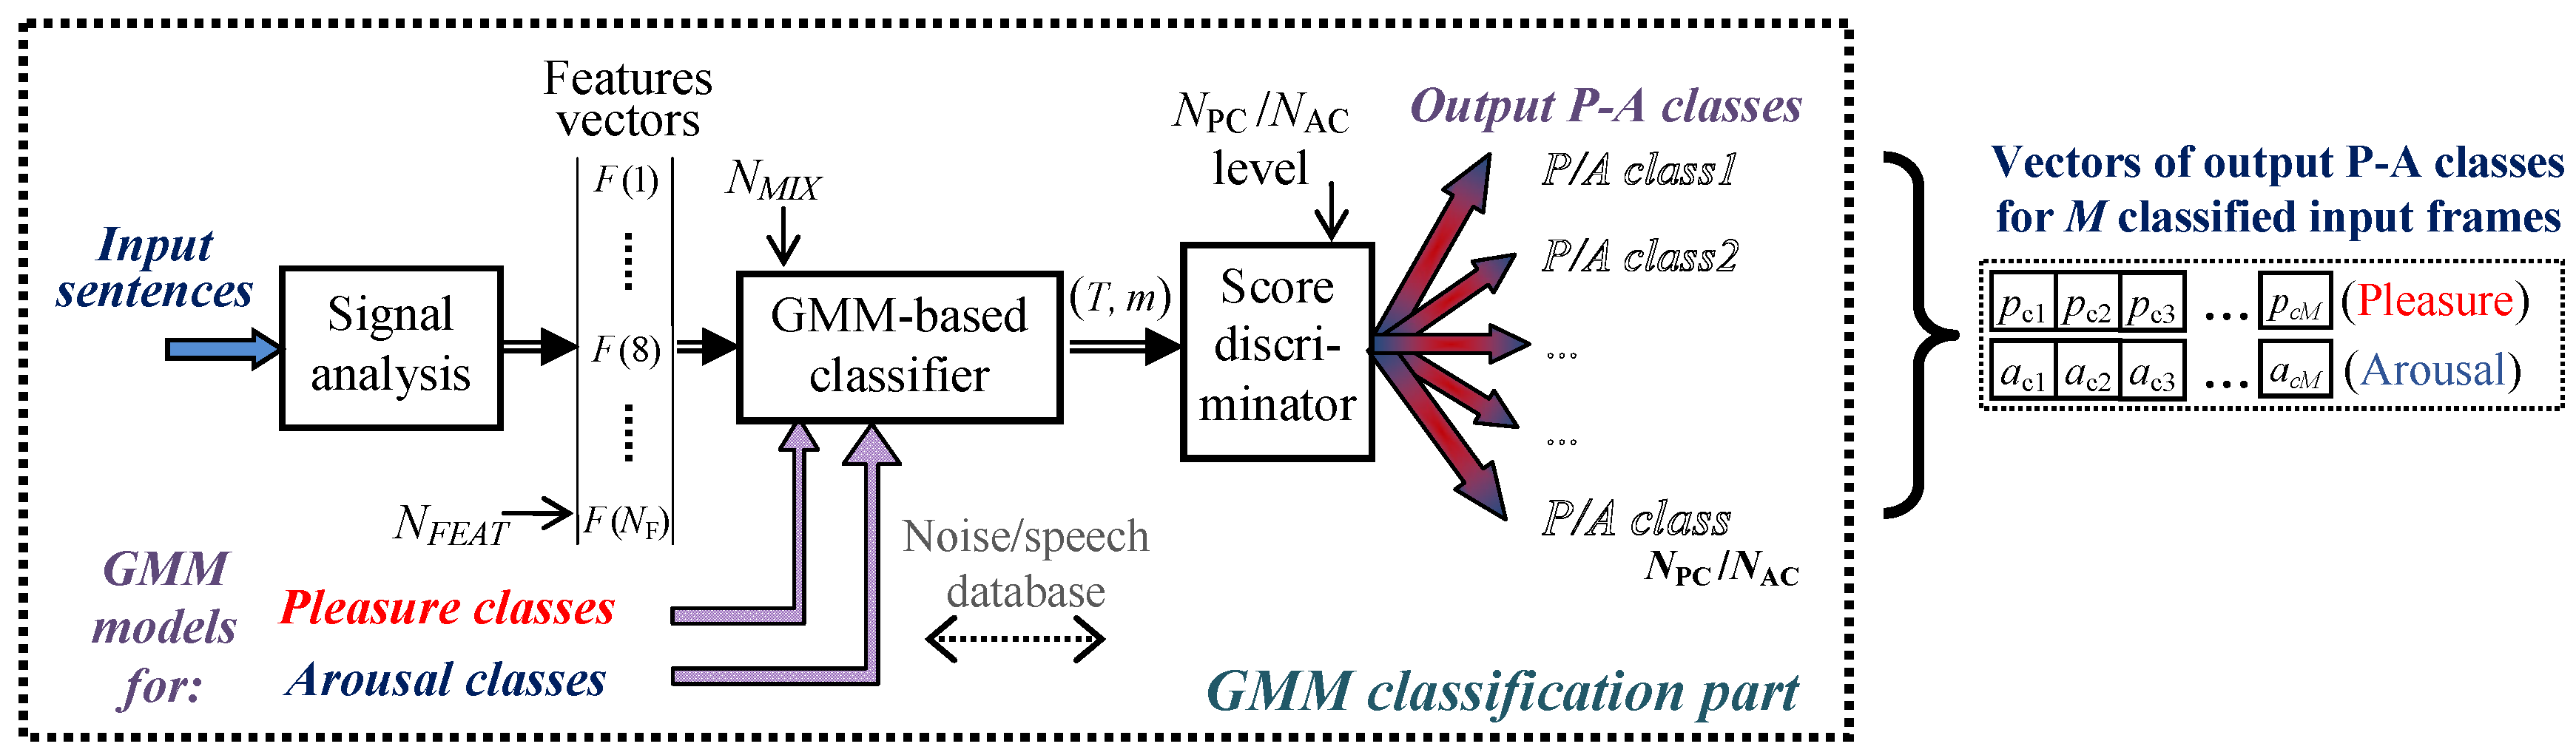
Our current research focuses on the development of an automatic system for the quality evaluation of synthetic speech in the Czech language using different synthesis methods. It was motivated by our assumption of the successful application of a 2D emotional model with a Pleasure-Arousal (P-A) scale [10] for automatic evaluation of synthetic speech quality based on the Gaussian mixture model (GMM) classification. In such a manner, the subjectivity of human assessment and considerable time consumption during the standard listening tests can be eliminated. The proposed system is based on the principle of determination of similarities/differences between the original sentences uttered by a speaker and the sentences synthesized using the speech material of the same speaker. The final evaluation result based on Euclidean distances in the P-A space expresses the order of synthesis proximity between different speech syntheses and the original speech. The audio material used for the GMM creation and training originated from the sound/speech databases that were directly labeled in the P-A scale so that the subsequent GMM classification process yielded a combination of Pleasure and Arousal classes corresponding to the speech stimuli tested.
Within the framework of the work presented, two basic evaluation experiments with the Czech speech synthesizer of male and female voices were performed. The first was aimed at the evaluation of sentences generated by the TTS system using two methods of prosody manipulation—a rule-based method and a modification reflecting the final syllable status [11]. The second compared the differences between the tested sentences produced by the TTS system using three different synthesis methods (standard and deep learning [12,13]) in combination with rule-based prosody generation.
In the first of these experiments, only the corpus-based unit selection (USEL) speech synthesis method [14,15] was evaluated. Different approaches to prosody modification bring about differences in time duration, phrasing, and time structuring within the synthetic sentences analyzed. Therefore, special types of speech features must be used to enable the detection of these differences in utterance speed, phrase creation, and prosody production by changes in the time domain instead of the standard spectral features. These special supra-segmental features were derived from time durations of voiced and unvoiced parts and were included in the feature set used in this first automatic evaluation experiments. The objective evaluation results of the first experiment were compared with the subjective ratings of human evaluators using the standard listening test.
In the second basic evaluation experiment, the three tested types of speech synthesis were the following: (1) the basic USEL synthesis, (2) the synthesis using a deep neural network (DNN) with a long short-term memory (LSTM) and a conventional WORLD vocoder [16], (3) the synthesis using a recurrent neural network with the LSTM and a WaveRNN [17] vocoder. The speech synthesized by the methods using the neural networks is typologically different from that produced by the USEL synthesizer. The USEL artifacts can be found mainly at the points of concatenation of speech units [18], while the neural network synthesis is characterized by problems manifesting perceptually as a certain type of acoustic noise. Thus, the automatic evaluation system developed must satisfy the requirements for the comparison of speech synthesis approaches with essentially different acoustic realizations. In this experiment, the objective results were compared with the subjective ones based on the subjective assessment called MUltiple Stimuli with Hidden Reference and Anchor (MUSHRA) listening test [19] for the comparison of speech stimuli using hidden original speech, as well as anchors with different impairments.
An auxiliary analysis was carried out to reveal a possible influence of the number of mixture components, the number of synthetic sentences tested, the types of speech features, the types of audio databases for GMM creation, and the dispersion of positions of original utterances in the P-A space on the partial results of the continual GMM P-A classification, as well as on the stability and the accuracy of the final evaluation results. In addition, the influence of the number of mixtures used for GMM creation and training together with 2D classification in the P-A space on the computational complexity (CPU processing time) was investigated. The experiments realized confirm the suitability of the method for this type of task as well as the principal functionality of the system developed.

2. Description of the Proposed Method

2.1. Emotion Evaluation and Distribution in the Pleasure-Arousal Space

Acoustic stimuli, such as noise, speech, or music induce specific emotional states in listeners. These emotions may be classified from a discrete or a dimensional perspective [20]. In the discrete model, six basic emotions are usually recognized: joy, sadness, surprise, fear, anger, and disgust [21]. The dimensional model represents all possible emotions on a two-dimensional or three-dimensional scale. The first dimension is Pleasure ranging from negative to positive feelings, the second dimension is Arousal referring to alertness and activity with the range from calm to excited states, and the third dimension is Dominance describing emotional states from being controlled to controlling [22]. For the discrete emotions mapped in the space of first two dimensions, the negative emotions of anger and sadness correspond to low Pleasure, positive emotions such as surprise and joy, have high Pleasure, passive apathetic emotions are characterized by the lowest Arousal, and frantic excitement corresponds to the highest Arousal [23].
Using these first two dimensions, the 2D diagram in a Pleasure-Arousal (P-A) space [24] is divided into four emotion quadrants (EQ1EQ4) that can be categorized as EQ1 = pleasant with high intensity of feeling, EQ2 = unpleasant with high intensity; EQ3 = unpleasant with low intensity; EQ4 = pleasant with low intensity. In relation to pleasantness and feeling intensity, the basic importance weights for each of the emotion quadrants were defined as documented in Figure 1. This approach is used in further analysis for the determination of the final evaluation decision.

2.2. Creation of Gaussian Mixture Models for Pleasure-Arousal Classes

The proposed evaluation method is based on the determination and statistical analysis of distances between originals (from a speaker) and the tested synthetic speech in the P-A space with the help of the GMM classifier. The data investigated are approximated by a linear combination of Gaussian probability density functions [25]. They are used to calculate the covariance matrix as well as the vectors of means and weights. Next, the clustering operation is performed to organize objects into groups whose members are similar in some way. Two basic algorithms may be used in this clustering process:
(i)
k-means clustering—dividing the objects into k clusters so that some metric relative to the centroids of the clusters is minimized,
(ii)
spectral clustering—finding data points as nodes of a connected graph and partitioning this graph into sub-graph clusters based on their spectral decomposition [26].
In practice, for initialization of the GMM model parameters the k-means algorithm determining the centers is usually used—this procedure is repeated several times until a minimum deviation of the input data sorted in k clusters S = {S1,S2, …, Sk} is found. Subsequently, the iteration algorithm of expectation-maximization is used to determine the maximum likelihood of the GMM. The number of mixtures (NMIX) and the number of iterations (NITER) have an influence on the execution of the training algorithm—mainly on the time duration of this process and on the accuracy of the output GMMs obtained.
The preparation as well as evaluation phases begin with the analysis of the input sentences yielding various speech/sound properties. Four types of signal features are determined in the proposed system: time duration, prosodic, basic spectral and supplementary spectral parameters. The analyzed signal is processed in overlapping segments. The determined pitch (F0) contour can be divided into N voiced parts and N + 1 unvoiced parts of various durations to obtain different types of time duration (TDUR) features [27]. Apart from the TDUR features, the contours of F0 and signal energy are used to determine standard prosodic (PROS) parameters. Other types of signal features are spectral features (SPEC1), computed using the spectral and cepstral analysis of each input frame, and spectral high-level statistical parameters (SPEC2). The representative statistical values (median, range, standard deviation—std, relative maximum and minimum, etc.) of these features compose the input vector of NFEAT features for GMM processing. The speech and non-speech sounds are used for the creation and training of the output GMM models specified by the number of Pleasure classes NPC and Arousal classes NAC—see the block diagram in Figure 2.
During the classification process, the input vectors from the analyzed sentence are passed to the GMM classifier block to obtain the scores (T, m) that are subsequently quantized to discrete levels corresponding to NPC/NAC output P-A classes. This approach is carried out for each of M frames of the analyzed sentence to obtain output vectors of winner P-A classes—see the block diagram in Figure 3.

2.3. Description of the Proposed Automatic Evaluation System

The functional structure of the proposed automatic system can be divided into the preparation and the main evaluation parts. Within the preparation part, the following two operations are preformed:
(1)
Creation and training of GMM models [25] of NPC Pleasure classes and NAC Arousal classes using the material from the speech and sound databases.
(2)
These GMM models are used in the preliminary classification process to determine the individual coordinates [Pco(k), Aco(k)] of the original sentences in the P-A space and the resulting 2D center position [CPO, CAO] as:
[ C PO , C AO ] = [ 1 k k = 1 K Pco ( k ) , 1 k k = 1 K Aco ( k ) ] ,
where 1 ≤ kK and K is the total number of the processed original sentences.
The main evaluation part consists of the GMM classification operations applied on the synthetic speech sentences produced by different synthesis methods Synt1, Synt2, Synt3 … etc. Output values representing their actual position in the P-A space are subsequently processed to obtain the final evaluation order (FEO) decision as shown in the block diagram in Figure 4. The whole evaluation process can be described by the following five operations:
(1)
GMM-based classification of analyzed sentences to obtain their actual positions in the P-A space coordinates [Pc(n), Ac(n)] for all N analyzed sentences in relation to the center [CPO, CAO]—see a visualization in an example in Figure 5a.
(2)
Calculation of relative coordinates [P’c(n), A’c(n)] = [Pc(n)–CPO, Ac(n)–CAO] with respect to the center of originals [CPO, CAO]—see an example in Figure 5b.
(3)
Calculation of the final normalized sum vector (FV) using the coordinates [P’c(n), A’c(n)]: the FV begins in the center [0, 0] and ends at the point [FVPN, FVAN] given by:
[ F V PN , F V AN ] = [ n = 1 N P c ( n ) / N , n = 1 N A c ( n ) / N ] ,
where N is the total number of the processed synthetic sentences. The FV vector can be also expressed in the polar coordinates by its magnitude (MFV) and angle (ϕFV) in degrees:
M FV = ( F V PN ) 2 + ( F V AN ) 2 , ϕ FV = ( Arctg ( F V AN / F V PN ) / π ) 180
The FV obtained is subsequently localized inside four emotional quadrants EQ1EQ4 around the center of originals (see Figure 5c) with a corresponding emotional meaning in relation to the 2D emotional space (compare with the diagram in Figure 1).
(4)
Determination of the summary distribution parameters (SDP) from the FV magnitude and angle for all NTST tested synthesis types as:
SDP ( i ) = M FV ( i ) * I W EQ 1 4 ( ϕ FV ( i ) )           1 i N TST ,
where IWEQ1–4 are the importance weight functions depending on the quadrants EQ1–4 determined from the FV angle values (see Figure 1):
EQ 1 4 = { EQ 1 : EQ 2 : EQ 3 : EQ 4 : 0 < ϕ FV 90 90 < ϕ FV 180 180 < ϕ FV 270 270 < ϕ FV 360 [ deg ] [ deg ] [ deg ] [ deg ]
In all quadrants, the transformation functions IWEQ1–4 are defined by the weights corresponding to the angles of the quadrant center and of the quadrant borders. The complete transformation functions IWEQ1–4 are calculated using the linear interpolation in the angle steps of one degree.
(5)
Determination of the final evaluation decision is based on the sorted sequence SOTST(i) with ascending SDP values for NTST tested synthesis types. To determine possible similarities in the evaluated synthesis types, the differences Dso between the sorted SOTST values are calculated. Small Dso values below the threshold Dthresh indicate the “similarity” result. The final evaluation order of three types of the synthesis method tested is then determined as:
F E O = { 1 1 / 2 2 2 / 3 3 D s o 1 2 D THRESH D s o 1 2 < D THRESH D s o 1 2 D THRESH , D s o 2 3 D THRESH D s o 2 3 < D THRESH D s o 2 3 D THRESH ,
where Dso X-Y represents the difference between the Xth and the Yth rank in the order of sorted SOTST values.
The Dso can theoretically reach up to 200% for SOTST values in quadrants EQ1/EQ2 with opposite importance weighs 1/−1 (see Figure 1). The first rank (“1”) denotes the maximum proximity of the tested synthesis to the original and the last rank (“3”—for NTST = 3) represents the maximum difference between the synthesis and the original. The similarities between two or more following ranks are denoted as “1/2”, “2/3” … etc. A possible notation of the obtained final result can be written as FEO(Synt1, Synt2, Synt3) = {“2”, ”1”, ”3”} for well differentiated SOTST values or FEO(Synt1, Synt2, Synt3) = {“1/2”, “1/2”, ”3”} for detected similarity between the first and the second evaluated synthesis types. In the first case, Synt2 is the best, Synt3 is the worst. The second example result means that Synt1 and Synt2 are similar, and Synt3 is the worst. The visualization of sum vectors processing to obtain the FEO decision for two types of synthesis is shown in Figure 6.

3. Experiments

3.1. Material Used, Initial Settings, and Conditions

To evaluate synthetic speech quality by continual classification in the P-A scale, we collected the first speech corpus (SC1) consisting of three parts: the original speech uttered by real speakers, and two variations of speech synthesis produced by the Czech TTS system using the USEL method [16] with voices based on the original speaker. Two methods of prosody manipulation were applied: the rule-based method (assigned as TTSA) and the modified version reflecting the final syllable status (as TTSB) [11]. The natural as well as the synthetic speech originates from four professional speakers—two males (M1, M2) and two females (F1, F2). Declarative sentences were used for each of four original speakers (50 + 50/50 + 50; it means 200 in total). As regards the synthesis, we used 2 × 50/40 (for M1/M2) and 2 × 40/40 (for F1/F2) sentences of two synthesis types from each of the four voices—340 in total for all the voices. The speech signals were sampled at 16 kHz and their duration ranged from 2.5 to 5 s.
The second collected speech corpus (SC2) consists of four parts: the natural speech uttered by the original speakers and three variations of speech synthesis: the USEL based TTS system (assigned to Synt1) and two LSTM based systems with different vocoders: conventional WORLD (further referred to as Synt2) [16], WaveRNN (referred to as Synt3) [17]. As in the case of SC1, the original and synthetic speech originated from the speakers M1, M2, and F1, F2. This means, that 200 original sentences and 600 synthetic ones (200 for each of the synthesis types) were used in this work. The processed synthetic speech signals with the duration from 2 to 12 s were resampled at 16 kHz. The detailed description of the speech material used is provided in Table 1.
To create and train the GMM models of the Pleasure/Arousal classes, two separate databases were used. The first was the International Affective Digitized Sounds (IADS-2) [28] database (further referred to as DB1). It consists of 167 sound and noise records produced by humans, animals, simple instruments, the industrial environment, weather, music, etc. Every sound was repeatedly evaluated by listeners, so the database contains the mean values of Pleasure and Arousal parameters within the range of <1 ~ 9>. All the records of sounds used with the duration of 6 s were resampled at 16 kHz to comply with the tested as well as original speech signals. In this case, the GMM models are common for male and female voices. The second database used was the MSP-IMPROV audiovisual database [29] in the English language (further referred to as DB2). From this database, we used only declarative sentences in four emotional states (angry, sad, neutral, and happy) uttered by three male and three female speakers. Finally, 2 × 240 sentences (separately for male and female voices) with duration from 0.5 to 6.5 s were used. For compatibility with the DB1, all of the applied speech signals were resampled at 16 kHz and the mean P-A values were recalculated to fit the range <1 ~ 9> of the DB1. These two databases were used because they contain all the records with evaluation results on the P-A scale and were freely accessible without any fee or other restrictions.
The speech/sound signal analyzed is processed by a pitch-asynchronous method per frame with one half overlapping. The frame length of 24/20 ms was used for male/female voices according to F0 values of the current speaker—see the second column in Table 1. For the calculation of spectral and cepstral properties, the number of fast Fourier transform (FFT) points was set to NFFT = 1024. A detailed list of the speech features used grouped by type is shown in Table 2.
From these four types of features, four feature sets P0, P2, P4, and P42 were constructed for application in the GMM building part, as well as for classification in the main evaluation process. In correspondence with [10], all input feature vectors consisted of NFEAT = 16 representative statistical parameters of speech features—see Table 3.
The number of P-A classes was reduced to NPC = 7 and NAC = 5 so that the data of both tested databases were approximately evenly distributed. The similarity threshold Dthresh for FEO determination was empirically set to 5%. The values of importance weights together with the angles of the central and border definition points for functions IWEQ1-4 are shown in Table 4. Finally, the transformation curves were constructed using linear interpolation, as demonstrated graphically in Figure 7.
In the GMM-based creation, training and classification process, a diagonal covariance matrix was selected due to its lower computational complexity. These program procedures were realized with the help of the “Netlab” pattern analysis toolbox [30] and the whole proposed automatic evaluation system was implemented in the Matlab computing system (ver. 2016b). The computational complexity was investigated using the UltraBook Lenovo Yoga consisting of an Intel(R) Intel i5-4200U processor operating at 2.30 GHz, 8 GB RAM, and Windows 10.

3.2. Experiments Performed and the Results Obtained

Experiments in this research were realized in two steps. An auxiliary analysis had to be performed before the main evaluation. The first part of the preliminary investigations was motivated by seeking an appropriate setting of control parameters for the GMM-based classification process. The positions of the originals in the P-A space were analyzed statistically using the class centers [CPO, CAO] and their dispersions represented by the std values stdPO, stdAO. As the originals were the same for both testing speech corpora SC1 and SC2, the results obtained are applicable in all our next evaluation experiments. The second part focused on the functionality testing of the whole evaluation process. These investigations were performed using the speech corpus SC2 and three types of synthesis methods (Synt1, Synt2, and Synt3).
The first part of the auxiliary experiments consists of the following three investigations areas:
  • Comparison of computational complexity expressed by CPU times of GMM creation and training and CPU times of GMM 2D classification of originals in the P-A space for NMIX = {8, 16, 32, 64, 128, 256, and 512} and for both databases (DB1 and DB2); obtained results are presented numerically in Table 5 and Table 6.
  • Mapping of the effect of the number of Gaussian mixtures on the obtained stdPO and stdAO values of originals—see the summary comparison for both databases with the voices M1 and F1, using the feature set P4 in Figure 8.
  • Analysis of the influence of different types of speech features in the input vector on stdPO and stdAO values for the feature sets P0, P2, P4, and P42, using both databases and NMIX = 128—see the box-plot of basic statistical parameters and CPO, CAO positions for all four voices in Figure 9. The visualization of the center positions and their dispersions in the P-A scale for all four voices, using both databases DB1 and DB2, NMIX = 128, and the feature set P4 is shown in Figure 10.
  • In the second part of the preliminary investigations, we tested the setting of other parameters with a possible influence on the stability of the partial results and the final decision of the main evaluation experiments. We analyzed and compared several values obtained from the sum vectors: magnitudes and angles, SDPs after weighting in agreement with the localized emotion quadrants, order differences Dso, and final decisions FEO. For these values, we analyzed the influence of:
    (a)
    The type of the database (DB1/DB2) for training of the GMMs in the case of comparison of two methods of prosody manipulation in the TTS system (TTS1/TTS2)—see the numerical comparison of partial evaluation parameters as well as the FEO decisions using NMIX = 128, and the feature set P4 for the M1 voice in Table 7, and for the F1 voice in Table 8.
    (b)
    The used number NTS = {10, 25, 40, and 50} of tested synthetic sentences in the case of comparison of three synthesis methods (Synt1/Synt2/Synt3)—compare the obtained values in Table 9 for the M1 voice, NMIX = 128, and the feature set P4. Different number of tested sentences was applied in the Synt3 type, sentence sets for Synt1 and Synt2 were complete (NTS = 50).
The main evaluation consists of a summary comparison between the objective results by the proposed system and the subjective results achieved using the standard listening test method. In these final experiments, the sentences of the synthetic speech extracted from both corpora SC1 and SC2 and all four voices were tested, while the original sentences from speakers were the same for both corpora. In the case of the sentences from the SC1, the GMM-based results were compared with the subjective results by a large three-scale preference listening test. This test compared two versions of the same utterance synthesized by TTSA and TTSB prosody generation methods. The listeners had to choose whether “A sounds better”, “A sounds similar to B”, or “B sounds better”. The evaluation set was formed by 25 pairs of randomly selected synthetic sentences for each of four synthetic voices, so 100 sentences were compared in total. Twenty-two evaluators (of which seven were speech synthesis experts, six were phoneticians and nine were naive listeners) participated in this subjective listening test experiment. The evaluation carried out is described in more detail in [11]. The final results of the automatic evaluation system based on the GMM classification in the P-A space are compared visually with the evaluation results of the standard listening tests in the bar-graphs in Figure 11.
In the second subjective evaluation (the MUSHRA listening test), multiple audio stimuli were used for the comparison of the synthesis tested with a high quality reference signal and impaired anchor signals resembling the system’s artifacts. Both the reference and the anchor signals were hidden from the listener. The subjective audio quality of the speech recordings was scored according to the continuous quality scale with the range from 0 (poor) to 100 (excellent). For each of the four speakers and each of the 10 sets of utterances, there were four sentences to be scored by the listener. One of them was uttered in high-quality original speech Orig and the three remaining ones were synthesized by the methods Synt1, Synt2, Synt3. This test, consisting of the same utterances for every listener, was undertaken by 18 listeners, with 8 of them having experience in speech synthesis [17]. The graphical comparison of the GMM-based evaluation results with the subjective results by the MUSHRA listening test can be found in Figure 12.
The listening test evaluations were carried out previously between the years 2017 and 2019 for different research purposes [11,17]. In both of the tests, the order of the utterances was randomized in each of the ten sets so that the synthesis method was not known to the listener in advance. The listening to every audio stimulus was repeatable before the selection of the listener’s rating. Headphones and quiet ambience were recommended for listening. Neither the gender nor the age of the listener was important in the subjective evaluation, but a background in speech synthesis played an essential role.

4. Discussion of the Obtained Results

The detailed comparison of computational complexity demonstrates a great increase in CPU time for GMM creation and training using higher number of mixtures NMIX. To obtain GMMs for seven Pleasure or five Arousal classes using the sound database (IADS-2), the necessary CPU time was 43 s for eight mixture components and about 1890 s for NMIX = 512 (see first two rows in Table 5) representing a 44-fold increase. With the speech database (MSP-IMPROV), separate models for male and female voices were created, hence the differences in the CPU times are halved: about 19 s for NMIX = 8 and 900 s for the maximum of 512 mixtures, (approx. 47-fold increase). The situation is similar for both voices—male and female ones. For 2D GMM classification of original sentences of real speakers (a set of 50 in total) with these models, the CPU times are about 7 times lower, however, 250 s for the maximum NMIX = 512 is still too high—beyond the possibility of real-time processing. For the results obtained in the classification phase, the CPU times are affected neither by the voice (male/female) nor by the database (DB1/DB2), as documented in Table 6.
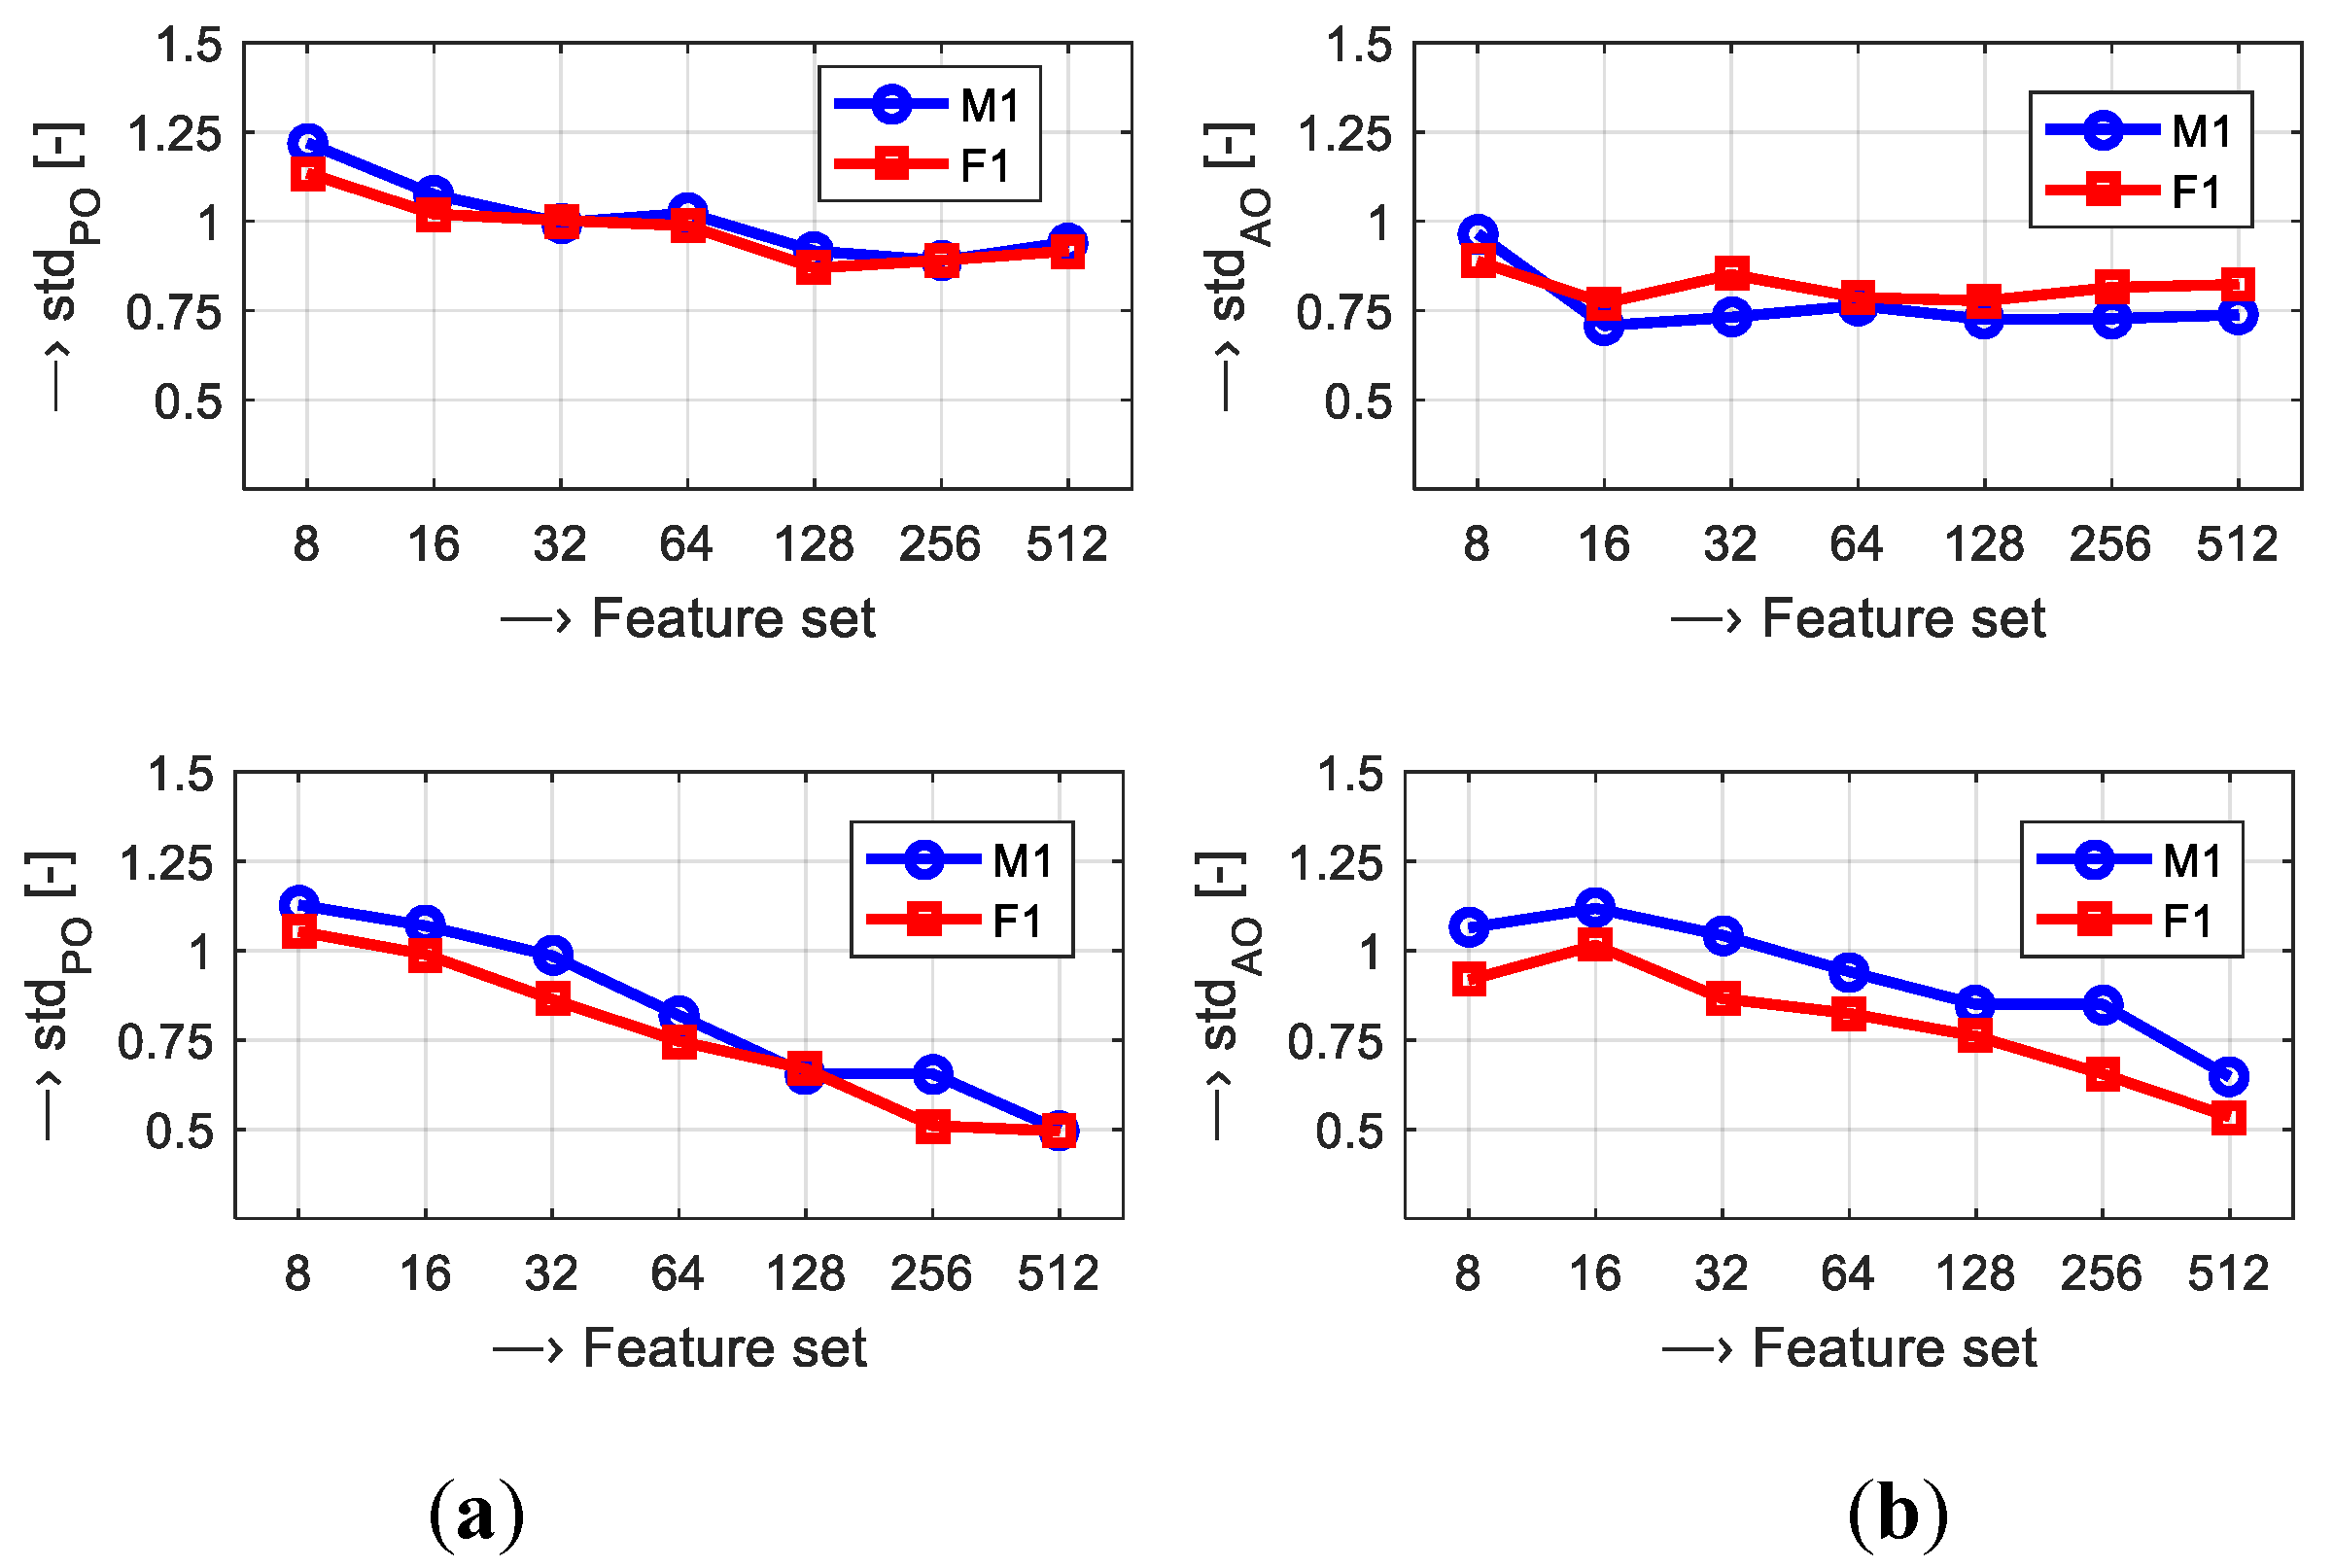
The analysis of the effect of the number of Gaussian mixtures on the obtained dispersion of the originals’ centers expressed by the stdPO and stdAO values has shown their monotonous decrease—see the graphs in Figure 8. The falling trend is the same for the male (M1) as well as the female (F1) voices, greater differences are observed for the DB2 used. For maximum accuracy of the evaluation results, low stdPO and stdAO values are necessary. It is practically fulfilled for the sound database in the case of NMIX = 128 and for the DB2 using NMIX = 512. With respect to the CPU times, we have finally chosen NMIX = 128 to be used as a compromise value in further experiments (with CPU times for GMM classification being about 0.5 s per one sentence tested).
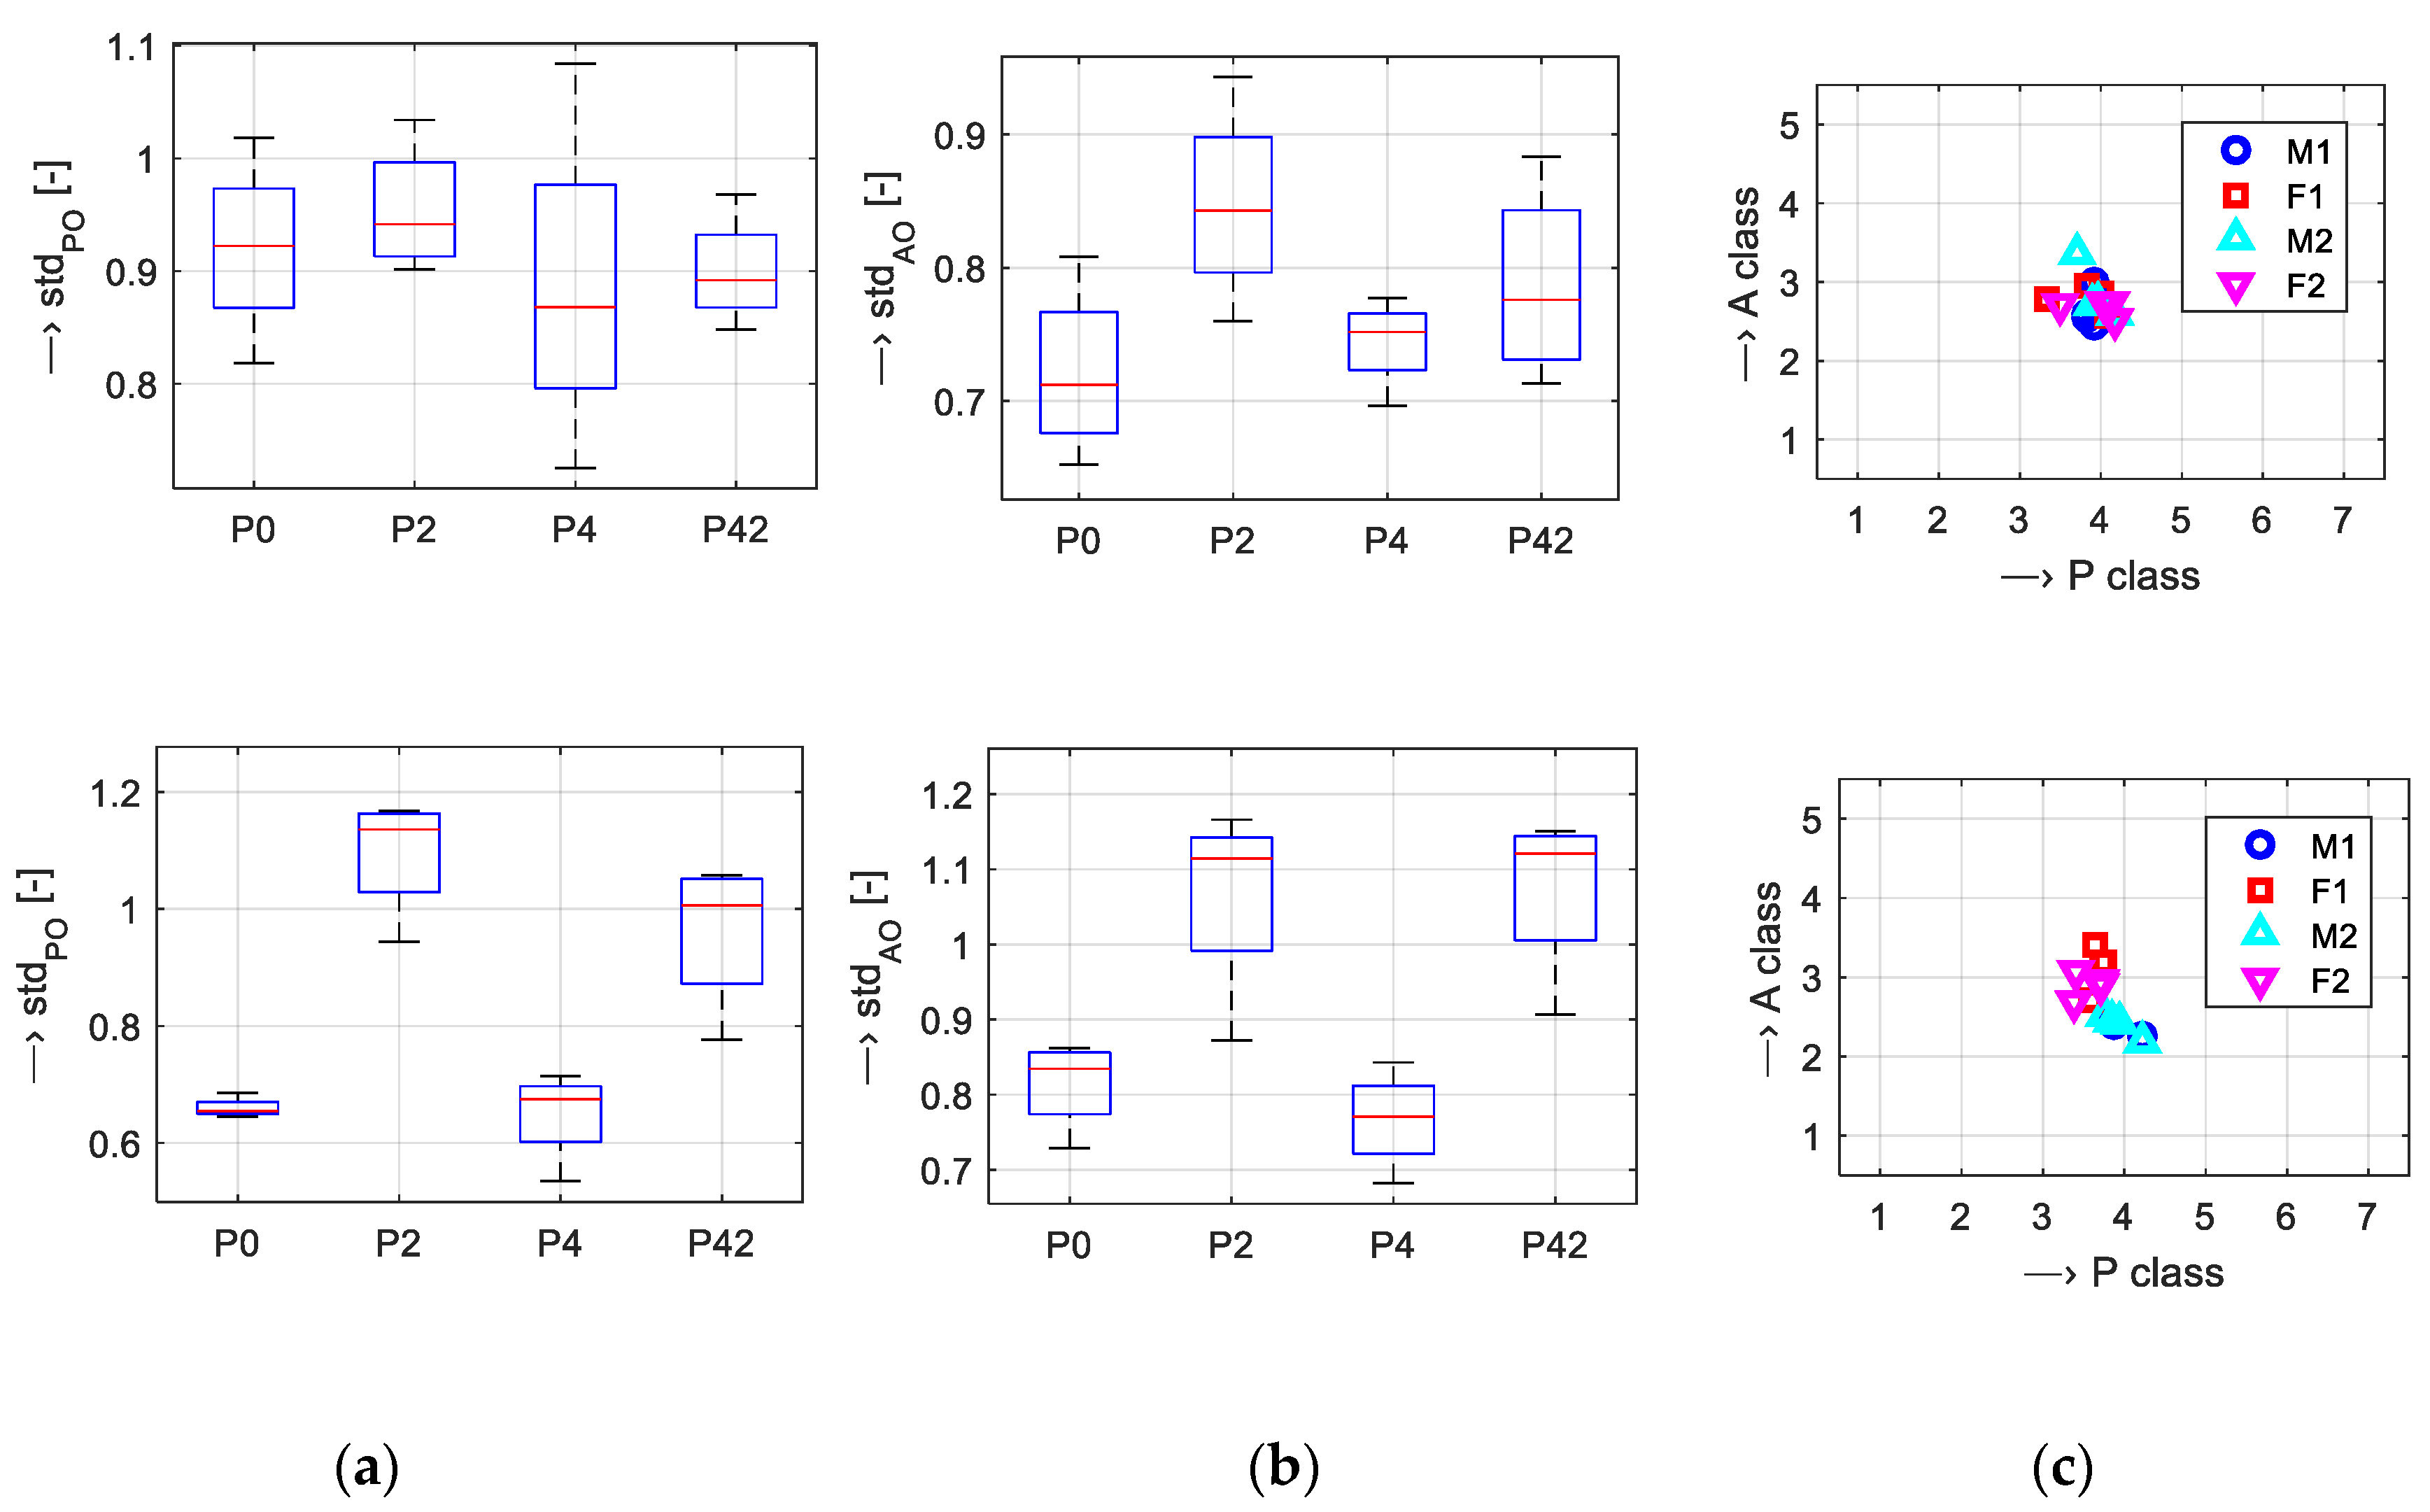
The next auxiliary analysis of dispersion of the originals around the centers dealt with different feature sets used for GMM classification. As can be seen in a box-plot comparison in Figure 9, lower mean values of stdPO and stdAO parameters are achieved with P0 and P4 sets for both databases (DB1, DB2). Considering the structure of the feature sets in Table 3, we finally decided to use the set P4 with a more balanced distribution of speech features (prosodic, spectral, and temporal types).
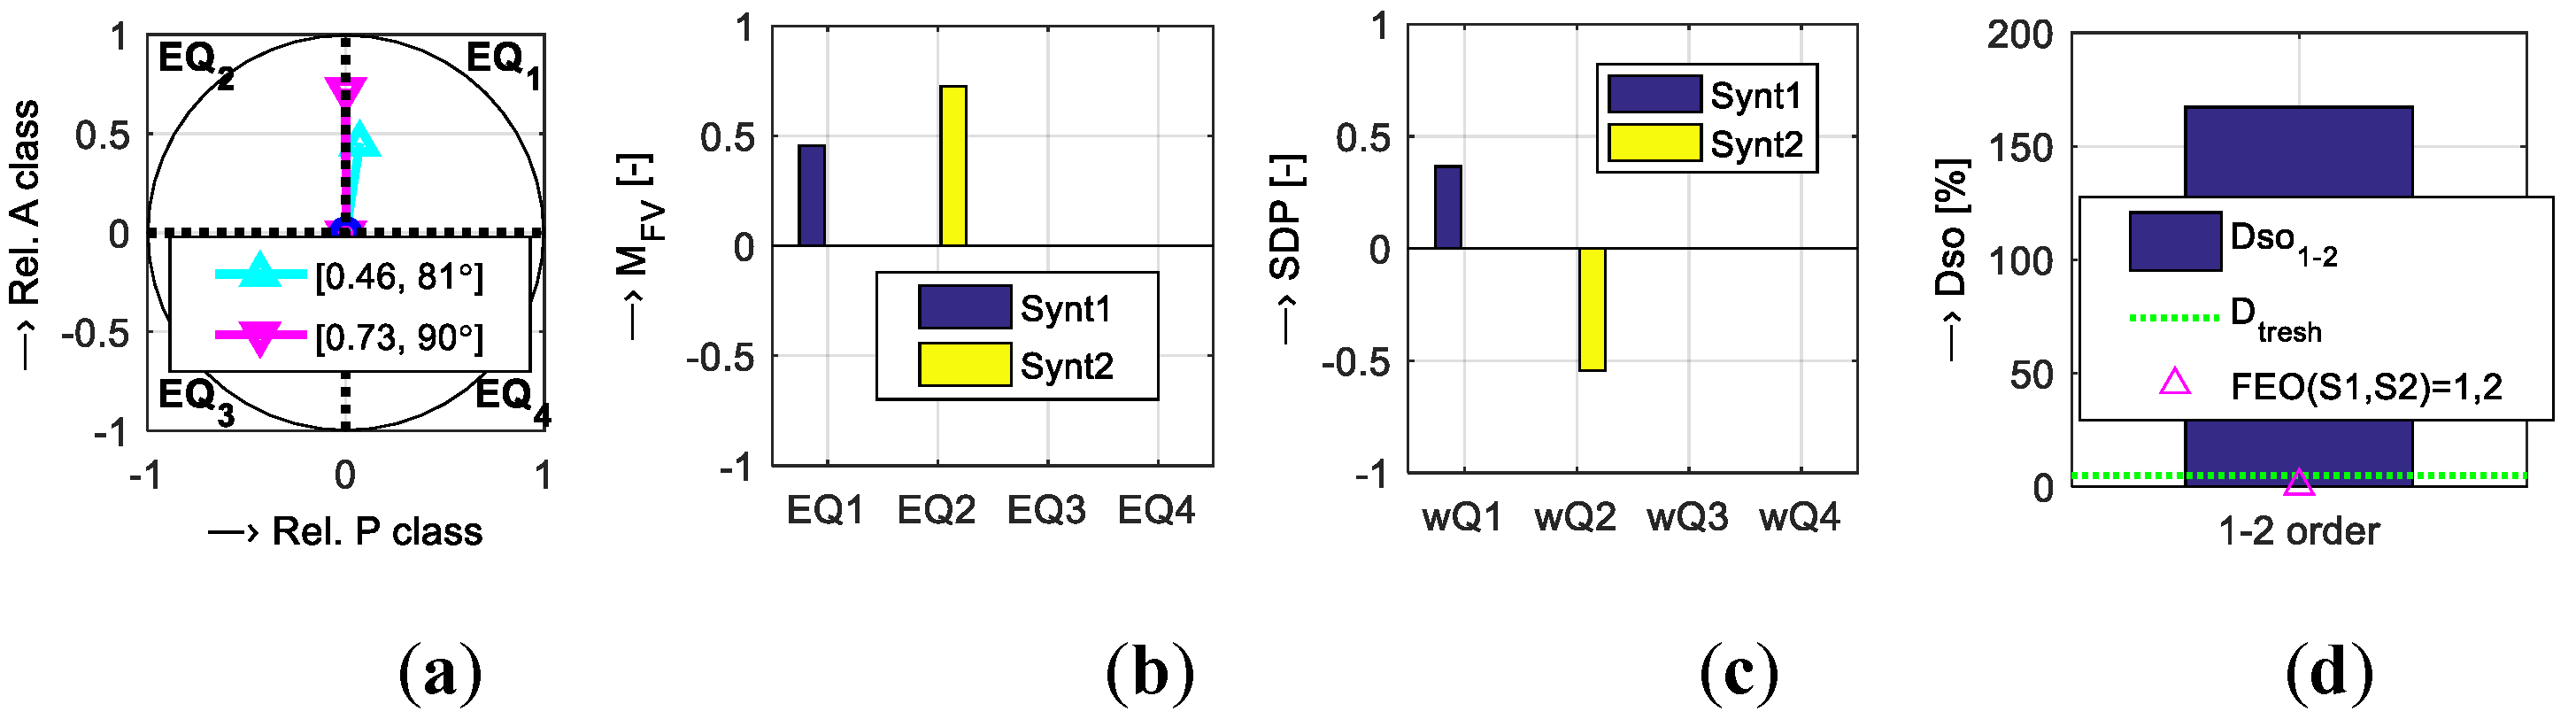
For practical testing of the functionality of the evaluation system we calculated and compared partial results comprising centers of originals, MFV and ϕFV of sum vectors, summary distribution parameters, differences DsoX–Y and FEO decisions for M1 and F1 voices depending on the sound/speech database used (see Table 7 and Table 8). The MFV parameters in the second columns of both tables show similar values for both types of prosody manipulation. For better discrimination between them, the emotional quadrant importance weights are applied. In principle, it increases the complexity of the whole evaluation algorithm. On the other hand, consideration of the location in emotional quadrants 
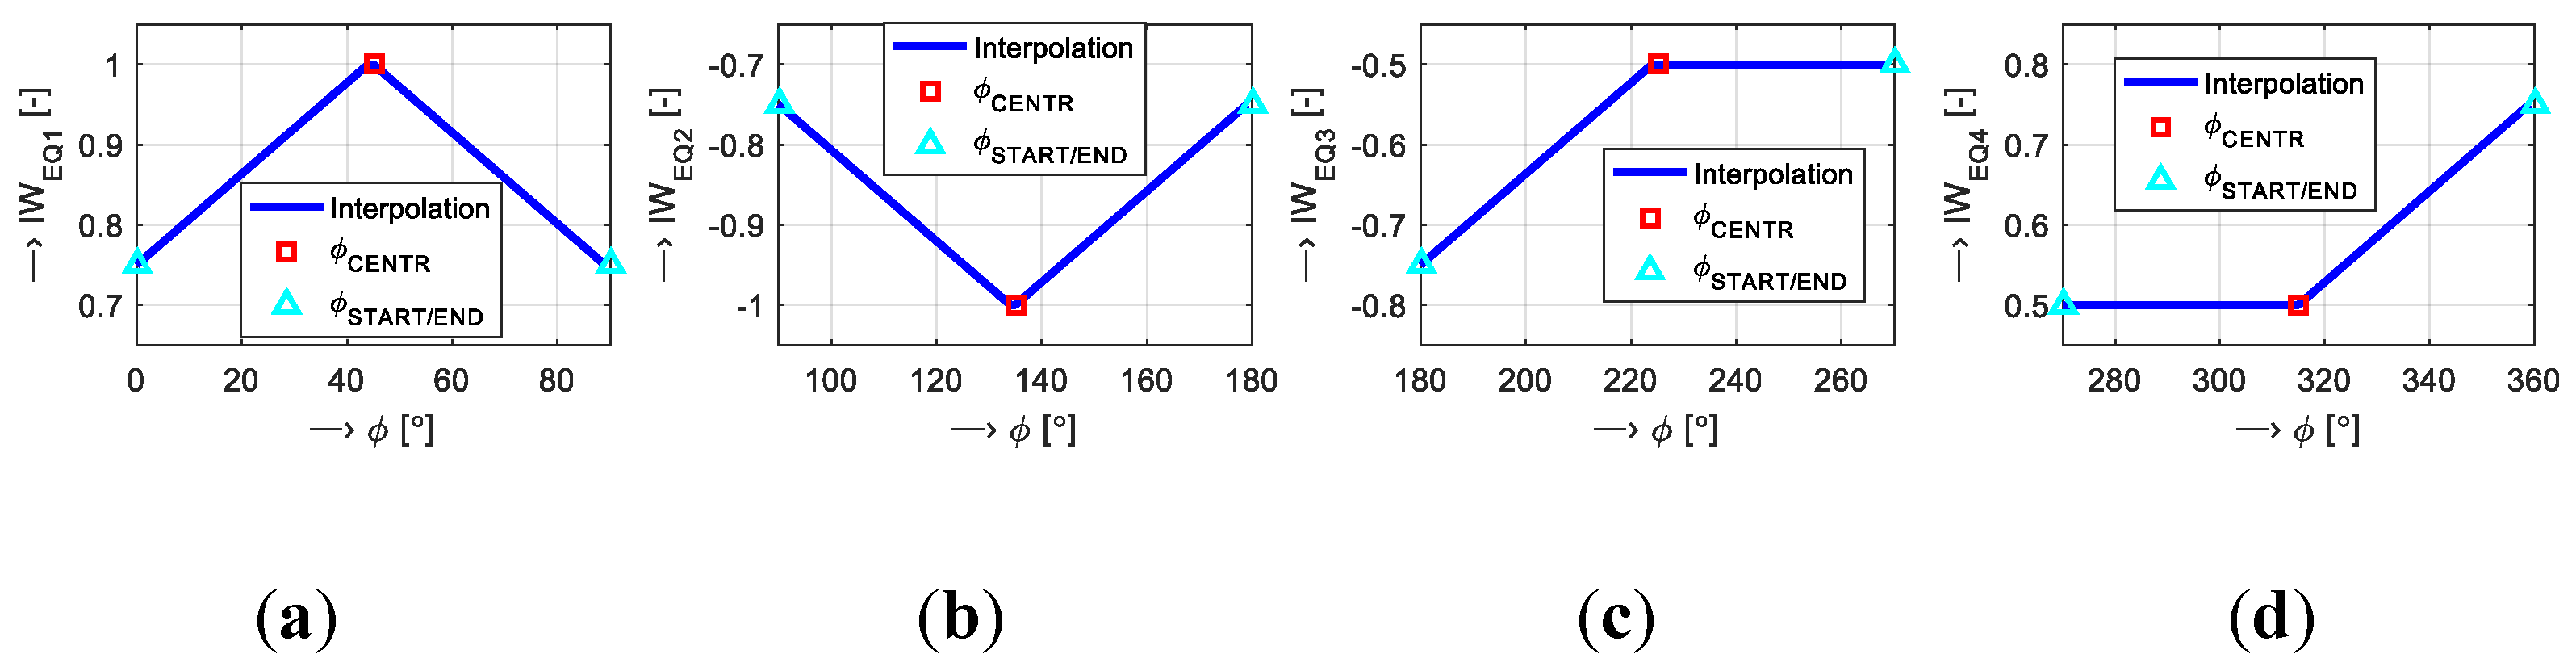
EQ1–4 is justified in a psychological perception of the synthetic speech by human listeners. This is the main criterion for evaluation of the synthetic speech quality primarily for the listening test methods however, the objective evaluation approaches must respect this influence, too. The importance weights nw0,1,2 chosen for the transformation functions IWEQ1–4 (see Table 4) and subsequent scaling of the MFV values provide the required effect—greater separation of these parameters. It is well documented in the case of the DB2 with the M1 voice (see the last two rows in Table 7) where a simple difference between the MFV values of TTS1 and TTS2 is about 0.03, but the sum vectors lie in the opposite quadrants (EQ1/EQ3), so the SDP values have opposite signs and the value of 193% is finally assigned to the parameter Dso. The same effect is shown also for the female voice F1—in this case the Dso values are smaller, but still safely over the chosen 5% similarity threshold as documented by the results in the last but one column of Table 8.
From the last auxiliary investigation follows that a minimum number of 25 sentences (one half of a full set) must be processed to achieve proper partial as well as final evaluation parameters. The values in Table 9 demonstrate that for a lower number of sentences the final decision would not be stable giving either the wrong evaluation order (for NTS = 10) or no useful information because of the similarity of the category “1/2” (for NTS = 25). For compatibility between the evaluations using both testing synthetic speech corpora (SC1 a SC2) only the full sets consisting of 50 sentences for each voice were applied in further analysis.
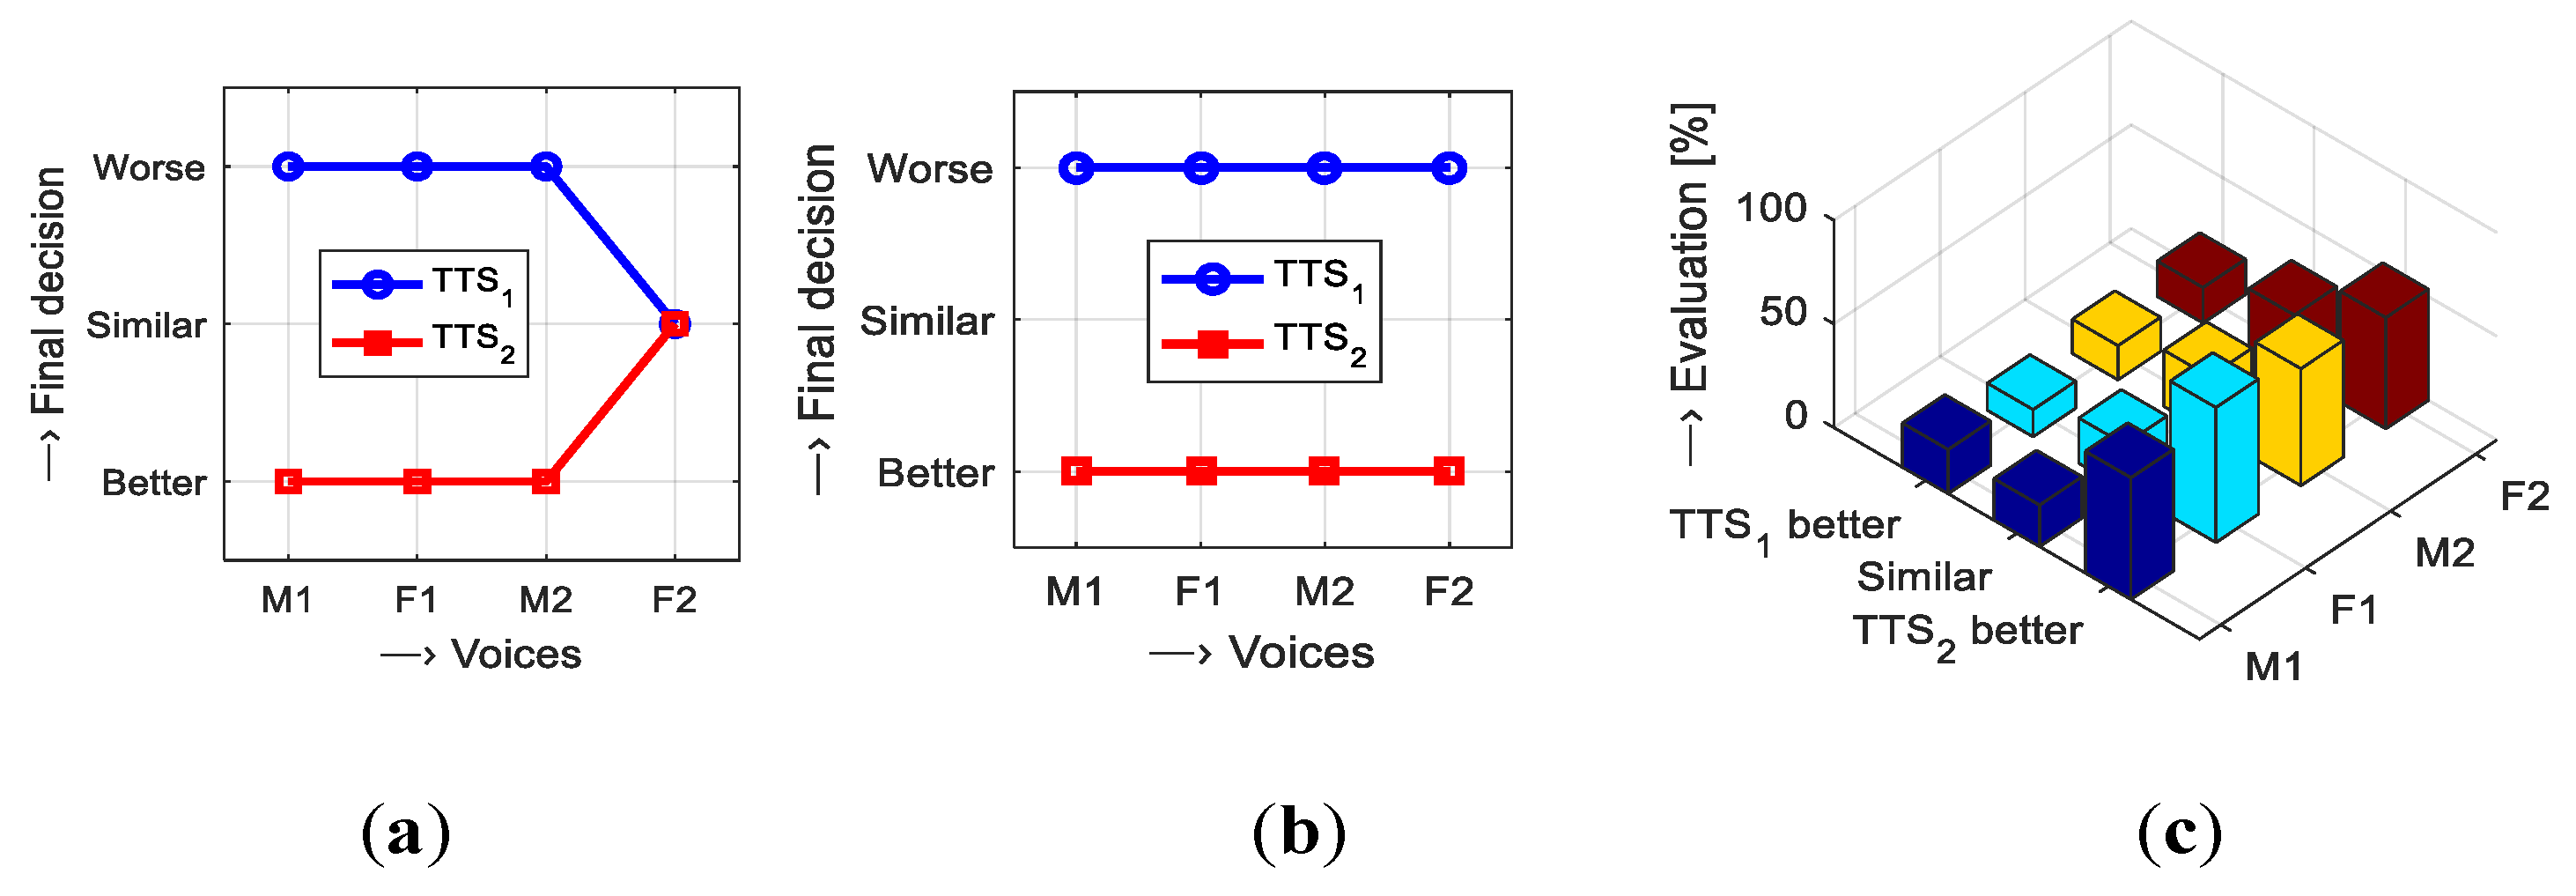
The final comparison of the evaluation experiment using sentences of the speech corpus SC1 with the results obtained by the standard listening test method described in more detail in [11] shows principal correspondence as documented by the graphs in Figure 11. While the results for the M1, F1, and M2 voices are stable and prefer the TTS2 method for both databases, for the F2 voice the results are classified as similar in the TTS1 as well as the TTS2. As follows from the comparison of center positions of originals and their dispersions in the P-A scale presented in Figure 10, for the F2 voice the stdPO and stdAO parameters achieve the greatest values. This voice has also the smallest evaluation percentage by the listening test (about 53% vs. the best evaluated voice F1 with 65%) as shown in Figure 11c.
The final objective results of the second evaluation based on testing sentences of the speech corpus SC2 show some differences when compared with the MUSHRA listening test. The graphs in Figure 12a,b document that our GMM-based automatic system marks the synthesis Synt2 (LSTM with the WORLD vocoder) as the worst one in all cases, the synthesis Synt1 (USEL) as the best (excluding the F2 voice), and the Synt3 (WaveRNN) of a medium quality. For the female voice F2, the results are different depending on the training database used for GMMs. For the sound database DB1, the quality order is exchanged for Synt1 and Synt3 types (Synt3 is the best and Synt1 is medium). Using the speech database DB2 generates the result of similarity between Synt1 and Synt3 synthesis types. Generally, it can be said that using the speech database DB2 generates smaller dispersion of localized positions and hence it brings better evaluation results of Dso parameters and stable FEO decisions.
Contrary to it, the listening tests rated the Synt3 as the best, then the Synt1 as medium, and the Synt2 as the worst—see the 3D bar-graph in Figure 12c. It also indicates similarity between Synt1 and Synt2 types for the female voice F2 (MUSHRA scores are 48.5% vs. 48.9% [17]). Our speech features used for GMM-based evaluation apparently reflect better naturalness of the USEL synthesis using units of original speech recordings, although it causes undesirable artifacts due to concatenation of these units [19]. From this point of view, the DNN is less natural as it uses a model to generate the synthetic speech, but the WaveRNN based on a DNN vocoder is more natural as it uses a complex network for direct mapping between the parametric representation and the speech samples. This is probably a reason for a simpler LSTM with the WORLD vocoder being more averaged smoothed and less natural. The result of the Synt3 being better than the Synt2 was expected, too. The listening test comparison of the WaveRNN and the USEL is generally more subjective.

5. Conclusions

The task of the synthetic speech quality determination by objective measures has been successfully fulfilled by the designed automatic system with continual evaluation on the 2D P-A scale and practical verification on two corpora of the synthetic speech generated by the Czech TTS system. We have theoretical knowledge about a better type of the synthesis (prosody manipulation in the TTS system), but the subjective evaluation performed can show a different opinion of listeners, even though the results of the objective evaluation by this proposed system are generally in correspondence with the theory. The benefit of the proposed method is that the sound/speech material used to create and train the GMMs for P-A classification can be totally unrelated to the synthetic speech tested. The sentences from the original speaker also need not be syntactically or semantically related to the sentences of the TTS system evaluated.
The currently developed automatic evaluation system uses a statistical approach and its kernel is practically based on the GMM classifier. The GMM can describe a distribution of given data using a simple k-means method for data clustering implemented in the Netlab toolbox [30]. We automatically expect that all components have Gaussian distributions but their linear combination can approximate non-Gaussian probability distributions for each of the processed P-A classes. In addition, we use a fixed number of mixtures for GMMs without discrimination between the Pleasure/Arousal types of classes and the gender of a speaker (male/female). At present, we are not able to confirm assumption about real distribution of the processed data, so statistical parameters of the training data represented by values in the feature vectors must be investigated in detail. The newer, more complex and more precise method based on spectral clustering [26] can solve this potential problem, so we will try to implement this approach into the GMM creation and training algorithm. Last, but not least, we would like to test adaptive setting of the training procedure (NMIX, NITER, and NFEAT parameters) depending on the currently used training data reflecting also the language characteristics (differences in time-duration as well as prosodic parameters).
The limitation of the present work lies in the fact that the size of both synthetic speech databases evaluated was relatively small and more sentences must be tested to evaluate the real performance of the proposed automatic system. The second problem is the practical impossibility of direct comparison of our final results with the other subjective evaluation approaches due to incompatible expression of results (in the case of the MUSHRA test) or absence of percentage values (for comparison with the listening test in the form of a confusion matrix). The output of our automatic evaluation system in the form of FEO decisions representing symbolical distances in the 2D P-A space between originals (from a speaker) with the added aspect of subjective emotional meaning by the location in four emotional quadrants. Next, the parameters Dso1–2,2–3 determining differences between the first and the second rank and the second and the third rank in the order are expressed in percentage but, due to the application of emotion quadrant weights, they can reach up to 200%.
From the practical point of view, it would be useful to provide an evaluation of the overall computational complexity of the method used in our evaluation process, together with its real-time capabilities, as well as the performance testing of the whole automatic evaluation system. The current realization in the Matlab environment is not very suitable for the building of the application running under Windows or others platforms. If the critical points were found, the whole evaluation algorithm would be implemented in one of the higher programming languages such as C++, C#, Java, etc.
Considering the limitation of the current work and its potential for practical use by other researchers we plan to build larger speech corpora and perform next evaluation experiments with the aim to find any fusion method how to enable comparison with the results obtained from the evaluation of the listening test. The Czech TTS system tested is also able to produce synthetic speech in the Slovak language (similar to Czech) [16,31]; therefore, we also suppose the application of Slovak in this proposed automatic evaluation system. Finally, we will attempt to collect speech databases directly in the Czech (Slovak) languages with sentences labeled on the P-A scale for the subsequent creation of GMM models used in the continuous P-A classification.

Author Contributions

Conception and design of the study (J.P., A.P.), data collection (J.M.), data processing (J.P.), manuscript writing (J.P., A.P.), English correction (A.P., J.M.), paper review and advice (J.M.). All authors have read and agreed to the published version of the manuscript.

Funding

The work has been supported by the Czech Science Foundation GA CR, project No GA19-19324S (J.M. and J.P.), by the Slovak Scientific Grant Agency project VEGA 2/0003/20 (J.P.), and the COST Action CA16116 (A.P.).

Acknowledgments

We would like to thank all our colleagues and other volunteers who participated in the measurement experiment.

Conflicts of Interest

The authors declare no conflict of interest.

References

  1. Telecommunication Standardization Sector of International Telecommunication Union (ITU): Methods for Subjective Determination of Transmission Quality. Series P: Telephone Transmission Quality, ITU-T Recommendation, P.800, 08/1996. Available online: https://www.itu.int/rec/T-REC-P.800-199608-I (accessed on 21 December 2020).
  2. Norrenbrock, C.R.; Hinterleitner, F.; Heute, U.; Moller, S. Quality prediction of synthesized speech based on perceptual quality dimensions. Speech Commun. 2015, 66, 17–35. [Google Scholar] [CrossRef]
  3. Kato, S.; Yasuda, Y.; Wang, X.; Cooper, E.; Takaki, S.; Yamagishi, J. Modeling of Rakugo speech and its limitations: Toward speech synthesis that entertains audiences. IEEE Access 2020, 8, 138149–138161. [Google Scholar] [CrossRef]
  4. Maki, H.; Sakti, S.; Tanaka, H.; Nakamura, S. Quality prediction of synthesized speech based on tensor structured EEG signals. PLoS ONE 2018, 13. [Google Scholar] [CrossRef] [PubMed]
  5. Mendelson, J.; Aylett, M. Beyond the listening test: An interactive approach to TTS evaluation. In Proceedings of the 18th Annual Conference of the International Speech Communication Association (Interspeech), Stockholm, Sweden, 20–24 August 2017; pp. 249–253. [Google Scholar] [CrossRef] [Green Version]
  6. Matousek, J.; Tihelka, D. Anomaly-based annotation error detection in speech-synthesis corpora. Comput. Speech Lang. 2017, 46, 1–35. [Google Scholar] [CrossRef]
  7. Sailor, H.B.; Patil, H.A. Fusion of magnitude and phase-based features for objective evaluation of TTS voice. In Proceedings of the 9th International Symposium on Chinese Spoken Language Processing (ISCSLP), Singapore, 12–14 September 2014; pp. 521–525. [Google Scholar] [CrossRef]
  8. Rao, S.; Mahima, C.; Vishnu, S.; Adithya, S.; Sricharan, A.; Ramasubramanian, V. TTS evaluation: Double-ended objective quality measures. In Proceedings of the IEEE International Conference on Electronics, Computing, and Communication Technologies (CONECCT), Bangalore, India, 10–11 July 2015. [Google Scholar] [CrossRef]
  9. Juvela, L.; Bollepalli, B.; Tsiaras, V.; Alku, P. GlotNet—A raw waveform model for the glottal excitation in statistical parametric speech synthesis. IEEE Trans. Audio Speech Lang. Process. 2019, 27, 1019–1030. [Google Scholar] [CrossRef]
  10. Pribil, J.; Pribilova, A.; Matousek, J. Synthetic speech evaluation by 2D GMM classification in pleasure-arousal scale. In Proceedings of the 43rd International Conference on Telecommunications and Signal Processing (TSP), Milan, Italy, 7–9 July 2020; pp. 10–13. [Google Scholar] [CrossRef]
  11. Juzova, M.; Tihelka, D.; Skarnitzl, R. Last syllable unit penalization in unit selection TTS. In Proceedings of the 20th International Conference on Text, Speech, and Dialogue (TSD), Prague, Czech Republic, 27–31 August 2017; pp. 317–325. [Google Scholar] [CrossRef]
  12. Ning, Y.; He, S.; Wu, Z.; Xing, C.; Zhang, L.-J. A review of deep learning based speech synthesis. Appl. Sci. 2019, 9, 4050. [Google Scholar] [CrossRef] [Green Version]
  13. Janyoi, P.; Seresangtakul, P. Tonal contour generation for Isarn speech synthesis using deep learning and sampling-based F0 representation. Appl. Sci. 2020, 10, 6381. [Google Scholar] [CrossRef]
  14. Hunt, A.J.; Black, A.W. Unit selection in a concatenative speech synthesis system using a large speech database. In Proceedings of the IEEE International Conference on Acoustics, Speech and Signal Processing (ICASSP), Atlanta, GA, USA, 9 May 1996; pp. 373–376. [Google Scholar] [CrossRef]
  15. Kala, J.; Matousek, J. Very fast unit selection using Viterbi search with zero-concatenation-cost chains. In Proceedings of the IEEE International Conference on Acoustics, Speech and Signal Processing (ICASSP), Florence, Italy, 4–6 May 2014; pp. 2569–2573. [Google Scholar] [CrossRef]
  16. Tihelka, D.; Hanzlicek, Z.; Juzova, M.; Vit, J.; Matousek, J.; Gruber, M. Current state of text-to-speech system ARTIC: A decade of research on the field of speech technologies. In Proceedings of the 21st International Conference on Text, Speech, and Dialogue (TSD), Brno, Czech Republic, 11–14 September 2018; pp. 369–378. [Google Scholar] [CrossRef]
  17. Vit, J.; Hanzlicek, Z.; Matousek, J. Czech speech synthesis with generative neural vocoder. In Proceedings of the 22nd International Conference on Text, Speech, and Dialogue (TSD), Ljubljana, Slovenia, 11–13 September 2019; pp. 307–315. [Google Scholar] [CrossRef]
  18. Vit, J.; Matousek, J. Concatenation artifact detection trained from listeners evaluations. In Proceedings of the 16th International Conference on Text, Speech, and Dialogue (TSD), Pilsen, Czech Republic, 1–5 September 2013; pp. 169–176. [Google Scholar] [CrossRef]
  19. Radiocommunication Sector of International Telecommunications Union (ITU): Method for the Subjective Assessment of Intermediate Quality Level of Coding Systems. BS Series Broadcasting service (sound), ITU Recommendation ITU-R BS.1534-3. 10/2015. Available online: https://www.itu.int/rec/R-REC-BS.1534-3-201510-I/en (accessed on 21 December 2020).
  20. Harmon-Jones, E.; Harmon-Jones, C.; Summerell, E. On the importance of both dimensional and discrete models of emotion. Behav. Sci. 2017, 7, 66. [Google Scholar] [CrossRef] [PubMed] [Green Version]
  21. Song, T.; Zheng, W.; Lu, C.; Zong, Y.; Zhang, X.; Cui, Z. MPED: A multi-modal physiological emotion database for discrete emotion recognition. IEEE Access 2019, 7, 12177–12191. [Google Scholar] [CrossRef]
  22. Bran, A.; Vaidis, D.C. On the characteristics of the cognitive dissonance state: Exploration within the pleasure arousal dominance Model. Psychol. Belg. 2020, 60, 86–102. [Google Scholar] [CrossRef] [PubMed]
  23. Nicolau, M.A.; Gunes, H.; Pantic, M. Continuous prediction of spontaneous affect from multiple cues and modalities in valence-arousal Space. IEEE Trans. Affect. Comput. 2011, 2, 92–105. [Google Scholar] [CrossRef] [Green Version]
  24. Jin, X.; Wang, Z. An Emotion Space Model for Recognition of Emotions in Spoken Chinese. Lect. Notes Comput. Sci. 2005, 3784, 397–402. [Google Scholar]
  25. Reynolds, D.A.; Rose, R.C. Robust text-independent speaker identification using Gaussian mixture speaker models. IEEE Trans. Speech Audio Process. 1995, 3, 72–83. [Google Scholar] [CrossRef] [Green Version]
  26. Ng, A.Y.; Jordan, M.I.; Weiss, Y. On spectral clustering: Analysis and an algorithm. Adv. Neural Inf. Process. Syst. 2002, 14, 8. [Google Scholar]
  27. Pribil, J.; Pribilova, A.; Matousek, J. Automatic evaluation of synthetic speech quality by a system based on statistical analysis. In Proceedings of the 21st International Conference on Text, Speech, and Dialogue (TSD), Brno, Czech Republic, 11–14 September 2018; pp. 315–323. [Google Scholar] [CrossRef]
  28. Bradley, M.M.; Lang, P.J. The International Affective Digitized Sounds (2nd Edition; IADS-2): Affective Ratings of Sounds and Instruction Manual; Technical Report B-3; University of Florida: Gainesville, FL, USA, 2007. [Google Scholar]
  29. Busso, C.; Parthasarathy, S.; Burmania, A.; AbdelWahab, M.; Sadoughi, N.; Provost, E.M. MSP-IMPROV: An acted corpus of dyadic interactions to study emotion perception. IEEE Trans. Affect. Comput. 2017, 8, 67–80. [Google Scholar] [CrossRef]
  30. Nabney, I.T. Netlab Pattern Analysis Toolbox, Release 3.3. Available online: http://www.aston.ac.uk/eas/research/groups/ncrg/resources/netlab/downloads (accessed on 2 October 2015).
  31. Matousek, J.; Tihelka, D.; Romportl, J.; Psutka, J. Slovak unit-selection speech synthesis: Creating a new Slovak voice within a Czech TTS system ARTIC. IAENG Int. J. Comput. Sci. 2012, 39, 147–154. [Google Scholar]
Figure 1. 2D diagram of emotion distribution in the P-A space and corresponding quadrant categorization with importance weights.
Applsci 11 00002 g001
Figure 2. Block diagram of the preparation phase—creation and training of GMMs for P-A classes.
Applsci 11 00002 g002
Figure 3. Block diagram of the GMM classification in the P-A space.
Applsci 11 00002 g003
Figure 4. Block diagram of the evaluation part processing using synthetic speech sentences.
Applsci 11 00002 g004
Figure 5. Visualization of localized positions of synthetic speech sentences for N = 50: (a) sentence locations in the P-A space, (b) relative locations around the center of originals, (c) the resulting normalized FV with determined vector magnitude and phase items belonging to quadrants EQ1–4.
Applsci 11 00002 g005
Figure 6. Visualization of sum vectors processing to obtain FEO decision for three types of synthesis: (a) localization of FV in the emotional quadrants EQ1–4, (b) bar-graph of FV magnitudes, (c) summary distribution parameters, (d) Dso1–2 between the 1st–2nd rank and FEO decision.
Applsci 11 00002 g006
Figure 7. Visualization of importance weighting functions for the final normalized sum vector localization inside emotion quadrants EQ1–4 (ad).
Applsci 11 00002 g007
Figure 8. Distribution of centers of originals using different number of mixtures NMIX = {8, 16, 32, 64, 128, 256, 512}: (a) stdPO values, (b) stdAO values; for M1 and F1 voices; used DB1 (upper graphs) and DB2 (lower graphs), feature set P4.
Applsci 11 00002 g008
Figure 9. The summary graphical comparison of dispersion of the originals around the centers using feature sets P0, P2, P4, and P42: (a) box-plot of basic statistical parameters for stdPO values, (b) for stdAO values, (c) positions of centers [CPO, CAO] in the P-A space for all four voices and both databases used for GMM training (DB1—upper set of graphs, DB2—lower graphs); NMIX = 128.
Applsci 11 00002 g009
Figure 10. Visualization of positions of the originals in the P-A space together with the centers of originals and their std values: (ad) for M1, F1, M2, and F2 voices—using the DB1 (upper graphs), and the DB2 (lower graphs); NMIX = 128, the feature set P4.
Applsci 11 00002 g010
Figure 11. Final evaluation results of two types of the prosody manipulation in the TTS system using: (a) the GMM-based method and DB1, (b) the GMM-based method and DB2, (c) the listening test approach for all four tested voices; for results of the GMM method the feature set P4 and NMIX = 128 was applied.
Applsci 11 00002 g011
Figure 12. Summary comparison: (a) FEO decisions by the GMM-based evaluation, (b) using DB2 and NMIX = 128, (c) results by the MUSHRA listening test for all four evaluated voices; FEO: “1” = the best, “2” = medium, “3” = the worst; “1/2”, “2/3” = similar.
Applsci 11 00002 g012
Table 1. Description of the speech material used in both evaluation experiments.
SpeakerF0Mean [Hz]Number of Sentences/TDUR [s] (fs = 16 kHz)
OrigTTSATTSBSynt1Synt2Synt3
M1 (AJ)12050/13050/12250/12050/33050/33050/340
M2 (JS)10050/13040/10340/10050/38050/38050/380
F1 (KI)21550/14040/10240/9850/37050/38050/380
F2 (SK)19550/14040/9740/9450/34050/36050/360
Table 2. Speech feature types used.
Feature TypeFeature Name
Time duration (TDUR){lengths voiced/unvoiced parts (Lv, Lu) and their ratios (Lv/u)}
Prosodic (PROS){fundamental frequency F0, signal energy (Enc0), differential F0 (F0DIFF), jitter (Jabs), shimmer (APrel), zero-crossing frequency (F0ZCR)};
Basic spectral (SPEC1){first two formants (F1, F2), their ratio (F1/F2), spectral tilt (Stilt), harmonics-to-noise ratio (HNR), first four cepstral coefficients (c1c4)}
Supplementary spectral (SPEC2){spectral spread (Sspread), spectral skewness (Sskew), spectral kurtosis (Skurt), spectral centroid (SC), spectral flatness measure (SFM), Shannon spectral entropy (SHE)}.
Table 3. Description of the structure of the feature sets used.
SetFeature NameStatistical Value (A)Type and Number (B)
P0{Stilt, SC, SFM, HNR, Enc0, F0DIFF, F0ZCR, Jabs, APrel, Lv, Lu, Lv/u}{min, rel. max, min, mean, std, median}PROS (7), SPEC1 (2), SPEC2 (4), TDUR (3)
P2{F1, F2, F1/F2, Stilt, HNR, SHE, Enc0, F0DIFF, Jabs, APrel, Lv, Lu, Lv/u}{mean, median, std, rel.max, min, max}PROS (4), SPEC1 (7), SPEC2 (2), TDUR (3)
P4{c1c4, Stilt, Sspread, Sskew, Skurt, F0DIFF, Jabs, APrel, Lv, Lu, Lv/u}{skewness, kurtosis, std, mean, median, rel.max, max}PROS (3), SPEC1 (7), SPEC2 (3), TDUR (3)
P42{c1c2, F1/F2, Sspread, Stilt, HNR, Enc0, F0DIFF, Jabs, APrel, Lv, Lu, Lv/u}{skewness, mean, std, median}PROS (4), SPEC1 (4), SPEC2 (5), TDUR (3)
(A) From some features more statistical values are determined. (B) A total number of 16 values were applied in all feature sets.
Table 4. Definition of central and border angles of definition points together with emotional quadrant importance weight coefficients for weighting functions IWEQ1–4.
Weighting Function/Coeffs.Importance Weights (A)Angle of Definition Points (B)
nw1nw0nw2ϕSTARTϕCENTRϕEND
IWEQ10.7510.7504590
IWEQ2−0.75−1−0.7590135180
IWEQ3−0.75−0.5−0.5180225270
IWEQ40.50.50.75270315360
(A) Emotion quadrant importance weights corresponding to the angles. (B) Angles defined for the quadrant center (ϕCENTR => nw0) and the quadrant borders (ϕSTART/END => nw1/nw2).
Table 5. Comparison of CPU times for GMM creation and training using different number of mixtures NMIX for both databases (DB1/DB2).
NPC, NAC (Database) (A)CPU Time [min:sec]—Total (Mean for Each of P-A Class Model)
NMIX = 8NMIX = 16NMIX = 32NMIX = 64NMIX = 128NMIX = 256NMIX = 512
P7 common (DB1)43 (6)1:18 (11)2:30 (21)4:48 (41)9:00 (1:17)16:48 (2:24)31:48 (4:17)
A5 common (DB1)43 (9)1:25 (17)2:34 (31)4:35 (55)8:43 (1:45)16:21 (3:16)31:26 (6:17)
P7 male (DB2)19 (3)32 (5)58 (8)1:57 (17)3:59 (34)7:45 (1:06)15:01 (2:09)
A5 male (DB2)19 (4)30 (6)58 (12)2:00 (24)4:00 (48)7:39 (1:32)14:43 (2:57)
P7 female (DB2)18 (3)30 (5)56 (8)1:48 (15)3:39 (30)7:15 (59)14:47 (1:55)
A5 female (DB2)18 (3)29 (4)54 (10)1:40 (19)3:30 (42)7:09 (1:23)14:33 (2:15)
(A) Models of the sound database are common; the DB2 has separate models for male and female voices.
Table 6. Comparison of CPU times for GMM 2D classification of originals in the P-A space using different number of mixtures NMIX, both databases (DB1/DB2) for M1 and F1 voices.
Type of Originals (A) (Database)CPU Time [min:sec]—Total (Mean for Each of Sentence of Originals)
NMIX = 8NMIX = 16NMIX = 32NMIX = 64NMIX = 128NMIX = 256NMIX = 512
male M1 (DB1)8.5 (0.2)14 (0.3)23 (0.5)44 (0.9)1:33 (1.7)2:35 (3.1)4:19 (5.2)
female F1 (DB1)8.8 (0.2)14 (0.3)24 (0.5)46 (0.9)1:25 (1.7)2:38 (3.2)4:22 (5.3)
male M1 (DB2)8.7 (0.2)13 (0.3)23 (0.5)45 (0.9)1:23 (1.7)2:36 (3.1)4:16 (5.1)
female F1 (DB2)8.7 (0.2)14 (0.3)24 (0.5)47 (0.9)1.23 (1.7)2:39 (3.2)4:22 (5.2)
(A) In total 50 sentences of originals were classified for M1 and F1 voices.
Table 7. Comparison of partial results and FO decisions for M1 voice using different databases in GMM creation/training phases.
Synthesis Type (A) (Database)[CPO, CAO][MFV, ϕFV]EQSDPDso1–2FEO(B) (TTS1,TTS2)
TTS1 (DB1)[3.79, 2.71][0.29, 36°]10.271155%1, 2
TTS2 (DB1)[0.01, 107°]2−0.075
TTS1 (DB2)[3.84, 2.48][0.16, 30°]10.145193%1, 2
TTS2 (DB2)[0.19, 189°]3−0.136
(A) Used NMIX=128 and the feature set P4 in all cases. (B) FEO decisions: “1” = better, “1/2” = similar, “3” = worse.
Table 8. Comparison of partial results and FO decisions for F1 voice using DB1 and DB2 databases for GMM creation and training.
Synthesis Type (A) (Database)[CPO, CAO][MFV, ϕFV]EQSDPDso1-2FEO(B) (TTS1,TTS2)
TTS1 (DB1)[3.88, 2.97][0.22, 355°]40.16415%1, 2
TTS2 (DB1)[0.20, 55°]10.192
TTS1 (DB2)[3.76, 3.19][0.36, 60°]10.32937%1, 2
TTS2 (DB2)[0.54, 53°]10.522
(A) Used NMIX = 128 and the feature set P4 in all cases. (B) FEO decisions: “1” = better, “1/2” = similar, “3” = worse.
Table 9. Comparison of the partial and the final results in dependence on the number of tested sentences NTS using the synthesis Synt3 group for the M1 voice.
NTS(A)[MFV, ϕFV] (B)EQ(B)SDP(B)Dso1–2,2–3 [%]FEO(S1,2,3) (C)
S1S2S3S1S2S3S1S2S3
100.12, 318°0.24, 7°0.11, 274°4140.080.190.0612.3, 68.02, 3 1
250.12, 318°0.24, 7°0.15, 340°4140.080.190.092.19, 74.01/2, 3, 1/2
400.12, 318°0.24, 7°0.17, 338°4140.080.190.1123.6, 44.51, 3, 2
500.12, 318°0.24, 7°0.16, 336°4140.080.190.1019.3, 48.81, 3, 2
(A) For the Synt3 type, sentences were randomly taken from the whole set of 50 using NMIX = 128 and DB2. (B) In the case of Synt1 and Synt2 was NTS = 50 used. (C) FEO decisions: “1” = the best, “2” = medium, “3” = the worst; “1/2” = similar.
Publisher’s Note: MDPI stays neutral with regard to jurisdictional claims in published maps and institutional affiliations.

