Article

Morphological Study of Bacillus thuringiensis Crystals and Spores

1
Physics Department, UR TVA, Faculty of Science, Saint Joseph University, B.P. 11-514, Riad El Solh, Beirut 1107 2050, Lebanon
2
Laboratoire OPTIMAG, IBSAM, Université de Bretagne Occidentale, 6 Avenue Le Gorgeu, C.S. 93837, CEDEX 3, 29238 Brest, France
3
Faculty of Science, Biotechnology Laboratory, UR EGP, Saint Joseph University, B.P. 11-514 Riad El Solh, Beirut 1107 2050, Lebanon
4
Laboratory of Plant Protection and Improvement (Biopesticides Team), Centre of Biotechnology of Sfax, Sfax University, B.P. 1171, Sfax 3018, Tunisia
5
Chemistry Department, UR TVA, Faculty of Science, Saint Joseph University, B.P. 11-514 Riad El Solh, Beirut 1107 2050, Lebanon
*
Author to whom correspondence should be addressed.
Appl. Sci. 2021, 11(1), 155; https://doi.org/10.3390/app11010155
Submission received: 12 November 2020 / Revised: 12 December 2020 / Accepted: 21 December 2020 / Published: 25 December 2020
(This article belongs to the Section Applied Physics General)

Abstract

:
In this paper, we report a morphological study of the crystals and spores of different shapes synthesized by seven different strains of Bacillus thuringiensis. Crystals and spores were separated after 48 h of culture on T3 agar medium and imaged under a scanning electron microscope (SEM). Sizes of the crystals and spores were determined using Image J software. The results showed that crystal and spore sizes were normally distributed. In addition, the volumes and aspect ratios of the crystals and spores were calculated. The statistical analysis of the data showed the variability of the size distribution and morphological data of the crystals produced by the analyzed strains. Furthermore, variations in spore size and shape within the same serovar were observed, indicating that, perhaps, there are still some unexplored differences between strains of this serovar, making them less identical than what was believed so far.

1. Introduction

Bacillus thuringiensis (B. thuringiensis), a Gram-positive, soil-dwelling bacterium, is part of B. cereus sensu lato, a group of nine phylogenetically close, but ecologically diverse bacteria [1]. Its three most studied members are the biopesticide B. thuringiensis, the potentially food-borne toxi-infectious pathogen B. cereus sensu stricto [2] and the causative agent of anthrax, potential bio-weapon B. anthracis [3]. Thanks to its status as an “eco-friendly and safe” biopesticide, B. thuringiensis-based products form ca. 90% of the microbial pesticides currently available [4]. It owes its entomopathogenic capacities to a crystallin inclusion, produced during the sporulation phase, consisting of a constellation of toxins, also dubbed δ-endotoxins, active against a wide array of insect larvae [5]. After sporulation is complete, the crystal is released in the environment alongside the spore and eventually ingested by insect larvae. Once in the insect’s gut, the crystal will be solubilized, and toxins will be activated by intestinal proteases. They subsequently bind to receptors on the intestinal midgut, forming pores and leading to the death of the insect larvae [6]. Crystal proteins include those belonging to the pore-forming Cry toxins with or without the presence of cytolytic Cyt toxins. Cry toxins interact specifically with a receptor in the apical membrane of the insect midgut, whereas Cyt toxins act in a detergent-like manner on the membrane phospholipids [7].
Therefore, on the one hand, a variation in a crystal’s Cry components underlines a variation in a strain’s activity spectrum. So far, 73 Cry and seven Cyt families are registered in the recently updated B. thuringiensis nomenclature database [8]. Each Cry family has a signature shape and activity spectrum; e.g., Cry1 family proteins form a bipyramidal crystal and are active against lepidopteran larvae [9], whereas Cry4 form a spherical crystal and are toxic to dipteran larvae [10].
On the other hand, B. thuringiensis strains are classified according to their serotypes or serovars (var.), which were once based on their respective immunological reactions caused by their flagellar H-antigen proteins, flagellin [11]. Nowadays, this classification is based on pairwise sequence comparison of the latter protein [12]. The two most studied serovars are (i) the reference for anti-dipteran activity, B. thuringiensis var. israelensis, and (ii) the reference for anti-lepidopteran activity, B. thuringiensis var. kurstaki. The former produces spherical crystals containing a set of proteins from the following families: Cry4, Cry10, Cry11, Cyt1 and Cyt2 [13,14,15]. As for the latter, its crystal proteins belong to the Cry1 and Cry2 families, resulting in bipyramidal and cubic crystals, respectively [9,16]. Other than its crystal components, each serovar is characterized by a set of plasmids, toxin-carrying, conjugative or mobilizable, providing serovar-specific peculiarities [14,17].
An in-depth investigation of all aspects involved in B. thuringiensis biopesticidal activity—be they genomic, proteomic, morphological, related to crystal and spore production kinetics and stability or otherwise—is a necessity created by the increased use of B. thuringiensis spore-crystal mixtures in the environment. One of the most recent techniques used to monitor the growth kinetics and production of B. thuringiensis spores and crystals is laser speckle imaging, a reliable and non-invasive technique based on light scattered by an illuminated medium [18]. In order to have accurate results and to understand the interaction between the light and the bacterial density, the size and shape of the scatterers in question should be known, along with whether these scatterers are in suspensions [19] or embedded in agar plates [20]. In the case of B. thuringiensis spores and crystals, their size and morphology vary according to the culture conditions and the presence of additional chaperone proteins. For the latter, an example is that of the B. thuringiensis var. israelensis chaperone; others are accessory proteins p19 or p20, well-known for their association with anti-dipteran toxins. Both proteins were shown to be indispensable for correct folding of Cry and Cyt proteins [21,22]. In fact, the effect of the 20 kDa protein on anti-coleopteran crystal toxins was highlighted in a 2011 study, in which this protein enhanced the volume, yield and solubility of Cry3A [23]. As for variations in culture conditions (culture media composition, pH, available oxygen and initial inoculum volume in the culture), several studies reported significant effects on the production and morphology of crystal inclusions, and the spore count at the start of the sporulation phase [24,25,26,27].
In this study, we established a protocol for mining the morphological data and size distribution of B. thuringiensis spores and crystals of different shapes. Our focus was on the morphological analysis of spores and crystals of three B. thuringiensis var. kurstaki strains with bipyramidal and cubic crystal; three var. israelensis strains with spherical crystals; and one B. thuringiensis strain belonging to an unknown serovar, but that is phylogenetically close to B. thuringiensis var. sichuansis. The null hypothesis tested was that there were no significant differences in the various morphological aspects considered between the analyzed B. thuringiensis strains.

2. Materials and Methods

2.1. Bacterial Strains and Spore/Crystal Preparation

Seven B. thuringiensis strains were used in this study, whose characteristics and crystal components are summarized in Table 1. Three B. thuringiensis var. kurstaki strains are considered: HD-1, the reference anti-lepidopteran strain used in the commercial biopesticide Thuricide® [28]; the LIPMKA strain, isolated from Lebanese soil [9]; and the BLB1 strain, isolated from Tunisian soil [29]. All three are active against lepidopteran larvae and produce bipyramidal (B) and cubic (C) δ-endotoxin crystals. In addition, three strains of B. thuringiensis var. israelensis were also used: AM65-52, kindly provided by Pr. Christina Nelsen LeRoux from the GME laboratory of the National Institute for Agronomical Research (INRA-Jouy-en-Josas), as the anti-dipteran reference strain used in the commercial product Vectobac® [30]; the AR23 strain isolated from Lebanese soil [15]; and the BUPM98 strain isolated from Tunisian soil [31]. All three are active against dipteran larvae—particularly mosquitoes—and produce spherical (S) crystals. Finally, a non-cytolytic novel anti-dipteran strain H3, synthesizing spores and spherical crystals, was also considered in this study [32].
The seven strains were kept as 30% glycerol stock solutions at −80 °C. They were defrosted on LB (Lysogenic broth) agar medium at 30 °C, from which a colony was isolated then plated on a T3 agar medium to simulate the sporulation [33]. Cultures were grown in the following optimized conditions: pH 6.8 and 30 °C for 48 h. At the beginning of our study, the culture medium was inoculated with a number of B. thuringiensis cells corresponding to an optical density of 0.15, which was subsequently spread on the petri dishes containing T3 agar medium.
After 48 h, the crystals and spores of the different strains of B. thuringiensis were separated according to a protocol developed by Monsef et al. [34].

2.2. Scanning Electron Microscopy (SEM) Image Acquisition

A Hitachi S3200N scanning electron microscope was used to capture the crystal and spore images. With a voltage of 15 KV, the distance between the sample and the target was set at 4 mm. A simple preparation protocol was put in place in order to always have the same concentration of crystals and spores for the different strains when taking SEM images: 100 μL of the stock solution (solution of pure crystals or spores, or a mixture of crystals and spores) was added to 1900 μL of distilled water, to obtain a total of 2 mL. The tube was sonicated for 5 min at a frequency of 37 kHz to break up the aggregation and then the tube was vortexed. After that, 50 μL was taken from the tube and placed on the sample holder covered with cleaved Mica. The sample holder was then placed in an oven at 37 °C to dry. After drying, the sample was metallized, forming a 2.5 nm gold-palladium deposit to allow the crystals and spores to become conductive. Finally, the sample was placed in the vacuum chamber of the SEM and images were taken.

2.3. Spore/Crystal Size Measurement Protocol

Spore and crystal size measurements were performed using the ImageJ (NIH, USA) software. Figure 1 illustrates examples of crystal and spore size measurements. For bipyramidal crystals, the height of the bipyramid (2 h) and the side of the square constituting the bipyramid base (BS) were measured (Figure 1a,b). For cubic crystals, the side of the square (SS) was measured (Figure 1a). For spherical crystals, the perimeter of the circle observed in the images was measured and the mean radius (r) of the sphere synthesized by the israelensis strains and strain H3 was calculated (Figure 1c). Finally, as shown in Figure 1d, the lengths (L) and the widths (W) of the spores were measured.
The aspect ratio for the bipyramidal crystals was calculated by dividing the base of the square of the bipyramid (BS) by its height (2 h). For the spores, the aspect ratio was determined by dividing the width of the spore (W) by its length (L) [35]. The uncertainty (Unc) was calculated according to Student’s law while taking into account the number of measurements N(larger than 100) and the standard deviation of the N measurements σ X i as follows: U n c = 1.96 × σ X i N . The histograms were then established by choosing the number and widths of bins according to Rice’s rule [36].

2.4. Statistical Analysis of the Data

XLSTAT software was used for the statistical analysis of the morphological data. Normality distributions of the variables were assessed with Kolmogorov–Smirnov tests. An ANOVA single factor test was conducted, followed by multiple comparison Tukey–Kramer post-hoc tests (HSD). The level of significance was set at α = 0.05.

3. Results

3.1. Anti-Lepidopteran Strains: Collection of Bipyramidal and Cubic Crystals

The following depicts the distribution of crystal sizes of the B. thuringiensis var. kurstaki strains in histograms plotted according to the normal distribution.
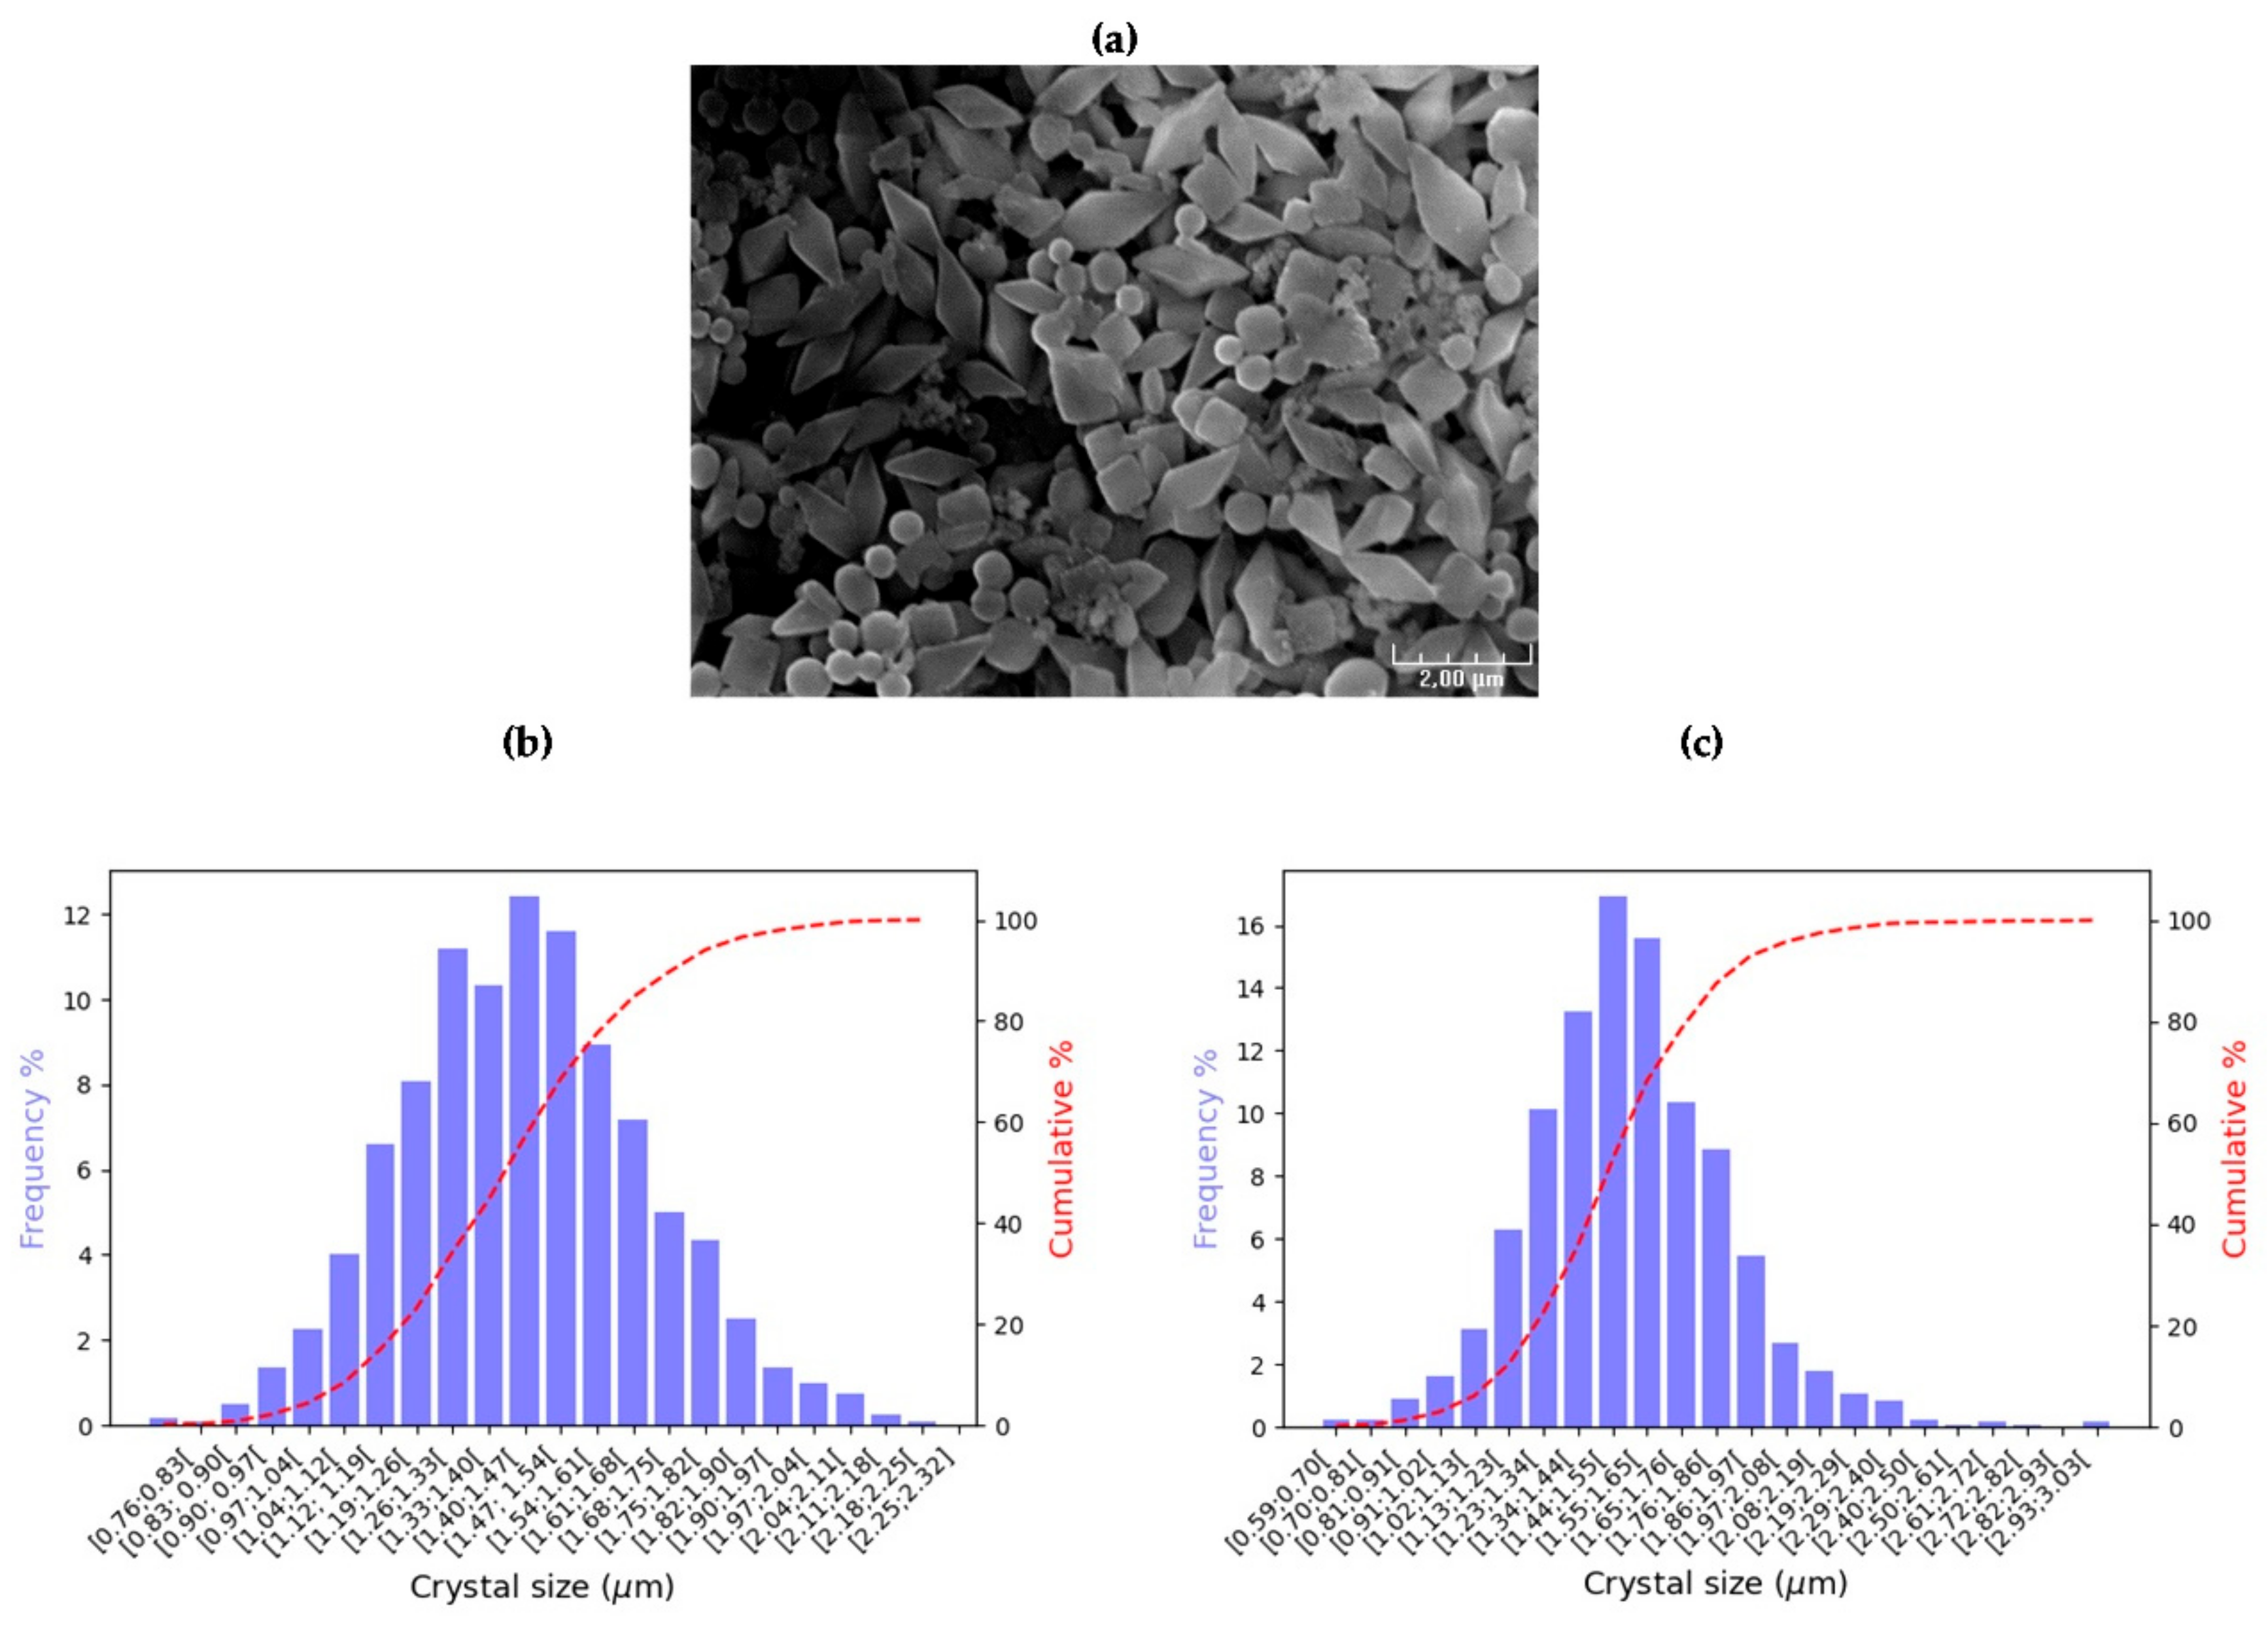
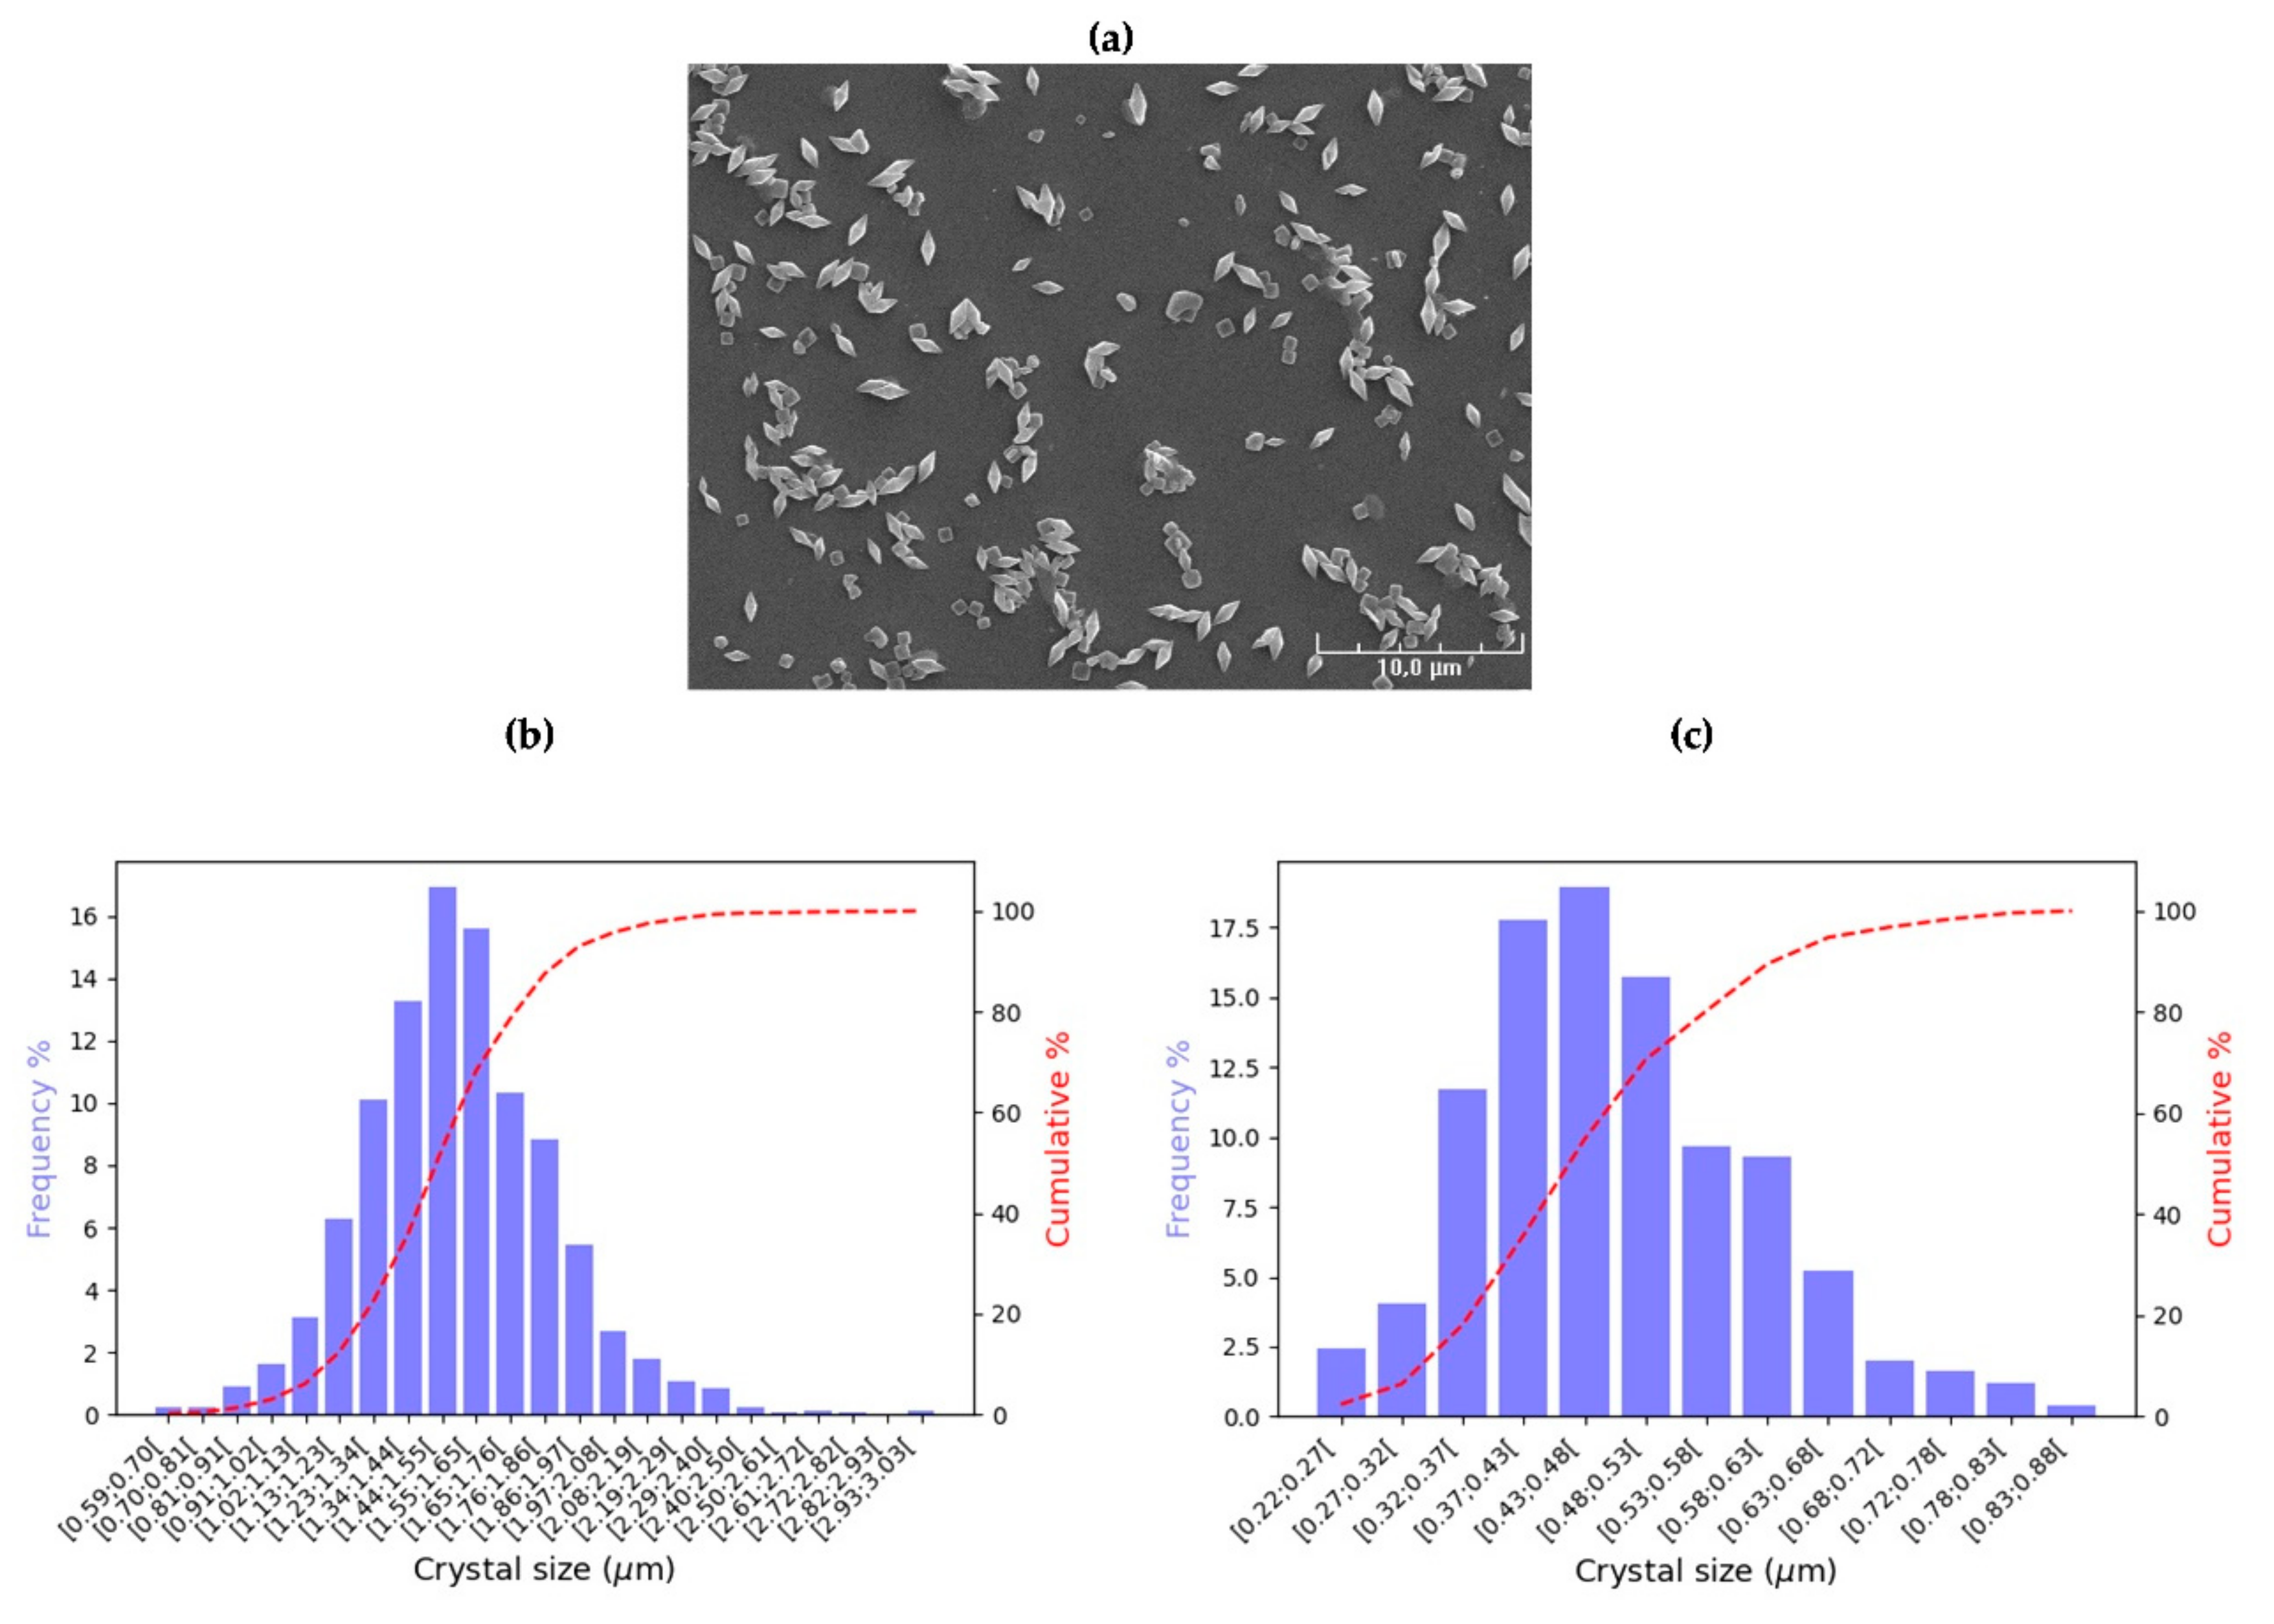
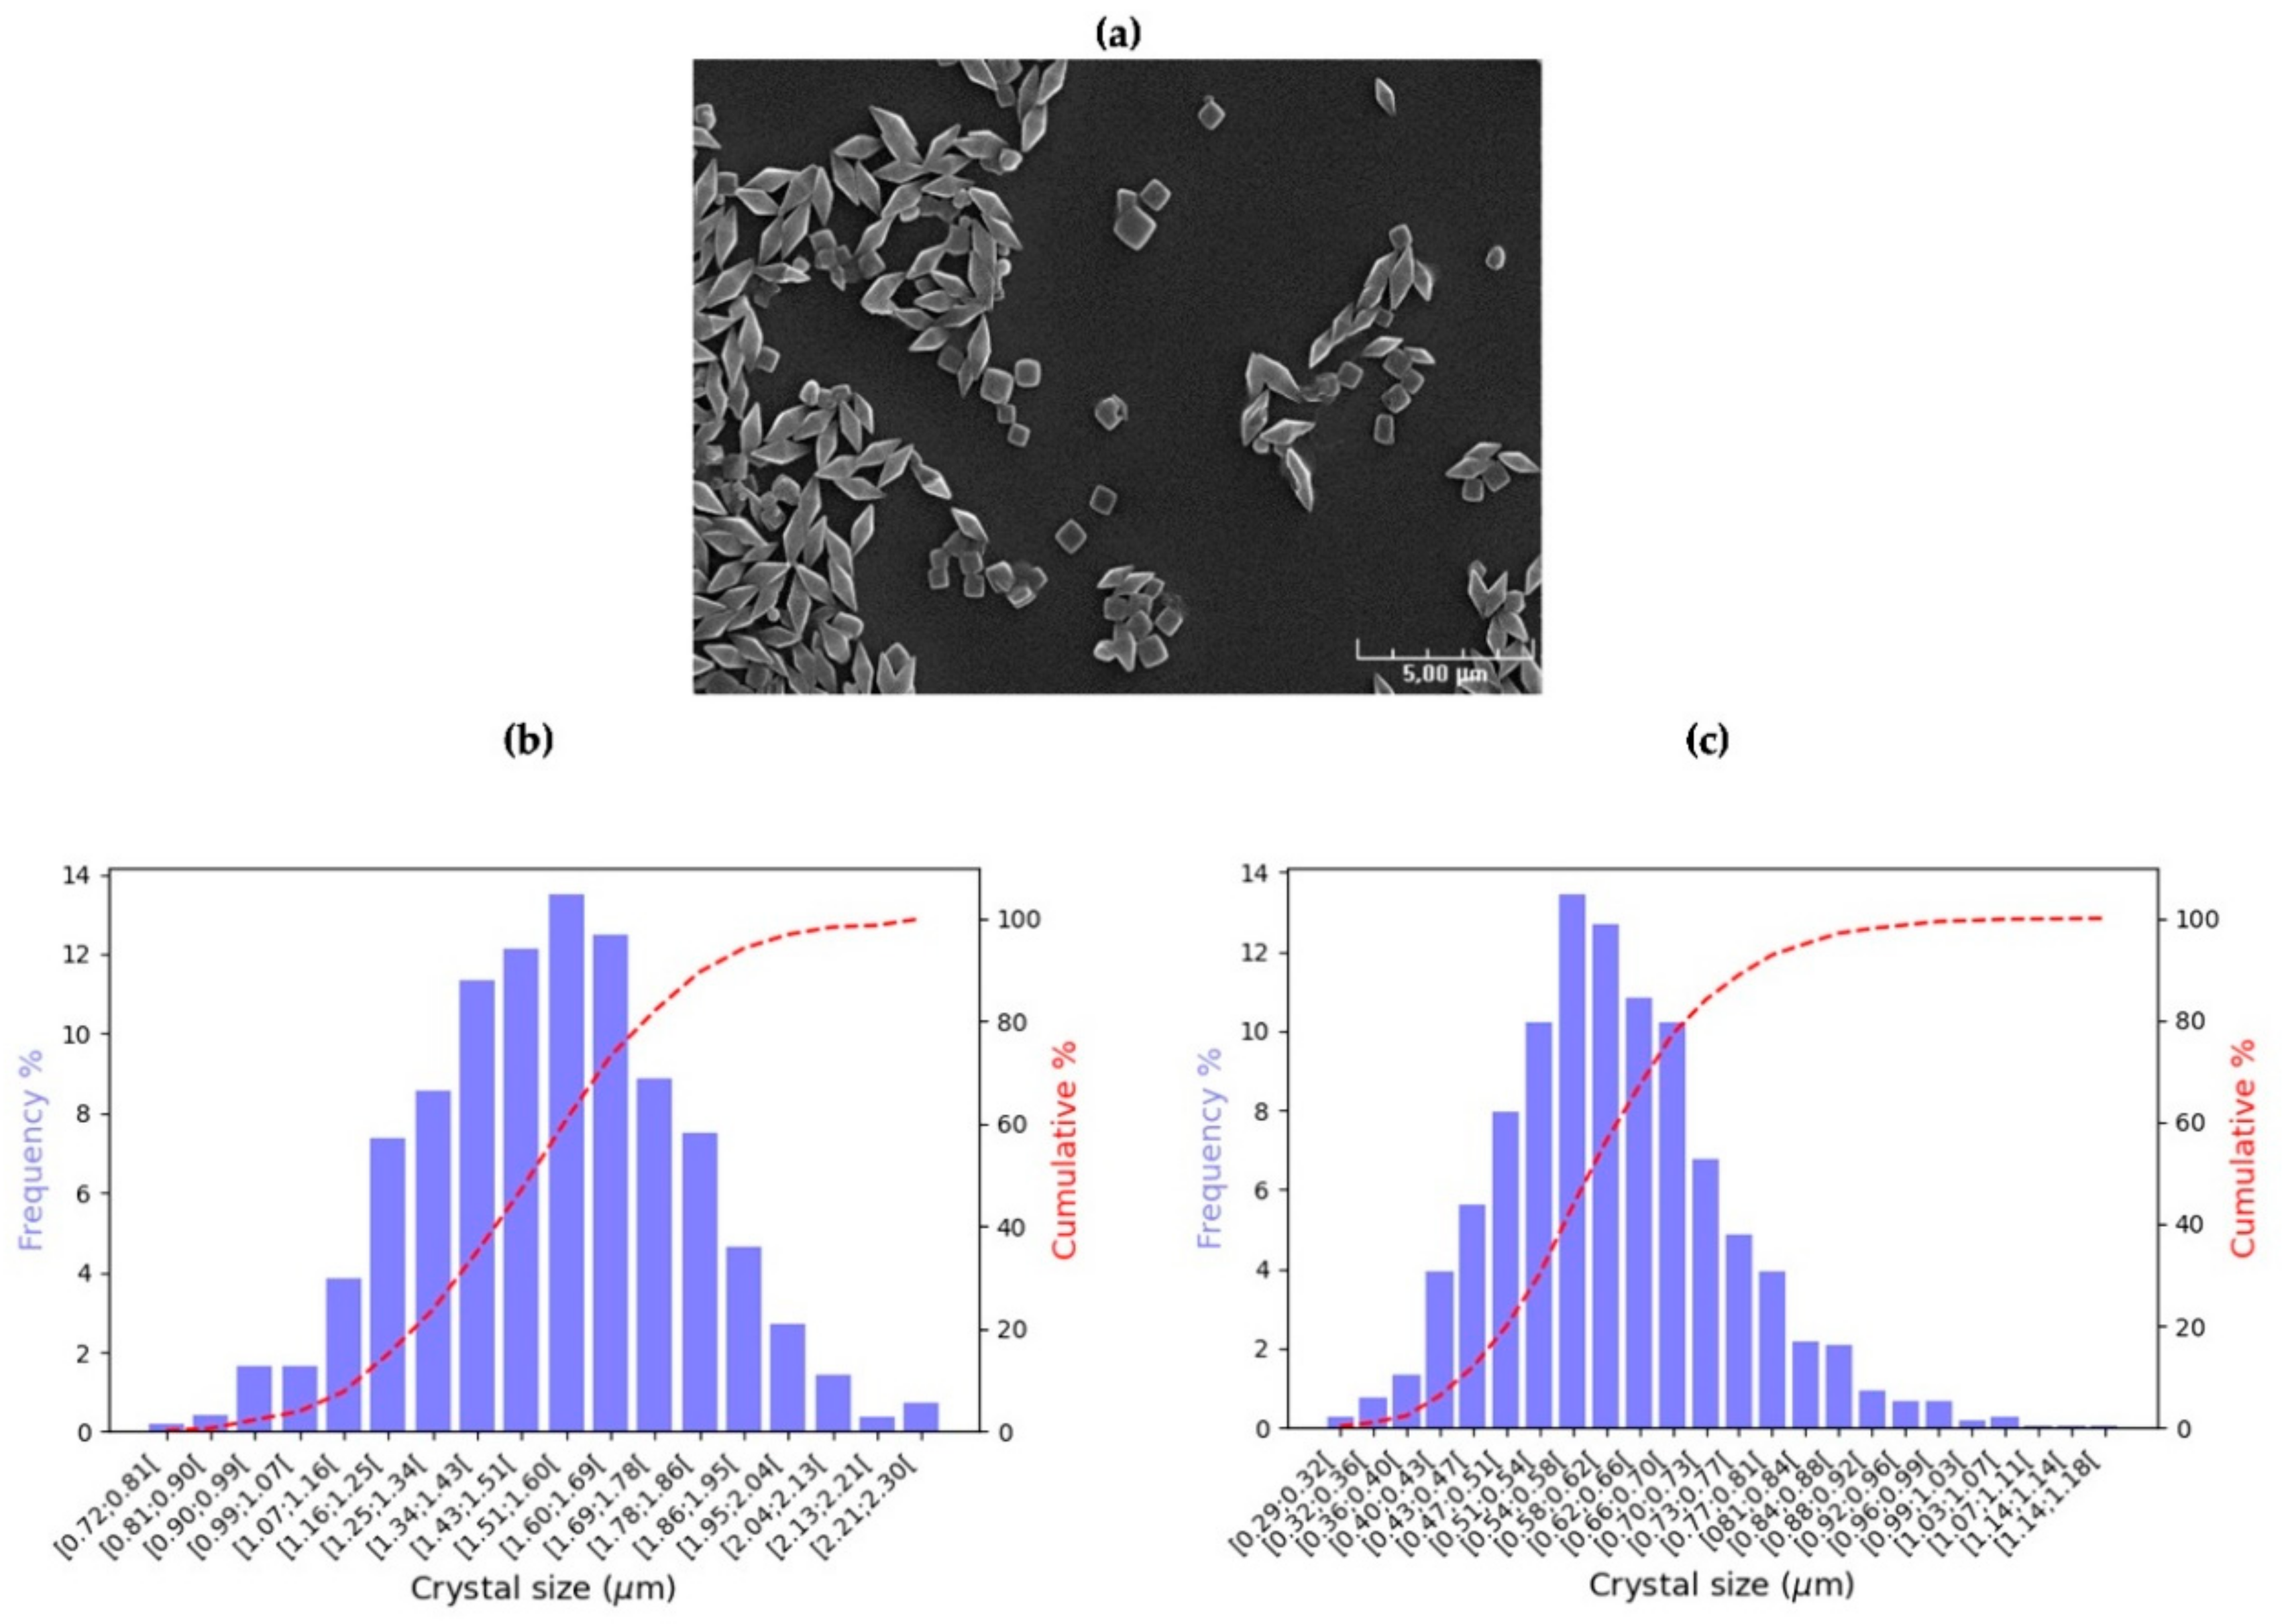
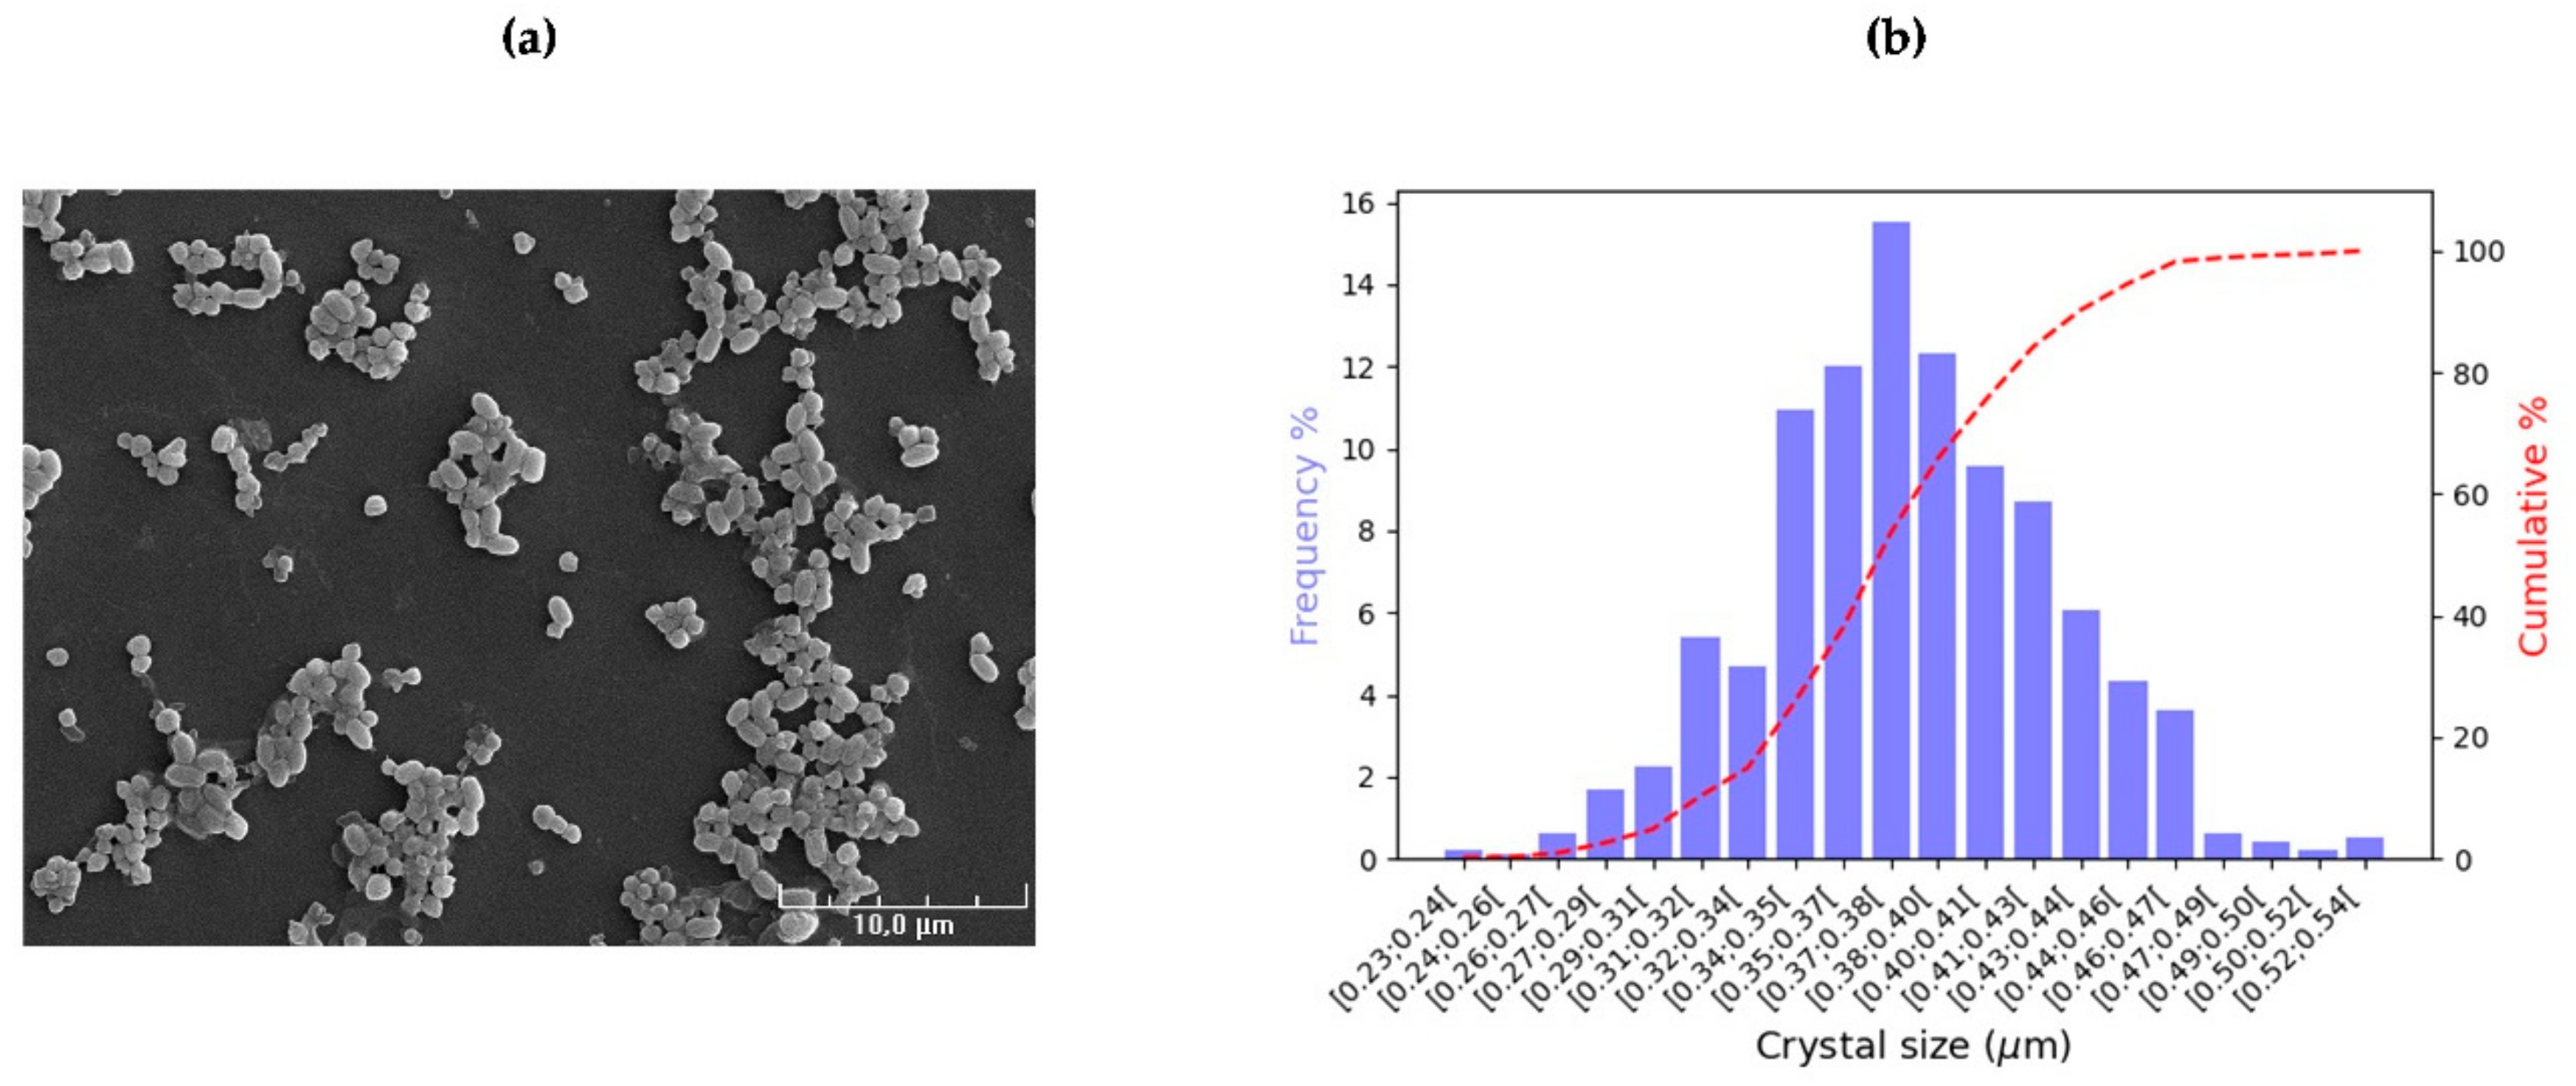
The size distribution of the bipyramidal height was plotted for bipyramidal crystals and the size distribution of square side for the cubic crystals. The x-axis corresponds to the size ranges in micrometers, the left-hand y-axis represents the percentage of crystals and the right-hand y-axis represents the cumulative percentage, as shown in Figure 2, Figure 3 and Figure 4 for B. thuringiensis var. kurstaki strains HD1, LIPMKA and BLB1, respectively. These histograms show a Gaussian distribution for the sizes of bipyramidal and cubic crystals. The average heights of the bipyramidal crystals were 1.508 ± 0.009 μm for the reference B. thuringiensis var. kurstaki strain HD1, 1.549 ± 0.016 μm for the Lebanese LIPMKA strain and 1.531 ± 0.014 μm for the Tunisian BLB1 strain. For the cubic crystals, the average cube edges were 0.573 ± 0.009 μm for the HD1 strain, 0.478 ± 0.014 μm for the LIPMKA strain and 0.614 ± 0.006 μm for the BLB1 strain.
Morphological data for the three kurstaki crystals, and their volumes and aspect ratios are shown in Table 2.
ANOVA univariate analysis revealed significant differences between the three morphological characteristics of bipyramidal crystals with p-values lower than 0.05. The null hypothesis was therefore rejected. Although bipyramidal crystals have roughly the same bipyramidal height (2 h) for the three kurstaki strains, the HSD test revealed a statistically significant difference only between the LIPMKA height value and the HD1 one. As for the volume and the aspect ratio that reflects the shape of bipyramid, the post-hoc test highlighted statistically significant differences between the three kurstaki strains. The bipyramidal crystals of LIPMKA were the most stretched and the least voluminous crystals of the three strains, and those of HD1 were the shortest and the most voluminous (Table 2a). Finally, for cubic crystals, the null hypothesis was also rejected (p = 0), and the HSD test displayed significant differences among the three kurstaki strains: BLB1 synthesized the most voluminous cubic crystals and LIPMKA the least voluminous ones.
These three strains carry Cry protein coding genes from the same families, with small variations in the amino acid compositions of the proteins. This includes four Cry1 coding genes, whose produced proteins are responsible for the bipyramid-shaped crystals, and two Cry2 coding genes, producing a cubic crystal [9,20].

3.2. Anti-Dipteran Strains: Spherical Crystals by Israelensis and Kin

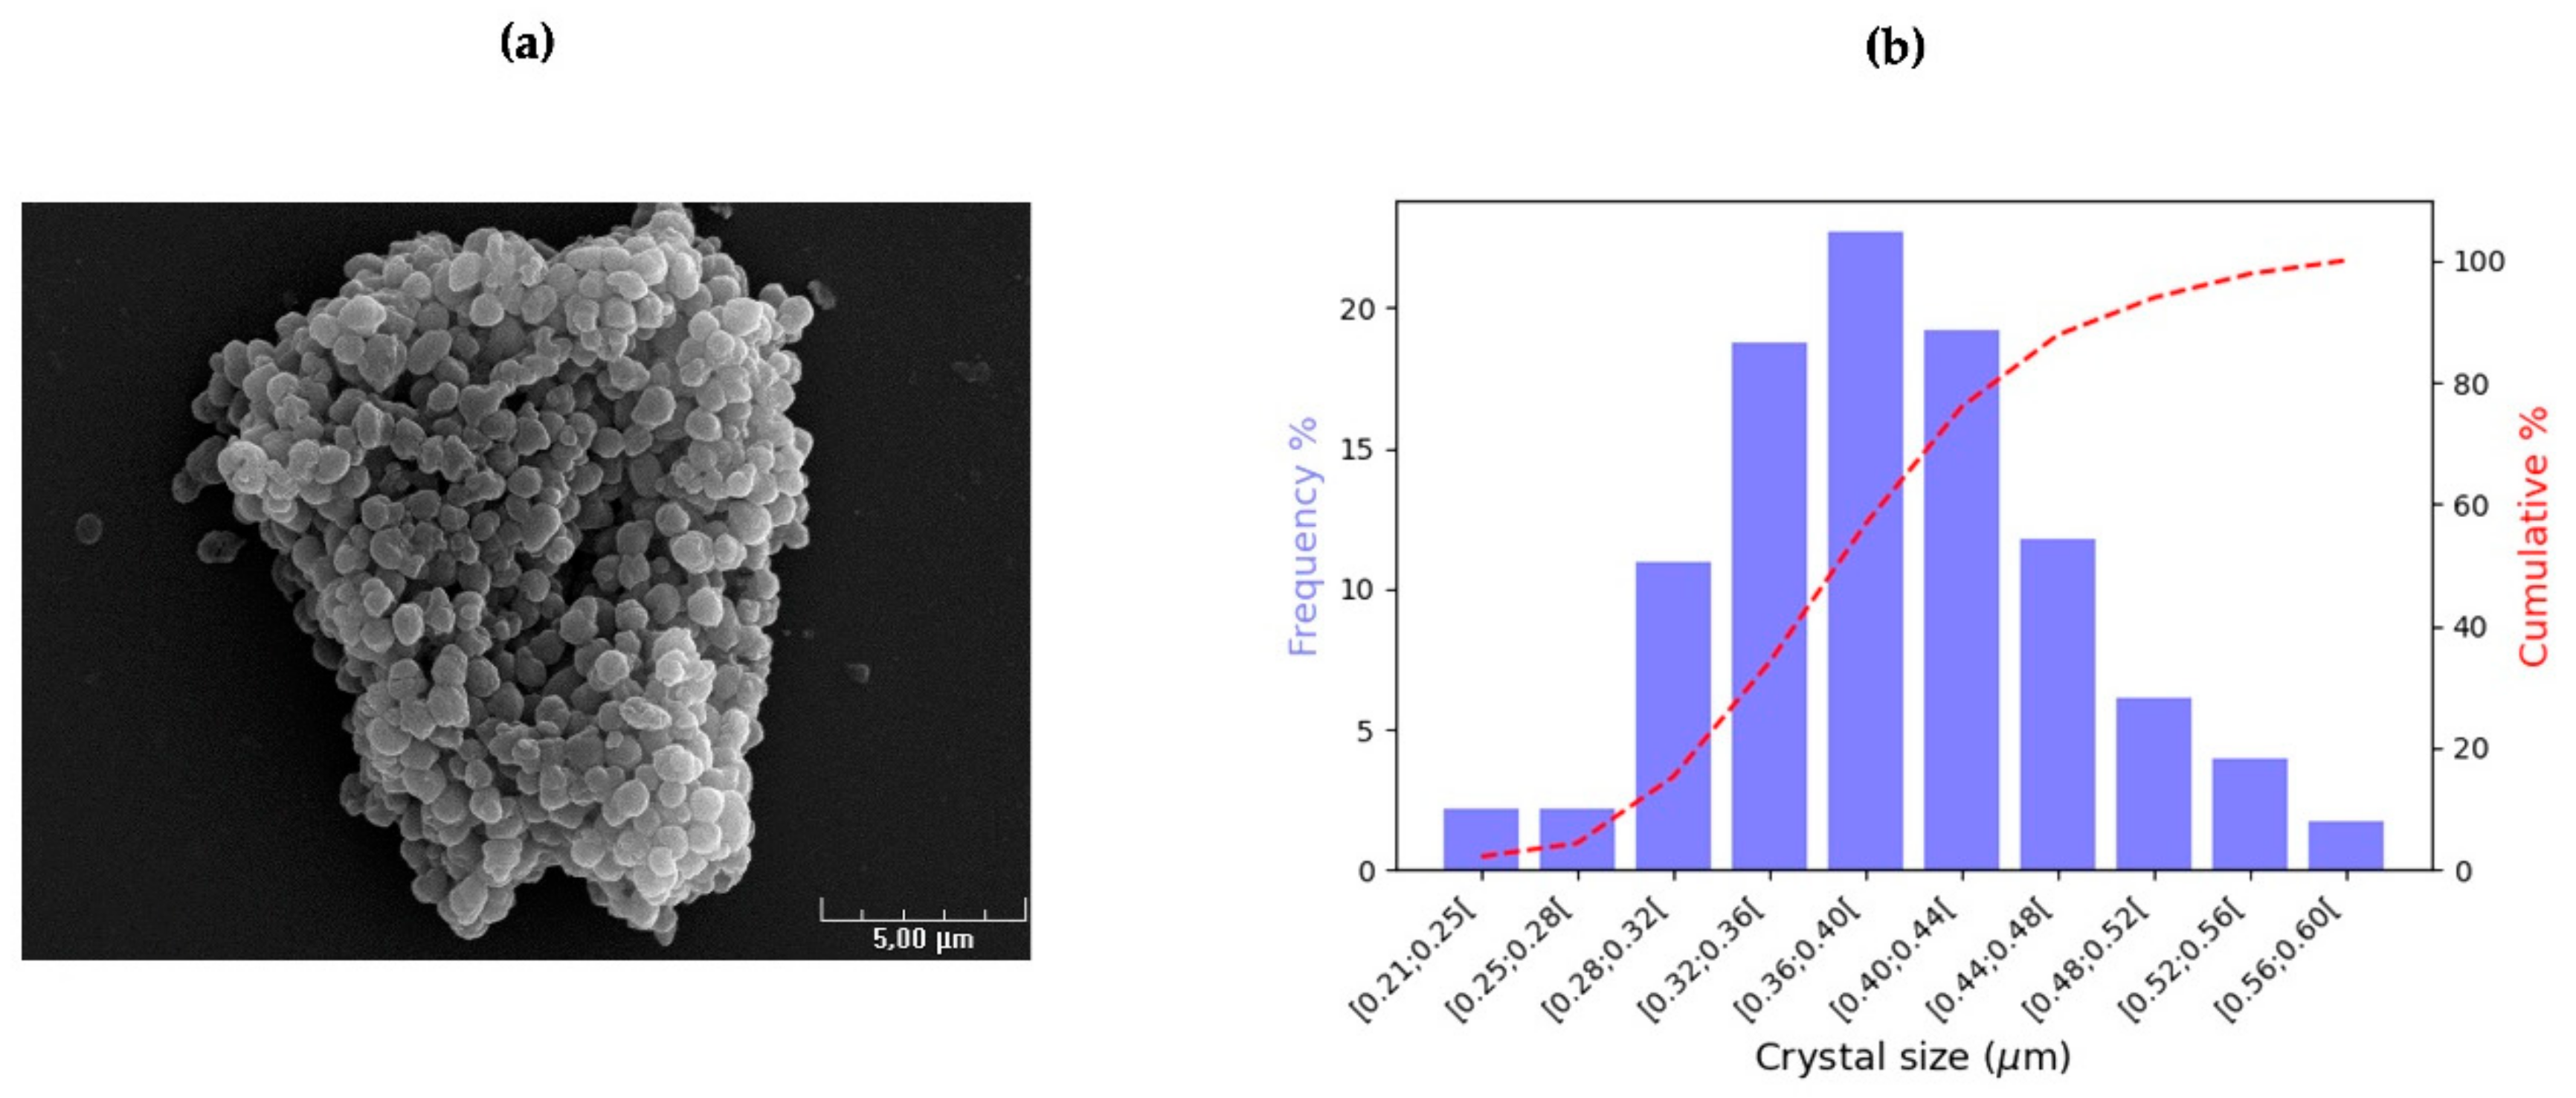
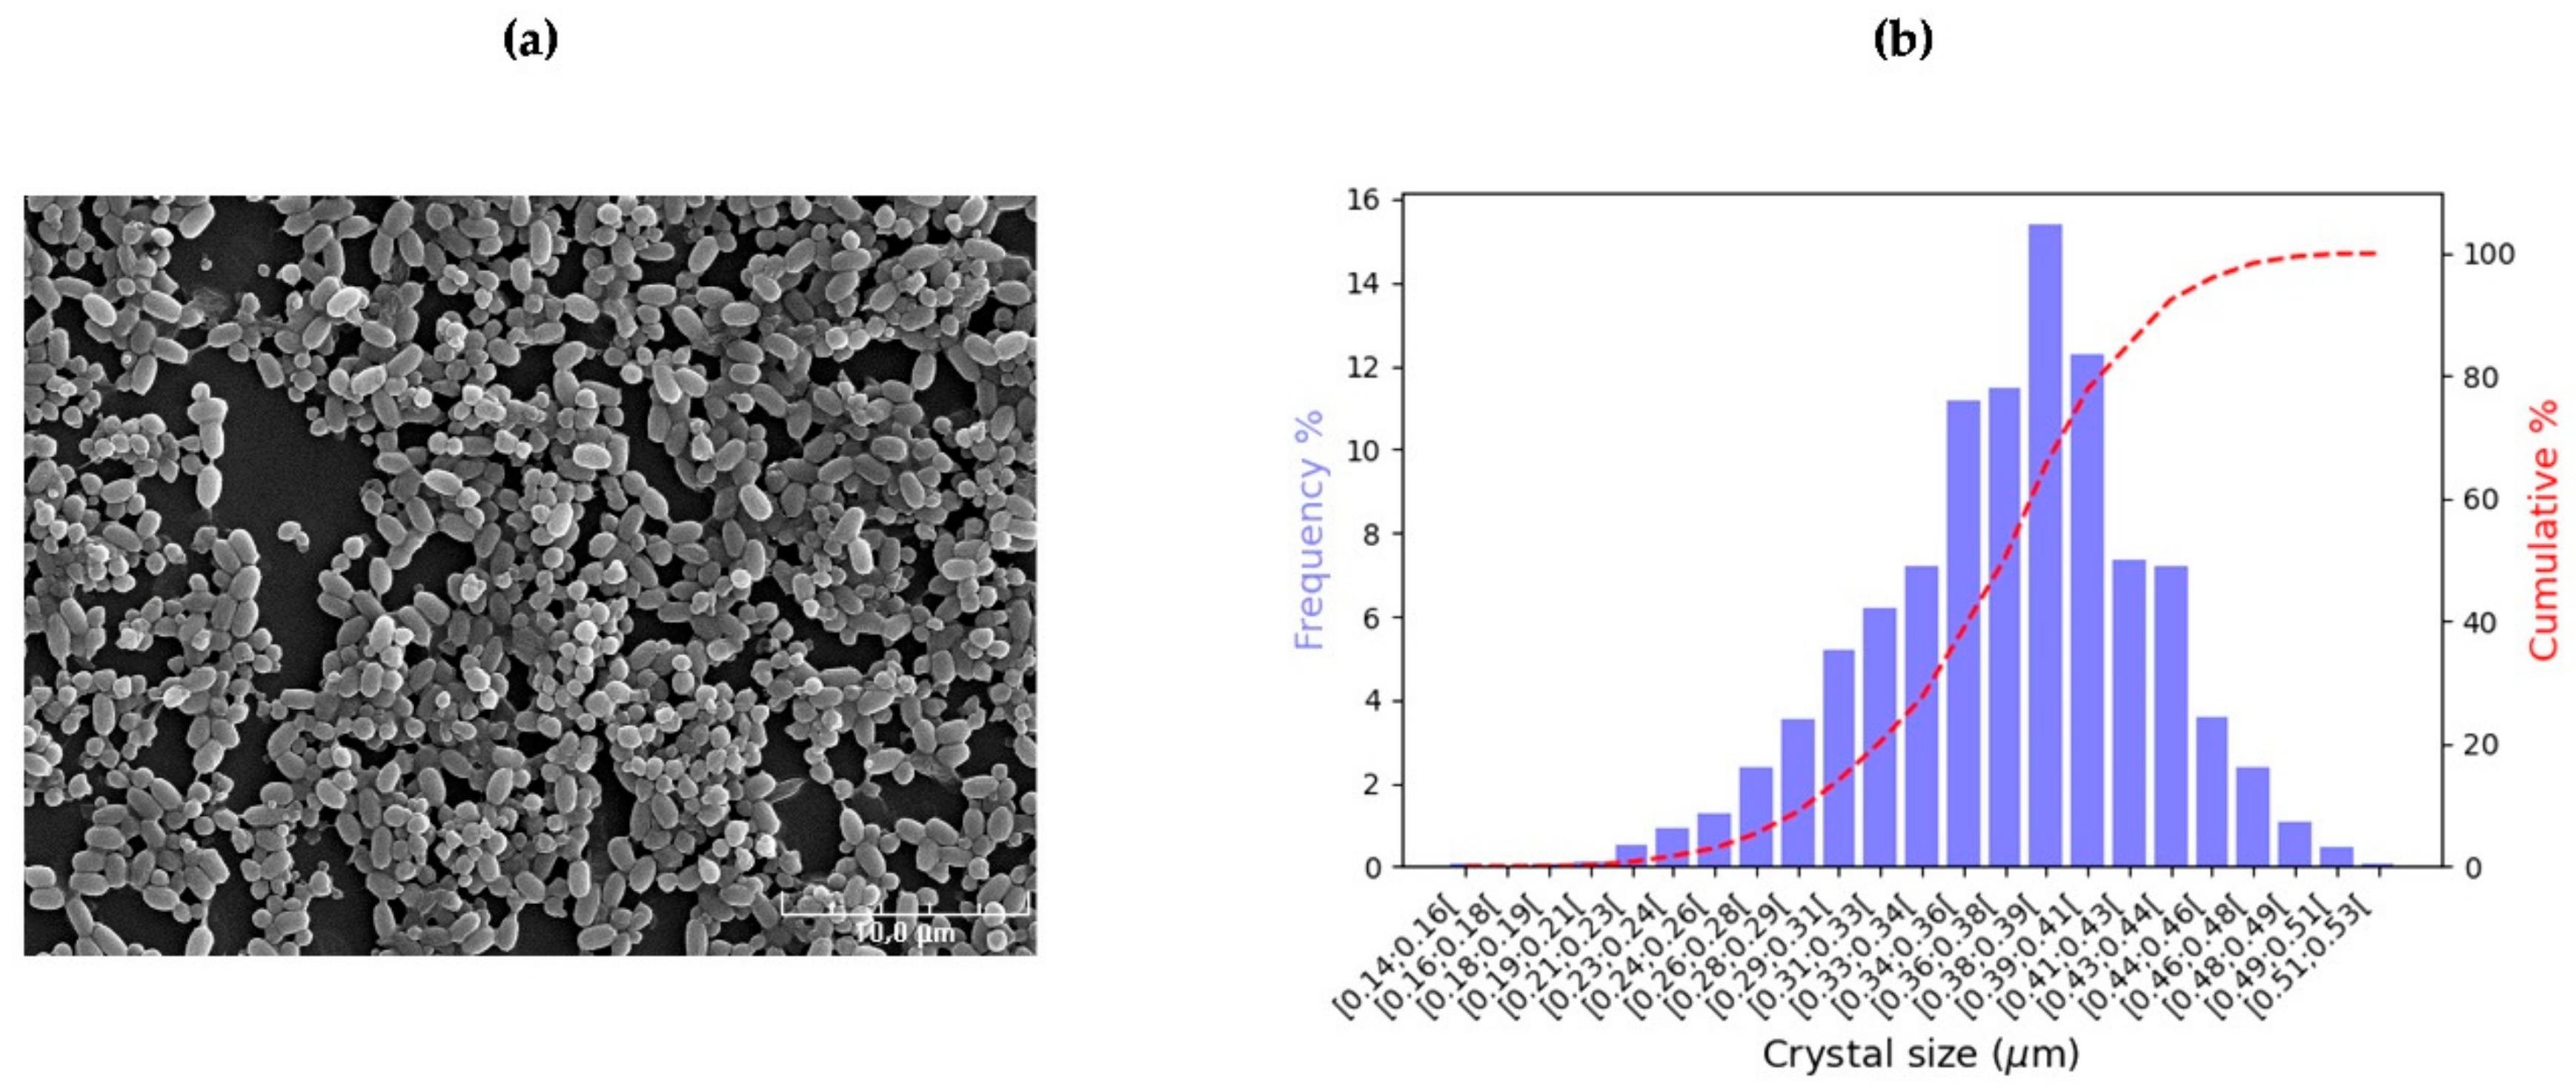
The three israelensis strains, AM65-52, AR23 and BUPM98, and H3, a novel non-israelensis anti-dipteran strain belonging to a different phylogenetic group, produce spherical crystals. Histograms in Figure 5, Figure 6, Figure 7 and Figure 8 represent the size distributions of the crystal radius, calculated as shown in Figure 1c. ANOVA univariate analysis showed significant differences between the strains (p = 0). Multi-comparison HSD tests indicated significant differences among the four strains. The sphere radius increased from the lowest value of 0.370 ± 0.003 μm for the Tunisian BUPM98 strain, to 0.381 ± 0.003 μm for the Lebanese AR23 strain and 0.394 ± 0.009 μm for the reference B. thuringiensis var. israelensis strain AM65-52; and reached the highest value of 0.411 ± 0.003 μm for the Lebanese non-israelensis strain H3.
The crystal components of the israelensis strains are highly different than that of H3, with H3 having a peculiar set of crystal proteins (Table 1).
The morphological data of the spherical crystals and their volumes are summarized in Table 3.
ANOVA univariate analysis (p = 0) followed by HSD test revealed a small, and yet statistically significant variation among spherical crystal volumes. Crystals of B. thuringiensis var. israelensis strain AM65-52 showed the largest volume of 0.283 ± 0.021 µm3. Furthermore, the crystal volume of the non-israelensis strain H3 was significantly larger than those synthesized by the israelensis strains AR23 and BUPM98, as indicated by the HSD tests.

3.3. B. thuringiensis Spore Morphology and Size Distribution

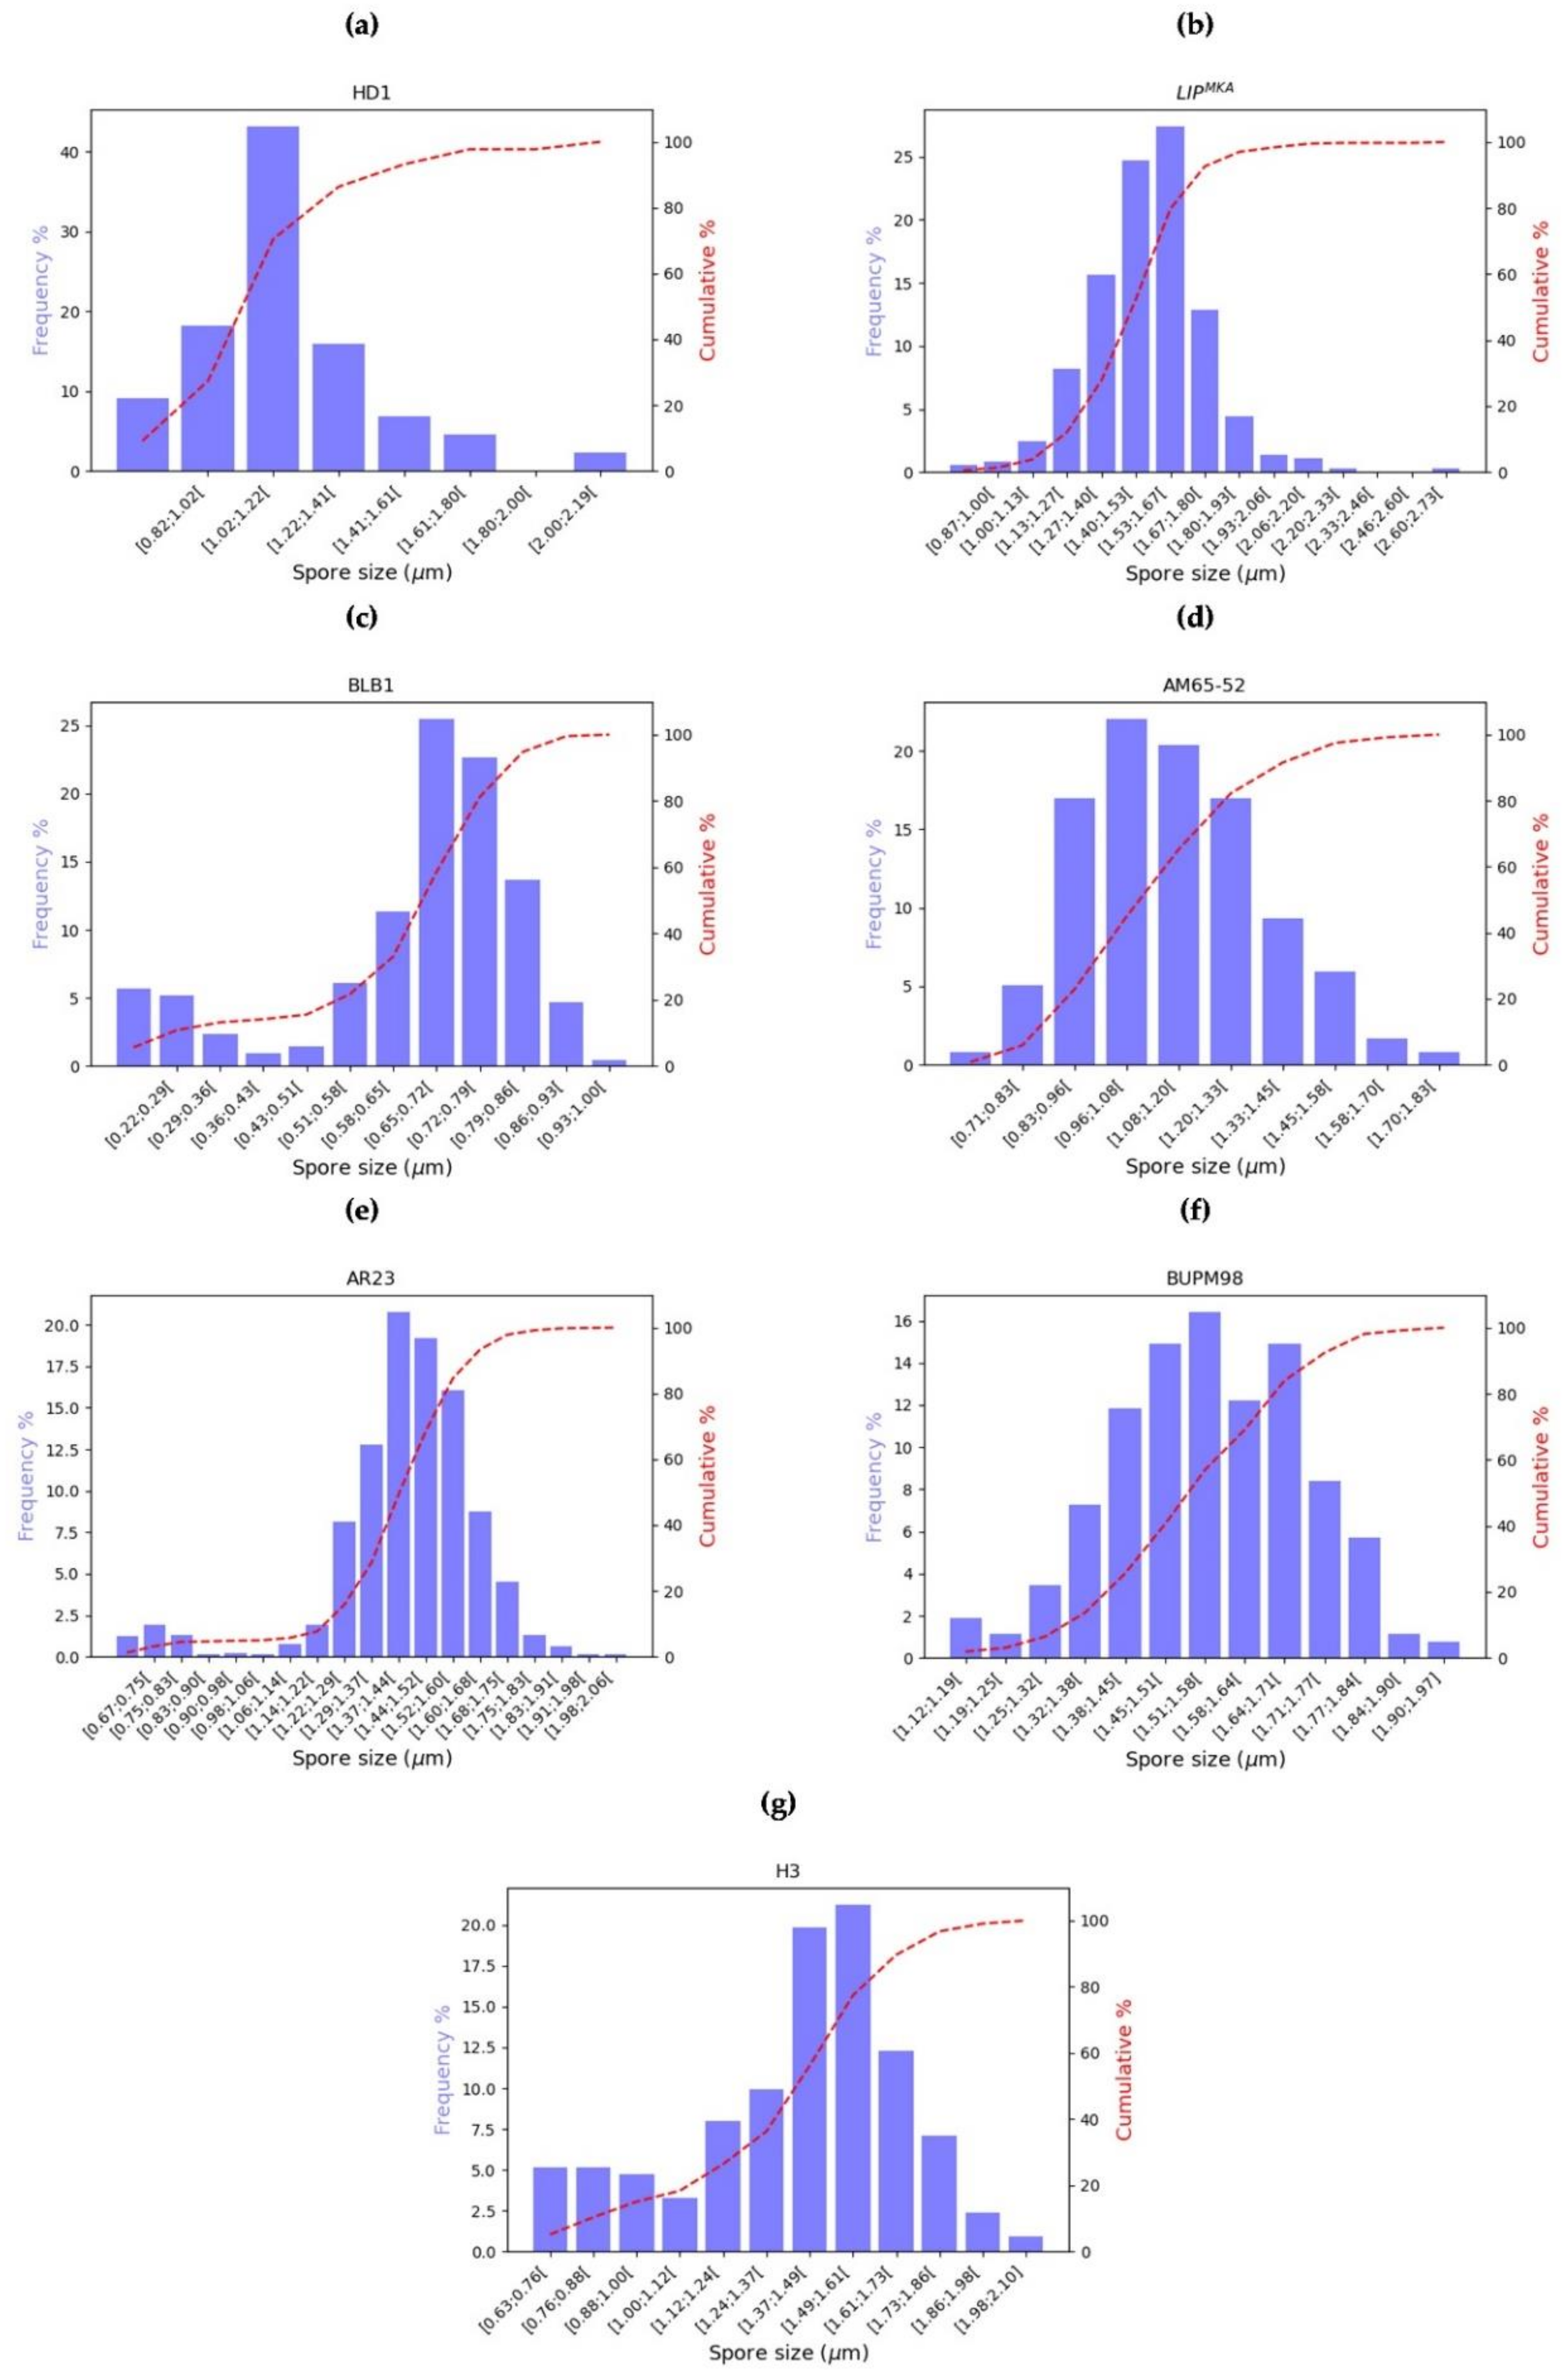
After analyzing the morphological results for the crystals of the different strains, we analyzed the morphological data of their spores, in order to see if we could find any differences in size and shape among the different strains of B. thuringiensis. Histograms of the size distribution of the spore length for the seven strains are presented according to the normal distribution. The x-axis corresponds to the spore size ranges, the left-hand y-axis represents the percentage of the number of spores belonging to the ranges and the right-hand y-axis represents the cumulative percentage (Figure 9).
While comparing spore size distribution histograms, a variation in the mean size values of the different strains was noticed. For instance, when comparing kurstaki strains, the highest frequency of measured spores for HD1 has a size of [1.02–1.22] µm, compared to a larger size of [1.53–1.68] µm for LIPMKA and a smaller one for BLB1, [0.65–0.72] µm. Similar variation was also observed for israelensis strains, for which spore length showed highest frequency in the intervals [0.96–1.08], [1.37–1.44] and [1.51–1.58] µm for AM65-52, AR23 and BUPM98, respectively. This difference was also obtained in the variation of the average spore width observed for each of the seven B. thuringiensis strains, as shown by the morphological data reported in Table 4.
Since the length mean values between the seven strains were significantly different (p = 0), the null hypothesis was rejected. The HSD test shows that spores of LIPMKA were statistically different from the other kurstaki strains. This significant difference was also observed between the length mean values of H3 spores and those of the israelensis strains, and between AM65-52 on one hand and AR23 and BUPM98 on the other. No statistical difference was detected between AR23 and BUPM98 strains.
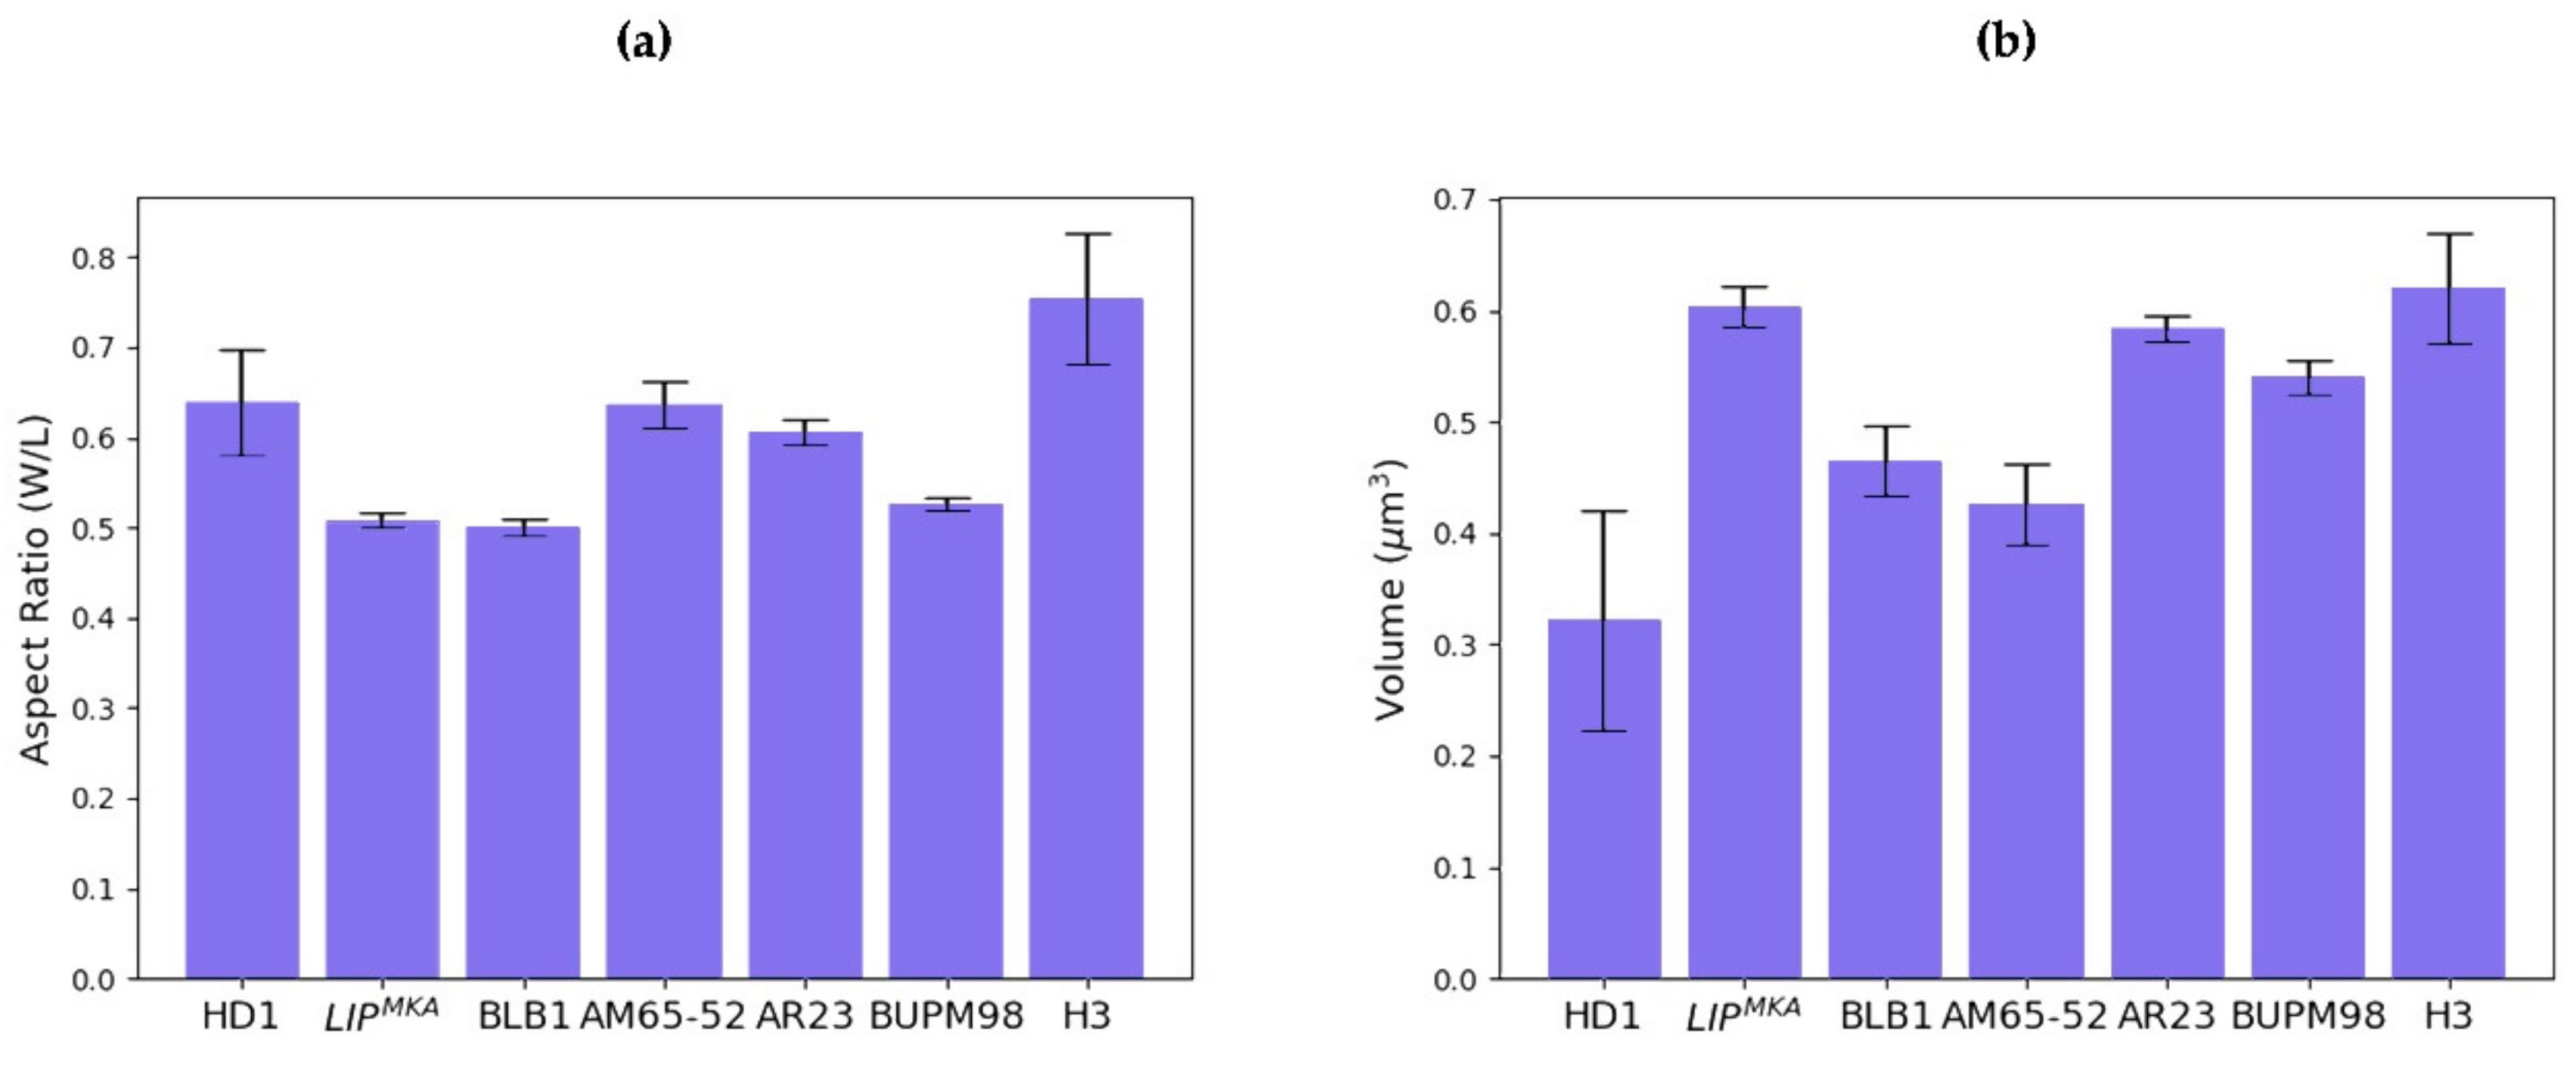
In order to better analyze the morphological results of the spores, we represent in Figure 10 the variation of the aspect ratio and the spores’ volume for the seven considered strains.
The aspect-ratio of the spores produced by anti-dipteran strains presents a statistically significant difference (p = 0). HSD post-hoc test revealed significant difference between AM65-52 and BUPM98, whereas no difference between BUPM98 and AR23 was detected. Among the israelensis strains, AM65-52 spores are the most spherical. H3 strain synthesizes spores that are more spherical in shape than the israelensis strains, since they presented the highest aspect ratio of 0.754 ± 0.072. This was also revealed by the post-hoc HSD test. As for the anti-lepidopteran strains, a significant difference was also detected (p = 0). HSD test showed no significant difference between the aspect ratios of LIPMKA and BLB1, meaning that they form spores with identical shapes. However, the spores synthesized by the reference kurstaki strain HD1 are more spherical since they are significantly different from those of the two other kurstaki strains.
Concerning the spore volumes, two remarks are noteworthy. First, the reference B. thuringiensis var. kurstaki strain HD1 and BLB1 strain produce spores with much smaller volumes than their fellow kurstaki strain LIPMKA, with average volumes of 0.476 ± 0.104, 0.465 ± 0.032 and 0.603 ± 0.018 μm3 respectively. Indeed, a significant statistical difference (p = 0) was highlighted and the HSD test distinguished the volume of the LIPMKA strain from those of the two other kurstaki strains. Second, for the strains synthesizing spherical crystals (p = 0), the reference strain AM65-52 produced the less voluminous spores with an average volume of 0.426 ± 0.036 μm3, compared to more voluminous spores produced by BUPM98, AR23 and H3, with average volumes of 0.540 ± 0.015, 0.584 ± 0.012 and 0.620 ± 0.049 μm3, respectively. In this case, the null hypothesis was rejected (p = 0), and the HSD test showed a difference in the statistical data between the spore volume of AM65-52 and the other israelensis strains, whereas no difference was revealed between AR23 and BUPM98. Furthermore, HSD test exhibited a significant difference between AM65-52 and H3.

4. Discussion

In this study, the morphologies and size distributions of the crystals and spores of seven different strains of Bacillus thuringiensis were analyzed, with an emphasis on the two most used and studied serovars: the anti-lepidopteran reference serovar, kurstaki, and the anti-dipteran one, israelensis, in addition to a strain with anti-dipteran activity, but that is phylogenetically different from the latter group.
On one hand, we found that all kurstaki strains synthesize bipyramidal crystals with sizes that are statistically different. HD1 produces the most voluminous and shortest bipyramidal crystals, and LIPMKA produces the least voluminous ones with a more stretched form than the other two—a characteristic related to the way that the crystal proteins are associated together. As for the cubic ones, a significant variation was observed in crystal size between strains, with BLB1 showing the largest cubic crystal and LIP the smallest one. Composition of the bipyramidal and cubic crystal protein coding genes of the three B. thuringiensis var. kurstaki strains HD1, LIPMKA and BLB1 showed little alteration in the coding DNA sequences and the promotor regions. In fact, these strains, being from the same serovar, showed high DNA sequence similarity in their toxin-carrying plasmids. However, the level of expression of the toxin coding genes, particularly those encoding proteins of the Cry2 family and producing cubic crystals, needs further investigation to elucidate the reason behind the larger size of the BLB1 cubic crystals.
As for the B. thuringiensis var. israelensis strains, it is remarkable that AM65-52 crystal showed a larger volume than those of AR23 and BUPM98, despite having one less Cry4B protein, thanks to a pseudogeneized version of a cry4Ba gene in AM65-52, vs. a functional one in AR23 and BUPM98 [15]. This pseudogeneized cry4Ba gene in AM65-52 means that the corresponding protein is absent from this strains’ crystal, but is present in those of AR23 and BUPM98, as shown in previous studies [15,28]. In this case as well, a difference in the expression rate and copy numbers of the protein variants in the crystal, found in all three strains, cannot be excluded and requires further transcriptomic and proteomic analysis.
Furthermore, the H3 strain synthesizes larger spherical crystals than the israelensis strains. This is most likely due to a different crystal protein composition and the fact that H3 belongs to a different phylogenetic cluster [32].
Nevertheless, we must keep in mind the fact that a change of culture medium does affect the production of B. thuringiensis crystals and their size [37]. Hence, this morphological analysis should be conducted after production in various culture media in order to select the optimal one for the best crystal yield.
On the other hand, in this study, we took a closer look at the intra- and inter-serovar differences of the size and shape (length, width, volume and aspect ratio) of B. thuringiensis spores, whereas previous studies focused on the spore size distribution among various Bacillus species [35,38,39]. Nonetheless, the variations of morphological attributes of spores among B. thuringiensis serovars were yet to be elucidated, and that was the focus of our study. Our results did show variations within all these parameters, proving that the spores of the various strains within the same serovar are not identical. Therefore, we first calculated the aspect ratios of the spores of the various strains, allowing us to show that H3 spores are more circular than all the others. As for the intra-serovar variability, HD1 and AM65-52 produce spores that are less ellipsoidal than their fellow Lebanese and Tunisian kurstaki and israelensis strains, respectively. In addition, the spores of the reference B. thuringiensis var. israelensis strain AM65-52 have a smaller volume to the israelensis Lebanese AR23 and Tunisian BUPM98 strains, much like the kurstaki strains in which the reference strain HD1 produces less voluminous spores than the Lebanese LIPMKA. While their number is affected by the change of culture media, the size of B. thuringiensis spores is not [37]. The causes of variation in spore size and morphology are still unknown. Nevertheless, a key player in this variation might be related to the spore forming units, from the inside-out, endospore, cortex, spore-coat, interspace and exosporium basal layer and nap [40]. A change in the size of one of these units, particularly the thickness of the exosporium layers and/or the interspace between the cortex and the exosporium basal layer, can cause a change in the spore size. In B. anthracis spores, the genes responsible for the formation and volume change of each spore unit are well described. Indeed, there is chromosomal genetic relatedness between B. antharcis and B. thuringiensis, and a closeness in spore morphology, allowing the use of B. thuringiensis spores as B. anthracis surrogates in aerosolization tests [39]. However, a detailed description of B. thuringiensis spore forming units and genes is yet to be presented. In this study, we were not able to extract a direct correlation between this variation and the genomic components of the strains, e.g., plasmid size and nature.
With regard to the prospects of this study, a thorough genomic, transcriptomic and proteomic study should be conducted to elucidate the variations of crystal and spore sizes within the same family. In addition, this study could pave the way to future morphological analysis of B. thuringiensis crystals and spores using another optical method, such as laser speckle imaging.

Author Contributions

Conceptualization, H.L., N.F., F.P., B.L.J., R.L., M.K., G.L.B. and M.A.; formal analysis, H.L., N.F., F.P., B.L.J., R.L., M.K., G.L.B. and M.A.; methodology, H.L., N.F., F.P., B.L.J., R.L., M.K., G.L.B. and M.A.; resources, M.C., D.B. and M.K.; software, H.L., N.F., M.K. and M.A.; validation, F.P., B.L.J., R.L., M.K., G.L.B. and M.A.; writing—original draft, H.L., N.F., F.P., B.L.J., R.L., M.K., G.L.B. and M.A.; writing—review and editing, H.L., N.F., F.P., B.L.J., R.L., M.K., G.L.B. and M.A. All authors have read and agreed to the published version of the manuscript.

Funding

This research was funded by EranetMed (2-72-093 BIOSMAN); National Council for Scientific Research in Lebanon (CNRS-L/FS-108); Saint Joseph University (USJ-CR/FS-109).

Institutional Review Board Statement

Not applicable.

Informed Consent Statement

Not applicable.

Acknowledgments

H.L. acknowledges the National Council for Scientific Research in Lebanon for granting him a doctoral fellowship. The authors thank Doctor Philippe Elies from the “Plateforme PIMM at Université de Bretagne Occidentale, Brest, France” for scanning electron microscope images.

Conflicts of Interest

The authors declare no conflict of interest.

References

  1. Fayad, N.; Kallassy Awad, M.; Mahillon, J. Diversity of Bacillus cereus sensu lato mobilome. BMC Genom. 2019, 20, 1–11. [Google Scholar] [CrossRef] [PubMed] [Green Version]
  2. EFSA Panel on Biological Hazards (BIOHAZ). Risks for public health related to the presence of Bacillus cereus and other Bacillus spp. including Bacillus thuringiensis in foodstuffs. EFSA J. 2016, 14, e04524. [Google Scholar]
  3. Doganay, M.; Demiraslan, H. Human Anthrax as a Re-Emerging Disease. Recent Pat. Anti-Infect. Drug Discov. 2015, 10, 10–29. [Google Scholar] [CrossRef] [PubMed]
  4. Damalas, C.A.; Koutroubas, S.D. Current status and recent developments in biopesticide use. Agriculture 2018, 8, 13. [Google Scholar] [CrossRef] [Green Version]
  5. Palma, L.; Muñoz, D.; Berry, C.; Murillo, J.; Caballero, P. Bacillus thuringiensis Toxins: An Overview of Their Biocidal Activity. Toxins 2014, 6, 3296–3325. [Google Scholar] [CrossRef] [Green Version]
  6. Bravo, A.; Gill, S.S.; Soberon, M. Mode of action of Bacillus thuringiensis Cry and Cyt toxins and their potential for insect control. Toxicon 2007, 49, 423–435. [Google Scholar] [CrossRef] [Green Version]
  7. Bravo, A.; Likitvivatanavong, S.; Gill, S.S.; Soberón, M. Bacillus thuringensis: A story of a sucessful bioinsecticide. Insect Biochem. Mol. Biol. 2013, 41, 423–431. [Google Scholar] [CrossRef] [Green Version]
  8. Crickmore, N.; Berry, C.; Panneerselvam, S.; Mishra, R.; Connor, T.R.; Bonning, B.C. A structure-based nomenclature for Bacillus thuringiensis and other bacteria-derived pesticidal proteins. J. Invertebr. Pathol. 2020, 107438. [Google Scholar] [CrossRef]
  9. El khoury, M.; Azzouz, H.; Chavanieu, A.; Abdelmalak, N.; Chopineau, J.; Kallassy Awad, M. Isolation and characterization of a new Bacillus thuringiensis strain Lip harboring a new cry1Aa gene highly toxic to Ephestia kuehniella (Lepidoptera: Pyralidae) larvae. Arch. Microbiol. 2014, 196, 435–445. [Google Scholar] [CrossRef]
  10. Elleuch, J.; Jaoua, S.; Darriet, F.; Chandre, F.; Tounsi, S.; Zghal, R.Z. Cry4Ba and Cyt1Aa proteins from Bacillus thuringiensis israelensis: Interactions and toxicity mechanism against Aedes aegypti. Toxicon 2015, 104, 83–90. [Google Scholar] [CrossRef]
  11. de Barjac, H.; Frachon, E. Classification of Bacillus thuringiensis strains. Entomophaga 1990, 35, 233–240. [Google Scholar] [CrossRef]
  12. Xu, D.; Côté, J.-C. Sequence Diversity of the Bacillus thuringiensis and B. cereus sensu lato flagellin (H Antigen) Protein: Comparison with H Serotype Diversity. Appl. Environ. Microbiol. 2006, 72, 4653–4662. [Google Scholar] [CrossRef] [Green Version]
  13. Berry, C.; O’Neil, S.; Ben-dov, E.; Jones, A.F.; Murphy, L.; Quail, M.A.; Holden, M.T.G.; Harris, D.; Zaritsky, A.; Parkhill, J. Complete Sequence and Organization of pBtoxis, the Toxin-Coding Plasmid of Bacillus thuringiensis subsp. israelensis. Appl. Environ. Microbiol. 2002, 68, 5082–5095. [Google Scholar] [CrossRef] [PubMed] [Green Version]
  14. Gillis, A.; Fayad, N.; Makart, L.; Bolotin, A.; Sorokin, A.; Kallassy, M.; Mahillon, J. Role of plasmid plasticity and mobile genetic elements in the entomopathogen Bacillus thuringiensis serovar israelensis. FEMS Microbiol. Rev. 2018, 1–28. [Google Scholar] [CrossRef]
  15. Fayad, N.; Patiño-Navarrete, R.; Kambris, Z.; Antoun, M.; Osta, M.; Chopineau, J.; Mahillon, J.; El Chamy, L.; Sanchis, V.; Kallassy Awad, M. Characterization and Whole Genome Sequencing of AR23, a Highly Toxic Bacillus thuringiensis Strain Isolated from Lebanese Soil. Curr. Microbiol. 2019, 76, 1503–1511. [Google Scholar] [CrossRef] [PubMed]
  16. Liu, G.; Song, L.; Shu, C.; Wang, P.; Deng, C.; Peng, Q.; Lereclus, D.; Wang, X.; Huang, D.; Zhang, J.; et al. Complete Genome Sequence of Bacillus thuringiensis subsp. kurstaki Strain HD73. Genome Announc. 2013, 1, 2–3. [Google Scholar] [CrossRef] [PubMed] [Green Version]
  17. Méric, G.; Mageiros, L.; Pascoe, B.; Woodcock, D.J.; Mourkas, E.; Lamble, S.; Bowden, R.; Jolley, K.A.; Raymond, B.; Sheppard, S.K. Lineage-specific plasmid acquisition and the evolution of specialized pathogens in Bacillus thuringiensis and the Bacillus cereus group. Mol. Ecol. 2018, 27, 1524–1540. [Google Scholar] [CrossRef] [PubMed] [Green Version]
  18. Loutfi, H.; Pellen, F.; Le Jeune, B.; Lteif, R.; Kallassy, M.; Le Brun, G.; Abboud, M. Real-time monitoring of bacterial growth kinetics in suspensions using laser speckle imaging. Sci. Rep. 2020, 10. [Google Scholar] [CrossRef] [PubMed] [Green Version]
  19. Loutfi, H.; Pellen, F.; Le Jeune, B.; Lteif, R.; Kallassy, M.; Le Brun, G.; Abboud, M. Interpretation of the bacterial growth process based on the analysis of the speckle field generated by calibrated scattering media. Opt. Express 2020, 28, 28648–28655. [Google Scholar] [CrossRef]
  20. Nassif, R.; Abou Nader, C.; Rahbany, J.; Pellen, F.; Salameh, D.; Lteif, R.; Le Brun, G.; Le Jeune, B.; Kallassy Awad, M.; Abboud, M. Characterization of Bacillus thuringiensis parasporal crystals using laser speckle technique: Effect of crystal concentration and dimension. Appl. Opt. 2015, 54, 3725–3731. [Google Scholar] [CrossRef]
  21. Manasherob, R.; Zaritsky, A.; Ben-Dov, E.; Saxena, D.; Barak, Z.; Einav, M. Effect of accessory proteins P19 and P20 on cytolytic activity of Cyt1Aa from Bacillus thuringiensis subsp. israelensis in Escherichia coli. Curr. Microbiol. 2001, 43, 355–364. [Google Scholar] [CrossRef] [PubMed]
  22. Shi, Y.X.; Zeng, S.L.; Yuan, M.J.; Sun, F.; Pang, Y. Influence of accessory protein P19 from Bacillus thuringiensis on insecticidal crystal protein Cry11Aa. Wei Sheng Wu Xue Bao 2006, 46, 353–357. [Google Scholar]
  23. Diaz-Mendoza, M.; Bideshi, D.K.; Ortego, F.; Farinós, G.P.; Federici, B.A. The 20-kDa chaperone-like protein of Bacillus thuringiensis ssp. israelensis enhances yield, crystal size and solubility of Cry3A. Lett. Appl. Microbiol. 2012, 54, 88–95. [Google Scholar] [CrossRef] [PubMed]
  24. Ennourri, K.; Hassen, H.B.; Zouari, N. Optimization of bioinsecticides overproduction by Bacillus thuringiensis subsp. kurstaki using linear regression. Pol. J. Microbiol. 2013, 62, 287–293. [Google Scholar] [CrossRef] [PubMed]
  25. Perani, M.; Bishop, A.H. Effects of media composition of delta-endotoxin production and morphology of Bacillus thuringiensis in wild types and spontaneously mutated strains. Microbios 2000, 101, 47–66. [Google Scholar]
  26. Yezza, A.; Tyagi, R.D.; Valéro, J.R.; Surampalli, R.Y. Bioconversion of industrial wastewater and wastewater sludge into Bacillus thuringiensis based biopesticides in pilot fermentor. Bioresour. Technol. 2006, 97, 1850–1857. [Google Scholar] [CrossRef] [PubMed]
  27. Smith, R.A. Effect of strain and medium variation on mosquito toxin production by Bacillus thuringiensis var. israelensis. Can. J. Microbiol. 1982, 28, 1089–1092. [Google Scholar] [CrossRef]
  28. Day, M.; Ibrahim, M.; Dyer, D.; Bulla, L. Genome sequence of Bacillus thuringiensis subsp. kurstaki strain HD-1. Genome Announc. 2014, 2, 613–627. [Google Scholar] [CrossRef] [Green Version]
  29. Saadaoui, I.; Rouis, S.; Jaoua, S. A new Tunisian strain of Bacillus thuringiensis kurstaki having high insecticidal activity and δ-endotoxin yield. Arch. Microbiol. 2009, 191, 341–348. [Google Scholar] [CrossRef]
  30. Bolotin, A.; Gillis, A.; Sanchis, V.; Nielsen-LeRoux, C.; Mahillon, J.; Lereclus, D.; Sorokin, A. Comparative genomics of extrachromosomal elements in Bacillus thuringiensis subsp. israelensis. Res. Microbiol. 2017, 168, 331–344. [Google Scholar] [CrossRef] [Green Version]
  31. Zribi Zghal, R.; Kharrat, M.; Rebai, A.; Ben Khedher, S.; Jallouli, W.; Elleuch, J.; Ginibre, C.; Chandre, F.; Tounsi, S. Optimization of bio-insecticide production by Tunisian Bacillus thuringiensis israelensis and its application in the field. Biol. Control. 2018, 124, 46–52. [Google Scholar] [CrossRef]
  32. Fayad, N. Analysis of Mobile Genetic Elements in the Genomes of Bacillus thuringiensis and Bacillus cereus. Ph.D. Thesis, Université Saint-Joseph de Beyrouth and Université Catholique de Louvain, Beirut, Liban, 2020. [Google Scholar]
  33. Travers, R.S.; Martin, P.A.W.; Reichelderfer, C.F. Selective Process for Efficient Isolation of Soil Bacillus spp. Appl. Environ. Microbiol. 1987, 53, 1263–1266. [Google Scholar] [CrossRef] [PubMed] [Green Version]
  34. Rahbani Mounsef, J.; Salameh, D.; Kallassy Awad, M.; Chamy, L.; Brandam, C.; Lteif, R. A simple method for the separation of Bacillus thuringiensis spores and crystals. J. Microbiol. Methods 2014, 107, 147–149. [Google Scholar] [CrossRef] [PubMed] [Green Version]
  35. Carrera, M.; Zandomeni, R.; Fitzgibbon, J.; Sagripanti, J.-L. Difference between the spore sizes of Bacillus anthracis and other Bacillus species. J. Appl. Microbiol. 2007, 102, 303–312. [Google Scholar] [CrossRef]
  36. Lane, D.M. Project Leader, Online Statistics Education: A Multimedia Course of Study. Rice University (Chapter 2 “Graphing Distributions”, Section “Histograms”). Available online: http://onlinestatbook.com/ (accessed on 25 December 2020).
  37. Scherrer, P.; Lüthy, P.; Trumpi, B. Production of -endotoxin by Bacillus thuringiensis as a function of glucose concentrations. Appl. Microbiol. 1973, 25, 644–646. [Google Scholar] [CrossRef]
  38. Guicheteau, J.; Argue, L.; Emge, D.; Hyre, A.; Jacobson, M.; Christesen, S. Bacillus spore classification via surface-enhanced Raman spectroscopy and principal component analysis. Appl. Spectrosc. 2008, 62, 267–272. [Google Scholar] [CrossRef]
  39. Tufts, J.A.; Calfee, M.W.; Lee, S.D.; Ryan, S.P. Bacillus thuringiensis as a surrogate for Bacillus anthracis in aerosol research. World J. Microbiol. Biotechnol. 2014, 30, 1453–1461. [Google Scholar] [CrossRef]
  40. Stewart, G.C. The Exosporium Layer of Bacterial Spores: A connection to the Environment and the Infected Host. Microbiol. Mol. Biol. Rev. 2015, 79, 437–457. [Google Scholar] [CrossRef] [Green Version]
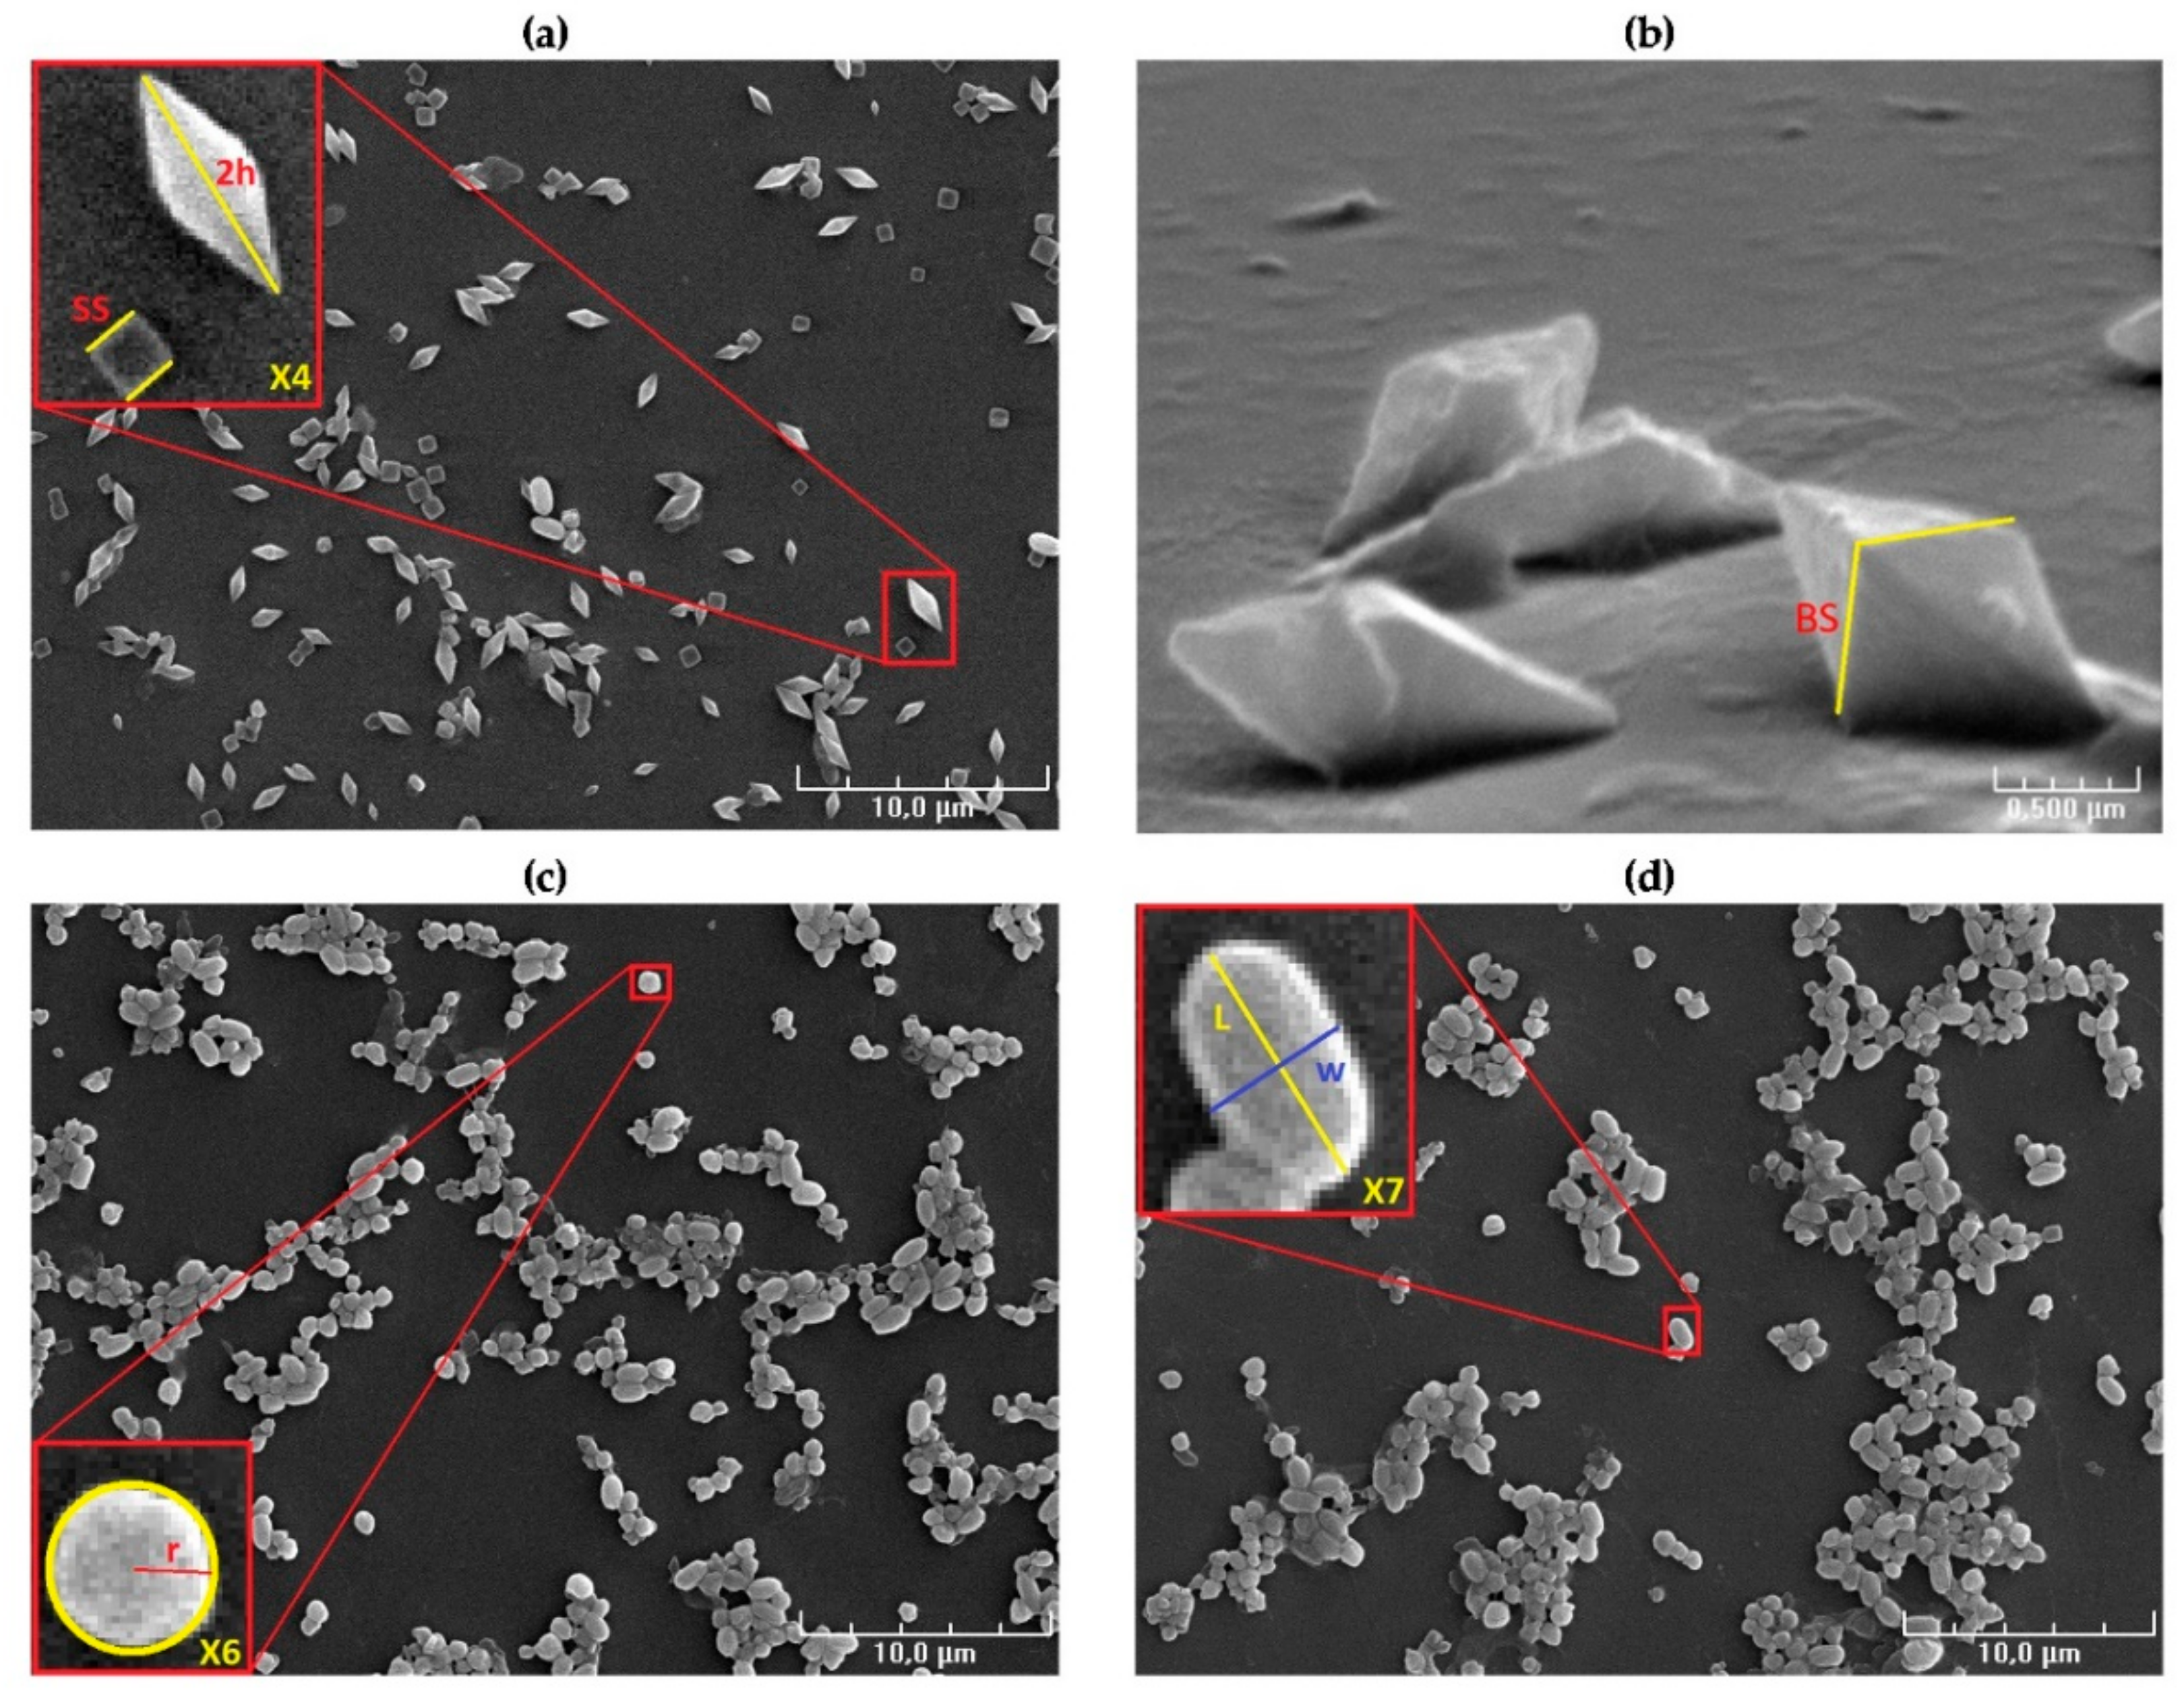
Figure 1. Examples of measurements of the different shapes of B. thuringiensis crystals and spores. (a) SEM image of the LIPMKA strain showing in yellow the measurement of the height of the bipyramid (2 h) and the side of the square (SS) of the cubic crystals. (b) SEM image of the LIPMKA strain indicating the side of the square (BS) forming the base of the bipyramid. (c) SEM image taken for a AR23 strain’s purified crystals showing the measurement of the perimeter of the sphere where we calculated the radius r of the latter. (d) SEM image taken for a AR23 strain showing the measurements of the length (L) in yellow and the width (W) in blue of the spores.
Applsci 11 00155 g001
Figure 2. (a) SEM image of the HD1 purified crystals. (b,c) Graphs representing the size distribution in terms of frequency, along with the cumulative percentage of the bipyramidal height for the bipyramidal crystals and the cubic size of the cubic crystals.
Applsci 11 00155 g002
Figure 3. (a) SEM image of the LIPMKA purified crystals. (b,c) Graphs representing the size distribution in terms of frequency, along with the cumulative percentage of the bipyramidal height for the bipyramidal crystals and the cubic size of the cubic crystals.
Applsci 11 00155 g003
Figure 4. (a) SEM image of the BLB1 purified crystals. (b,c) graphs representing the size distribution in terms of frequency, along with the cumulative percentage of the bipyramidal height for the bipyramidal crystals and the cubic size of the cubic crystals.
Applsci 11 00155 g004
Figure 5. (a) SEM image of the AM65-52 purified crystals. (b) Graph representing the radius size distribution in terms of frequency and cumulative percentage for the spherical crystals.
Applsci 11 00155 g005
Figure 6. (a) SEM image of the AR23 purified crystals. (b) Graph representing the radius size distribution in terms of frequency and cumulative percentage for the spherical crystals.
Applsci 11 00155 g006
Figure 7. (a) SEM image of the BUPM98 purified crystals. (b) Graph representing the radius size distribution in terms of frequency and cumulative percentage for the spherical crystals.
Applsci 11 00155 g007
Figure 8. (a) SEM image taken of the H3 purified crystals. (b) Graph representing the radius size distribution in terms of frequency and cumulative percentage for the spherical crystals.
Applsci 11 00155 g008
Figure 9. Histograms representing the size distribution in terms of frequency and cumulative percentage of the length L of the spores synthesized by the seven strains of B. thuringiensis: (a) HD1, (b) LIPMKA, (c) BLB1, (d) AM65-52 (e) AR23, (f) BUPM98 and (g) H3.
Applsci 11 00155 g009
Figure 10. Mean values of (a) spores aspect ratio and (b) volume of spores for the seven strains of B. thuringiensis. Error bars are uncertainties computed while taking into account the standard deviation for N measurements.
Applsci 11 00155 g010
Table 1. Characteristics of the seven Bacillus thuringiensis strains used in this study.
Strain.OriginSerovarCrystal ShapeCrystal Protein Genes ( ) *Reference
HD1Thuricide®kurstakiB and C6:00[28]
cry1 (4)
cry2 (2)
LIPMKALebanonkurstakiB and C6:00[9]
cry1 (4)
cry2 (2)
BLB1TunisiakurstakiB and C6:00[29]
cry1 (4)
cry2 (2)
AM65-52Vectobac®israelensisScry4aa, cry4ba, cry10aa, cry11aa, cyt1aa, cyt1ca, cyt2ba[30]
AR23LebanonisraelensisScry4aa, cry4ba (2), cry10aa, cry11aa, cyt1aa, cyt1ca, cyt2ba[15]
BUPM98TunisiaisraelensisScry4aa, cry4ba (2), cry10aa, cry11aa, cyt1aa, cyt1ca, cyt2ba[31]
H3LebanonND **S11 novel cry genes[32]
* Number of different toxin-coding genes carried by each strain; ** ND: not determined.
Table 2. Morphological data of the crystals of the three B. thuringiensis var. kurstaki (a) bipyramidal and (b) cubic crystals for N measurements.
(a)
Bipyramidal Crystals
StrainNBipyramidal Height (2 h) (μm)Side of the Base (μm)Volume * (μm3)Aspect ratio
AverageUnc.RangeAverageUnc.RangeAverageUnc.AverageUnc.
HD111981.5080.0090.766–2.2670.6110.0960.433–0.8980.1880.0020.4160.006
LIPMKA13351.5490.0160.597–2.9300.5540.1190.305–0.7820.1580.0020.3710.004
BLB114001.5310.0140.723–2.6850.5820.1160.369–0.9930.1730.0020.3930.004
(b)
Cubic Crystals
StrainNSide of the Square (μm)Volume ** (μm3)
AverageUnc.RangeAverageUnc.
HD15740.5730.0090.264–0.8860.210.009
LIPMKA2480.4780.0140.222–0.8600.1290.013
BLB115980.6140.0060.285–1.1570.2620.008
* Volumes were calculated using 2 h B S 2 / 3 . ** Volumes were calculated using S S 3 .
Table 3. Morphological data of crystals of the three B. thuringiensis var. israelensis and B. thuringiensis H3 spherical crystals for N measurements.
Spherical Crystals
StrainNRadius (μm)Volume * (μm3)
AverageUnc.RangeAverageUnc.
AM65-522290.3940.0090.206–0.6830.2830.021
AR239410.3810.0030.228–0.5300.2420.006
BUPM9815000.370.0030.143–0.5240.2250.005
H313500.4110.0030.217–0.6150.3070.007
* Volumes were calculated using e q u a t i o n   ((4/3)   π r 3 ).
Table 4. Morphological data of spores produced by the seven chosen Bacillus thuringiensis strains for N measurements.
Spores
StrainNLength (μm)Width (μm)Volume ** (μm3)Aspect Ratio
AverageUnc.RangeAverageUnc.RangeAverageUnc.AverageUnc.
HD1441.3430.0920.824–2.2030.7890.0500.459–1.3260.4760.1040.5950.030
LIPMKA3651.6490.0230.870–2.7670.82690.0090.445–1.1120.6030.0180.5080.008
BLB12121.4590.0530.395–2.2590.7220.0250.221–1.0690.4650.0320.5010.009
AM65-521181.2570.040.706–1.9280.7830.0260.465–1.1420.4260.0360.6360.026
AR238231.5030.0140.673–2.1180.8630.01130.605–1.8840.5840.0120.6050.014
BUPM982631.550.0191.123–1.9570.80930.0090.598–1.0540.5400.0150.5250.007
H32121.3870.0420.676–2.5200.9210.0430.402–1.4630.6200.0490.7540.072
** Volumes were calculated assuming that spores are ellipsoids with volume V given by: V = π L W 2 / 6 , where L represents the length and W the width of the spore.
Publisher’s Note: MDPI stays neutral with regard to jurisdictional claims in published maps and institutional affiliations.