Article

Few-Layered MoS2 Nanoparticles Covering Anatase TiO2 Nanosheets: Comparison between Ex Situ and In Situ Synthesis Approaches

Department of Chemistry, NIS (Nanostructured Interfaces and Surfaces) Interdepartmental Centre and INSTM Centro di Riferimento, University of Torino, Via P. Giuria, 7, 10125 Torino, Italy
*
Author to whom correspondence should be addressed.
Dedicated to the memory of Gianmario Martra.
Appl. Sci. 2021, 11(1), 143; https://doi.org/10.3390/app11010143
Submission received: 20 November 2020 / Revised: 22 December 2020 / Accepted: 22 December 2020 / Published: 25 December 2020
(This article belongs to the Special Issue Advanced Spectroscopy for the Study of Gas-Solid Interactions)

Abstract

:
MoS2/TiO2 nanostructures made of MoS2 nanoparticles covering TiO2 nanosheets have been synthesized, either via ex situ or in situ approaches. The morphology and structure of the MoS2/TiO2 hybrid nanostructures have been investigated and imaged by means of X-ray diffraction (XRD) analysis and high-resolution transmission electron microscopy (HRTEM), while the vibrational and optical properties have been investigated by Raman, Fourier-transform infrared (FTIR), and UV−visible (UV–vis) spectroscopies. Different stacking levels and MoS2 nanosheets distribution on TiO2 nanosheets have been carefully evaluated from HRTEM images. Surface sites on the main exposed faces of both materials have been established by means of in situ FTIR spectra of CO probe molecule adsorption. The results of the ex situ and in situ approaches are compared to underline the role of the synthesis processes affecting the morphology and structure of MoS2 nanosheets, such as curvature, surface defects, and stacking order. It will be shown that as a result of the in situ approach, the reactivity of the TiO2 nanosheets and hence, in turn, the MoS2–TiO2 nanosheets interaction are modified.

1. Introduction

Heterostructures of different dimensionality have been investigated in the past because of their novel properties and challenging applications, including clean energy and new energy-related technologies, photocatalysis [1,2], electrocatalysis [3], solar cells [4], energy conversion and storage [1,5], up to research studies in biomedical fields [6,7,8]. In particular, since the discovery of graphene, 2D materials have attracted considerable attention due to their unique physical and chemical properties. Because of this, many efforts have been focused on the combination of two-dimensional layered materials (2DLMs) with zero-dimensional ones (0D), such as plasmonic nanoparticles and quantum dots, and with mono-dimensional (1D) nanostructures, such as nanowires and nanoribbons, thus introducing a new way of nanoscale material integration and enabling the development of many extraordinary electronic devices. In this regard, 2D−2D van der Waals heterostructures made of distinct 2DLMs and superlattices [8] play a considerable role in controlling and manipulating the generation, confinement, and transport of charge carriers, excitons, photons, and phonons within the atomic interfaces, thus giving chances for the design of unique and challenging devices [9,10,11].
Besides graphene-like and, in general, nanocarbon materials, families of semiconducting inorganic systems, such as nanostructured transition metal dichalcogenides (TMDs, i.e., MoS2, WS2) and oxides (i.e., TiO2, perovskites) [12,13], are attractive candidates for heterostructures and hybrid combinations.
Notice that each layer within two-dimensional layered materials (2DLMs) consists of a covalently bonded, dangling-bond-free lattice, which provides the in-plane stability of 2D crystals, whereas relatively weak, van-der-Waals-like interactions are able to keep the neighboring layers together [14,15]. This makes it feasible to isolate, mix, and match highly different atomic layers to create a wide range of van der Waals heterostructures (vdWHs) without the constraints of lattice matching and processing compatibility, in a sequence with one-atom-plane precision [15,16,17].
In this context, a large amount of MoS2/TiO2-based heterostructures with higher performance with respect to the individual MoS2 and TiO2-based materials have been obtained [18,19]. As a matter of fact, MoS2 has been considered of great interest to perform MoS2/TiO2 hybrid composites, due to its absorption in the UV−visible range, and then its ability to increase the visible light absorption of TiO2-based systems [20,21]. However, TiO2, despite being an excellent photocatalyst, is known to absorb only a small portion of the solar spectrum in the UV region (3% of the sunlight spectrum) [22].
Therefore, in order to exploit new and advanced applications, the relationship between the structure and properties in MoS2/TiO2-based composites has to be investigated. Concerning this point, lattice mismatch—that is, different lattice constants and atomic arrangements between MoS2 and TiO2—causes TiO2 particles to agglomerate, thus achieving poor interfacial contact of the TiO2 particles with the MoS2 layered material. As it is known that the interface plays a key role in charge carrier separation and migration [23], many efforts have been devoted to grow 2D MoS2 nanosheets on the most exposed TiO2 facets as substrates, which provide a larger contact specific surface areas for charge carrier transfers [5]. In particular, 2D anatase TiO2 nanosheets with exposed {001} facets [24] have especially attracted great interest in the nucleation and growth of MoS2 nanosheets [8,25].
Considering the favorable optical properties of MoS2—that is, excitonic absorption bands in the visible spectra together with the occurring of efficient charge transfer phenomena between MoS2 nanoparticles and TiO2 nanosheets [26]—recently, highly dispersed MoS2 nanoparticles have been prepared through different methods, including ex situ and in situ approaches. It has been reported that, from ex situ synthesis at low cost and the scalable production of highly heterogeneous MoS2/TiO2-based composites, weak interface interactions are obtained [5,19]. On the contrary, composites with strong interface contacts can be achieved, although at a low yield, from in situ strategies [5]. It is known that from in situ methods, atomic scale assembling and then growth of well-defined MoS2 slabs can be obtained, thus providing effective chemical interactions at the interface. Concerning the in situ strategies, chemical solution methods are mainly used to prepare MoS2/TiO2-based composites, where MoS2 nanoplatelets grow on TiO2 basal planes [5]. As a result, 2D–2D MoS2/TiO2 nanosheets exhibit high activity due to the large contact area, although it was reported that heterostructures coming from solution chemical methods show a low amount of exposed active edge sites [5].
Notwithstanding the great interest in MoS2/TiO2 systems, there is a limited number of studies on TiO2 nanosheets with exposed {001} facets decorated with MoS2 slabs obtained from either ex situ or in situ approaches. Among these studies, different structures including 2D nanojunctions [8,27], MoS2 nanoparticles or nanosheets decorating TiO2 nanosheets [25,28,29,30], and MoS2 quantum dots (QDs) at the surface of TiO2 sheets were found very effective for enhanced photocatalytic H2 production and dyes photodegradation. Furthermore, it is known that in MoS2/TiO2 hybrid nanosheets’ interfacial charge transfer mechanisms [31], together with improved separation efficiency of photogenerated eh+ pairs caused by the presence of MoS2 as cocatalysts [25,30], have a role in increasing the photocatalytic activity.
According to some authors, TiO2 nanosheets are preliminarily prepared by using a fluorine-based morphology controlling agent, which gives rise to the formation of Ti–F bonds on the exposed TiO2 {001} facets [32,33,34]. The surface fluorine species, due to their instability during hydrothermal treatment, tend to be replaced by hydroxyl groups, which in turn absorb Mo precursors, such as MoO42− and MoS42− anions, which are then reduced in situ by the S source to form 2D–2D MoS2/TiO2 nanosheets [5,8,35].
Based on these published results and on the lack of comparison between such layered systems prepared by in situ and ex situ approaches, in the present work, 2D–2D MoS2/TiO2 hierarchical nanostructures have been obtained either via an ex situ approach, which implies a preliminary exfoliation/fragmentation under solvent assisted ultrasonication of bulk MoS2, followed by subsequent wet impregnation of TiO2 nanosheets and via an in situ approach, from a molybdenum oxide precursor in a sulfiding atmosphere (H2S), which gives rise to the formation of highly dispersed and strongly anchored MoS2 slabs on TiO2 nanosheets.
In this paper, the morphology, structure, vibrational, and optical properties of the samples obtained from the ex situ and in situ strategies are compared. Particular attention was paid to the different stacking degrees, the size distribution and dispersion of the MoS2 nanosheets, decorating the TiO2 supports, together with investigation of the surface sites on the main exposed faces, by means of adsorption of a suitable probe molecule. In this regard, we have used for the first time CO molecules for probing the surface of MoS2/TiO2 combined heterostructures.
As a matter of fact, it is known from FTIR spectra that CO adsorption at low temperature is a highly sensitive probe to detect small differences in the Lewis acidity of the exposed sites (e.g., Ti4+ centers). The greater the electrophilic character of the metal cation is, the higher the upshift of the signal is with respect to the value of νCO in the gas phase (2143 cm−1) [36]. In conclusion, it will be shown that on samples obtained by in situ strategy, self-aggregation phenomena are hindered by the MoS2/surface interaction, that is by the formation of highly dispersed and strongly anchored MoS2 nanosheets, which in turn is favored by sulfur doping.

2. Materials and Methods

2.1. Materials

2.1.1. Synthesis of the TiO2 Nanosheets

TiO2 nanosheets have been obtained via a solvothermal procedure, which we briefly summarize because many papers have already reported on this subject [35,37]. In particular, 25 mL of Ti(OBu)4 (Titanium (IV) butoxide) was poured in a 150 mL Teflon-lined stainless steel reactor and 3.5 mL of concentrated hydrofluoric acid was added dropwise under stirring, at 523 K for 24 h. The resulting bluish paste was centrifuged and washed with acetone to remove the residual organics and then with water. Finally, the obtained aqueous suspension was freeze-dried obtaining bluish powder TiO2 nanosheets (hereafter TiO2 n-sh). In order to remove the fluorides from the surface, TiO2 n-sh were washed with 0.1 M NaOH, then centrifuged (5000 rpm, 15 min), keeping the supernatant for quantification of fluorides and Ti species by ion chromatography and inductively coupled plasma mass spectrometry (ICP-MS), respectively. The paste of TiO2 nanoparticles was again centrifuged in 0.1 M HNO3 (40 mL, 5000 rpm, 15 min) and ultrapure water to remove the surface Na+ ions. Notice that the TiO2 nanosheets were analyzed by Auger electron spectroscopy, XPS, and TOF-SIMS analyses in previous works (see the specific literature) [35,38,39]. Calcination in air at 873 K, for 60 min, and then cooling down to 298 K in the closed furnace for approximately 10 h were performed to remove bulk and the surface fluorides.

2.1.2. Synthesis of the MoS2/TiO2 Nanosheets by Ex Situ Method

A dispersion of 2 mg of MoS2 in 10 mL of water/ethanol mixture (5.5 mL water and 4.5 mL ethanol) was sonicated preliminarily in an ultrasonic bath for 5 min, then subjected to further sonication at 20 kHz for 6 h by means of a VCX 500 Sonics Vibracell ultrasonic processor (power 500 W), equipped with a Ti alloy tapered microtip (d = 3 mm, 30% amplitude). A great intensity of cavitation can be obtained by the small diameter horn in the restricted volume of the solution, which has been placed in an ice bath to control the temperature during the whole sonication step. The obtained dark gray and turbid solution was then centrifuged (for 30 min at 4000 rpm), thus allowing the sedimentation of bigger particles and the separation of a clear light green-yellow supernatant solution to occur [40]. The supernatant portion of the dispersed solution (about 9 mL) is then transferred to a suitable test tube, in order to study its optical properties. Subsequently, the TiO2 nanosheets powder (0.13 g) was placed on a glass disk and then on a temperature-controlled heating plate (363 K), where it was impregnated with 9 mL of the sonicated MoS2 solution. This temperature allows for easy evaporation of the H2O/EtOH solvent. Then, the obtained sample was placed in an oven at 373 K overnight. The main steps are summarized in Scheme 1, left side.

2.1.3. Synthesis of the MoS2/TiO2 Nanosheets by In Situ Method

A clear solution of 0.066 g of ammonium heptamolybdate (AHM, (NH4)6Mo7O24×4H2O) in 2 mL of distilled water under stirring was prepared first. Then, the solution was dripped onto the TiO2 nanosheets powder (2 g) and mixed with a glass rod. The mixture was placed in an oven at 323 K overnight. With this procedure, hybrids with Mo 3% by weight are obtained. Titania nanosheet powder was pressed in self-supporting pellets by means of a hydraulic press and inserted in a gold frame (suitable for FTIR measurements in situ). Later, it was placed in a muffle where the decomposition of AHM into molybdenum oxide occurred. In particular, the decomposition of AHM in MoOx and the removal of ammonia and water have been obtained by heat treatment in air at 673 K for 12 h, having set a temperature ramp of 5 K per minute. The MoOx sample was activated under dynamic vacuum at 673 K for 30 min, and then twice oxidized in oxygen atmosphere (40 Torr) at the same temperature and time. The oxidized sample was sulfided at 673 K, in the H2S atmosphere (30 Torr) for 1 h, then outgassed. The sulfidation process was carried out twice. The main steps are summarized in Scheme 1, right side.

2.2. Methods

The structure and morphology of the samples have been investigated according to the following:
(i)
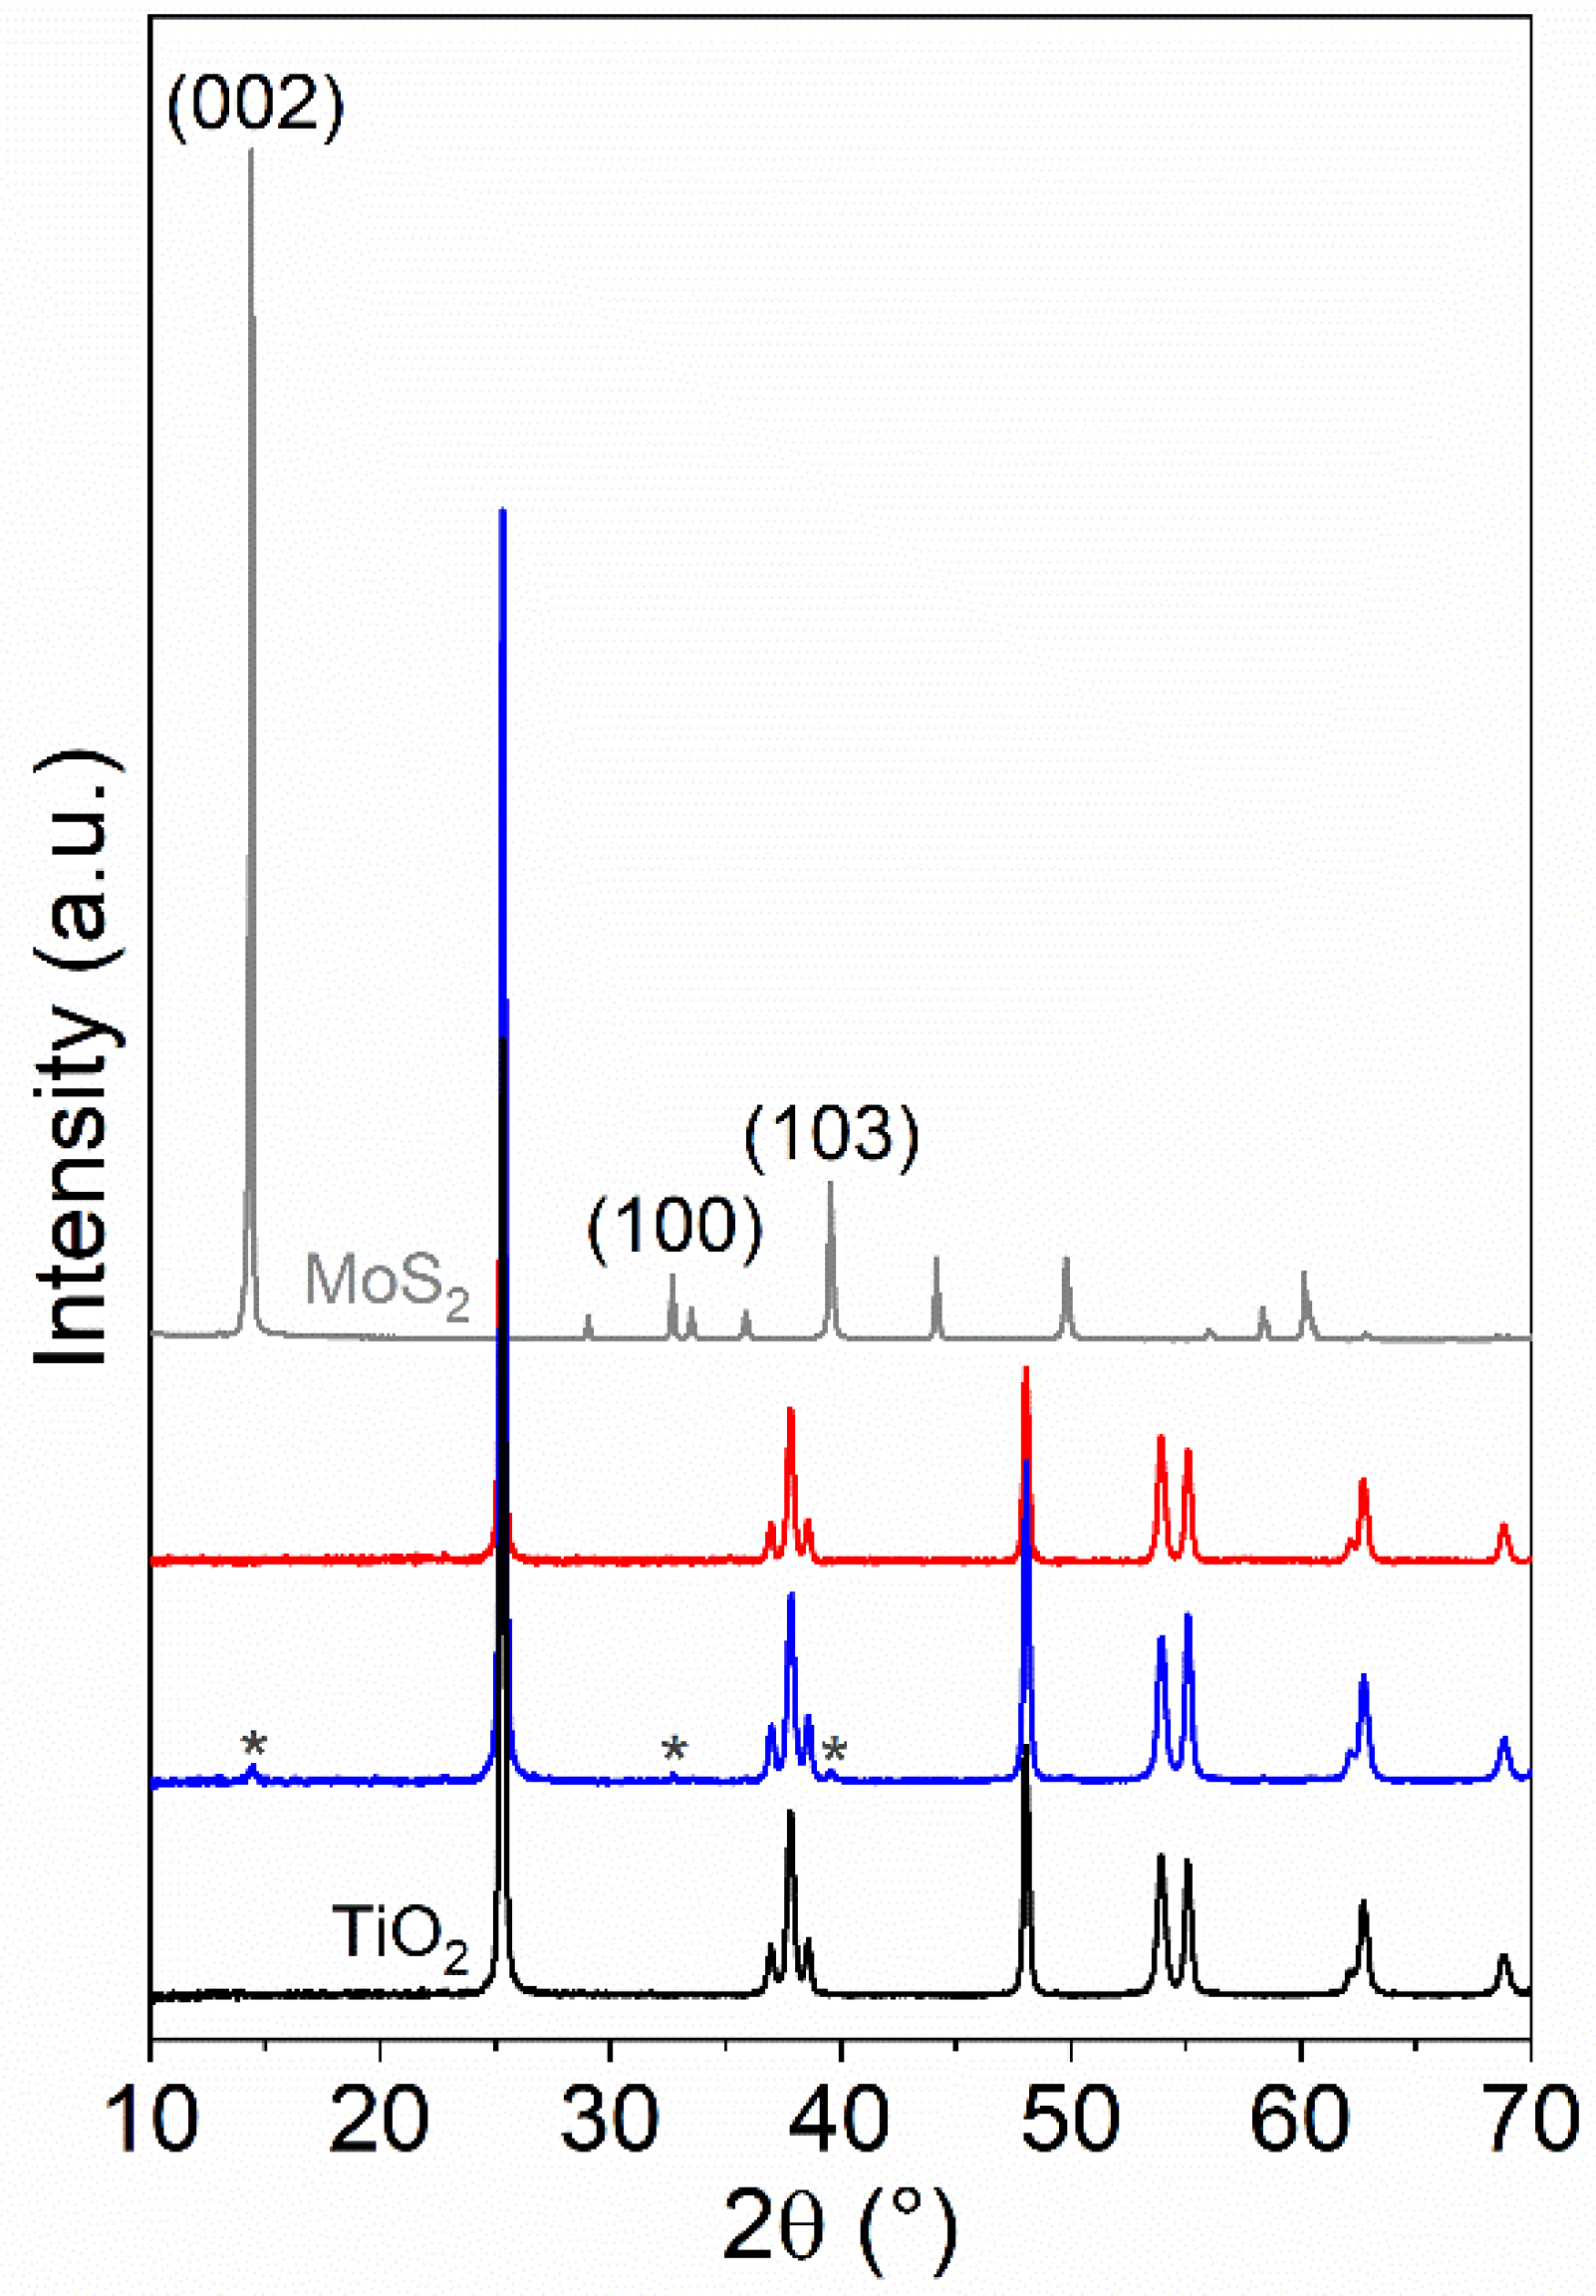
X-ray diffraction (XRD) patterns of samples have been collected with a PAN analytical PW3050/60 X’Pert PRO MPD diffractometer with a Cu anode and a Ni filter, in Bragg–Brentano configuration. The diffractograms were acquired in an interval equal to 10° ≤ 2θ ≤ 80° with an acquisition step of 0.02°.
(ii)
High-resolution transmission electron microscopy (HRTEM) images have been obtained with a JEOL 3010-UHR HRTEM microscope operating at 300 kV with a point-to-point resolution of 0.12 nm, equipped with a 2 k × 2 k pixels Gatan US1000 CCD camera.
(iii)
Raman spectra were acquired in backscattering mode using a Renishaw In Via Raman spectrophotometer, equipped with an Ar+ laser emitting at 514.5 nm. The backscattered light was analyzed by a grid with 1200 lines/mm and detected by a CCD detector. The effects of the radiation damage on the samples were reduced by limiting the output power to 0.5%.
(iv)
FTIR spectra were acquired by means of a Bruker IFS 66 FTIR spectrometer equipped with a cryogenic MCT detector with 2 cm−1 resolution. Each titania sample was pressed in the form of a self-supporting pellet with “optical thickness” of ca. 10 mg∙cm−2. To investigate the surface properties, the CO probe molecule was dosed on samples by means of a gas manifold connected to the IR cell, thus allowing us to perform thermal treatments under vacuum and gas dosage. The spectra were collected after CO dosage (70 Torr) at 77 K in an IR cell designed for liquid N2 flow conditions.
(v)
The optical properties of the samples dispersed in solution have been investigated by means of transmittance mode using quartz cuvettes with an optical path of 1 cm, while the properties of the powder samples have been studied by means of diffuse reflectance (DR) mode. A Varian Cary UV 5000 spectrophotometer, equipped with a diffuse reflectance sphere, was used in the 2500–190 nm wavelength range.

3. Results and Discussion

3.1. Structure and Morphology by Means of XRD, HRTEM, and Raman Analyses

3.1.1. XRD Analysis

The X-ray diffraction patterns of MoS2/TiO2 n-sh obtained by in situ and ex situ methods are compared together with the XRD patterns of MoS2 bulk (Fluka) and of the native TiO2 n-sh powder (Figure 1). XRD diffraction patterns show peaks at 2θ = 25.2°, 37.0°, 37.8°, 38.6°, 48.0°, 53.9°, and 55.1°, corresponding to (101), (103), (004), (112), (200), (105), and (211) diffraction planes of anatase (PDF card #21-1272), and also match well with the native TiO2 n-sh XRD peaks (black pattern). Together with the aforementioned XRD features, the XRD pattern after wet impregnation with the MoS2 diluted dispersion in H2O/EtOH exhibits three additional weak peaks at 2θ ≅ 14.4°, 32.7°, and at 39.5°, which correspond to the (002), (100), and (103) diffraction planes of hexagonal MoS2 (gray pattern). XRD diffraction fingerprints of MoS2 are not found for the in situ methods (red pattern) [41,42]. Surprisingly, although this sample has a Mo content of 3% wt/wt, no XRD fingerprints of MoS2 are present after reaction with H2S. At this stage, we can only assume that the sulfurization products of the Mo-based species present on TiO2 n-sh are remarkably amorphous and/or very small in size (smaller than a few nm).

3.1.2. HRTEM Images

The MoS2/TiO2 n-sh (36 mL MoS2) sample obtained by the ex situ method was TEM and HRTEM imaged, as shown in Figure 2a–d. TiO2 nanosheets with lateral dimensions in the 50–200 nm range (Figure 2a) and thicknesses of about 30–40 nm (Figure 2b) are observed from the lower resolution TEM images. In the HRTEM image in Figure 2c, where nanoparticles are perpendicularly oriented to the electron beam, the TiO2 nanosheets are highly crystalline and expose well-defined interference fringes, 3.53 Å spaced due to anatase (101) planes [43]. Cavities with rectangular shape, resulting from the nanosheet preparation, can be observed by the variation in intensity across different regions in the nanoparticles. A small nanoparticle with lateral dimension of 20 nm and 5 nm in thickness, exposes 6.5 Å spaced interference fringes that are disrupted in the center (Figure 2d). Such a nanoparticle of irregular shape can be safety assigned to a MoS2 slab with the stacking number >5–6 [44].
The MoS2/TiO2 n-sh (Mo 3 wt.%) sample obtained by the in situ method is TEM and HRTEM imaged at different magnifications in Figure 3a–d. TiO2 nanosheets have a prevalent orientation perpendicular to the electron beam (Figure 3a), thus exposing their basal sizes in the 30–100 nm range, although a few nanosheets expose their thicknesses of about 20–30 nm as obtained from remarkable image contrast (Figure 3b). The selected regions in Figure 3a,b are HRTEM imaged in Figure 3c,d, where regular interference fringes, 3.53 Å spaced, that correspond to (101) planes of anatase are decorated with more irregular fringes. Such fringes have spacings of about 6.5–6.7 Å and can be assigned to thin MoS2 slabs at the surface of anatase nanoparticles [41,42]. Furthermore, a stacking number of 3 ± 2 layers and basal sizes of 2–10 nm can be observed. It is worthy of attention that the MoS2 slabs as obtained by the in situ preparation appear to be thinner and more defective (i.e., basal plane interruptions, more curved structures decorating the anatase facets) with respect to the slabs obtained by the ex situ preparation, despite the higher MoS2 concentration.

3.1.3. Raman Investigation

In Figure 4a, the Raman spectra, recorded with the 514 nm laser line, of MoS2/TiO2 n-sh obtained by ex situ (blue line) and in situ methods (red line) and of TiO2 anatase nanosheet (n-sh) pretreated at 873 K (black line) are compared with that of bare MoS2, used as a reference material (grey line). Considering the Raman spectrum of pure TiO2 nanosheets (black line), the typical anatase TiO2 fingerprint can be recognized. As a matter of fact, the four bands at 144, 396, 514, and 636 cm−1 are ascribed to the Eg, B1g, A1g, and Eg Raman active modes, respectively, of the anatase phase, as described in the literature [45,46].
Moving to both the MoS2/TiO2 n-sh obtained by the ex situ method (blue line), and by the in situ method (red line), it can be observed that the feature centered at 396 cm−1, assigned to the TiO2 anatase phase, is split into two components at 407 and 385 cm−1 (blue line), and at 406 and 386 cm−1, (red line), which can be ascribed to MoS2 A1g and E12g first-order Raman active modes, respectively (Figure 4b) [20]. The A1g mode is explained with a vibration along the stacking of MoS2, while the E12g mode is related to the lateral extension of the MoS2 sheets. The asymmetry of both signals suggests the contribution of a variety of sites located on the MoS2 boundaries characterized by slightly different nuclearity, together with the formation of small sulfide particles.
Notice that on MoS2/TiO2 n-sh obtained by the in situ method (Figure 4a, red line), a peak at about 227 cm−1 has been observed, which has been assigned to LA phonons at the M point [47]. According to the authors, a relationship between the intensity ratio of the LA(M) peak and each of the first-order peaks has been found, which suggests a practical route to quantify defects in single-layer MoS2 using Raman spectroscopy, thus highlighting an analogy between the LA(M) peak in MoS2 and the D peak in graphene.
From Figure 4b, a difference of the frequency values between the A1g and E12g modes of ≅20 cm−1 for MoS2/TiO2 n-sh obtained by in situ (red line), ≅22 cm−1 for MoS2/TiO2 n-sh obtained by ex situ (blue line), and ≅26 cm−1 for the reference bare MoS2 can be calculated. Reported in the literature as well, the difference of the frequency values between A1g and E12g modes is indicative of the slab thickness [48]. This means that a relationship between the position of the A1g and E12g vibrational modes and the number of layers in the MoS2 particles has been established [41,49].
Moreover, most of these studies focused on materials obtained by the ex situ method, via exfoliation and deposition on flat supports of bulk MoS2. Therefore, a relationship has not been systematically investigated for MoS2 particles grown on oxide particles as a support (in situ method). As a matter of fact, in the case of highly dispersed supported MoS2, the morphology (i.e., effect of particle roughness and curvature) and surface properties of the support (i.e., preferential growth of peculiar crystal faces and surface defects) may affect the shape and positions of the MoS2 Raman bands, thus meaning that the A1g and E1 2g peak positions cannot be taken as a direct reference of MoS2 staking level. However, by reasonably applying the established relationships [50] to our MoS2/TiO2 nanosheets, an average stacking order of 2 ± 1 layers per particle could be estimated for samples coming from the in situ method, whereas a higher stacking number of 3–4 for samples obtained by the ex situ method can be found, in agreement with XRD and HRTEM analyses.

3.2. Optical Properties by UV–vis Spectroscopy

Due to the close relation between the optical properties of MoS2/TiO2 nanosheets and their morphology/structure, UV–Vis–NIR spectra can give detailed information on the nature and properties of both the sulfided phase and the support, as well as on their electronic structure. In Figure 5, the UV–vis spectra of TiO2 anatase nanosheets, MoS2/TiO2 obtained by the in situ approach, and MoS2/TiO2 obtained by the ex situ approach are compared to those of the MoS2 bulk, used as a reference. All the spectra were recorded in the diffuse reflectance mode and converted to equivalent absorption Kubelka–Munk units. The curve of the TiO2 nanosheets (black line) shows the typical absorption edge of TiO2-based systems, due to the transition from O2− antibonding orbital to the Ti4+ lowest energy orbital [19]. On the basis of the literature data [51] and other previous results [40], it appears that the spectral features of the MoS2 reference (grey line) can be assigned as follows: (i) a first absorption threshold at about 700 nm associated to a direct transition at the K point [52,53]; (ii) two sharp peaks at 680 nm and at 622 nm, on the high energy side of the 700 nm threshold, assigned to A and B excitonic transitions, respectively, whose separation energy can be explained with spin-orbit splitting at the top of the valence band at the K point [54]; (iii) a second threshold at about 500 nm, due to a direct transition from the deep in the valence band to the conduction band; (iv) another two excitonic transitions at 482 nm (C), and at 399 nm (D), also associated with the 500 nm threshold transition [51]; and (v) a third threshold at about 350 nm due to transitions from deep in the valence band [52]. The curve of the MoS2/TiO2 hybrid system obtained by the in situ approach (red line) shows a continuum and wide absorption over the UV–visible range, due to the presence above the valence band, of new electronic states arising from sulfur–oxygen exchange reactions at the surface of TiO2 nanosheets. These states result from the mixing of Sulphur 3p atomic orbitals with the TiO2 valence band [19]. Notice that reduced molybdenum species on TiO2 defective nanosheets have to be considered, although hidden inside the wide and intense absorption. This could be further proof of the formation of thin MoS2 platelets [40,48]. The typical MoS2 excitonic bands A and B are shifted to higher energies as compared to those of MoS2 bulk, meaning a quantum confinement of the excitons, due to the low dimension of the MoS2 particles, which is in agreement with the HRTEM and XRD results. The features in the 400–500 nm range, already explained with the C and D excitons of MoS2, overlap inside a broad band, as expected for a highly dispersed supported material.
Similar features are present in the MoS2/TiO2 hybrid obtained through the ex situ approach (blue line), although slightly downward shifted, as compared to the in situ sample. Considering both the systems in mor detail, obtained by in situ and ex situ approaches (red and blue lines, respectively), if compared to those of the reference MoS2 bulk, it can be observed that the energy values of A and B excitons are only slightly upward shifted, whereas relevant shifts are observed for the C and D excitons envelope, because quantum size effects more significantly affect the C and D bands [52].
Notice that quantum size effects have been related to the low dimensionality of the MoS2 particles along the c direction, which is due to a low number of layers, but the small dimension of the MoS2 platelets along the “in-plane” a and b directions can also play a role [54]. According to this, we can conclude that the sample synthesized via the in situ approach has smaller MoS2 particles than the sample synthesized via the ex situ method, with some level of particle stacking observed in the last case (as HRTEM imaged in Figure 2 and Figure 3).

3.3. Surface Vibrational Properties by FTIR

FTIR spectra of CO adsorbed at liquid nitrogen temperature, at decreasing coverages up to the residual pressure of 4 × 10⁻⁴ Torr, on the surface of TiO2 n-sh (pretreated at 873 K), of MoS2/TiO2 n-sh (36 mL MoS2) (pretreated at 673 K), and of MoS2/TiO2 n-sh (Mo 3% wt/wt) (pretreated at 673 K) are shown in Figure 6. The main feature at 2159 cm−1 on the TiO2 n-sh sample (Figure 6a) is due to CO molecules adsorbed on the Ti4+ sites located on (1 × 4) reconstructed (001) surfaces, together with a minor feature observed at 2179 cm−1, which has been assigned to CO molecules adsorbed on (101) surfaces, less extensive than (001), according to the data and models reported in the literature [35]. Moreover, a weak shoulder at ca. 2155 cm−1, which is hidden within the envelope of the band on the low frequency side, due to CO species interacting with the residual surface OH groups, can be detected. Notice that the band at 2159 cm−1 is fully reversible upon CO outgassing, whereas the peak at ∼2179 cm−1 remains almost unaffected at the temperature of the experiment. Furthermore, the maximum of the 2159 cm−1 band undergoes a quite negligible upward frequency shift upon decreasing CO pressure, approaching the singleton ν(CO), plausibly due to the fading away of weak lateral interactions (dynamic and static in type) within the CO adlayer. The low upshift of the singleton mode with respect to the CO stretching mode in the gas phase (2143 cm−1) together with the complete reversibility upon CO outgassing are explained with the low electrophilicity/reduced acidity of the Ti4+ sites on (001) surfaces, due to a screened electrostatic potential at these Ti sites, which are strongly bound to two oxygens. This agrees with the weakness of their interaction with CO [19].
Surprisingly, moving to the spectra of CO adsorbed on the surface of MoS2/TiO2 nanosheets obtained by ex situ approach (Figure 6b), no vibrational modes associated with molybdenum species are observed. The absorption bands are mainly due to the CO interaction with the support, which can be explained with the very low concentration of Mox+ species. However, a general decrease in intensity of the main IR features compared to pure TiO2 n-sh is noted. It is plausible to assume that a few MoS2 slabs cover small surface regions on both {001} and {101} faces. This causes a lower number of available Ti4+ sites to interact with CO probe molecules, hence a decreased intensity of the adsorption signals on (101) and (001) surfaces. Finally, from the CO spectra on MoS2/TiO2 nanosheets (Mo 3 wt.%) obtained by the in situ approach (Figure 6c), significant changes can be observed. At higher frequencies, the features at 2179 and 2159 cm−1, already assigned on previous systems to CO molecules adsorbed on Ti4+ sites on (101) and (001) surfaces, respectively, are also observed, but with a different intensity ratio. Considering the asymmetry on the low frequency side of the band centered at 2159 cm−1, modes due to CO physisorption on heterogeneous surface sites, including residual OH groups and/or sulfur anions on the basal planes of crystalline MoS2 cannot be ruled out [55]. However, in the 2130–2050 cm−1 range, two significant bands, at 2117 and 2066 cm−1, are observed which are absent on the MoS2/TiO2 n-sh sample obtained by the ex situ method (Figure 6b). The appearance of these features, downshifted with respect to the CO free molecule (2143 cm−1), indicates the formation of surface sites characterized by π-backdonation character [56]. They have already been assigned [57] to carbonyl species anchored on a multiplicity of coordinatively unsaturated Mox+ centers (x < 4) on highly defective situations (Mo−S) [48,58]. In particular, the band at 2117 cm−1 can be ascribed to the Mox+ species (x < 4) located on defective sites (e.g., edges), while the 2066 cm−1 one could be due to the interaction of CO with Mox+ species (x < 4) located on highly coordinatively unsaturated (cus) sites such as corners [41]. Such bands are the last to disappear by outgassing and this is a further confirmation of the presence of isolated and cus molybdenum species on defective sites associated with the formation of sulfur vacancies [45].
FTIR spectra of CO adsorbed at 77 K at maximum coverage on TiO2 n-sh, MoS2/TiO2 n-sh (via ex situ method), and MoS2/TiO2 n-sh (via in situ method) are compared in Figure 7 (black, blue, and red curves, respectively) aiming to investigate the effects of the different synthesis methods on the surface properties of the two-system MoS2/TiO2 n-sh, as compared to the pure TiO2-nsh sample. First, it appears that (i) the spectra of both the MoS2/TiO2 n-sh samples are characterized by a lower intensity of the typical signals at 2179 and 2159 cm−1 due to the adsorption of CO on the (101) and (001) surfaces, respectively; and (ii) only for the MoS2/TiO2 n-sh sample prepared via the in situ method, the signals in the range 2130–2050 cm−1, associated with reduced Mox+ species (x < 4), are observed. The general decrease in intensity can be associated with the presence of new Mox+ species masking the Ti4+ sites, which are no longer available for interactions with CO. Such a phenomenon is more evident on MoS2/TiO2 n-sh prepared via the in situ approach, due to the higher MoS2 concentration, than on the sample obtained via the ex situ method. Furthermore, the absence of the components assigned to Mox+ species in reduced states (x < 4) for the sample obtained by the ex situ method can be explained by the fact that the Mox+ species are present only on defective sites belonging to thin and uniformly distributed MoS2 slabs. Indeed, the HRTEM images (Figure 3) have shown thinner and more defective MoS2 slabs for the sample prepared by the in situ approach. Conversely, preparation via the ex situ approach gives rise to a heterogeneous and minor amount of MoS2 slabs anchored to the surface of TiO2 nanosheets, which are characterized by a higher level of stacking and are therefore less reactive. These remarks on different defects are in agreement with what has been observed with Raman (regarding the band at ca. 227 cm−1) and XRD analyses.

4. Conclusions

MoS2/TiO2 heterostructures, consisting of MoS2 slabs with different stacking order covering TiO2 nanosheets, have been synthesized following ex situ and in situ methods. Combining XRD, HRTEM, Raman, UV–visible, and FTIR data, the characteristics of MoS2/TiO2 heterostructures obtained from ex situ and in situ preparations were compared, highlighting the role played by the synthesis processes in affecting morphology, structure, stacking order, and defectivity. In more detail, MoS2 slabs as obtained by the in situ preparation appear to be thinner and more defective (i.e., basal plane interruptions, more curved structures decorating the anatase facets) with respect to the slabs obtained by the ex situ preparation, despite the higher MoS2 concentration.
In particular, the stacking number of 3 ± 2 layers and basal sizes of 2–10 nm for MoS2 particles on MoS2/TiO2 nanosheets coming from the in situ method could be estimated, whereas the stacking number > 5–6 and lateral dimension of 20 nm for MoS2 particles on MoS2/TiO2 nanosheets obtained by the ex situ method can be found. From the HRTEM analysis of samples obtained by the in situ method, the presence of more curved MoS2 slabs decorating the boundaries of the anatase nanosheets means that a relevant grafting of MoS2 particles at the {001} and {101} anatase facelets occurs. From this, it comes out that that the sulfidation process affects the reactivity of the support matrix as well, which in turn plays a role in the MoS2/support interaction. The low dimensionality of the MoS2 particles on MoS2/TiO2 nanosheets synthesized via the in situ approach with respect to those obtained by the ex situ method, already explained in terms of quantum size effects, has been additionally confirmed from the UV–vis results.
Lastly, from the FTIR spectra, the presence of new Mox+ species on defective sites, masking the Ti4+ sites, which are no longer available for interactions with CO, is a further confirmation that MoS2 slabs are thinner, more defective, and uniformly distributed for the sample prepared by the in situ approach, whereas MoS2 slabs obtained via the ex situ approach are more heterogeneously dispersed with a higher level of stacking and then lower reactivity.
In conclusion, we state that the morphology and dispersion of hybrid composites can be tailored by designing suitable preparation and activation conditions, also considering the interface structure and then the charge control.

Author Contributions

D.S., F.C., T.V., and R.S. wrote and organized the manuscript; T.V., R.S. and F.P. performed experiments and characterizations; in particular, F.P. contributed to sample preparation; D.S., F.C. and G.M. provided a substantial contribution to the work; D.S. supervised the manuscript. All authors approved it for publication. All authors have read and agreed to the published version of the manuscript.

Funding

This work was supported by MIUR (Ministero dell′Istruzione, dell′Università e della Ricerca), INSTM Consorzio and NIS (Nanostructured Interfaces and Surfaces) Inter-Departmental Center of University of Torino.

Institutional Review Board Statement

Not applicable.

Informed Consent Statement

Not applicable.

Data Availability Statement

“MDPI Research Data Policies” at https://www.mdpi.com/ethics.

Acknowledgments

The authors thank the Laboratory of the Chemistry Department and, in particular, Signorile, M., Damin, A., Bonino, F., Maurino, V., Cravanzola, S. and Valsania, M.C.

Conflicts of Interest

The authors declare no conflict of interest.

References

  1. Chatterjee, D.; Mahata, A. Visible light induced photodegradation of organic pollutants on dye adsorbed TiO2 surface. J. Photochem. Photobiol. A Chem. 2002, 153, 199–204. [Google Scholar] [CrossRef]
  2. Matos, J.; García, A.; Zhao, L.; Titirici, M.M. Solvothermal carbon-doped TiO2 photocatalyst for the enhanced methylene blue degradation under visible light. Appl. Catal. A Gen. 2010, 390, 175–182. [Google Scholar] [CrossRef]
  3. Cheng, Y.; Geng, H.; Huang, X. Advanced water splitting electrocatalysts via the design of multicomponent heterostructures. Dalton Trans. 2020, 49, 2761–2765. [Google Scholar] [CrossRef] [PubMed]
  4. Uddin, J.; Daramola, D.E.; Velasquez, E.; Dickens, T.J.; Yan, J.; Hammel, E.; Cesano, F.; Okoli, O.I. A high efficiency 3D photovoltaic microwire with carbon nanotubes (CNT)-quantum dot (QD) hybrid interface. Phys. Status solidi Rapid Res. Lett. 2014, 8, 898–903. [Google Scholar] [CrossRef]
  5. Zhao, N.; Meng, Y.; Sha, J.; Zhong, C.; Yuhuan, M.; Zhao, N. Preparation of MoS2/TiO2 based nanocomposites for photocatalysis and rechargeable batteries: Progress, challenges, and perspective. Nanoscale 2018, 10, 34–68. [Google Scholar] [CrossRef]
  6. Wang, H.; Liu, F.; Fu, W.; Fang, Z.; Zhou, W.; Liu, Z. Two-dimensional heterostructures: Fabrication, characterization, and application. Nanoscale 2014, 6, 12250–12272. [Google Scholar] [CrossRef]
  7. Wang, Z.; Mi, B. Environmental Applications of 2D Molybdenum Disulfide (MoS2) Nanosheets. Environ. Sci. Technol. 2017, 51, 8229–8244. [Google Scholar] [CrossRef]
  8. Yuan, Y.-J.; Ye, Z.-J.; Lu, H.-W.; Hu, B.; Li, Y.-H.; Chen, D.-Q.; Zhong, J.-S.; Yu, Z.-T.; Zou, Z.-G. Constructing Anatase TiO2 Nanosheets with Exposed (001) Facets/Layered MoS2 Two-Dimensional Nanojunctions for Enhanced Solar Hydrogen Generation. ACS Catal. 2016, 6, 532–541. [Google Scholar] [CrossRef]
  9. Goswami, N.; Giri, A.; Pal, S.K. MoS2 Nanocrystals Confined in a DNA Matrix Exhibiting Energy Transfer. Langmuir 2013, 29, 11471–11478. [Google Scholar] [CrossRef] [Green Version]
  10. Lee, Y.-H.; Zhang, X.; Zhang, W.; Chang, M.-T.; Lin, C.-T.; Chang, K.-D.; Yu, Y.-C.; Wang, J.T.-W.; Chang, C.-S.; Li, L.-J.; et al. Synthesis of Large-Area MoS2 Atomic Layers with Chemical Vapor Deposition. Adv. Mater. 2012, 24, 2320–2325. [Google Scholar] [CrossRef] [Green Version]
  11. Stephenson, T.; Li, Z.; Olsen, B.C.; Mitlin, D. Lithium ion battery applications of molybdenum disulfide (MoS2) nanocomposites. Energy Environ. Sci. 2014, 7, 209–231. [Google Scholar] [CrossRef]
  12. Lin, Y.; Ren, P.; Wei, C. Fabrication of MoS2/TiO2 heterostructures with enhanced photocatalytic activity. CrystEngComm 2019, 21, 3439–3450. [Google Scholar] [CrossRef]
  13. Wan, J.; Lacey, S.D.; Dai, J.; Bao, W.; Fuhrer, M.S.; Hu, L. Tuning two-dimensional nanomaterials by intercalation: Materials, properties and applications. Chem. Soc. Rev. 2016, 45, 6742–6765. [Google Scholar] [CrossRef]
  14. Sreepal, V.; Yagmurcukardes, M.; Vasu, K.S.; Kelly, D.J.; Taylor, S.F.R.; Kravets, V.G.; Kudrynskyi, Z.; Kovalyuk, Z.D.; Patanè, A.; Grigorenko, A.N.; et al. Two-Dimensional Covalent Crystals by Chemical Conversion of Thin van der Waals Materials. Nano Lett. 2019, 19, 6475–6481. [Google Scholar] [CrossRef] [PubMed] [Green Version]
  15. Zhao, X.; Song, P.; Wang, C.; Riis-Jensen, A.C.; Fu, W.; Deng, Y.; Wan, D.; Kang, L.; Ning, S.; Dan, J.; et al. Engineering covalently bonded 2D layered materials by self-intercalation. Nat. Cell Biol. 2020, 581, 171–177. [Google Scholar] [CrossRef] [PubMed]
  16. Geim, A.K.; Grigorieva, I.V. Van der Waals heterostructures. Nat. Cell Biol. 2013, 499, 419–425. [Google Scholar] [CrossRef] [PubMed]
  17. Pumera, M.; Loo, A.H. Layered transition-metal dichalcogenides (MoS2 and WS2) for sensing and biosensing. TrAC Trends Anal. Chem. 2014, 61, 49–53. [Google Scholar] [CrossRef]
  18. Guo, L.; Yang, Z.; Marcus, K.; Li, Z.; Luo, B.; Zhou, L.; Wang, X.; Du, Y.; Yang, Y. MoS2/TiO2 heterostructures as nonmetal plasmonic photocatalysts for highly efficient hydrogen evolution. Energy Environ. Sci. 2018, 11, 106–114. [Google Scholar] [CrossRef]
  19. Scarano, D.; Cesano, F.; Zecchina, A. MoS2 Domains on TiO2-Based Nanostructures: Role of Titanate/TiO2 Transformation and Sulfur Doping on the Interaction with the Support. J. Phys. Chem. C 2019, 123, 7799–7809. [Google Scholar] [CrossRef]
  20. Cravanzola, S.; Sarro, M.; Cesano, F.; Calza, P.; Scarano, D. Few-Layer MoS2 Nanodomains Decorating TiO2 Nanoparticles: A Case Study for the Photodegradation of Carbamazepine. Nanomaterials 2018, 8, 207. [Google Scholar] [CrossRef] [Green Version]
  21. Kumar, S.G.; Devi, L.G. Review on Modified TiO2 Photocatalysis under UV/Visible Light: Selected Results and Related Mechanisms on Interfacial Charge Carrier Transfer Dynamics. J. Phys. Chem. A 2011, 115, 13211–13241. [Google Scholar] [CrossRef]
  22. Rao, C.; Maitra, U.; Waghmare, U.V. Extraordinary attributes of 2-dimensional MoS2 nanosheets. Chem. Phys. Lett. 2014, 609, 172–183. [Google Scholar] [CrossRef]
  23. Zhou, X.; Dong, H. A Theoretical Perspective on Charge Separation and Transfer in Metal Oxide Photocatalysts for Water Splitting. ChemCatChem 2019, 11, 3688–3715. [Google Scholar] [CrossRef]
  24. Selcuk, S.; Selloni, A. Surface Structure and Reactivity of Anatase TiO2 Crystals with Dominant {001} Facets. J. Phys. Chem. C 2013, 117, 6358–6362. [Google Scholar] [CrossRef]
  25. Yang, X.; Huang, H.; Jin, B.; Luo, J.; Zhou, X. Facile synthesis of MoS2/B-TiO2 nanosheets with exposed {001} facets and enhanced visible-light-driven photocatalytic H2 production activity. RSC Adv. 2016, 6, 107075–107080. [Google Scholar] [CrossRef]
  26. Chen, H.; Wen, X.; Zhang, J.Z.G.; Wu, T.; Gong, Y.; Zhang, X.; Yuan, J.; Yi, C.; Lou, J.; Ajayan, P.M.; et al. Ultrafast formation of interlayer hot excitons in atomically thin MoS2/WS2 heterostructures. Nat. Commun. 2016, 7, 12512. [Google Scholar] [CrossRef]
  27. Hu, X.; Lu, S.; Tian, J.; Wei, N.; Song, X.; Wang, X.; Cui, H. The selective deposition of MoS2 nanosheets onto (101) facets of TiO2 nanosheets with exposed (001) facets and their enhanced photocatalytic H2 production. Appl. Catal. B: Environ. 2019, 241, 329–337. [Google Scholar] [CrossRef]
  28. Chen, C.; Xin, X.; Zhang, J.; Li, G.; Zhang, Y.; Lu, H.; Gao, J.; Yang, Z.; Wang, C.; He, Z. Few-Layered MoS2 Nanoparticles Loaded TiO2 Nanosheets with Exposed {001} Facets for Enhanced Photocatalytic Activity. Nano 2018, 13, 1850129. [Google Scholar] [CrossRef]
  29. Zhang, J.; Huang, L.; Lu, Z.; Jin, Z.; Wang, X.; Xu, G.; Zhang, E.; Wang, H.; Kong, Z.; Xi, J.; et al. Crystal face regulating MoS2/TiO2 (001) heterostructure for high photocatalytic activity. J. Alloy. Compd. 2016, 688, 840–848. [Google Scholar] [CrossRef]
  30. Cao, L.; Wang, R.; Wang, N.; Li, X.; Jia, H. MoS2-hybridized TiO2 nanosheets with exposed {001} facets to enhance the visible-light photocatalytic activity. Mater. Lett. 2015, 160, 286–290. [Google Scholar] [CrossRef]
  31. Wei, T.; Lau, W.-M.; An, X.; Liu, J. Interfacial Charge Transfer in MoS2/TiO2 Heterostructured Photocatalysts: The Impact of Crystal Facets and Defects. Molecules 2019, 24, 1769. [Google Scholar] [CrossRef] [Green Version]
  32. Dozzi, M.V.; Selli, E. Specific Facets-Dominated Anatase TiO2: Fluorine-Mediated Synthesis and Photoactivity. Catalysts 2013, 3, 455–485. [Google Scholar] [CrossRef]
  33. Gordon, T.R.; Cargnello, M.; Paik, T.; Mangolini, F.; Weber, R.T.; Fornasiero, P.; Murray, C.B. Nonaqueous Synthesis of TiO2 Nanocrystals Using TiF4 to Engineer Morphology, Oxygen Vacancy Concentration, and Photocatalytic Activity. J. Am. Chem. Soc. 2012, 134, 6751–6761. [Google Scholar] [CrossRef] [PubMed]
  34. Uddin, J.; Cesano, F.; Chowdhury, A.R.; Trad, T.; Cravanzola, S.; Martra, G.; Mino, L.; Zecchina, A.; Scarano, D. Surface Structure and Phase Composition of TiO2 P25 Particles After Thermal Treatments and HF Etching. Front. Mater. 2020, 7, 192. [Google Scholar] [CrossRef]
  35. Mino, L.; Pellegrino, F.; Rades, S.; Radnik, J.; Hodoroaba, V.-D.; Spoto, G.; Maurino, V.; Martra, G. Beyond Shape Engineering of TiO2 Nanoparticles: Post-Synthesis Treatment Dependence of Surface Hydration, Hydroxylation, Lewis Acidity and Photocatalytic Activity of TiO2 Anatase Nanoparticles with Dominant {001} or {101} Facets. ACS Appl. Nano Mater. 2018, 1, 5355–5365. [Google Scholar] [CrossRef] [Green Version]
  36. Davydov, A. Theoretical Fundamentals and Experimental Considerations of the Spectroscopic Methods Used in Surface Chemistry; Wiley: Chichester, UK, 2003; pp. 1–25. [Google Scholar]
  37. Pellegrino, F.; Sordello, F.; Mino, L.; Minero, C.; Hodoroaba, V.-D.; Martra, G.; Maurino, V. Formic Acid Photoreforming for Hydrogen Production on Shape-Controlled Anatase TiO2 Nanoparticles: Assessment of the Role of Fluorides, {101}/{001} Surfaces Ratio, and Platinization. ACS Catal. 2019, 9, 6692–6697. [Google Scholar] [CrossRef]
  38. Han, X.; Kuang, Q.; Jin, M.; Xie, Z.; Zheng, L. Synthesis of Titania Nanosheets with a High Percentage of Exposed (001) Facets and Related Photocatalytic Properties. J. Am. Chem. Soc. 2009, 131, 3152–3153. [Google Scholar] [CrossRef]
  39. Zhang, Y.; Cai, J.; Ma, Y.; Qi, L. Mesocrystalline TiO2 nanosheet arrays with exposed {001} facets: Synthesis via topotactic transformation and applications in dye-sensitized solar cells. Nano Res. 2017, 10, 2610–2625. [Google Scholar] [CrossRef]
  40. Muscuso, L.; Cravanzola, S.; Cesano, F.; Scarano, D.; Zecchina, A. Optical, Vibrational, and Structural Properties of MoS2 Nanoparticles Obtained by Exfoliation and Fragmentation via Ultrasound Cavitation in Isopropyl Alcohol. J. Phys. Chem. C 2015, 119, 3791–3801. [Google Scholar] [CrossRef]
  41. Cesano, F.; Bertarione, S.; Piovano, A.; Agostini, G.; Rahman, M.M.; Groppo, E.; Bonino, F.; Scarano, D.; Lamberti, C.; Bordiga, S.; et al. Model oxide supported MoS2 HDS catalysts: Structure and surface properties. Catal. Sci. Technol. 2011, 1, 123–136. [Google Scholar] [CrossRef]
  42. Cravanzola, S.; Cesano, F.; Magnacca, G.; Zecchina, A.; Scarano, D. Designing rGO/MoS2 hybrid nanostructures for photocatalytic applications. RSC Adv. 2016, 6, 59001–59008. [Google Scholar] [CrossRef]
  43. Cesano, F.; Agostini, G.; Scarano, D. Nanocrystalline TiO2 micropillar arrays grafted on conductive glass supports: Microscopic and spectroscopic studies. Thin Solid Film. 2015, 590, 200–206. [Google Scholar] [CrossRef]
  44. Sharma, A.A.; Mahlouji, R.; Wu, L.; Verheijen, M.A.; Vandalon, V.; Balasubramanyam, S.; Hofmann, J.P.; Kessels, W.M.M.; Bol, A.A. Large area, patterned growth of 2D MoS2 and lateral MoS2–WS2 heterostructures for nano- and opto-electronic applications. Nanotechnology 2020, 31, 255603. [Google Scholar] [CrossRef] [Green Version]
  45. Cravanzola, S.; Cesano, F.; Gaziano, F.; Scarano, D. Sulfur-Doped TiO2: Structure and Surface Properties. Catalysts 2017, 7, 214. [Google Scholar] [CrossRef] [Green Version]
  46. Kumar, S.; Shakya, J.; Mohanty, T. Probing interfacial charge transfer dynamics in MoS2/TiO2 nanocomposites using scanning Kelvin probe for improved photocatalytic response. Surf. Sci. 2020, 693, 121530. [Google Scholar] [CrossRef]
  47. Mignuzzi, S.; Pollard, A.J.; Bonini, N.; Brennan, B.; Gilmore, I.S.; Pimenta, M.A.; Richards, D.; Roy, D. Effect of disorder on Raman scattering of single-layer MoS2. Phys. Rev. B 2015, 91. [Google Scholar] [CrossRef] [Green Version]
  48. Cravanzola, S.; Cesano, F.; Gaziano, F.; Scarano, D. Carbon Domains on MoS2/TiO2 System via Catalytic Acetylene Oligomerization: Synthesis, Structure, and Surface Properties. Front. Chem. 2017, 5, 91. [Google Scholar] [CrossRef] [PubMed] [Green Version]
  49. Lee, C.; Yan, H.; Brus, L.E.; Heinz, T.F.; Hone, J.; Ryu, S. Anomalous Lattice Vibrations of Single- and Few-Layer MoS2. ACS Nano 2010, 4, 2695–2700. [Google Scholar] [CrossRef] [Green Version]
  50. Li, H.; Zhang, Q.; Yap, C.C.R.; Tay, B.K.; Edwin, T.H.T.; Olivier, A.; Baillargeat, D. From Bulk to Monolayer MoS2: Evolution of Raman Scattering. Adv. Funct. Mater. 2012, 22, 1385–1390. [Google Scholar] [CrossRef]
  51. Wilcoxon, J.P.; Newcomer, P.P.; Samara, G.A. Synthesis and optical properties of MoS2 and isomorphous nanoclusters in the quantum confinement regime. J. Appl. Phys. 1997, 81, 7934–7944. [Google Scholar] [CrossRef]
  52. Cravanzola, S.; Muscuso, L.; Cesano, F.; Agostini, G.; Damin, A.; Scarano, D.; Zecchina, A. MoS2 Nanoparticles Decorating Titanate-Nanotube Surfaces: Combined Microscopy, Spectroscopy, and Catalytic Studies. Langmuir 2015, 31, 5469–5478. [Google Scholar] [CrossRef] [PubMed]
  53. Matte, H.S.S.R.; Gomathi, A.; Manna, A.K.; Late, D.J.; Datta, R.; Pati, S.K.; Rao, C.N.R. MoS2 and WS2 Analogues of Graphene. Angew. Chem. Int. Ed. 2010, 49, 4059–4062. [Google Scholar] [CrossRef]
  54. Shi, H.; Yan, R.; Bertolazzi, S.; Brivio, J.; Gao, B.; Kis, A.; Jena, D.; Xing, H.G.; Huang, L. Exciton Dynamics in Suspended Monolayer and Few-Layer MoS2 2D Crystals. ACS Nano 2013, 7, 1072–1080. [Google Scholar] [CrossRef] [PubMed]
  55. Tsyganenko, A.A.; Can, F.; Travert, A.; Maugé, F. FTIR study of unsupported molybdenum sulfide?in situ synthesis and surface properties characterization. Appl. Catal. A Gen. 2004, 268, 189–197. [Google Scholar] [CrossRef]
  56. Bolis, V.; Barbaglia, A.; Bordiga, S.; Lamberti, A.C.; Zecchina, A. Heterogeneous Nonclassical Carbonyls Stabilized in Cu(I)− and Ag(I)−ZSM-5 Zeolites: Thermodynamic and Spectroscopic Features. J. Phys. Chem. B 2004, 108, 9970–9983. [Google Scholar] [CrossRef]
  57. Bachelier, J.; Duchet, J.; Cornet, D. On the promoting effect in sulfided Ni$z.sbnd;Mo/Al2O3 catalysts as studied by chemisorption. J. Catal. 1984, 87, 283–291. [Google Scholar] [CrossRef]
  58. Maugé, F.; LaMotte, J.; Nesterenko, N.; Manoilova, O.; Tsyganenko, A. FT-IR study of surface properties of unsupported MoS2. Catal. Today 2001, 70, 271–284. [Google Scholar] [CrossRef]
Scheme 1. Main steps of the synthesis processes of the MoS2/TiO2 nanosheets obtained by an ex situ method (on the left side) and by an in situ method (on the right side).
Applsci 11 00143 sch001
Figure 1. XRD patterns of TiO2 anatase nanosheet (n-sh) pre-treated at 873K (black line), of MoS2/TiO2 n-sh prepared by the ex situ method (blue line), of MoS2/TiO2 n-sh obtained by the in situ approach (red line), and of pure bulk MoS2 used as a reference material (grey line). Asterisks (*) show the weak diffraction features typical of MoS2.
Applsci 11 00143 g001
Figure 2. TEM and HRTEM images obtained at different magnifications of MoS2/TiO2 n-sh prepared by the ex situ method: (a) TEM image of TiO2 nanosheets aggregates; (b) enlarged view of the selected region in panel (a); (c) HRTEM image of TiO2 nanosheets exposing well-defined interference fringes; (d) HRTEM image of MoS2 slab with the stacking number >5–6.
Applsci 11 00143 g002
Figure 3. TEM and HRTEM images obtained at different magnifications of MoS2/TiO2 n-sh prepared by in situ method: (a) TEM image of MoS2/TiO2 n-sh aggregates; (b) enlarged view of the selected region in panel (a); (c,d) HRTEM images at two different levels of magnification of the selected region in panel (b), where regular interference fringes, 3.53 Å spaced, that correspond to (101) planes of anatase are decorated with more irregular fringes due to MoS2 nanoparticles.
Applsci 11 00143 g003
Figure 4. (a) Raman spectra, in the 800–100 cm−1 range, of pure bulk MoS2 used as a reference material (grey line), of MoS2/TiO2 n-sh obtained by the ex situ method (blue line), of MoS2/TiO2 n-sh obtained by the in situ method (red line), and of the TiO2 anatase nanosheet (n-sh) pretreated at 873 K (black line). All spectra were recorded with the 514 nm laser line. (b) Enlarged views in the 425–365 cm−1 range: the grey dashed lines in bulk MoS2 spectrum indicate the positions of the E12g and A1g peaks, respectively. Deconvolution of the Raman patterns are shown for ex situ (blue line) and in situ (red line) samples.
Applsci 11 00143 g004
Figure 5. UV–vis spectra of TiO2 anatase nanosheet (n-sh) pretreated at 873 K (black line), of pure bulk MoS2 used as a reference material (grey line), of in situ MoS2/TiO2 n-sh (red line), and of ex situ MoS2/TiO2 n-sh (blue line). The grey dotted lines indicate the positions of the typical MoS2 A and B excitonic transitions. All spectra were recorded in the diffuse reflectance mode and converted to equivalent absorption Kubelka–Munk units. The reflectance responses are reported vs. wavenumber (bottom axis) and vs. wavelength (top axis).
Applsci 11 00143 g005
Figure 6. FTIR spectra of CO (30 Torr) adsorbed at 77 K at decreasing coverage on the surface of: (a) TiO2 anatase nanosheet (n-sh) pretreated at 873K, (b) MoS2/TiO2 n-sh obtained by the ex situ method, and (c) MoS2/TiO2 n-sh obtained by the in situ method.
Applsci 11 00143 g006
Figure 7. FTIR spectra, recorded at 77K, at the maximum coverage of CO (30 Torr) adsorbed on the surface of TiO2 anatase nanosheet (n-sh) pretreated at 873 K (black curve), of MoS2/TiO2 n-sh obtained by the ex situ method (blue curve), and of MoS2/TiO2 n-sh obtained by the in situ approach (red curve).
Applsci 11 00143 g007
Publisher’s Note: MDPI stays neutral with regard to jurisdictional claims in published maps and institutional affiliations.

