Abstract
The aim of this work was to develop a method for the automatic identification of exudates, using an unsupervised clustering approach. The ability to classify each pixel as belonging to an eventual exudate, as a warning of disease, allows for the tracking of a patient’s status through a noninvasive approach. In the field of diabetic retinopathy detection, we considered four public domain datasets (DIARETDB0/1, IDRID, and e-optha) as benchmarks. In order to refine the final results, a specialist ophthalmologist manually segmented a random selection of DIARETDB0/1 fundus images that presented exudates. An innovative pipeline of morphological procedures and fuzzy C-means clustering was integrated in order to extract exudates with a pixel-wise approach. Our methodology was optimized, and verified and the parameters were fine-tuned in order to define both suitable values and to produce a more accurate segmentation. The method was used on 100 tested images, resulting in averages of sensitivity, specificity, and accuracy equal to 83.3%, 99.2%, and 99.1%, respectively.
1. Introduction
Ocular diseases have sparked remarkable interest because they are serious and influence a large portion of the population. An example of a relevant ocular disease is diabetic retinopathy (DR) [1], because it may cause blindness in working-age patients. DR is a progressive pathology that can change from mild to severe non-proliferative disease, and it is an important factor contributing to blindness. This disease affects up to 80% of those who have suffered from diabetes for 10 years or more [2]. Due to increases in life expectancy and other factors, the number of people affected by exudates is growing [3]. Exudates are one of the main symptoms of DR, caused by the leakage of proteins and lipids from damaged blood vessels in the retina. They can be recognized as yellow lesions distributed on the interior surface of the eye, with different sizes in different locations, according to the severity of the retinopathy (Figure 1a). From a practical point of view, it must be noted that DR does not show salient symptoms in the early stages [4]; therefore, it is a challenge to identify the disease early enough to give a better chance for successful treatment [5]. To diagnose and implement a treatment, screening checks are required that, at present, require professional clinicians. On the other hand, automated mass screening tasks are an active area of research with promising potential in the field of computer vision [3]. Other examples of artifacts that may appear in the retina include hemorrhage, the escape of blood from vessels that appears as red lesions, and different types of pus [2]. The World Diabetes Foundation estimates that more than 640 million people will suffer from diabetes by the year 2040 [6].
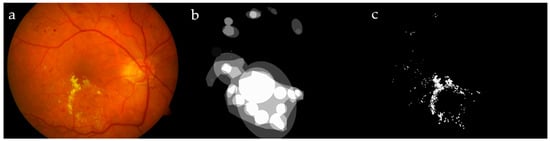
Figure 1.
Image #19 from DIARETDB1 (a); ground truths from the dataset (b) and by our ophthalmologist (c), for a visual comparison.
In the machine-learning literature, many clustering methods have been presented, and each one has advantages and disadvantages. Mainly, these methods are accomplished either with crisp (hard) or fuzzy (soft) clustering. The first defines specific boundaries between clusters; hence, each pixel strictly belongs to a particular cluster. Fuzzy clustering defines data as belonging to more than one cluster with different membership values; as the membership value increases, there is a higher confidence in assigning the object to the correct cluster [7]. It is convenient to use fuzzy clustering in non-deterministic problems, such as overlapping intensities, poor contrast, and noise homogeneities variation. This motivated us to use the fuzzy C-means clustering (FCM) technique to locate the exudates in fundus images, as they can benefit from non-deterministic properties. FCM clustering is becoming more and more popular in many disciplines, for its merits as it is an unsupervised clustering tool that is easy to implement [8], while various applications proved its superiority with respect to other well-known algorithms, such as K-means [9,10].
Numerous algorithms were developed to detect DR semi-automatically or fully automatically. To the best of our knowledge, they have not been applied to tracking DR progress over time. Typically, the early stages of DR do not show particular symptoms, but they are predominantly present by the time the number and severity of the disease increase [4]. Tracking of DR requires the ability to define exudates as landmarks, to match and to compare their status periodically through exact identification.
A supervised classification to detect hard exudates (HE) in human fundus images was proposed in Reference [1]; that method was implemented by applying a contrast adaptive histogram equalization preprocessing to the fundus images and extracting a set of influential features (i.e., standard deviation of the intensity, mean, intensity, size, edge strength, and compactness of the segmented candidates). Those features were used in an echo state neural network, to classify the segments into pathological or normal regions. A set of 50 normal/pathological fundus images was selected; 35 of the images were used for training and 15 for testing. A system to detect diabetic macular edema through automatic detection of exudates by using the publicly available datasets MESSIDOR, DIARETDB1, and HEI-MED1 (which included 69 patients with different levels of diabetic macular edema) was introduced in Reference [11]. It was designed to automatically detect exudates with some confidence level, in order to separate true/false positives, depending on color-space information and wavelet analysis. A subsequent combination of feature sets and classifiers (nearest neighbor, naïve Bayes, support vector machine, and random forests) was evaluated, to select an appropriate classification strategy. The final results were evaluated by hold-one-out and cross-validation.
Exudate segmentation approaches are based mainly on thresholding, region growing, classification techniques, and mathematical morphology. The detection of hard exudates in Reference [12] was based on morphological features; moreover, post-processing techniques were implemented to distinguish exudates from other bright artifacts, such as cotton–wools and the optic disc. In Reference [13], hard exudates were detected on two hundred proprietary retinal images by using four color and 25 texture features fed to the fuzzy support vector machine capable of avoiding the effect of outliers, noise, and artifacts. The optic disc was first detected and excluded, as its color is quite similar to hard exudates. It was emphasized in Reference [14] that numerous studies are devoted to detecting exudates automatically, in order to provide decision support and to reduce ophthalmologist workload. Exudate-detection approaches were categorized into thresholding, region growing, clustering, morphology, classification, and others. A list of 71 algorithms with corresponding sensitivity, specificity, and accuracy performances were presented.
A modified new optimized mathematical morphological approach to hard exudates for diabetic retinopathy screening was described in Reference [15]. The method utilizes multi-space-based intensity features, geometric features, a gray-level co-occurrence matrix-based texture descriptor, and a gray-level-size matrix-based texture descriptor to construct handcrafted features. A deep convolutional neural network learns the deep information of HE, and a random forest identifies HE within the candidate ones. Four datasets were considered (three of them are publicly available) in the validation process, and the results were compared with the manual labeled ground truth on the pixel and image levels. A recent work [16] presented a weakly supervised multitask architecture with three stages to segment bright and red lesions on fundus images. The data were augmented through a random combination of one or more transformations, and a compromised patch extraction of 256 × 256 pixels was used. Five datasets were used for training and testing for pixel- and image-level validation.
These methods can be applied to the evident diseases, while the proposed approach intends to help the physician follow DR in the early stages, and its progress over time. Section 2 of this manuscript is devoted to describing the materials and methods of preprocessing. Section 3 introduces our methodology, which in turn is divided into three steps: detecting expected exudates, features extraction, and FCM clustering. Experimental results, discussion, and conclusions are reported in Section 4 and Section 5.
2. Materials and Methods
Four retinal datasets relevant to exudates were used to train and evaluate the method: DIARETDB0/1, IDRID, and e-optha datasets. The Standard Diabetic Retinopathy Databases Calibration Levels 0/1 (known as DIARETDB0/1) [4] were used to train and also to experimentally validate our automatic exudate detection method. These datasets are publicly available and collect 1152 × 1500 true-color loss-less images obtained by using a digital fundus camera with a 50° field of view.
The DIARETDB0 dataset consists of 130 fundus images, of which 20 present normal cases and 110 contain signs of DR (hard exudates, soft exudates, microaneurysms, hemorrhages, and neovascularization). The data correspond to practical situations and can be used to evaluate the general performance of diagnosis methods. This dataset is referred to as “calibration level 0 fundus images”, and it was published in 2006. On the other hand, the DIARETDB1 dataset consists of 89 fundus images, of which 84 contain at least mild non-proliferative signs (microaneurysms) of DR and 5 are considered to be normal cases which do not contain any sign of DR, according to all experts who participated in the evaluation. The data correspond to a good (not necessarily typical), practical situation. This dataset is referred to as “calibration level 1 fundus images”, published in 2007. Both of these datasets can be used to evaluate the general performance of diagnostic methods.
The ground truth in DIARETDB0 was defined precisely in each image, including both the center coordinates and the type of each pus as an exudate/hemorrhage/cotton–wool area, while, in DIARETDB1, the ground truth was prepared by four experts, showing the affected regions and not specifying the infected areas. A set of random images from these datasets containing hard exudates was segmented manually by our expert ophthalmologist; the set included 19 DIARETDB0 and another 10 DIARETDB1 images affected by DR. Figure 1 shows a sample image from DIARETDB1, together with its ground truth provided in the dataset and created by our ophthalmologist.
The ground truths introduced in the two datasets are not suitable for our methodology. The former reports only the center of the exudate, while the latter indicates the affected region in a rough way. A comparison was made between our expert and the DIARETDB1 ground truth (GT), showing 95.7% sensitivity and 90.8% specificity.
Another dataset used to evaluate our method was the popular Indian Diabetic Retinopathy Image Dataset (IDRID). The use of this dataset was required for testing the evaluation process, and it was used as an additional testing dataset, without being incorporated into the training process. It was also used to confirm and compare the reliability of our proposed methodology on images outside of the training. The dataset included 81 colored retinal images (jpg files) with resolutions of 4288 × 2848 pixels with fields of view devoted to hard exudates. These images were annotated at the pixel level, in ground truth segmentations that were provided as a binary mask (tif files). The use of 80% of the whole dataset as training and 20% as testing was suggested in Reference [17]. As this work is devoted to the detection of hard exudates, 50 images were selected from this dataset for testing.
The fourth dataset used to test and evaluate our proposed algorithm was e-optha [18], which included colored fundus images (jpg files), in addition to the binary masks (png files) that provided exact contoured annotations by an expert ophthalmologist that were revised by another expert. Moreover, healthy patients without lesions were also provided. The dataset contained 47 images with exudates and 35 images without exudates, as well as four different sizes of the images, ranging from 1440 × 960 to 2544 × 1696 pixels. All images were acquired under the same view angle of . A set of 25 random images was selected.
Exudates, optic discs, and some vessels (particularly when there was a light reflex) all exhibit a similar yellowish color and can be partially similar in shape, meaning that the tool can make some mistakes quite easily. Hence, ignoring the presence of optic discs and vessels in the image was expected to improve the overall classification performance. Optic disc and vessel detection methods are illustrated in the following.
2.1. Preprocessing—Optic Disc Segmentation
Noticing that the brightness of the optic disc (OD) is dominating with respect to the rest of the retina, many authors of papers suggested automated techniques for detecting the OD in fundus images; for instance, texture descriptors and a regression-based method to locate the OD were described in Reference [19]. Here we chose to use the intensity channel (I) from the HSI color space. Then, the median filter was applied, to reduce the presence of small objects, outliers, and artifacts, while preserving the main edges. To obtain a better contrast within the image, the contrast-limited adaptive histogram equalization (CLAHE) [1] was applied. Morphological Closing with a disk-shaped structuring element (SE) was enough to eliminate blood vessels and to locate the OD. The size of the SE was defined through testing a series of values, concluding that 15 pixels was the most appropriate size for the considered dataset.
The resulting image was then binarized by using the global image threshold based on the standard deviation approach; the process of thresholding may be particularly useful to remove unnecessary details or variations by focusing on highlighting details that are of interest.
Although the binary image contained other structures rather than the OD, all small structures could be deleted by using the label filtering, while keeping the largest area object which represented the OD. A technique involving labeling connected pixels was used: It isolated the individual objects by using the eight connected neighborhoods and label propagation. After labeling the connected areas in the image, all components having less than 700 pixels were removed on each image, thus obtaining the OD alone. The effect of the whole pipeline of operations can be seen in Figure 2.

Figure 2.
Locating optic disc (OD): intensity of a fundus image (a); median filter (b); contrast-limited adaptive histogram equalization (CLAHE) (c) and closing (d) filters; and thresholding output on the filters output in (e) and OD detection in (f).
2.2. Preprocessing—Vessel Segmentation
Retinal vessels present a wide range of colors, usually from red to yellow, that make some cases very similar to exudates. To solve this confusing problem, vessels need to be automatically located and then excluded from the images. We verified that the green channel in the RGB color space holds the most instructive information because the vessels appear considerably darker than the background. The red and blue channels point out noise and low contrast, respectively. This motivated many researchers, including us, to focus on the green channel. To enhance the contrast in this image, we carried out the CLAHE preprocessing. A successive Gaussian filter was applied on this image, to get rid of noise and irrelevant details (Figure 3a,b). Gaussian filtering was accomplished in two steps: firstly, removing bright details smaller than a threshold, by applying area opening, and secondly, by applying a Gaussian filter, for noise reduction.
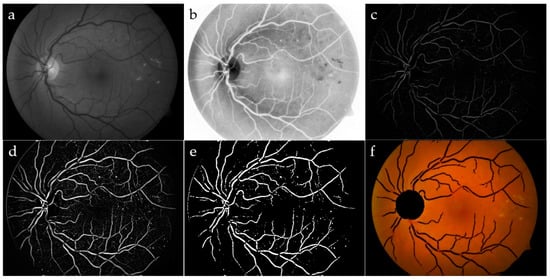
Figure 3.
Vessel segmentation: green channel (a) and its CLAHE enhancement (b); area opening, followed by Gaussian filtering (c); top-hat transform (d); adjusted intensity (e); OD and blood vessels have been removed by the original image (f).
To refine the vessels, a top-hat filter was implemented by using a single-disk SE with radii from 5 to 15 pixels [20], producing an image containing the parts that were smaller than the SE and were darker than their surroundings. Blood vessels appeared as clear elongated objects, while the background was black, as shown in Figure 3c. An image with good contrast has sharp differences between black and white. Hence, contrast adjustment was implemented to remap image intensity values to the full display range of the data type. A preliminary segmented image was obtained again through a standard deviation thresholding algorithm, followed by a mathematical opening operator. The Erosion, as a part of opening operator, typically eliminates small bright objects, and the subsequent Dilation tends to restore the shape of the objects that remain, hence preserving the structures. The same label filter technique previously discussed was used in order to delete the remaining non-vessel structures of small sizes, where, in this case, any area containing less than 300 pixels was removed for each image. The final result for the blood vessel network after implementing the label filtering superimposed on the colored retinal image is shown in Figure 3f.
3. Proposed Methodology
Optic disc and blood vessel detection during the preprocessing stage were combined together, as these components are excluded from the original image (Figure 3f). The three main stages, sketched in Figure 4, constitute the strategy of the proposed methodology: extracting expected exudates, computing their features, and executing the FCM classifier. The proposed algorithm was implemented in MATLAB 2017a, and the processing time for a standard image with 1152 × 1500 pixels was about 30 s on a conventional computer (Intel i7-2600 dated 2011, with 8 GB RAM running the Windows 10 operating system). Our approach can be described as a simple yet effective algorithm, adopted by a small number of ground-truth samples, able to compete with the state-of-the-art algorithms.

Figure 4.
Flowchart of the proposed algorithm. FCM, fuzzy C-means clustering.
3.1. Extracting Expected Exudates
Our expert ophthalmologist who created the ground truth analyzed a set of random images from DIARETDB0 and DIARETDB1 that highlighted DR. The method faces a lot of challenges: the retina color varies according to skin pigmentation and iris color [12,21], exudate lesions may appear blurrier in some locations as intra/inter variation in an image/images [22], and the spherical shape of the eye reflects on both illumination and sharpness of the fundus image. Because the main information was present in the green channel, we applied the Otsu binarization algorithm [23] after a Sobel filter on this image channel that enhanced and then eliminated the optic disc and the vessels’ components present in the binary mask. Although the procedure described was simple and decidedly rapid, the resulting image, Iout, contained the expected exudates. This sequence of processing is depicted in a flowchart in Figure 5. These candidate exudates are not perfectly defined and still must be tuned. Figure 6 shows the detailed outputs of the sequence of the steps.
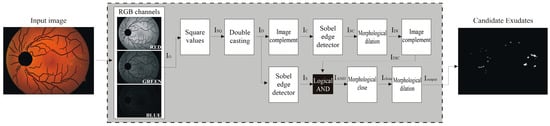
Figure 5.
Main steps of the proposed algorithm.

Figure 6.
Expected exudates: IG—green channel image (a); ID—squared normalized image of IG (b); IS—binarized Sobel image of ID (c); IC—complement of ID (d); ISC—binarized Sobel of IC (e); IDI—dilated ISC (f) and its complement (g); IOUT—closing and dilation morphological operation (h) on both IS and IDI images.
3.2. Feature Extraction
In extracting the exudates, it is convenient to start looking for different color properties, as exudates present shades of yellow within the surrounding background. In spite of this, we conducted assessments on different color spaces (e.g., RGB, XYZ, HSI, Lab and Luv), to ensure, pixel by pixel, the best combination of features to be passed to the FCM clustering algorithm. In particular, we considered the main statistical measures, such as variance, standard deviation, and entropy, which are able to emphasize the differences between the foreground and background, which characterize the texture. Defining the properties of a pixel is highly correlated to its features. How the features are constructed is also relevant to the specific attributes of the pixel under study.
As exudates have variable distinctive sizes and shapes regarding the surrounding background, their edges must be confirmed by using features depending on the change in color and intensity, which can be measured through many statistical metrics, mainly variance, standard deviation, and entropy. The processes of training and defining the parameters of the suggested algorithm depended on the DIARETDB dataset; hence, the considered images were resized to the resolution of 1152 × 1500 pixels. In general, hard exudates present sharp edges with a yellowish color; consequently, both the standard deviations of the intensity and the Y channels are involved to detect these edges. This feature is not evident in the case of cotton–wool, hence not aimed to be detected by the algorithm. The intensity was accounted to avoid pixels of inconsistent colors, consequently excluding reddish pixels, such as dot hemorrhage. Another implemented probabilistic measure is entropy, H; it measures randomness, to characterize the texture of the input image [24]. The effect of varying values between neighboring pixels in a retinal image can be depicted through measuring-difference techniques: a sample of a hue channel, and the corresponding standard deviation of both intensity and the y-channel, in addition to entropy (Figure 7).

Figure 7.
Expected exudates: hue channel (a), std_intensity (b), std_y (c), and entropy (d).
3.3. FCM Clustering
FCM is considered an overlapping unsupervised clustering algorithm; a pixel can belong to more than one cluster at the same time, with different degrees of membership. For instance, referring to Figure 8, which represents a membership function of a variable input, notice that those values belonging to the intervals [a, b] and [c, d] had a corresponding membership of 1 and 0, respectively, consequently belonging to clusters C1 and C2, in order. While those input values belong to the open interval (b, c), their membership value will range between 0 and 1, hence belonging to the two clusters in such a way the sum of the two memberships will always sum up to 1. Depending on the extracted features, FCM automatically specifies the suggested exudates, whether they are really exudates or not, and it assigns each pixel to the closest cluster under similarity measures’ constraints [25].

Figure 8.
The membership function of a two-cluster fuzzy variable.
To clarify both the statistical basis and the structure on which the FCM depends, suppose that i represents a pixel of an expected exudate; then all computed features are to be arranged into a vector (zi). The whole set of such vectors constitutes the input data matrix:
where N and n represent the number of data points and the length of the vectors, respectively. Let U be the membership matrix (µij ∈ [0,1]) which can be defined as a fuzzy partition matrix of Z:
where Mfc denotes the fuzzy c-partitions of a sample of N observations in ℝn.
Z = [z1, z2, …, zN], zi ∈ ℝn
U = [µij] ∈ Mfc
Let V be the cluster center matrix:
where c and vi are the number of clusters and the i-th cluster center vector. An optimized solution is reached if the distance of the feature’s vectors, Z, to the cluster center, V, is minimal. This distance is mathematically modeled as [14]:
where m ∈ [1, ∞) is the fuzziness parameter. This objective function is called the C-means functional. The Lagrange multipliers technique is used to optimize the nonlinear objective function, J, to cluster the data, and FCM can be summarized as follows.
V = [v1, v2, …, vc], vi ∈ ℝn
- Step 1: Initialize the fuzzy membership matrix.by substituting random numbers in the range between 0 to 1 subject to the following:
- Step 2: At iteration k, compute the center vectors.According to Equation (2), we have the following:
- Step 3: Update matrix U(k) to obtain U(k+1) by using Equation (3).
- Step 4: Compute the objective function, J, through Equation (1).If the element-wise difference, d, between U(k+1) and U(k) is less than or equal to ε,then stop the procedure and return the value of the objective function J (see Equation (1)); otherwise, go back to step 2. It is common to define the maximum allowed number of iterations to be limited to a previously defined value, such that either condition (4) is fulfilled, or the number of iterations is reached, which is satisfied first.At the end of the process, the FCM output defines all cluster centers, in addition to the membership degree for each data item; hence, each pixel is assigned to the cluster corresponding to its highest membership. In this case, as an exudate pixel or non-exudate one.
4. Experimental Results and Discussion
Testing our method on the four publicly available datasets, which are relevant to hard exudates, makes the method more reliable. The overall number of images used to train and evaluate the performance was 114 images for both testing and training. The randomly selected images were of good quality, no patient was duplicated, and disease stratification was represented. The collection of images for testing was distributed as follows: 25 from DIARETDB0/1, 50 from IDRID, and finally 25 from the e-optha dataset. Notice that, in supervised classifiers, a huge set of GT is needed to define and calibrate the methodology, while even with a reasonably small number of chosen images, the FCM was well calibrated and efficiently classified exudates.
In order to verify the correctness of the proposed methodology, we compared the output against the valuation provided by our expert ophthalmologist for the DIARETDB0/1 dataset, while for the other datasets, IDRID and e-optha, the provided ground truths were used. The habitually used performance measurements were used to report performance: sensitivity, specificity, positive predictive value, and accuracy. Indeed, labeling each pixel with respect to the ground truth leads to the following cases: true positive (TP), when a pixel is properly considered an exudate; false positive (FP), when a pixel is wrongly considered an exudate; false negative (FN), when a pixel is wrongly considered a non-exudate; and true negative (TN), when a pixel is properly considered a non-exudate. A high value of TP indicates correct identification of exudates [21,26,27,28]. The method of evaluation is in need of further performance measures, which can be derived from the state pixels to define the overall performance of the methodology.
In this paper, two strategies were implemented to evaluate the abilities of our approach. The classical method, to define the four classes (TP, TN, FP, and FN), was achieved by summing up the corresponding pixels between the GT and the resulting segmented image according to their mutual relation. Another method of evaluating the performance of exudate segmentation in retinal fundus images was, however, driven by the expert. The ophthalmologists did not totally agree with each other in their manual GT segmentation regarding exudates for many reasons: the state of the image (clear, blur, sharpen, brightness, outliers, etc.), a complication of the case, the spherical shape of the fundus, etc. This inconsistency in the GT segmentation is evident in other retinal issues, such as vessels: segmentation, crossings, and bifurcations [29], in addition to the optic disc and other landmarks of the retina. This makes the segmentation task quite difficult because no definite and general-purpose rules are followed. Indeed, the authors of References [15,16,30,31] believe that it is more reasonable to consider those connected segmented areas as TP, even though they partially intersect with the GT under particular constraints [32]. In other words, those segmented exudates are considered to be TP, even if the contours are not matched exactly, if and only if the connected components of the segmented portions touch the GT and satisfy a defined ratio of overlapping.
An example is given in the following: Let us suppose a GT and a corresponding segmentation are given as presented in Figure 9a,b, and then each overlapping region between a part of the GT and a segmented portion should exceed a factor ; therefore, the neighboring pixels connected to this part of the relevant GT and segment will be considered as TP pixels [32]. In Figure 9, two regions are affected by the extension: the lower part of the segmented portion of the image which overlaps the GT by 2 pixels from a total region of 5 pixels, making a ratio conversely, the same part of the GT overlaps a portion of the relevant segmented image; this intersection is constructed of 2 pixels out of a total region of 4 pixels representing the GT, making a ratio of . As the criteria are satisfied in both cases, the connected pixels of this portion of the segmented image, as well as the GT, are estimated as TP. On the other hand, the upper-left part similarly achieved the criteria, and, hence, it is considered as TP (the upper-left segmented portion intersects the GT with a ratio of the GT intersects the relevant segmented part with a ratio of ). Hybrid validation techniques (pixel by pixel and extended technique [32]) were implemented here to evaluate and compare our methodology with others under the same circumstances.

Figure 9.
Example of expanded true positive (TP): ground truth (GT) (a); segmented pixels (b); TP (c), false negative (FN) (d), false positive (FP) (e), and true negative (TN) (f).
Sensitivity () evaluates the ability of the methodology to properly detect exudates. Specificity () evaluates the ability to properly detect non-exudates. Accuracy () evaluates the ability to properly detect exudates and non-exudates. Positive Predictive Value () is the correctness degree to detect exudate pixels out of all detected exudate pixels.
FCM was selected as the clustering tool because fundus image properties are not unified and standard: Variations in colors, the presence of noise, and a fuzzy look due to the eye spherical shape are drawbacks that complicate the task. The common dataset DIARETDB0/1, expressly made for exudate detection, was considered the benchmark. The preliminary exclusion of the optic disc and the vessels reduces/prevents false detection of the exudates. A brute-force approach indicated the best feature set, considering the 77 features shown in Table 1. We kept the following four features: hue, entropy, and standard deviation for both the intensity in the HSI color space and the Y channel from the XYZ color space (Figure 10).

Table 1.
Suggested set of features for the FCM classifier.

Figure 10.
Output of each step of features phase: hue (a), std_intensity (b), standard deviation of intensity (c), and Y channel (d).
Standard deviation of intensity, with various window sizes of 3 × 3, 7 × 7, 11 × 11, 15 × 15, and 17 × 17 pixels, was convolved with the expected exudate binary images. Results showed that the highest TP values were obtained for a standard deviation window of 3 × 3 pixels. As the window size increased, small exudate areas were not properly detected; consequently, this loss of exudates reduces the sensitivity of the system. In the case of FP, the value of FP acted in an opposite way to TP; as the standard deviation window size increased, the number of FP values decreased, which negatively affected the specificity. To show the effect of variant window size on detecting the exudates, an example is introduced in Figure 11.

Figure 11.
Exudates detected by using the standard deviation of intensity for window sizes: 3 × 3 (a), 11 × 11 (b), and 17 × 17 (c). Exudates detected by using entropy for window sizes: 3 × 3 (d), 11 × 11 (e), and 17 × 17 (f).
As in the case of standard deviation of intensity, entropy was implemented with different window sizes, from 3 × 3 to 17 × 17 pixels. Increasing the size of the window affected small exudate areas that started to disappear, so the TP value was decreasing and had a negative influence on sensitivity. The FP value decreased as the size got larger, which means the misclassification data decreased. Again, TP and FP contradicted each other. Since TP is more influential on the performance of the method, it is convenient to keep the TP as high as possible, by choosing the smallest window size.
As a side effect of the standard deviation/entropy of intensity, the surrounding pixels of the optic disc are sometimes mistakenly defined as exudates, due to the fact that color properties around the optic disc look similar, to some extent, to exudates. To eliminate this drawback, a disk-shaped SE around the optic disc was executed. An illustration is depicted in Figure 12. In order to define the best SE size, a SE ranging from 25 to 100 pixels was applied on all training images, showing the best overall TP values when the SE was 45 pixels.

Figure 12.
Dilating extracted exudates around the OD: without dilation (a,b) and with dilation, using SE = 45 (c,d).
A set of nine training images from the DIARETDB0/1 that satisfied the abovementioned criteria was chosen randomly. Recalling that FCM is an unsupervised classifier, these training images were used to manipulate and fit the parameters. The remaining images in DIARETDB were used to evaluate the performance of the proposed methodology.
To reduce FP exudates, majority rule was involved to make use of the output of the four features together, taking into consideration the following priorities: hue, standard deviation, and then entropy of the HSI intensity. The standard approach to calculate TP, FP, TN, and FN without expanding was followed, and consequently Se, Sp, and Acc were measured for each image used in the testing datasets. The performance regarding the DIARETDB came to be as follows: Se = 83.2%, Sp = 98.5%, and Acc = 98.3%. These pixel data are treated as landmark information that can be forwarded as a time series of retina images of the same patient, so as to perform a follow-up.
The extended area approach, which is used to evaluate statistical measures, is presented here to compare the performance of our approach regarding the different used datasets, as in Table 2: The average values are quite similar, except in the case of sensitivity, perhaps because the training data were defined on DIARETDB images; hence, parameters fit this dataset more accurately. Though a marginal difference is acceptable, this difference might also be influenced by the variant image sizes of the IDRID and the dark nature of the e-optha images. Moreover, results including the worst samples (i.e., minimum value) are due to the very low contrast between exudates and the background. The relatively low values of the standard deviation promote the algorithm stability.
Table 2.
Statistical readings of exudate segmentation for the implemented datasets.
Figure 13 compares the average values of specificity, sensitivity, and accuracy for the datasets showing stable outputs, which is credited to the methodology. That might indicate the ability to identify exudates in other different suitable datasets.

Figure 13.
Performance comparison between DIARETDB, IDRID, and e-optha.
A review of the results of the training and testing data showed good performance with acceptable variation in extracting the exudates, which can be interpreted as the differences among the datasets; for instance, the e-optha dataset has darker images, while the IDRID dataset has high-quality larger-size dimensions. A numerical comparison of the average performances for the proposed method is shown in Table 3, where each dataset of the used three measures is illustrated explicitly. The first comparison presented here is made to those studies that used FCM to achieve automatic exudates detection, similar to ours (Table 3). Consequently, this provides ophthalmologists with an additional tool with minimal effort to diagnose and treat a part of ophthalmic diseases [33]. The proposed approach is comparable to others for any of the used datasets, especially for Sp and Acc.
Table 3.
A comparative study of FCM algorithms to detect exudates.
Our methodology outperforms the state-of-the-art approaches in both specificity and accuracy, under the same datasets. As in this work, the performance is measured pixel by pixel, and we notice good results with average Se = 78.4% for the testing data; on the other hand, the training data came to have Se = 83.2%. This decrease is due to Image #11, which had 60.1% sensitivity. A typical output of the algorithm is represented in Figure 14, noting that the FCM classified those probable exudate pixels into C1, representing non-exudates, and C2, representing exudate pixels.

Figure 14.
FCM clustering: RGB expected exudates (a); GT (b); clusters C1 (c) and C2 (d); red represents extracted exudates, while white pixels refer to the GT (e); superimposed results on the original image (f); extracted exudates after morphological processing (g); superimposed results after mathematical morphology (h).
The proposed algorithm showed remarkably high specificity, which shows its ability to avoid recognizing a non-exudate pixel as an exudate. However, the sensitivity had a lower value due to those exudates with low intensity, which are still hard to detect perfectly [34]. For the sake of completeness, we report for the DIARETDB dataset the best (Image #27 with Se = 99.2% / 99.8%; Image #16 with Acc = 97.6%/99.0%) and the worst cases (Image #16 with Se = 62.9%/76.0%; Image #27 with Acc = 93.7%/94.9%) evaluated, using both pixel by pixel and the extended technique [32]. The same two images present opposite behaviors depending on the measure used (Figure 15). On the other hand, the obtained overall performance of the algorithm on average came to be as follows: Se = 83.3%, Sp = 99.2%, and Acc = 99.1%. The performance of all tested images in DIARETDB is shown in Figure 16. Finally, Table 4 compares state-of-the-art algorithms [15,16,35] and our proposed one.

Figure 15.
Extracting exudates in DIARETDB0: Image #21 (a,b), Image #25 (c,d), Image #27 (e,f), and Image #16 (g,h).

Figure 16.
Performance of the algorithm of the 25 images from DIARETDB0/1.
Table 4.
Comparative results with state-of-the-art testing.
5. Conclusions
Morphological-based techniques proved their efficiency in detecting and recognizing bright patches, especially with good-quality images. Our approach involved an FCM classifier in the algorithm, to continue to improve the accuracy.
Retinal landmarks can be used to manage the evolution of diseases and, at the same time, to evaluate the effectiveness of the treatment by acquiring photographs through sequential periods [36]. Consistently, identifying exudates in a fundus image can be used as a future work, to identify landmarks to monitor the progress of diabetic retinopathy. Of course, this approach is expected to help in diagnosing, monitoring, and grading, particularly if a set of sequential retinal images is obtained for the same patient. Hence, a precise comparison showing the gradual improving/declining condition of the disease could be generated, making the physician’s decision on the next treatment procedure more accurate. We plan to include synthesized exudates in photorealistic images, together with their ground truth [37], by proposing a protocol to define the GT.
Our algorithm utilized the fuzzy C-means technique, together with morphological features, to detect and distinguish the retinal hard exudates from other artifacts. We highlight that, while sensitivity values can fluctuate, both specificity and accuracy are steadily high. Four features were selected, obtaining on average Se = 83.3%, Sp = 99.2%, and Acc = 99.1% of the four used datasets, which competes with or outperforms previous works on the same datasets (Table 3 and Table 4).
Author Contributions
Conceptualization, T.D. and H.H.; methodology, T.D. and H.H.; software, T.D.; validation, T.D., H.H., D.T., and C.V.; formal analysis, D.T. and C.V.; investigation, T.D.; resources, T.D., H.H., D.T., and C.V.; data curation, T.D., H.H., D.T., and C.V.; writing, T.D., H.H., D.T., and C.V.; visualization, T.D., H.H., D.T., and C.V.; supervision, H.H. All authors have read and agreed to the published version of the manuscript.
Funding
This research received no external funding.
Institutional Review Board Statement
Not applicable.
Informed Consent Statement
Not applicable.
Acknowledgments
We, the authors, would like to thank our ophthalmic Mazen M. Khwaira for his valuable time in preparing the manual ground truth. We would also like to thank the teams for providing the publicly available datasets: DIARETDB0/1, IDRID, and e-optha.
Conflicts of Interest
The authors declare no conflict of interest.
References
- JayaKumari, C.; Maruthi, R. Detection of Hard Exudates in Color Fundus Images of the Human Retina. Int. Conf. Commun. Technol. Syst. Des. 2012, 30, 297–302. [Google Scholar] [CrossRef]
- Priya, R.; Kalyani, S. Extraction of Exudates and Hemorrhage in Ocular Fundus Image Using Morphological Operations. Int. J. Sci. Eng. Res. 2014, 5, 288–292. [Google Scholar]
- Pratt, H.; Coenen, F.; Broadbent, D.M.; Harding, S.P.; Zheng, Y. Convolutional Neural Networks for Diabetic Retinopathy. Procedia Comput Sci. 2016, 90, 200–205. [Google Scholar] [CrossRef]
- Kauppi, T.; Kalesnykiene, V.; Kamarainen, J.-K.; Lensu, L.; Sorri, I.; Raninen, A.; Voutilainen, R.; Uusitalo, H.; Kalviainen, H.; Pietila, J. DIARETDB1 diabetic retinopathy database and evaluation protocol. BMVC 2007, 61–65. [Google Scholar]
- Partovi, M.; Rasta, S.; Javadzadeh, A. Automatic Detection of Retinal Exudates in Fundus Images of Diabetic Retinopathy Patients. J. Anal. Res. Clin. Med. 2016, 4, 104–109. [Google Scholar] [CrossRef]
- Wu, B.; Zhu, W.; Shi, F.; Zhu, S.; Chen, X. Automatic detection of microaneurysms in retinal fundus images. Comput. Med. Imaging Graph. 2017, 55, 106–122. [Google Scholar] [CrossRef]
- Aliev, R. Fundamentals of the Fuzzy Logic.-Based Generalized Theory of Decisions; Springer: Berlin/Heidelberg, Germany, 2013. [Google Scholar]
- Lupaşcu, C.; Tegolo, D. Stable Automatic Unsupervised Segmentation of Retinal Vessels Using Self-Organizing Maps and a Modified Fuzzy C-Means Clustering; Springer: Berlin/Heidelberg, Germany, 2011. [Google Scholar]
- Sivarathri, S.; Govardhan, A. Experiments on Hypothesis Fuzzy K-Means is Better than K-Means for Clustering. Int. J. Data Min. Knowl. Manag. Process. 2014, 4, 21–34. [Google Scholar] [CrossRef]
- Wiharto, W.; Suryani, E. The Comparison of Clustering Algorithms K-Means and Fuzzy C-Means for Segmentation Retinal Blood Vessels. Acta Inform. Med. 2020, 28, 42–47. [Google Scholar] [CrossRef]
- Giancardo, L.; Meriaudeau, F.; Karnowski, T.P.; Li, Y.; Garg, S.; Tobin, K.W.; Chaum, E. Exudate-Based Diabetic Macular Edema Detection in Fundus Images Using Publicly Available Datasets. Med. Image Anal. 2012, 16, 216–226. [Google Scholar] [CrossRef]
- Joshi, S.; Karule, P. Detection of Hard Exudates Based on Morphological Feature Extraction. Biomed. Pharmacol. J. 2018, 11, 215–225. [Google Scholar] [CrossRef]
- Jaya, T.; Dheeba, N.; Albert Singh, N. Detection of Hard Exudates in Color Fundus Images Using Fuzzy Support Vector Machine-Based Expert System. J. Digit. Imaging 2015, 28, 761–768. [Google Scholar] [CrossRef] [PubMed][Green Version]
- Balasko, B.; Abonyi, J.; Feil, B. Fuzzy Clustering and Data Analysis Toolbox for Use with Matlab; Department of Process Engineering University of Veszprem: Veszprém, Hungary, 2002. [Google Scholar]
- Wang, H.; Yuan, G.; Zhao, X.; Peng, L.; Wang, Z.; He, Y.; Qu, C.; Peng, Z. Hard exudate detection based on deep model learned information and multi-feature joint representation for diabetic retinopathy screening. Comput. Methods Programs Biomed. 2020, 191, 105398. [Google Scholar] [CrossRef] [PubMed]
- Playout, C.; Duval, R.; Cheriet, F. A Novel Weakly Supervised Multitask Architecture for Retinal Lesions Segmentation on Fundus Images. IEEE Trans Med. Imaging 2019, 38, 2434–2444. [Google Scholar] [CrossRef]
- Porwal, P.; Pachade, S.; Kamble, R.; Kokare, M.; Deshmukh, G.; Sahasrabuddhe, V.; Meriaudeau, F. Indian Diabetic Retinopathy Image Dataset (IDRiD): A Database for Diabetic Retinopathy Screening Research. Data 2018, 3, 25. [Google Scholar] [CrossRef]
- Decencière, E.; Cazuguel, G.; Cazuguel, G.; Zhang, X.; Thibault, G.; Klein, J.; Meyer, F.; Marcotegui, B.; Quellec, G.; Lamard, M.; et al. TeleOptha: Machine learning and image processing methods for teleophthalmology. IRBM 2013. [Google Scholar] [CrossRef]
- Lupaşcu, C.; Di Rosa, L.; Tegolo, D. Automatic detection of optic disc location in retinal images. In Proceedings of the 21st IEEE International Symposium on Computer-Based Medical Systems, Jyvaskyla, Finland, 17–19 June 2008. [Google Scholar]
- El Abbadi, N.; Al Saadi, E. Blood vessel extraction using mathematical morphology. J. Comput. Sci. 2013, 9, 1389–1395. [Google Scholar] [CrossRef]
- Jelinek, H.; Cree, M. Automated Image Detection of Retinal Pathology; CRC Press: Boca Raton, FL, USA, 2010. [Google Scholar]
- Bock, R.; Meier, J.; Nyúl, L.; Hornegger, J.; Michelson, G. Glaucoma risk index: Automated glaucoma detection from color fundus images. Med. Image Anal. 2020, 14, 471–481. [Google Scholar] [CrossRef]
- Otsu, N. A Threshold Selection Method from Gray-Level Histograms. IEEE Trans. Syst. Man Cybern. 1979, 9, 62–66. [Google Scholar] [CrossRef]
- Gonzales, R.; Woods, R. Digital Image Processing; Pearson: New York, NY, USA, 2018. [Google Scholar]
- Mapayi, T.; Tapamo, J.; Viriri, S. Retinal Vessel Segmentation: A Comparative Study of Fuzzy C-Means and SUM Entropy Information on Phase Congruency; University of Kwazulu-Natal: Durban, South Africa, 2015. [Google Scholar]
- Sopharak, A.; Uyyanonvara, B.; Barman, S. Automatic exudate detection from non-dilated diabetic retinopathy retinal images using fuzzy C-means clustering. Sensors 2009, 9, 2148–2161. [Google Scholar] [CrossRef]
- Sopharak, A.; Uyyanonvara, B.; Barman, S. Automatic exudates detection for diabetic retinopathy Screening. Sci. Asia 2009, 35, 80–88. [Google Scholar] [CrossRef]
- Kansal, K.; Nishi, E. Automated detection of exudates for diabetic retinopathy screening in fundus images using CS-ACO optimization approach. Int. J. Bio-Sci. Bio-Technol. 2016, 8, 323–340. [Google Scholar] [CrossRef]
- Hamad, H.; Tegolo, D.; Valenti, C. Automatic detection and classification of retinal vascular landmarks. Image Anal. Ster. 2014, 33, 189–200. [Google Scholar] [CrossRef]
- Giancardo, L.; Meriaudean, F.; Karnowski, T.; Li, Y.; Tobin, K.; Chaum, E. Automatic retina exudates segmentation without a manually labeled training set. In Proceedings of the IEEE International Symposium on Biomedical Imaging: From Nano to Macro, Paris, France, 14–17 May 2008; IEEE: Piscataway Township, NJ, USA, 2011; pp. 1396–1400. [Google Scholar]
- Sánchez, C.I.; Niemeijer, M.; Išgum, I.; Dumitrescu, A.V.; Suttorp-Schulten, M.S.; Abramoff, M.D.; Van Ginneken, B. Contextual computer-aided detection: Improving bright lesion detection in retinal images and coronary calcification identification in CT scans. Med. Image Anal. 2011, 16, 50–62. [Google Scholar] [CrossRef] [PubMed]
- Zhang, X.; Thibault, G.; Decencière, E.; Marcotegui, B.; Laÿ, B.; Danno, R.; Cazuguel, G.; Quellec, G.; Lamard, M.; Massin, P.; et al. Exudate detection in color retinal images for mass screening of diabetic retinopathy. Med. Image Anal. 2014, 18, 1026–1043. [Google Scholar] [CrossRef] [PubMed]
- Joshi, S.; Karule, P. A review on exudates detection methods for diabetic retinopathy. Biomed. Pharmacother. 2018, 97, 1454–1460. [Google Scholar] [CrossRef] [PubMed]
- Sopharak, A.; Uyyanonvara, B.; Barmanb, S.; Williamson, T.H. Automatic detection of diabetic retinopathy exudates from non-dilated retinal images using mathematical morphology methods. Comput. Med. Imaging Graph. 2008, 32, 720–727. [Google Scholar] [CrossRef] [PubMed]
- Playout, C.; Duval, R.; Cheriet, F. A Multitask learning architecture for simulation segmentation of bright and red lesions in fundus images. In Proceedings of the Medical Image Computer, Assisted Intervention, Granada, Spain, 16–20 September 2018; pp. 101–108. [Google Scholar]
- Di Rosa, L.; Hamad, H.; Tegolo, D.; Valenti, C. Unsupervised recognition of retinal vascular junction points. In Proceedings of the 36th Annual International Conference of the IEEE Engineering in Medicine and Biology Society, 26–30 August 2014; pp. 150–153. [Google Scholar]
- Lo Castro, D.; Tegolo, D.; Valenti, C. A visual framework to create photorealistic retinal vessels for diagnosis purposes. J. Biomed. Inform. 2020, 108, 103490. [Google Scholar] [CrossRef]
Publisher’s Note: MDPI stays neutral with regard to jurisdictional claims in published maps and institutional affiliations. |
© 2020 by the authors. Licensee MDPI, Basel, Switzerland. This article is an open access article distributed under the terms and conditions of the Creative Commons Attribution (CC BY) license (http://creativecommons.org/licenses/by/4.0/).