Abstract
This study aims to evaluate the potential of incorporating fly ash (FA) and municipal solid waste incinerator bottom ash (MIBA) as a partial substitute of cement in the production of self-compacting concrete mixes through an experimental campaign in which four replacement levels (i.e., 10% FA + 20% MIBA, 20% FA + 10% MIBA, 20% FA + 40% MIBA and 40% FA + 20% MIBA, apart from the reference concrete) were considered. Compressive and tensile strengths, Young’s modulus, ultra-sonic pulse velocity, shrinkage, water absorption by immersion, chloride diffusion coefficient and electrical resistivity were evaluated for all concrete mixes. The results showed a considerable decline in both mechanical and durability-related performances of self-compacting concrete with 60% of substitution by MIBA mainly due to the aluminium corrosion chemical reaction. However, workability properties were not significantly affected, exhibiting values similar to those of the control mix.
1. Introduction
The global production of cement in 2018 exceeded 4000 million metric tonnes and is responsible for a considerable portion of the world’s CO2 emissions, i.e., 0.8 tonnes of CO2 per tonne of cement [1]. Given the considerable amount of cement used to produce conventional concrete and the even greater amount for self-compacting concrete (SCC), necessary to reach its highly flowable state, there is considerable scope to reduce its content. With this in mind, along with the need to reduce the exploitation of the raw materials for clinker production, there have been several studies on the development of supplementary cementitious materials (SCM) [2,3,4,5], which are typically by-products that re-enter the supply chain instead of landfill disposal thus preventing environmental issues such as the contamination of soil and groundwater.
One of the characteristics that a product must exhibit to be considered as SCM is its pozzolanicity [3], wherein the aluminosilicates phases present must react with the hydrated cement’s calcium hydroxide (Ca(OH)2) to form different phases including calcium silicate hydrates (C-S-H), which is responsible for most of the cementitious composites’ mechanical performance. Examples of waste used as cement replacement in self-compacting concrete are: Rice ash [6]; sugarcane bagasse ash [7]; blast furnace slag [8]; and bottom ash from municipal solid waste (MSW) incineration [9,10].
Fly ash (FA), being a by-product of coal combustion in thermoelectric plants and traditionally used in SCC production, amounted to well over 350 × 106 tonnes worldwide [11]. It is known that the replacement of part of cement by FA in the manufacture of self-compacting concrete improves the mechanical characteristics and durability of SCC [12,13,14,15,16,17]. On the other hand, municipal solid waste (MSW) incinerator bottom ash (MIBA) corresponded roughly to 16 metric tonnes per year in the 28 State Members of the European Union [10]. Naturally, due to the high quantities generated and its direct relationship with population growth, there is a noteworthy challenge concerning the adequate management of the waste. Replacement of cement with this by-product in the manufacture of mortars and concrete has revealed the problem concerning the content of metallic aluminium in MIBA, which releases hydrogen upon reaction with water in an alkaline medium [18,19]. The research developed by Lynn et al. [10], which presents a detailed review of the development of the compressive strength of concrete using MIBA up to a maximum replacement of 30%, demonstrated that there is no evident trend in the early ages of mechanical behaviour (<30 days). Some authors witnessed higher compressive strength when compared to the reference concrete (10% higher) and others with significant reductions (less than 50%).
There are no studies in the literature wherein MIBA was used in the production of SCC, which is of particular interest to the industry given the phasing out of conventional FA due to the decommissioning of coal power plants. Therefore, this study intends to provide a way of disposal of MIBA, through its incorporation into ternary mixes of SCC as a cement substitute, by means of a laboratory campaign with several mixes in which the specimens are characterized in terms of their mechanical behaviour and durability. This research corresponds to a study of the CERIS R&D unit at Instituto Superior Técnico, University of Lisbon, of a series of trials for the valorisation of MIBA.
2. Materials and Methods
2.1. Cement, FA and MIBA
The following binding materials were used: Cement type CEM I 42.5 R, produced by CIMPOR; FA, produced by Energias de Portugal, EDP—energy production management, S.A. at the factory in the Sines Production; and MIBA, from the Valorsul’s MSW treatment plant located in São João da Talha, in the municipality of Loures, Portugal. The average particle sizes of the cement, FA and MIBA were 25 μm, 20 μm and 39 μm, respectively.
2.2. Aggregates, Water-Reducing Admixtures and Water
Two types of natural calcareous coarse and two siliceous sands from Sesimbra, Lisboa, fulfilling the requirements of EN-12620:2002+A1:2008 [20], were used to produce the concrete mixes. For the two types of natural coarse aggregates: Gravel 1 (4/16), with a volumetric dry density of 2.5 g/cm3, D50 of ~9 mm, DMAX of 11.2 mm and water absorption of 1.46%; and gravel 2 (8/22.4), with a specific gravity of 2.6 g/cm3, D50 of ~12 mm, DMAX of 16 mm and water absorption of 0.78%. Two siliceous sands were used complying with EN 12620: Sand 0/4, with a specific gravity of 2.5 g/cm3, D50 of ~0.85 mm, fineness modulus of 3.28 and water absorption of 1.30%; and sand 0/1, with a specific gravity of 2.5 g/cm3, D50 of ~0.35 mm, fineness modulus of 2.04 and water absorption of 0.75%.
A third-generation modified polycarboxylic high range water-reducing admixture (Sp), in liquid form and with a density of 1.07, complying with EN-934-1 [21] and EN-934-2 [22], was used to obtain the target workability. Tap water complying with Directive 98/83/CE [23] was used.
2.3. Mix Design
The mixes’ composition was based on the method proposed by Nepomuceno et al. [24] and the amounts are presented in Table 1. The ratios for the cement’s replacement with mineral admixtures (fad by volume) were 0.30 and 0.60. Four sets of mixes using different percentages of FA and MIBA were produced: 10%/20% (C10FA20BA) and 20%/10% (C20FA10BA) compared with an SCC with 70% cement and 30% FA as the reference concrete (RC); and 20%/40% (C20FA40BA); 40%/20% (C40FA20BA), which correspond to two additional mix designs, to analyse the behaviour of SCC with higher contents of MIBA and FA as supplementary cementing material. The composition parameters of the mixtures correspond to the volumetric ratio between the fine material (cement + FA + MIBA) and fine aggregate (Vp/Vs = 0.80), the volume of voids (Vv = 0.03 m3), the volumetric ratio between the content of the mortar and the content of the coarse aggregate (Vm/Vg = 2.275). These parameters were kept constant for all mixes. The volumetric ratio between water and the fine material for the control SCC was Vw/Vp = 0.80, whereas the mixes 10/20%, 20/10%, 20/40%, 40/20% had a Vw/Vp = 0.90. The w/c ratio of the control SCC was 0.36, while that of mixes 10%/20% and 20%/10% was 0.41 and for 20%/40%, 40%/20% the ratio was 0.72. The mass ratio between the Sp and the fine material for the reference SCC was of Sp/P% = 0.75, while for the remaining mixtures Sp/P% = 0.90.

Table 1.
Composition of concrete.
2.4. Test Methods and Sample Preparation
The chemical composition of the major elements in cement, FA and MIBA was determined by the X-ray fluorescence technique (XRF). Likewise, to determine the main crystalline phases present in the materials X-ray diffraction (XRD) was used. Additionally, for the characterization of MIBA, scanning electron microscopy (SEM), energy-dispersive X-ray spectroscopy (EDS) and metallic aluminium quantification tests were carried out. The pozzolanic activity of FA and MIBA was quantified using the Chapelle test [25,26], by means of which the consumption of calcium oxide (CaO) per gram of by-product (MIBA and FA) was determined.
Fluidity and flow velocity of fresh mixes were evaluated in accordance with the slump-flow test, viscosity and filling capacity through the funnel V test and flowability through confined spaces through the L-box flow test, in accordance with EN 12350 [27].
The compressive strength of hardened specimens was evaluated according to EN 12390-3 [28]. This test was performed at 7, 28 and 91 days on 150 mm cube specimens and 28 and 91 days on 150 mm diameter ×300 mm high cylindrical specimens. The splitting tensile strength test followed the method presented in EN 12390-6 [29]. This test was performed on 150 mm diameter ×300 mm high cylindrical specimens at 28 and 91 days. The test procedure used to determine the secant elastic modulus of elasticity is described in LNEC E 397 [30]. This test was performed on 150 mm diameter × 300 mm high cylindrical specimens at 28 and 91 days. An ultrasonic propagation velocity test, described in EN 12504-4 [31], was carried out to determine the quality of the concrete produced. The test procedure used to determine the shrinkage of SCC concrete is described in LNEC E 398 [32]. This test was performed on 100 mm × 100 mm × 400 mm prismatic specimens. The test started after unmoulding the specimens with a total duration of 90 days, with daily measurements during the first 14 days and weekly between 14 and 91 days, having been stored at a temperature of 20 ± 2 °C and a relative humidity of 50 ± 5%.
The following tests were carried out to determine the durability of mixes: Carbonation, according to LNEC-E391 [33]; immersion water absorption test, according to the specification LNEC E394 [34]; chloride ion diffusion coefficient per non-stationary migration test, according to the specification LNEC E 463 [35] and electrical resistivity tests following the procedure of the GRD1 71808 [36].
3. Results and Discussion
3.1. Characterization of the Materials
Results of the compositional analysis of the cement, FA and MIBA are presented in Table 2. It is clear that the cement complies with EN 197-1 [37]. According to the LOI results, FA can be classified as category B (LOI = 5.10%) in accordance with EN 450-1 [38]. Moreover, it presents the sum of Al2O3 + SiO2 + Fe2O3 equal to 84.8%, exceeding the minimum value established (i.e., 70%). It is evident that the LOI value for MIBA is within the permitted range for category B in compliance with EN 450-1 [38]. However, the sum of the oxides Al2O3, SiO2 and Fe2O3 is lower than the minimum value established, showing a resemblance closer to that of ground granulated blast furnace slag than that of FA. Still, according to ASTM C618 [39], MIBA can be classified as class C FA, wherein the minimum value of the sum of Al2O3, SiO2 and Fe2O3 is 50%. Generally, 66% of the MIBAs in the literature satisfied this limit [10]. The relatively high Cl− content of MIBA, of about 0.7%, may prove to be problematic in terms of durability due to the presence of internal chloride ions. From an industrial point of view, to limit the total chloride content of the binder, the realistic maximum replacement level of cement with MIBA may be somewhere near 10–15%.

Table 2.
Chemical composition of raw materials, cement type I, fly ash (FA) and municipal solid waste incinerator bottom ash (MIBA) (% by mass).
The results of the XRD analysis are presented in Figure 1. The spectra of MIBA shows that the main crystalline phases were silica (SiO2) and calcite (CaCO3) (Figure 1a). These crystalline phases were found in the samples after the incineration process of MIBA up to 1000 °C. Figure 1b shows that the main crystalline phases of cement type CEM I 42.5 R were gypsum (CaSO4), calcium aluminates (tricalcium aluminate and tetracalcium aluminoferrite—3 CaO∙Al2O3 and 4 CaO∙Al2O3∙Fe2O3, respectively), and calcium silicates (both dicalcium and tricalcium silicates—2 CaO∙SiO2 and 3 CaO∙SiO2, respectively), which are characteristic of this type of cement.
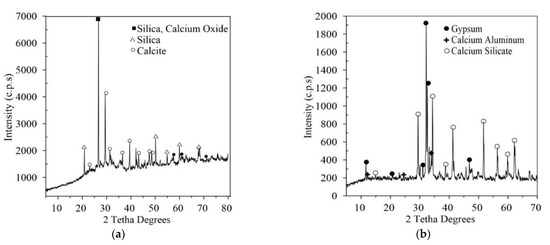
Figure 1.
X-ray diffraction (XRD) pattern for MIBA (a) and for CEM I 42.5 R (b).
In Figure 2, the morphology of MIBA can be observed, in which most of the particles have an angular shape with a porous microstructure. According to this morphology, it is probable that a greater amount of water is needed to cover the particles’ surface area for given workability [40,41]. EDS test was carried out, the results of which are presented in Figure 2c. The elemental composition of MIBA corresponds to around 23.3% for oxygen, followed by calcium with 15.2%, 8.7% for silicon, 6.63% of aluminium and 4.1% of iron.
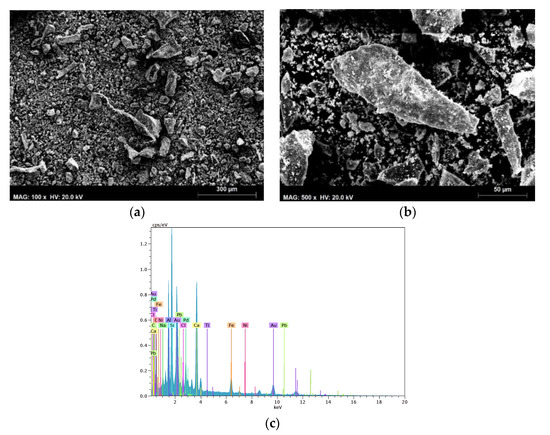
Figure 2.
SEM (a,b) and EDS (c) of MIBA.
Modified Chapelle test determined, by titration with 0.1 M HCl, the content of unconsumed Ca(OH)2 (free content) by the reactive phases present in the FA and MIBA during 16 h of reaction at 90 ± 5 °C of 2 g CaO grade laboratory and one gram of the by-product diluted in distilled water. The reactions presented in the titration are the following:
Thus, through Equation (3), it is possible to calculate the mg Ca(OH)2/g of by-product [26].
where m2 is the mass of the pozzolanic material expressed in grams, v2, the volume of HCl consumed by the sample in mL; v3, the volume of HCl consumed by the blank in ml; Fc, the correction factor for a 0.1 M solution (ratio between the theoretical and experimental volumes of consumed HCl); and 1.32 is the molecular relationship between Ca(OH)2/CaO. Through the Chapelle test, values of 566 mg and 445 mg of Ca(OH)2 were obtained per g of residue for FA and MIBA, respectively, which are higher than the minimum limit of 436 mg Ca(OH)2/g of addition for the classification of a mineral addition as a pozzolanic material. According to these results, both by-products can be considered as pozzolanic.
3.2. Quantification of Metallic Aluminium in MIBA
Equation (4) corresponds to the chemical reaction of the metallic Al with aqueous NaOH, through which it was possible to calculate, by means of the stoichiometry of the reaction, the amount in grams of metallic Al present in the MIBA, quantifying experimentally the released hydrogen. Figure 3 presents the assembly of the test for the quantification of metallic Al.
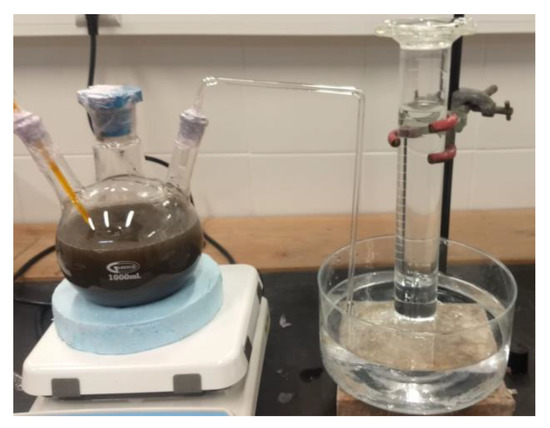
Figure 3.
Setup for the quantification of metallic aluminium in MIBA.
Ten grams of MIBA reacted with a 2.5 M solution of NaOH and released 63.3 ± 1.2 mL of H2, corresponding to ~43.7 mg of metallic aluminium. Thus, it can be concluded that there is around 4.36 g of Al for each kg of MIBA and that 6.3 L of H2↑ are released for each kg of MIBA.
3.3. Fresh Concrete Properties
The slump-flow, funnel and L-box tests confirmed that the mixes can be classified as an SCC. According to the slump-flow test EN 206 [42], the viscosity of all mixtures was classified as VS2 (spreading time ≥ 2.0 s) and the workability as SF2 (660–750 mm) for the RC and the C10FA20BA mix; all other mixes were classified as SF1. The funnel test classified all mixes as VF1. The results of the L-box test (Table 3) confirmed the ability of all blends to pass through confined spaces.

Table 3.
Fresh concrete properties, slump-flow, funnel V and L box (*SF—spread classes and *PL—classes of the capacity of passage in the box L).
3.4. Hardened State Properties
3.4.1. Compressive Strength
Figure 4a shows that the compressive strength in cubes increased. Table 4 contains the average values of the compressive strength as well as their standard deviations for cylindrical and cubic specimens. eased over time for all SCC and decreased with an increasing amount of cement replaced. Likewise, C10FA20BA, C20FA10BA, C20FA40BA and C40FA20BA reached 70%, 58%, 55% and 53% of the average strength of 91 days, at seven days, respectively. It can also be observed that the lower compressive strength values correspond to SCC with higher MIBA content. The same strength reduction trend was verified by Amat et al. [43] with binary mixtures of MIBA and fad up to 30%. Moreover, for binary mixtures with fad up to 40%, Jurič et al. [44], Lin and Lin [45] and Cheng [46], obtained a decrease in strength with the increase of MIBA in the mixture. Li et al. [47] studied ternary mixtures (MIBA and FA) obtaining the same behaviour, with an average decrease at 28 days of 25% and 34%, for fad = 30% and fad = 40%, respectively. However, all authors used as a basis of comparison a concrete with 100% cement. In Figure 4b, the trend lines of the direct comparison between the compressive strength of cylinders and cubes are presented for 28 and 91 days. The correlation between cylindrical and cubic specimens is high for both, 28 days (R2 = 0.93) and 91 days (R2 = 0.96).
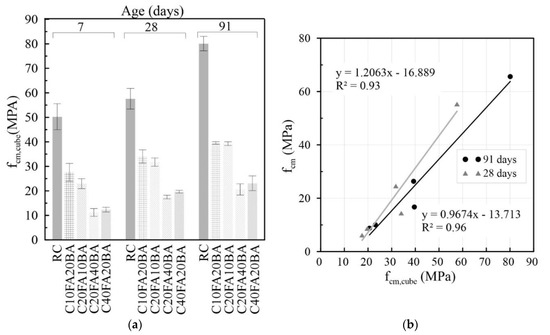
Figure 4.
Compressive strength in cubes (fcm,cube) at 7, 28 and 91 days (a); relationship between compressive strength in cubic (fcm,cube) and cylindrical specimens (fcm) at 28 and 91 days (b).

Table 4.
Compressive strength (MPa) cylindrical and cubic specimens.
The reduction of the compressive strength could be partially due to the notable amount of calcite present in the MIBA, as verified in the XRD analysis (Figure 1). The greater presence of calcite in detriment to other more reactive phases suggests that MIBA may present low pozzolanicity and thus more likely to lead to a decline in mechanical performance when used as partial cement replacement. Likewise, the relatively high content of metallic Al present in MIBA was the main cause for compressive strength loss [10]. Metallic Al in an alkaline medium reacts to produce gaseous H2, which became trapped in the fresh mix thereby significantly increasing the porosity of the hardened concrete (Figure 5). The alkaline medium is generated when the tricalcium silicate (C3S) and the dicalcium silicate (C2S) present in the anhydrous cement are hydrated, producing portlandite (Ca(OH)2) and CaO-SiO2-H2O (C-S-H); the high solubility of portlandite increases the pH above 12.5, thus providing the alkaline medium required to react with the metallic Al present in MIBA (4.32 mg per kg of MIBA) acting as a reagent of the reaction to produce H2 [48,49].
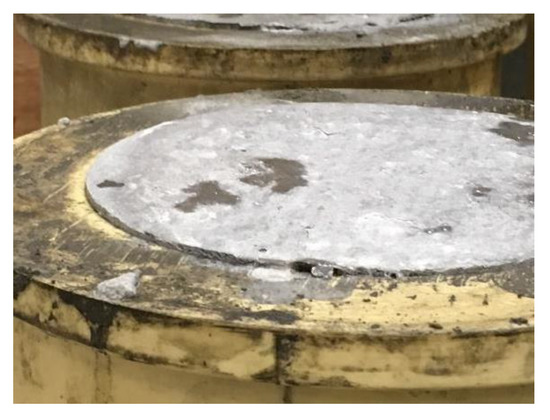
Figure 5.
Expansion of specimens inside the moulds.
The chemical reaction that takes place behind the corrosion of Al and the thermodynamics of it are presented in Equation (5), in which the OH− ion is supplied by the Ca(OH)2 [50,51]. The negative value of the enthalpy (−415.6 kJ) indicates that the reaction is exothermic, which indicates that the high temperatures favour the speed of the product’s formation. Gibbs’ free energy, which also has a negative value (∆G = −437.1 kJ), indicates that the reaction is spontaneous so that hydrogenation does not require energy supply to occur.
Naturally, mixes with higher MIBA content have lower cement content, diluting the latter component and decreasing the amount of hydration products, which also leads to a decline in performance. Still, while MIBA presents some pozzolanicity thereby increasing strength over time with the ensuing reaction between the amorphous phases and Ca(OH)2, the reaction with Al is spontaneous and corresponds to the first reaction to develop, the detrimental effect of which overlapped the positive one from pozzolanic reactions.
Another possible factor potentiating the compressive strength loss could have been due to the high content of Fe2O3. Ghorbel and Samet [52] stated in their study that amounts greater than 2.7% of Fe2O3 led to a compressive strength loss due to decreased pozzolanic activity. Hematite reacts with the Ca(OH)2 producing iron ettringite, Ca3Fe2(OH)12 [53], which is characterized by a negligible binding ability [54].
3.4.2. Tensile Strength
Figure 6a and Table 5 show the results of the splitting tensile strength test. It is evident that the tensile strength decreases with the increasing replacement of cement by FA and MIBA. The mixes with a higher percentage of MIBA incorporation, C10FA20BA and C20FA40BA, show a greater decrease in strength than the RC, with values at 91 days lower by 30% and 53%, respectively. The reasons for this decline in performance were the same as those discussed in the previous section. Figure 6b shows the relationship between compressive strength versus tensile strength in cylindrical specimens for all SCC at 28 and 91 days. Control mixes were found to be well within the confidence intervals for fctk of conventional concrete despite the greater than expected standard deviation of the corresponding fcm. However, as the MIBA content increased, for a given fcm, there was an unexpected increase in fctm.
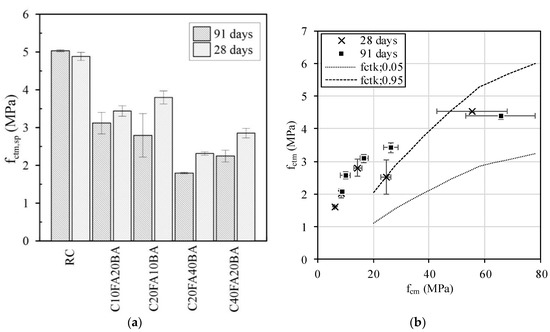
Figure 6.
Tensile strength (fctm,sp) versus substitution rate (a); relationship between tensile strength (fctm) and compressive strength in cylindrical specimens (fcm) at 28 and 91 days (b).

Table 5.
Splitting tensile strength (fctm in MPa) versus compressive strength (fcm in MPa) determined according to EC2 at 28 and 91 days.
3.4.3. Secant Modulus of Elasticity
In Figure 7a, a considerable reduction can be observed in mixes with higher cement replacement. At 28 days, the modulus of elasticity of mixes with fad = 60% exhibited a reduction of about 70% with respect to the RC. While, for the same age, the value of C10FA20BA decreased by 49% and that of C20FA10BA by 38%. After 91 days, the variation in Ecm relatively to that of the reference SCC exhibited the same trend, wherein decreases of 52% and 40% were observed for C10FA20BA and C20FA10BA, respectively. The values of mixes with fad = 60% had a reduction greater than 65%. Such decline in performance has been previously reported, wherein reductions of over 50% were observed in mixes with 85% of MIBA as a partial lightweight aggregate replacement when compared to the control concrete after 28 days due to the expansion of concrete as a result of the corrosion of Al [10]. Moreover, Bertolini et al. [55] reported an expansion of the concrete, caused by the formation of hydrogen as a result of the Al present in MIBA. The small hydrogen bubbles are trapped in the remaining slurry causing an increase in volume.
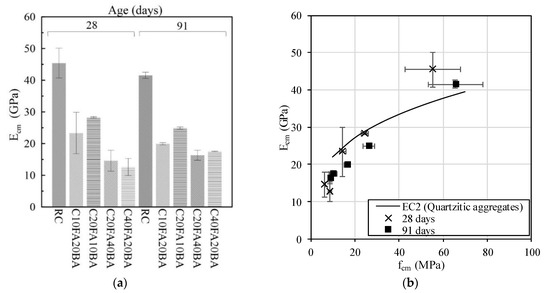
Figure 7.
Modulus of elasticity (Ecm) at 28 days (a); relationship between Ecm and fcm at 28 and 91 days (b).
Figure 7b presents the relationship between the theoretical values using Equation (6) and the values obtained experimentally, showing some correlation between the fcm and the Ecm.
Comparing the results obtained experimentally with those according to the expression proposed by EC2 [56], as Table 6 shows, it is evident that the evolution of the two curves is similar. However, for values of fcm, below about 35 MPa, the results recorded in the experimental campaign are lower than those of EC2, corresponding to mixtures with MIBA. On the other hand, the reference SCC presents results superior to those of the EC2 curve. For more advanced ages and greater substitution quantities (fad), the Ecm is less sensitive to cement substitution by additions than the compressive strength [57]. This fact may be due to the decreasing porosity resulting from the formation of C-S-H by pozzolanic reactions, especially in the interfacial transition zone.

Table 6.
Modulus of elasticity (Ecm in GPa) versus compressive strength (fcm in MPa) according to EC2 at 28 and 91 days.
3.4.4. Ultrasonic Pulse Velocity
Figure 8 shows the ultrasonic pulse velocity versus curing time for all SCC. The RC exhibited a higher velocity for all ages in comparison with the other SCC. It is also observed that the speed of propagation up to 28 days did not undergo major changes. After 91 days, the RC exhibited a velocity of Vusn,c = 4918 m/s, exceeding the value set for sound concrete (i.e., 4500 m/s [58]). The rest of the mixes showed less than preferable, albeit acceptable, values.
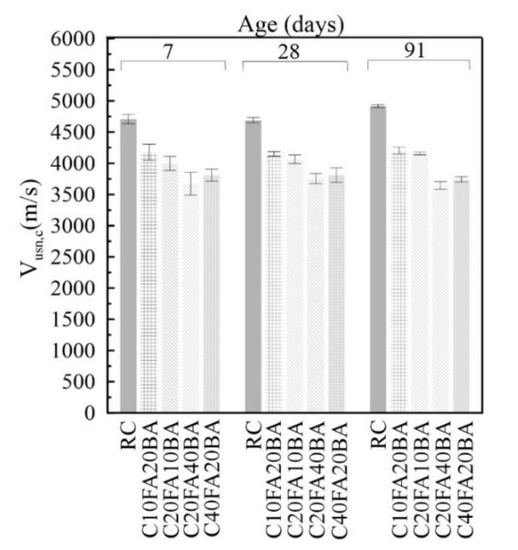
Figure 8.
Ultrasonic pulse velocity at 7, 28 and 91 days.
3.4.5. Shrinkage
Figure 9 presents the shrinkage up until 91 days for all mixes. The total length of shrinkage is characterized by rapid initial evolution in all mixes, reaching about 50% of the 91-day shrinkage between 14 and 28 days, except for C20FA10BA, which reached this value before 14 days. Comparing all SCC with the reference SCC, there is an increase in the extent of shrinkage over time with increasing MIBA. However, the C40FA20BA did not follow the same trend, showing lower values of shrinkage in all ages in comparison with the reference SCC of about 50 μm/m. Such reduction is most likely due to the increase of FA by 10% relative to the reference and not to the quantity of MIBA. It can also be observed that the mix containing the highest MIBA content presented greater shrinkage, ~800 μm/m at 91 days, while the mixture with the highest FA content the shrinkage exhibited a value of ~450 μm/m at 91 days. Figure 9b presents a comparative analysis of the experimentally measured εsh and that calculated using the shrinkage prediction model of EC2 [56] and Table 7 shows the corresponding statistical indicators. Despite slightly underestimating some of the results, including those of the RC, the model showed very little deviation for mixes containing additions up to 30% (MIBA and/or FA) as a cement replacement, thus suggesting the applicability of the EC2 model to mixes containing MIBA as partial cement replacement. The greater deviation was observed for mixes with 60% additions (i.e., C40FA20BA and C20FA40BA).
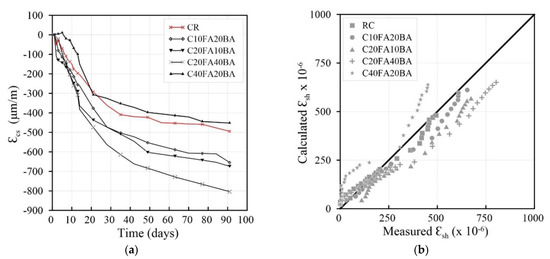
Figure 9.
Total length of shrinkage over 91 days (a) and shrinkage calculated according to the EC2 prediction model (b).

Table 7.
Statistical indicators of the results calculated using the EC2 model.
3.4.6. Carbonation
Figure 10 presents the results of the carbonation test, wherein the samples were exposed to a 5% CO2 environment for 91 days. The results of the RC were not included as carbonation depths were all under 1 mm for the duration of the test. As expected, carbonation increased with the incorporation of MIBA as partial FA replacement; however, contrary to expectations, C10FA20BA showed equivalent depths to C20FA10BA and the same occurred for C20FA40BA and C40FA20BA regardless of the MIBA content. One the one hand, improved performance would be expected from mixes with higher FA content since the addition would lead to pozzolanic reactions capable of reducing the samples’ porosity (demonstrated in the water absorption by immersion test), thereby reducing the diffusion of CO2 to a greater extent than when using MIBA. On the other, it is possible that there may have been a faster reduction of overall pH in samples with higher FA content, which, in combination with the slight densification of the microstructure from the pozzolanic reaction, led to opposing effects in terms of carbonation depth.
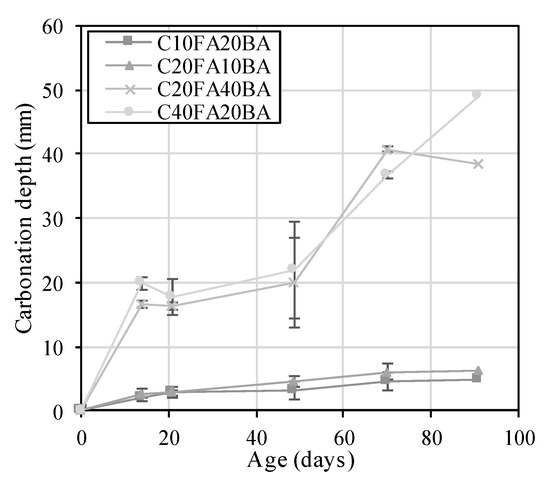
Figure 10.
Carbonation depth of samples with MIBA.
3.4.7. Water Absorption by Immersion
Figure 11 shows that, contrary to expectations, negligible changes were observed in the 28-day water absorption by immersion; the CC, C10FA20BA, C20FA10BA, C20FA40BA and C40FA20BA exhibited values of 13.5%, 13.9%, 13.0%, 14.8% and 14.3%, respectively. A significantly higher porosity increase of mixes with MIBA would be expected due to the corrosion of Al. It is possible that a notable portion of these pores formed by H2 gas may have been internal and inaccessible. A more expected difference was observed after 91 days, wherein an increase in the water absorption by immersion was noted with the increase in fad and MIBA content, whereby C20FA40BA showed the highest values; the CC, C10FA20BA, C20FA10BA, C20FA40BA and C40FA20BA exhibited values of 10.1%, 13.8%, 13.3%, 17.2% and 13.9%. This result is consistent with various investigations, in which there was the production of H2 from the reaction between metallic Al, present in MIBA, and the OH− ion, present in water, thus generating porosity in mortars and concretes in the hardened state [10].
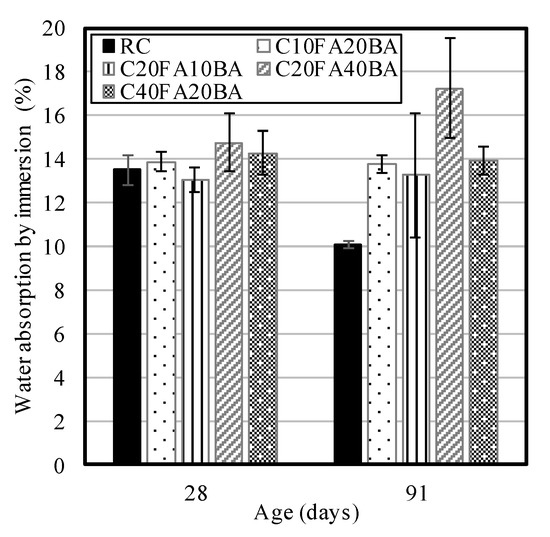
Figure 11.
Water absorption by immersion at 28 and 91 days.
3.4.8. Chloride Ion Penetration
Figure 12a shows the chloride ion diffusion coefficient after 28 and 91 days of curing. As expected, the diffusion coefficients decreased from 28 to 91 days by 34% for fad = 30% and 48% for fad = 60% on average. Despite the decrease, the incorporation of MIBA caused an increase in the diffusion coefficient when compared to the RC. This increase was more evident in mixes with an increasing percentage of MIBA. Again, this may have been due to the greater porosity prompted by the production of H2 gas, incorporation of an addition with a lower amount of reactive phases and also the relatively higher content of Cl− present in MIBA, which may have also affected the chloride ion migration coefficient. Bertolini et al. [55] found that, by replacing 30% of cement with wet ground MIBA, the profile of chloride ion penetration, after six months of exposure to chloride immersion cycles, was lower than in the other mixtures (i.e., 30% FA from incinerated MSW and 30% dry ground MIBA) and similar to the control concrete (50% at depths close to 0 mm and less than 5% at depths of 35 mm). This result was explained by the decrease in porosity produced by the pozzolanicity as well as filler effect of wet ground MIBA.
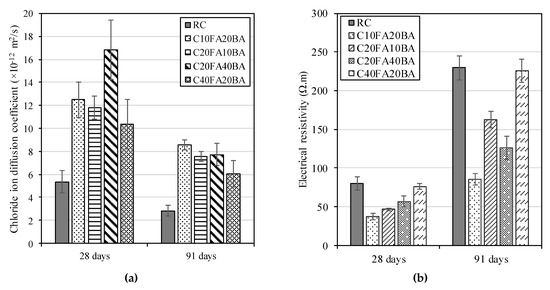
Figure 12.
Chloride diffusion coefficient (a) and electrical resistivity (b) at 28 and 91 days.
The ternary mixtures with FA and calcareous filler studied by Silva [59], showed the same trend of increasing diffusion coefficient with the decreasing amount of FA in the mixture. Since the round shape of FA particles contributed to greater compactness of concrete, this led to a greater tortuosity of the microstructure for Cl− ions to penetrate. Furthermore, the high amount of amorphous phases (i.e., Al2O3 and SiO2) present in the FA, which exist in greater concentration than in cement (Table 2), lead to the formation of C-S-H and Friedel’s salt (Ca2 Al(OH)6(Cl, OH)·2H2O) compounds, which physically and chemically bind chloride ions, respectively, thereby decreasing their diffusion in concrete.
Figure 12b shows that the electrical resistivity increased with age in all mixes as expected. For a fad = 30%, an average decrease of 47% was observed when compared to the RC. After 91 days, the trend changes slightly, wherein the SCC with a higher percentage of FA (C20FA10BA and C40FA20BA) accompanied the RC in a more pronounced rise in electrical resistivity, possibly due to the development of additional compounds capable of biding chloride ions. As for mixes C10FA20BA and C20FA40BA, at 91 days, these showed a decrease of 63% and 45%, respectively, when compared to the RC. These results point towards a considerable setback to the electrical resistivity of concrete with an increasing amount of MIBA as partial replacement of FA and cement. As stated, not only does it increase overall porosity due to the corrosion of metallic Al, but it also contains a fewer amount of amorphous phases capable of reacting with the cement’s products of hydration, thereby leading to a decreased quantity of mineralogical phases capable of reducing ionic concentration.
4. Conclusions
The proposed mix design for concrete containing both MIBA and FA as a partial replacement for cement complies with the requirements established in EN 206 [42] with regard to viscosity, filling capacity and capacity of passage in confined spaces and thus can be classified as SCC. The incorporation of MIBA allowed the production of SCC with adequate fresh-state performance. However, there was a considerable decline in mechanical performance with an increasing percentage of MIBA; when compared to the RC, fcm, fctm,sp and Ecm showed average losses of 74%, 38% and 48%, respectively, for the C10FA20BA mix and 89%, 64% and 67%, respectively, for the C20FA40BA mix. This was mostly due to the ashes’ relatively high metallic Al content, which reacted with OH− ions present in the mixes’ solution thus producing expansive H2 gas. Still, it should be noted that this phenomenon can be mitigated by introducing an additional treatment process capable of reducing the amount of metallic Al (e.g., introduce and improve the effectiveness of the Eddy current separation stage for non-ferrous metals and subject MIBA to an alkaline solution). Additionally, while MIBA can be deemed pozzolanic, it has lower reactivity in comparison with that of FA and thus the strength development over time is affected due to the lower amount of strength-enhancing mineralogical phases. These same factors influenced the durability performance of the mixes, though to a lower extent in some cases (i.e., 28-day water absorption by immersion). Naturally, as a result of the increased porosity and reduced quantity of phases capable of binding ions, chloride ion diffusion and resistivity increased and decreased, respectively, thereby limiting the use of MIBA as SCM in applications that are not subjected to chloride-enriched environments.
Author Contributions
Conceptualization, P.R.d.S. and R.V.S.; Methodology, P.R.d.S. and R.V.S.; Formal Analysis, B.S., P.R.d.S. and R.V.S.; Investigation, B.S.; Data Curation, B.S., Y.A. and J.A.F.; Writing—Original Draft Preparation, Y.A. and J.A.F.; Writing—P.R.d.S. and R.V.S.; Supervision, P.R.d.S. and R.V.S. All authors have read and agreed to the published version of the manuscript.
Funding
The authors gratefully acknowledge the support of the CERIS Research Institute, IST—University of Lisbon and FCT—Foundation for Science and Technology, through the research project PTDC/ECI-CON/29196/2017 “Recycled Inorganic Polymer Concrete: Towards a fully recycled and cement-free concrete” (RInoPolyCrete).
Institutional Review Board Statement
Not applicable.
Informed Consent Statement
Not applicable.
Data Availability Statement
The data presented in this study are available on request from the corresponding author.
Conflicts of Interest
The authors declare no conflict of interest.
References
- Scrivener, K.L.; John, V.M.; Gartner, E.M. Eco-efficient cements: Potential economically viable solutions for a low-CO2 cement-based materials industry. Cem. Concr. Res. 2018, 114, 2–26. [Google Scholar] [CrossRef]
- Claisse, P.A. Chapter 18—Cements and cement replacement materials. In Civil Engineering Materials; Claisse, P.A., Ed.; Butterworth-Heinemann: Boston, MA, USA, 2016; pp. 163–176. [Google Scholar]
- Hemalatha, M.S.; Santhanam, M. Characterizing supplementary cementing materials in blended mortars. Constr. Build. Mater. 2018, 191, 440–459. [Google Scholar] [CrossRef]
- Franco de Carvalho, J.M.; Melo, T.V.d.; Fontes, W.C.; Batista, J.O.d.S.; Brigolini, G.J.; Peixoto, R.A.F. More eco-efficient concrete: An approach on optimization in the production and use of waste-based supplementary cementing materials. Constr. Build. Mater. 2019, 206, 397–409. [Google Scholar] [CrossRef]
- Rahla, K.M.; Mateus, R.; Bragança, L. Comparative sustainability assessment of binary blended concretes using Supplementary Cementitious Materials (SCMs) and Ordinary Portland Cement (OPC). J. Clean. Prod. 2019, 220, 445–459. [Google Scholar] [CrossRef]
- Sandhu, R.K.; Siddique, R. Influence of rice husk ash (RHA) on the properties of self-compacting concrete: A review. Constr. Build. Mater. 2017, 153, 751–764. [Google Scholar] [CrossRef]
- Moretti, J.P.; Nunes, S.; Sales, A. Self-compacting concrete incorporating sugarcane bagasse ash. Constr. Build. Mater. 2018, 172, 635–649. [Google Scholar] [CrossRef]
- Dinakar, P.; Sethy, K.P.; Sahoo, U.C. Design of self-compacting concrete with ground granulated blast furnace slag. Mater. Des. 2013, 43, 161–169. [Google Scholar] [CrossRef]
- Tang, P.; Florea, M.; Spiesz, P.; Brouwers, H. The application of treated bottom ash in mortar as cement replacement. In Proceedings of the EurAsia Waste Management Symposium 2014, Istanbul, Turkey, 26–28 October 2014; pp. 1077–1082. [Google Scholar]
- Lynn, C.J.; Dhir, R.K.; Ghataora, G.S. Municipal incinerated bottom ash use as a cement component in concrete. Mag. Concr. Res. 2017, 69, 512–525. [Google Scholar] [CrossRef]
- Dwivedi, A.; Jain, M.K. Fly ash—Waste management and overview: A Review. Recent Res. Sci. Technol. 2014, 6, 30–35. [Google Scholar]
- Siddique, R. Properties of self-compacting concrete containing class F fly ash. Mater. Des. 2011, 32, 1501–1507. [Google Scholar] [CrossRef]
- Dinakar, P.; Kartik Reddy, M.; Sharma, M. Behaviour of self compacting concrete using Portland pozzolana cement with different levels of fly ash. Mater. Des. 2013, 46, 609–616. [Google Scholar] [CrossRef]
- Bouzoubaâ, N.; Lachemi, M. Self-compacting concrete incorporating high volumes of class F fly ash: Preliminary results. Cem. Concr. Res. 2001, 31, 413–420. [Google Scholar] [CrossRef]
- Şahmaran, M.; Yaman, Ö.; Tokyay, M. Development of high-volume low-lime and high-lime fly-ash-incorporated self-consolidating concrete. Mag. Concr. Res. 2007, 59, 97–106. [Google Scholar] [CrossRef]
- Şahmaran, M.; Yaman, I.O.; Tokyay, M. Transport and mechanical properties of self consolidating concrete with high volume fly ash. Cem. Concr. Compos. 2009, 31, 99–106. [Google Scholar] [CrossRef]
- Deilami, S.; Aslani, F.; Elchalakani, M. Durability assessment of self-compacting concrete with fly ash. Comput. Concr. 2017, 19, 489–499. [Google Scholar] [CrossRef]
- Xuan, D.; Tang, P.; Poon, C.S. Limitations and quality upgrading techniques for utilization of MSW incineration bottom ash in engineering applications—A review. Constr. Build. Mater. 2018, 190, 1091–1102. [Google Scholar] [CrossRef]
- Liu, Y.; Sidhu, K.S.; Chen, Z.; Yang, E.-H. Alkali-treated incineration bottom ash as supplementary cementitious materials. Constr. Build. Mater. 2018, 179, 371–378. [Google Scholar] [CrossRef]
- EN-12620:2002+A1:2008 Aggregates for Concrete; Comité Européen de Normalisation (CEN): Brussels, Belgium, 2008; p. 56.
- EN-934-1 Admixtures for Concrete, Mortar and Grout. Common Requirements; Comité Européen de Normalisation (CEN): Brussels, Belgium, 2008; p. 14.
- EN-934-2 Admixtures for Concrete, Mortar and Grout. Concrete Admixtures. Definitions, Requirements, Conformity, Marking and Labelling; Comité Européen de Normalisation (CEN): Brussels, Belgium, 2012; p. 28.
- CEU Council Directive 98/83/EC of 3 November 1998 on the quality of water intended for human consumption. Off. J. Eur. Communities 1998, 330, 32–54.
- Nepomuceno, M.; Oliveira, L.; Lopes, S.M.R. Methodology for mix design of the mortar phase of self-compacting concrete using different mineral additions in binary blends of powders. Constr. Build. Mater. 2012, 26, 317–326. [Google Scholar] [CrossRef]
- Ferraz, E.; Andrejkovičová, S.; Hajjaji, W.; Velosa, A.L.; Silva, A.S.; Rocha, F. Pozzolanic activity of metakaolins by the French Standard of the modified Chapelle Test: A direct methodology. Acta Geodyn. Geometer. Aspects 2015, 289–298. [Google Scholar] [CrossRef]
- NBR-15895 Materiais Pozolânicos—Determinação do Teor de Hidróxido de Cálcio Fixado—Método de Chapelle Modificado; Brazilian Association for Technical Norms (Associação Brasileira de Normas Técnicas—ABNT): Rio de Janeiro, Brasil, 2010; p. 10.
- EN-12350-8 Testing Fresh Concrete. Self-Compacting Concrete. Slump-Flow Test; Comité Européen de Normalisation (CEN): Brussels, Belgium, 2019; p. 14.
- EN-12390-3 Testing Hardened Concrete—Part 3: Compressive Strength of Test Specimens; Comité Européen de Normalisation (CEN): Brussels, Belgium, 2009; p. 22.
- EN-12390-6 Testing Hardened Concrete—Part 6: Tensile Splitting Strength of Test Specimens; Comité Européen de Normalisation (CEN): Brussels, Belgium, 2009; p. 14.
- LNEC-E397 Concrete: Determination of the Modulus of Elasticity under Compression; National Laboratory in Civil Engineering (LNEC—Laboratório Nacional de Engenharia Civil): Lisbon, Portugal, 1993; p. 2. (In Portuguese)
- EN-12504-4 Testing Concrete. Determination of Ultrasonic Pulse Velocity; Comité Européen de Normalisation (CEN): Brussels, Belgium, 2004; p. 18.
- LNEC-E398 Concrete: Determination of Drying Shrinkage and Expansion; National Laboratory in Civil Engineering (LNEC—Laboratório Nacional de Engenharia Civil): Lisbon, Portugal, 1993; p. 2. (In Portuguese)
- LNEC-E391 Concrete: Determination of Carbonation Resistance; National Laboratory in Civil Engineering (LNEC—Laboratório Nacional de Engenharia Civil): Lisbon, Portugal, 1993; p. 2. (In Portuguese)
- LNEC-E394 Concrete: Determination of Water Absorption by Immersion—Testing at Atmospheric Pressure; National Laboratory in Civil Engineering (LNEC—Laboratório Nacional de Engenharia Civil): Lisbon, Portugal, 1993; p. 2. (In Portuguese)
- LNEC-E463 Concrete: Determination of the Chloride ion Diffusion Coefficient by Non-Steady State Migration; National Laboratory in Civil Engineering (LNEC—Laboratório Nacional de Engenharia Civil): Lisbon, Portugal, 2004; p. 8. (In Portuguese)
- Luping, T. Guidelines for Practical Use of Methods for Testing the Resistance of Concrete to Chloride Ingress; CHLORTEST—EU Funded Research Project under 5FP GROWTH Programme; SP Swedish National, Testing and Research Institute: Boras, Sweden, 2005; p. 271. [Google Scholar]
- EN-197-1 Cement—Part 1: Composition, Specifications and Conformity Criteria for Common Cements; Comité Européen de Normalisation (CEN): Brussels, Belgium, 2011; p. 50.
- EN-450-1 Fly Ash for Concrete. Definition, Specifications and Conformity Criteria; Comité Européen de Normalisation (CEN): Brussels, Belgium, 2012; p. 34.
- ASTM-C618 Standard Specification for Coal Fly Ash and Raw or Calcined Natural Pozzolan for Use in Concrete; American Society for Testing and Materials: West Conshohocken, PA, USA, 2015; p. 5.
- Silva, R.V.; de Brito, J.; Lynn, C.J.; Dhir, R.K. Use of municipal solid waste incineration bottom ashes in alkali activated materials, ceramics and granular applications: A review. Waste Manag. 2017, 68, 207–220. [Google Scholar] [CrossRef]
- Tang, P. Municipal Solid Waste Incineration (MSWI) Bottom Ash—From Waste to Value; Technische Universiteit Eindhoven: Eindhoven, The Netherlands, 2017. [Google Scholar]
- EN-206:2013+A1:2016 Concrete—Specification, Performance, Production and Conformity; Comité Européen de Normalisation (CEN): Brussels, Belgium, 2016; p. 98.
- Amat, R.C.; Ismail, K.N.; Noor, N.M.; Ibrahim, N.M. The effects of bottom ash from MSWI used as mineral additions in concrete. In MATEC Web of Conferences; EDP Sciences: Les Ulis, France, 2017. [Google Scholar] [CrossRef]
- Jurič, B.; Hanžič, L.; Ilić, R.; Samec, N. Utilization of municipal solid waste bottom ash and recycled aggregate in concrete. Waste Manag. 2006, 26, 1436–1442. [Google Scholar] [CrossRef] [PubMed]
- Lin, K.; Lin, D. Hydration characteristics of municipal solid waste incinerator bottom ash slag as a pozzolanic material for use in cement. Cem. Concr. Compos. 2006, 28, 817–823. [Google Scholar] [CrossRef]
- Cheng, A. Effect of incinerator bottom ash properties on mechanical and pore size of blended cement mortars. Mater. Des. 2012, 36, 859–864. [Google Scholar] [CrossRef]
- Li, X.-G.; Lv, Y.; Ma, B.-G.; Chen, Q.-B.; Yin, X.-B.; Jian, S.-W. Utilization of municipal solid waste incineration bottom ash in blended cement. J. Clean. Prod. 2012, 32, 96–100. [Google Scholar] [CrossRef]
- Kanehira, S.; Kanamori, S.; Nagashima, K.; Saeki, T.; Visbal, H.; Fukui, T.; Hirao, K. Controllable hydrogen release via aluminum powder corrosion in calcium hydroxide solutions. J. Asian Ceram. Soc. 2013, 1, 296–303. [Google Scholar] [CrossRef]
- Shinzato, M.; Hypolito, R. Solid waste from aluminum recycling process: Characterization and reuse of its economically valuable constituents. Waste Manag. 2005, 25, 37–46. [Google Scholar] [CrossRef]
- Ho, C.-Y.; Huang, C.-H. Enhancement of hydrogen generation using waste aluminum cans hydrolysis in low alkaline de-ionized water. Int. J. Hydrog. Energy 2016, 41, 3741–3747. [Google Scholar] [CrossRef]
- Liu, H.; Yang, F.; Yang, B.; Zhang, Q.; Chai, Y.; Wang, N. Rapid hydrogen generation through aluminum-water reaction in alkali solution. Catal. Today 2018, 318, 52–58. [Google Scholar] [CrossRef]
- Ghorbel, H.; Samet, B. Effect of iron on pozzolanic activity of kaolin. Constr. Build. Mater. 2013, 44, 185–191. [Google Scholar] [CrossRef]
- Chakchouk, A.; Samet, B.; Bouaziz, S. Difference in pozzolanic behaviour of Tunisian clays with lime and cement. Adv. Cem. Res. 2012, 24, 11–22. [Google Scholar] [CrossRef]
- Lizarazo-Marriaga, J.; Claisse, P.; Ganjian, E. Effect of steel slag and Portland cement in the rate of hydration and strength of blast furnace slag pastes. J. Mater. Civ. Eng. 2011, 23, 153–160. [Google Scholar] [CrossRef]
- Bertolini, L.; Carsana, M.; Cassago, D.; Curzio, A.Q.; Collepardi, M. MSWI ashes as mineral additions in concrete. Cem. Concr. Res. 2004, 34, 1899–1906. [Google Scholar] [CrossRef]
- EN-1992-1-1:2004+A1:2014 Eurocode 2—Design of Concrete Structures: Part 1-1: General Rules and Rules for Buildings; Comité Européen de Normalisation (CEN): Brussels, Belgium, 2014; p. 259.
- Kuder, K.; Lehman, D.; Berman, J.; Hannesson, G.; Shogren, R. Mechanical properties of self consolidating concrete blended with high volumes of fly ash and slag. Constr. Build. Mater. 2012, 34, 285–295. [Google Scholar] [CrossRef]
- Breysse, D. Non-Destructive Assessment of Concrete Structures: Reliability and Limits of Single and Combined Techniques: State-of-the-Art Report of the RILEM Technical Committee 207-INR; Springer Science & Business Media: Berlin, Germany, 2012; p. 374. [Google Scholar]
- Silva, P.M.S.R. Avaliação da Durabilidade de Betões Autocompactáveis (BAC); Instituto Superior Técnico: Lisbon, Portugal, 2013. [Google Scholar]
Publisher’s Note: MDPI stays neutral with regard to jurisdictional claims in published maps and institutional affiliations. |
© 2020 by the authors. Licensee MDPI, Basel, Switzerland. This article is an open access article distributed under the terms and conditions of the Creative Commons Attribution (CC BY) license (http://creativecommons.org/licenses/by/4.0/).