Article

Effects of Tension–Compression Asymmetry on Bending of Steels

1
Centre for Infrastructure Engineering, School of Engineering, Western Sydney University, Penrith 2747, Australia
2
School of Engineering, Western Sydney University, Penrith 2747, Australia
*
Author to whom correspondence should be addressed.
Appl. Sci. 2020, 10(9), 3339; https://doi.org/10.3390/app10093339
Submission received: 15 April 2020 / Revised: 3 May 2020 / Accepted: 6 May 2020 / Published: 11 May 2020
(This article belongs to the Special Issue Advanced Manufacturing Technologies and Their Applications)

Abstract

:
Stainless steels (SUS) and dual-phase (DP) steels have tension-compression asymmetry (TCA) in mechanical responses to full loading cycles. This phenomenon can significantly influence sheet metal forming of such metals, however, it is difficult to describe this behaviour analytically. In this research, a novel analytical method for asymmetric elastic-plastic pure bending using the Cazacu–Barlat 2004 asymmetric yield function is proposed. It only uses material parameters in tension along with an asymmetry coefficient related to the yield function. Bending operations of SUS304 and DP980 are investigated as two case studies. In the pure bending for both SUS304 and DP980, moment–curvature diagrams are analytically obtained. Furthermore, linear and nonlinear springback behaviours of SUS304 are analytically investigated. Moreover, using the analytical model as a user-defined material, a numerical model is developed for both steels under pure bending. In the V-bending case of SUS304 with and without TCA effects, the springback behaviours of the material are investigated numerically. In addition, considering friction effects, the analytical method is further modified for predicting springback behaviours in the V-bending of 16 types of SUS304 with various strengths are determined. All the analytical and numerical results have good agreement with those experimental results from literature for validation.

1. Introduction

Over the last decade, due to the development of advanced materials and manufacturing technologies, sheet metal forming has become more challenging for industry sectors and researchers. This manufacturing process has a wide range of applications in automobile parts, electronic parts, food and drink cans, etc. Bending is a widely used forming process in sheet metal forming which is usually accompanied with an unwanted springback phenomenon. Springback is one of the most challenging issues in sheet metal forming. Accurate prediction of springback helps manufacturing industries to design appropriate tools to compensate for this effect and enhance the dimensional accuracy of the finished parts [1].
Anisotropy in plastic behaviour is a common phenomenon in metal forming. An initial anisotropy in yield points and the subsequent hardening behaviour can be caused by tension–compression asymmetry (TCA) [2,3]. Several metals have been reported to have asymmetrical yield surface due to the fact of their eccentricity in yielding or in their subsequent hardening. Hexagonal closed pack (HCP) metals, such as magnesium alloys, have strong asymmetry due to the fact of their limited slip systems and the strong basal texture [4]. Cubic materials, such as body-centred cubic (BCC) and face-centred cubic (FCC) metals, are usually considered as symmetrical materials. However, some cubic metals are reported to exhibit TCA too. Kuwabara et al. [5] designed a special testing apparatus and performed in-plane tension and compression experiment tests on a copper alloy sheet. They showed that copper alloy exhibits TCA. Kuwabara et al. [6] performed in-plane tension and compression experiments on SUS304 sheets in the rolling direction (RD) and transverse direction (TD). In addition, they performed pure bending and V-bending experiments on the sheets to understand the effects of TCA on bending and springback behaviours. They showed that the TCA of the material has considerable effects on the bending and springback behaviours of the material. Recently, Maeda et al. [7] reported the strength differential effect (SDE) for DP980 steel sheet by performing in-plane tension and compression and pure bending experiments. In order to consider the abovementioned asymmetry in constitutive equations, two different methods were proposed by researchers. The first method is to suppose an initial translation of yield surface by adopting non-zero back stress in the combined isotropic-kinematic hardening model [4,8,9,10]. For example, Lee et al. [4] used the two-surface model for magnesium alloy sheets. Lee et al. [9] proposed a model based on a distortional hardening approach which can extend the initial yield function and hardening asymmetry under different loading condition. More recently, Park et al. [11] proposed a criterion for anisotropic hardening considering the strength differential effect based on non-associated flow rule. The other method is to introduce an asymmetric yield function, which is stress or invariant of stress dependence. For example, Hosford [12] added linear stress terms into Hill’s 48 yield surface. Cazacu and Barlat [13] modified the isotropic Drucker yield criterion [14] by applying the second and third invariants of stress to describe the initial tension–compression yield asymmetry. Yoon et al. [15] proposed a general asymmetric yield function with a dependence on the first stress invariant for pressure-sensitive metals.
Few analytical studies are available regarding the bending and springback of metals with TCA. Lee et al. [16] studied pure bending and bending under tension of AZ31B magnesium alloy sheet analytically by approximating the stress–strain curve of the magnesium alloy sheets. They applied discrete linear hardening rules in each deformation region to determine the moment–curvature and the springback of the material. Kim et al. [17] studied the sidewall curve of magnesium alloy AZ31B under bending/unbending. They introduced a semi-analytical bending/unbending method to determine the bending moment–curvature diagrams for different values of tensile back forces. Kuwabara et al. [5], Kuwabara et al. [6] and Maeda et al. [7] calculated the bending moment–curvature diagrams for pure bending tests based on stress–strain (SS) curves obtained from in-plane tension–compression tests. They divided the sheet thickness of the specimen into 100 thin layers and found the stress of each layer from the SS curves in tension and compression under a uniaxial condition.
All the analytical studies mentioned above are semi-analytical methods which are based on piecewise fitting of the SS curves of materials without using key factors of continuum plasticity such as yield surface or flow rule. Therefore, their methods have too many parameters related to the SS curves in tension and compression, and also intensive calculations are needed. Mehrabi and Yang [18] presented a simple analytical solution for pure bending of hexagonal closed-packed metals without considering the effects of neutral surface shift. In this study, a novel analytical method is proposed for steels, which is based on uniaxial, elastic-plastic bending by applying the Cazacu–Barlat 2004 asymmetric yield function and considering the neutral surface shift. This method uses only the material parameters in tension, along with an asymmetry coefficient related to the yield function. Hence, it can greatly simplify the analytic and numerical studies of metal sheet forming. The proposed analytical method can significantly simplify the springback prediction of asymmetric sheet metals, compared to those existing methods. This method can be an effective tool for manufacturing industries dealing with springback during sheet metal forming processes such as bending, deep drawing, roll forming, etc. This new method can be used for analytic study and numerical analysis by implementing it into the commonly used commercial finite element analysis package—Abaqus/Standard via user-subroutine UMAT. In order to show the versatility of the new method, pure bending and V-bending of steels were investigated as two case studies. In the pure bending, moment–curvature diagrams of SUS304 and DP980 were analytically calculated. Furthermore, linear and nonlinear springback values of SUS304 were also analytically determined and compared with experimental results available in the literature [6] which show great agreement. By using the UMAT, the finite element model of the pure bending was devised, and the obtained numerical results were in good agreement with the analytical and experimental results. In the second case, V-bending, the effects of TCA on the springback behaviour of SUS304 plates were investigated numerically. The springback results from the simulations with and without TCA effects were compared with those experimental results from the literature. The results show that springback prediction improved significantly by considering the TCA of the material. Finally, the analytical method was modified for prediction of springback in V-bending. Based on this method, the springback values of 16 types of SUS304 with different strengths were calculated and compared with those from the experiments. The predicted springback behaviours were consistent with the experimental results. This paper is outlined in the following sections. Section 2 provides a detailed development of the proposed analytical method. Section 3 explains the numerical method and discusses the analytical and numerical results in detail, and, finally, Section 4 gives comprehensive conclusions based on the research findings obtained.

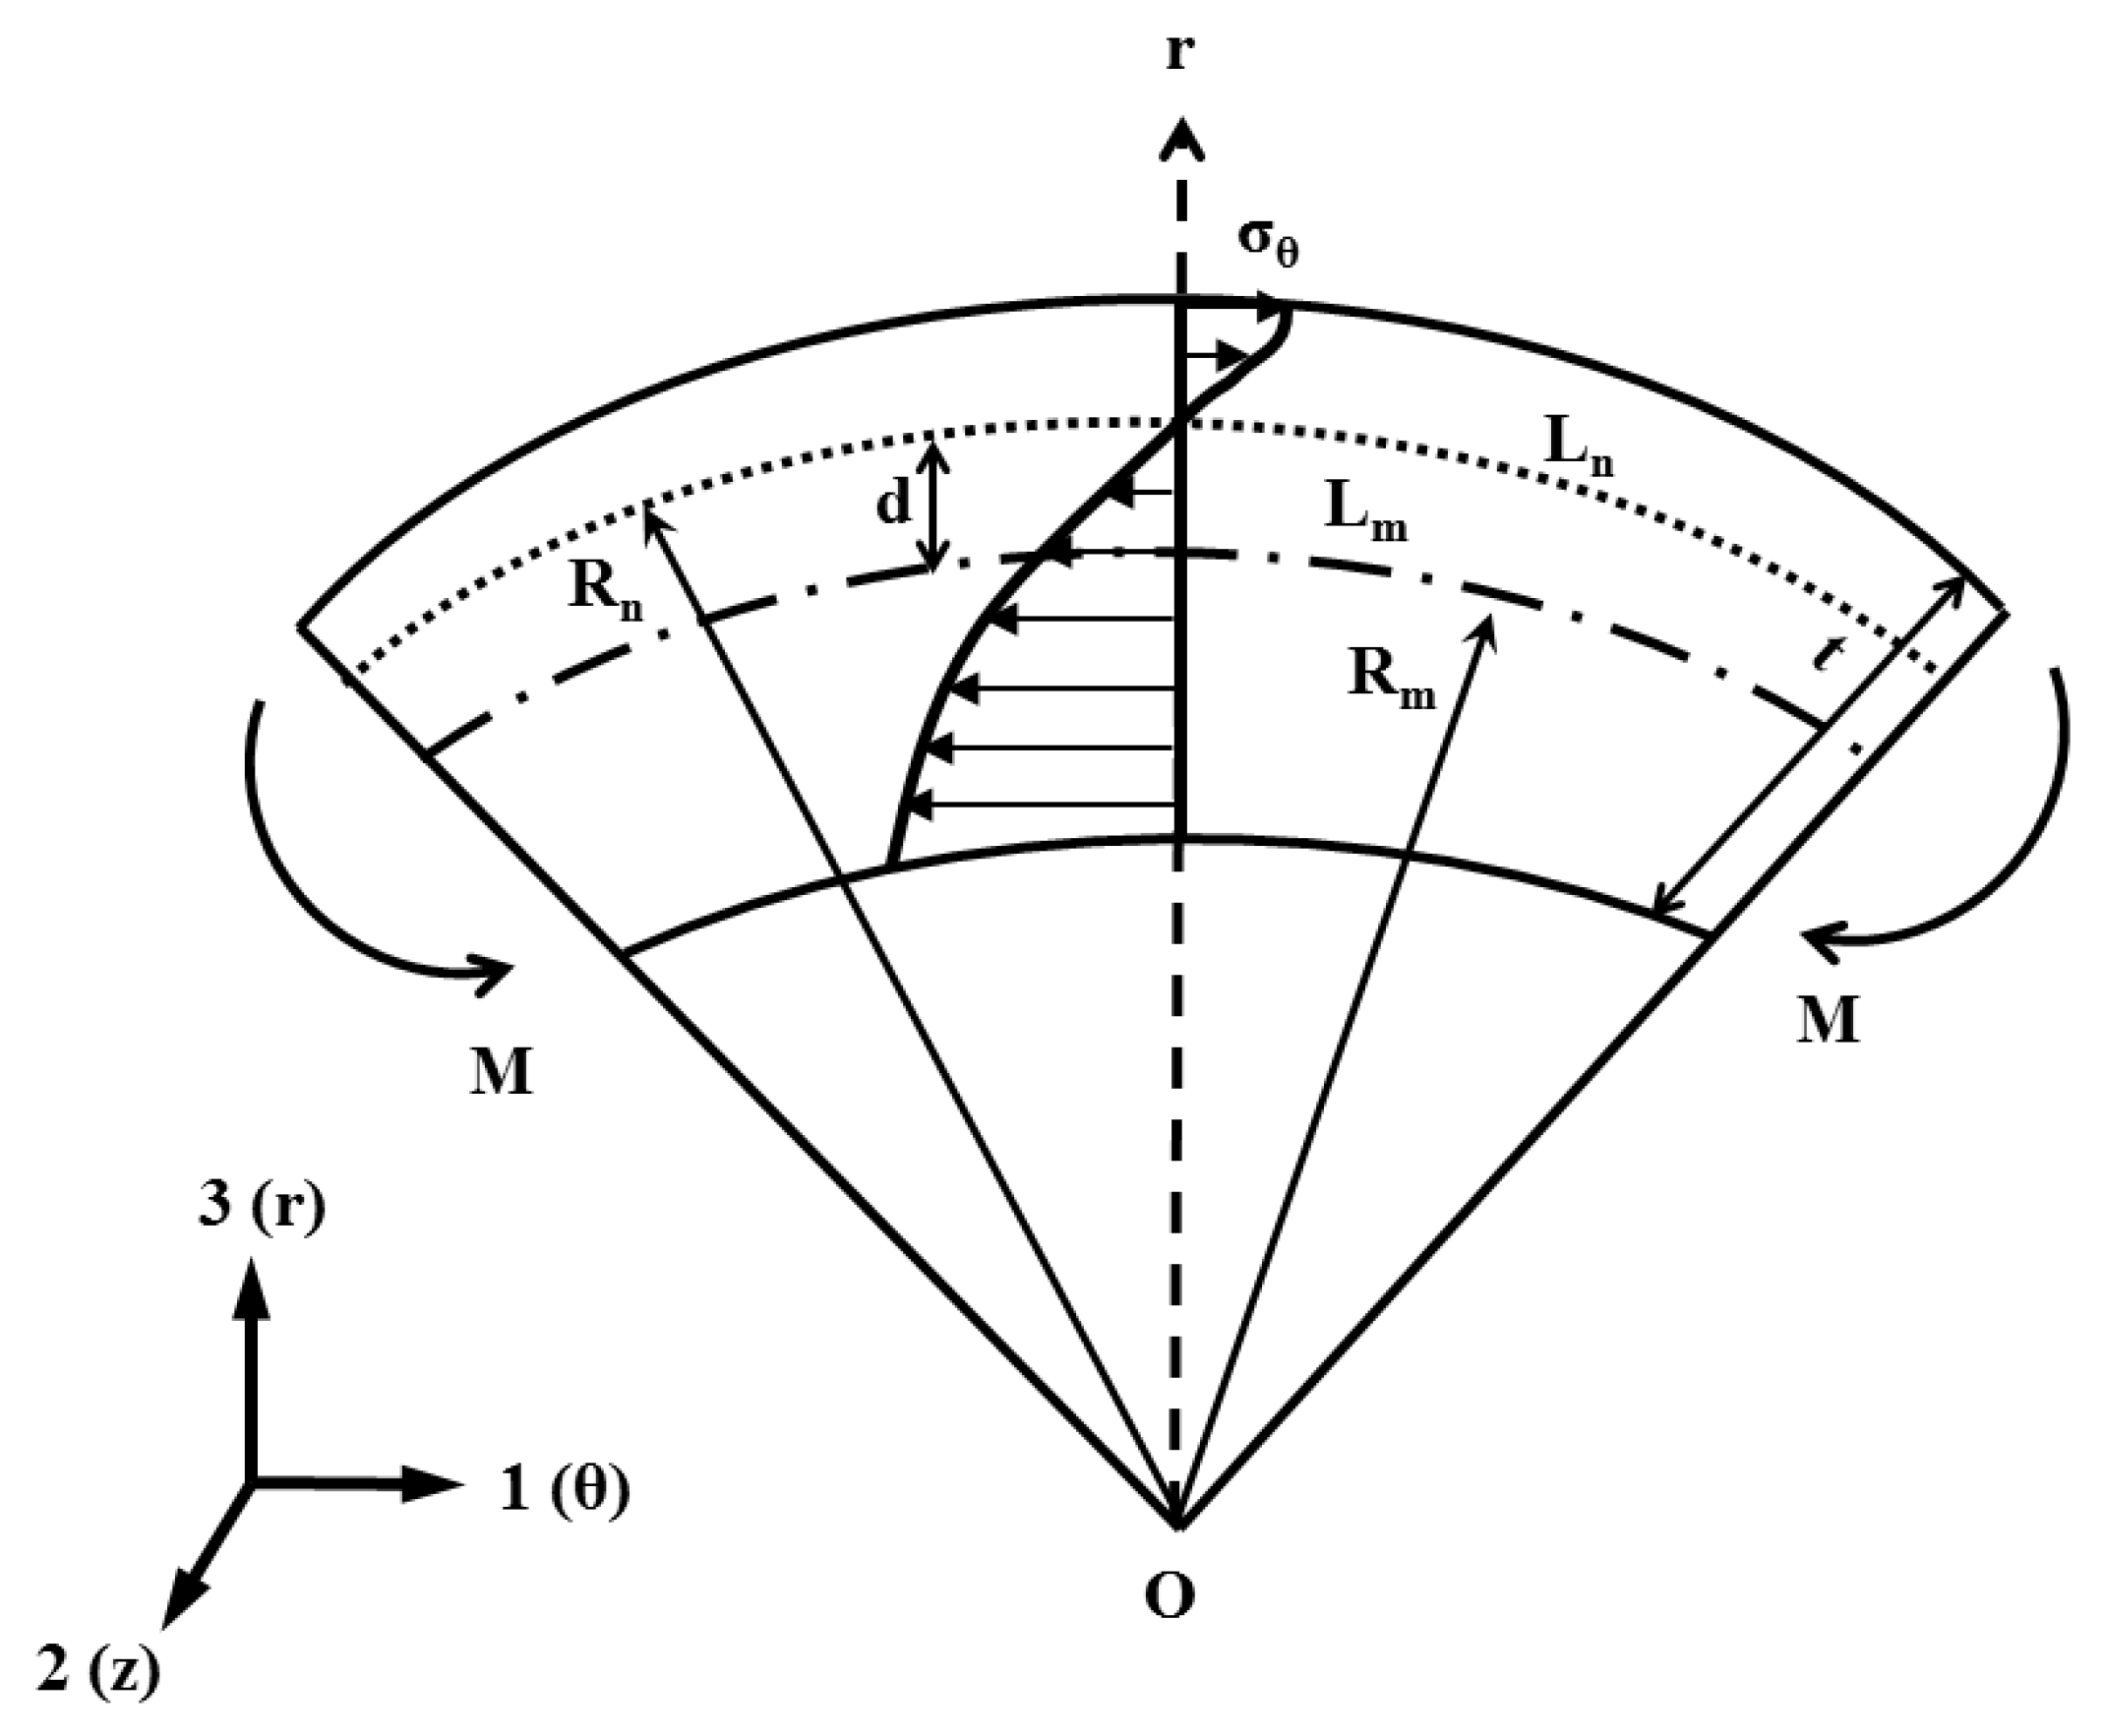
2. Analytical Method

The model materials used in this study were austenitic stainless-steel SUS304 and DP980 sheets with thicknesses of 0.3 mm and 1.2 mm, respectively, and widths of 1.5 mm and which were studied in the literature [6,7]. An in-plane uniaxial tension–compression test apparatus was used to prevent buckling of the specimens during the compression tests. In addition, a specially designed pure bending test apparatus used to measure the bending moment–curvature diagrams. Details of these devices can be found in the literature [6,7].
Some basic assumptions were considered in developing the analytical solution of pure bending as follows:
  • The plane section remains planar during pure bending;
  • The sheet thickness is assumed to be constant during the process;
  • The bending strain is proportional to its distance from the neutral surface.
The 1-, 2- and 3-directions were assumed to be the circumferential (θ), width (z), and radial (r) directions, respectively. The strain in the circumferential direction due to the pure bending was defined as:
ε 1 = ε b = l n ( 1 + y R ) y R
where εb is the bending strain in the circumferential direction, y is the distance measured from the neutral plane and R is the bending radius.
The neutral surface of pure bending is not always the same as the mid-surface. It can shift from the mid-surface for several reasons, some of which are applied tensile or compressive forces, TCA in yield points or the subsequent hardening. The TCA is only observed during the plastic bending and disappears for elastic bending. In this case, the neutral surface shifts to the outer or inner radius of the bending whenever the compressive yield point is lower or greater than the tensile yield point (RD and TD specimens in this study, respectively). Figure 1 shows the stress distribution through the thickness for an asymmetric material under pure bending. As it can be seen, the neutral surface with the length of Ln and the radius of Rn is not coinciding with the mid-surface with the length of Lm and radius of Rm. The parameter d shows the coordinate from the mid-surface to the neutral surface.
In this paper, to consider the effects of neutral surface shift, a pseudo-neutral surface was defined as suggested by Lee et al. [16]. It is a surface where the strain equals the membrane strain and coincides with the real neutral surface in case of no applied tensile force. Hence, the general form of strain distribution of an asymmetric material for pure bending is given as:
ε 1 = ε b = y d R

2.1. Equivalent Stress and Strain

Usually, in the bending analysis of sheet metals, two kinds of loading conditions are assumed: uniaxial and plane strain–plane stress loading conditions. By applying these two loading conditions and considering the associated flow rule for plastic deformation, a relationship among stresses in three directions can be found, and the yield function for the specific loading condition can be written only as a function of bending stress, σ1 as described in Equation (3),
f = β | σ 1 | = { β σ 1 , σ 1 > 0 β σ 1 , σ 1 < 0
where β is a function of loading condition. In fact, the yield function is assumed to be a homogeneous function of degree one with σ1 as the only independent variable. For asymmetric materials, β is a function of loading condition and the sign of the stress. Therefore, depending on the loading condition, it has different values in tension βt, and compression βc, as defined in Equation (4),
f = β | σ 1 | = { β t σ 1 , σ 1 > 0 β c σ 1 , σ 1 < 0
By using the associated flow rule and applying equivalent plastic strain increment as the plastic multiplier, we have:
d ε i p = d ε e f f σ i .
From Equations (4) and (5), the bending plastic strain for an asymmetric material is given as:
ε 1 p = { β t ε e q , ε 1 p > 0 β c ε e q , ε 1 p < 0

2.2. Plastic Deformation

Usually, the plastic flow of steels is concave down in both tension and compression loading. Generally, in order to capture the hardening behaviour of these materials, isotropic hardening rules, which can reproduce concave down curves, are applied. In this study, Voce and Swift hardening laws were considered and are expressed in Equations (7) and (8), respectively.
σ e q t = σ t + B { 1 e x p ( C ε e q ) }
σ e q = K s ( ε 0 + ε e q ) n
where σt is the tensile yield point and B, C, Ks and ε0 are material parameters determined from the tensile SS curve. According to Equations (4), (6), and (7), and considering 1/βt = γt and −1/βc = γc, the bending stress during plastic deformation based on Voce hardening can be defined as:
σ b = σ 1 = { γ t ( σ t + B { 1 e x p ( C γ t ( y d R γ t σ t E ) ) } ) , σ 1 > 0 γ c ( σ t + B { 1 e x p ( C γ c ( y d R γ c σ t E ) ) } ) , σ 1 < 0
Similarly, the bending moment based on Swift hardening rule can be expressed as:
σ b = σ 1 = { γ t K s ( ε 0 + γ t ( y d R γ t σ t E ) ) n , σ 1 > 0 γ c K s ( ε 0 + γ c ( y d R γ c σ t E ) ) n , σ 1 < 0
In order to write the equilibrium condition for a sheet under bending (Figure 1), the force acting on the strip with a unit width and thickness of dy is considered. Therefore, from the equilibrium condition, the tension T and the moment of the force element M can be written as:
T = t / 2 t / 2 σ 1 d y
M = t / 2 t / 2 σ 1 y d y
where t is the thickness of the sheet during bending.
Substituting Equation (9) into Equations (11) and (12) and considering the elastic and plastic deformations through the thickness the bending moment based on Voce hardening rule is defined as:
M = y c y t E ( y d R ) y d y + y t t 0 2 γ t ( σ t + B ( 1 e x p ( C γ t ( y d R γ t σ t E ) ) ) ) y d y       + t 0 2 y c γ c ( σ t + B ( 1 e x p ( C γ c ( y d R γ c σ t E ) ) )
where t0 is the initial sheet thickness and yt and yc are the coordinates from the mid-surface to the interface of elastic and plastic zones in tension and compression regions, respectively, given as:
y t = R ( γ t σ t E ) + d
y c = R ( γ c σ t E ) + d
Finally, by integrating Equation (13) the final expression for the bending moment under uniaxial loading is expressed as:
M = E 6 R ( 2 ( y t 3 y c 3 ) + 3 ( y c 2 y t 2 ) ( d ) )      + 1 8 ( γ t ( σ t + B ) ( t 0 2 4 y t 2 ) + γ c ( σ t + B ) ( 4 y c 2 t 0 2 ) )      + B R C ( e x p ( C γ t ( t 0 2 d 2 R γ t σ t E ) ) ( t 0 2 + R γ t C )      e x p ( C γ t ( y t d R γ t σ t E ) ) ( y t + R γ t C ) )      + B R C ( e x p ( C γ c ( y c d R γ c σ t E ) ) ( y c + R γ c C )      e x p ( C γ c ( t 0 2 d 2 R γ c σ t E ) ) ( t 0 2 + R γ c C ) )
and from the equilibrium of forces, we have:
T = y c y t E ( y d R ) d y + y t t 0 2 γ t ( σ t + B ( 1 e x p ( C γ t ( y d R γ t σ t E ) ) ) ) d y       + t 0 2 y c γ c ( σ t + B ( 1 e x p ( C γ c ( y d R γ c σ t E ) ) )
By integrating the above equation, the nonlinear relationship between neutral surface shift, d and the applied tensile force is defined as:
T = E ( y t y c ) ( ( y t + y c 2 d ) 2 R ) + γ t ( σ t + B ) ( t 0 2 y t ) + γ c ( σ t + B ) ( y c + t 0 2 )       + B R C ( e x p ( C γ t ( t 0 2 d 2 R γ t σ t E ) )       e x p ( C γ t ( y t d R γ t σ t E ) ) )       + B R C ( e x p ( C γ c ( y c d R γ c σ t E ) )       e x p ( C γ c ( t 0 2 d 2 R γ c σ t E ) ) )
In pure bending, T = 0 and the neutral surface shift, d, can be found by solving the abovementioned nonlinear equation.
Similarly, for the Swift hardening rule, the following expressions for bending moment and equilibrium of forces can be expressed as:
M = E 6 R ( 2 ( y t 3 y c 3 ) + 3 ( y c 2 y t 2 ) ( d ε T R ) )       + R K s n + 1 ( t 0 2 ( ε 0 + γ t ( t 0 2 d 2 R + ε T γ t σ t E ) ) n + 1       y t ( ε 0 + γ t ( y t d R + ε T γ t σ t E ) ) n + 1 )       K s R 2 γ t ( n + 1 ) ( n + 2 ) ( ( ε 0 + γ t ( t 0 2 d 2 R + ε T γ t σ t E ) ) n + 2       ( ε 0 + γ t ( y t d R + ε T γ t σ t E ) ) n + 2 )       + R K s n + 1 ( y c ( ε 0 + γ c ( y c d R + ε T γ c σ t E ) ) n + 1       + t 0 2 ( ε 0 + γ c ( t 0 2 d 2 R + ε T γ c σ t E ) ) n + 1 )       K s R 2 γ c ( n + 1 ) ( n + 2 ) ( ( ε 0 + γ c ( y c d R + ε T γ c σ t E ) ) n + 2       ( ε 0 + γ c ( t 0 2 d 2 R + ε T γ c σ t E ) ) n + 2 )
T = E ( y t y c ) ( ( y t + y c 2 d ) 2 R + ε T )       + R K s n + 1 ( ( ε 0 + γ t ( t 0 2 d 2 R + ε T γ t σ t E ) ) n + 1       ( ε 0 + γ t ( y t d R + ε T γ t σ t E ) ) n + 1 )       + R K s n + 1 ( ( ε 0 + γ c ( y c d R + ε T γ c σ t E ) ) n + 1       ( ε 0 + γ c ( t 0 2 d 2 R + ε T γ c σ t E ) ) n + 1 )

2.3. Yield Function

In this study, the Cazacu–Barlat 2004 yield function was applied [13]. It is an odd function of the principal values of the stress deviator S. Therefore, the yield criterion is sensitive to the sign of the stress σ1, and it can capture the tension–compression asymmetry of the material. The Cazacu–Barlat 2004 yield function can be expressed as:
f = ( J 2 3 2 c J 3 ) 1 3 = τ y
where τy is the yield stress in pure shear, c is a material parameter and J2 and J3 are the second and third invariants of the stress deviator tensor, respectively. The material parameter c is expressed as:
c = 3 3 ( σ t 3 σ c 3 ) 2 ( σ t 3 + σ c 3 )
where σt and σc are yield stresses in tension and compression, respectively. The yield function in Equation (21) can be rewritten in the following form:
( 27 3 3 2 c ) 1 / 3 ( J 2 3 2 c J 3 ) 1 / 3 = σ t .
By assuming the uniaxial loading condition, the yield function is reduced to:
f = ( 27 3 3 2 c ( | σ 1 | 3 3 3 c 2 σ 1 3 27 ) ) 1 3 = σ t
The sign function of σ1 is defined as:
s g n ( σ 1 ) = d d σ 1 | σ 1 | = { 1 , σ 1 > 0 1 , σ 1 < 0
Therefore, we have:
f = ( 3 3 2 c s g n ( σ 1 ) 3 3 2 c ) 1 3 | σ 1 | = σ t
From the above equation, we have:
β = ( 3 3 2 c s g n ( σ 1 ) 3 3 2 c ) 1 3
where β is the function of stress sign, loading condition, and the material constant c. In the case of symmetry, the material constant c is degenerated to zero, and β has the same value of unity for both tension and compression loading. Therefore, for uniaxial condition, and considering 1/βt = γt and −1/βc = γc, we have:
γ = { γ t = 1 , σ 1 > 0 γ c = ( 3 3 2 c 3 3 + 2 c ) 1 3 , σ 1 < 0
The values of c, γt, and γc, for DP980 and SUS304 in rolling-direction (RD) and transverse-direction TD, are calculated from Equations (22) and (28) and listed in Table 1. Based on the experimental stress–strain curves available in the literature [6,7], the tensile and compressive yield points, which were determined using the commonly used 0.2% offset strain method, are also listed in Table 1.

2.4. Springback Prediction

2.4.1. Elastic Unloading

In elastic springback, the unloading process, which causes an equal value of moment in the opposite direction, is assumed to be elastic. Therefore, as shown in Figure 2 the unloading path in the moment–curvature diagram is a straight line with the same slope of the elastic region ( m = M / ( 1 R ) | e ) from the M = M* to M = 0, where M* is the bending moment at the instant of unloading. Moreover, the magnitude of the springback is considered as the curvature change from the unloaded centreline curvature as shown in Figure 2.
Hence, the equation for the elastic unloading of applied M is expressed as:
M U E = M * = t 0 / 2 t 0 / 2 E ( y Δ r ) y d y = 1 12 E t 0 3 1 Δ r
where 1/Δr is the curvature change due to the unloading (springback) and Mue is the elastic unloading moment.

2.4.2. Nonlinear Unloading

Generally, elastic unloading is applied to find the Δ(1/R). However, it was shown that the unloading is not entirely elastic, and there are small scale plasticity effects in springback [19,20]. In order to consider the effects of nonlinearity in unloading and springback, several methods were suggested by various researchers. Sun and Wagoner [21] introduced a quasi-plastic–elastic (QPE) strain component in addition to plastic and elastic strain components. The QPE strain allows an additional strain recovery, which cannot be captured by elastic unloading. They used some aspects of two-yield surface approaches. Another recently proposed method is a piecewise-linear approach that adopts the concept of multiple yield surfaces [22]. Although these methods are successful in capturing the nonlinearity in unloading, they have the complexity of applying the multiple yield surface approaches which make them suitable for finite element analysis. The most common approach is to define a variable elastic modulus for the unloading [19,23,24]. In this method, the elastic modulus is the function of the accumulated plastic strain. This method is called the chord model, since the coefficients of the proposed function are determined by fitting the function to the measured chord moduli. Chord modulus is the slope of a chord or a straight line drawn between the unloading start point and the end point (σ = 0) of the unloading stress–strain curve. In this study, to describe the nonlinear elastic unloading analytically, the chord method was adopted.
According to Yoshida et al. [25], the variation of the effective elastic modulus with accumulated plastic strain can be expressed in terms of an exponential equation as described in Equation (30)
E e f f = E 0 ( E 0 E a ) ( 1 e x p ( ξ ε ¯ p ) )
where E0 and Ea are the initial and saturated elastic moduli, ε ¯ p is the equivalent plastic strain and ξ is a material parameter. As it can be seen in Figure 3, Equation (29) was fitted to the experimental data achieved from experimental stress–strain curves in the loading–unloading with different pre-strain values for SUS304TD specimens from Kuwabara et al. (2009a) [6]. The applied coefficients for the chord method are listed in Table 2, where T and C denote tension and compression, respectively.
The equation for the unloading moment with the variable elastic modulus M U V E and the assumption of no neutral surface change during unloading, is given as
M u v e = y c y t E ( y Δ r ) y d y + y t t 0 2 ( E ( E E a T ) ( 1 e x p ( ξ T ε ¯ T P ) ) ) ( y Δ r ) y d y       + t 0 2 y c ( E ( E E a C ) ( 1 e x p ( ξ c ε ¯ c P ) ) ) ( y Δ r ) y d y
where EaT, and EaC are saturated elastic moduli in tension and compression, ξT and ξT are the material parameters in tension and compression and ε ¯ T P and ε ¯ c P are equivalent plastic strains in tension and compression, respectively. Although in the above equation, the nonlinear relationship between elastic modulus and plastic strain is applied, the relationship between curvature change and unloading moment is linear. For simplicity, the neutral surface shift during the unloading, which is caused by the variation of elastic modulus, is neglected. By integrating the equation and substituting the equivalent plastic strain, the final equation for a nonlinear unloading moment with variable elastic modulus is derived as:
M U V E = 1 24 Δ r ( E ( 8 ( y t 3 y c 3 ) ) + E a T ( ( t 0 3 8 y t 3 ) )       6 ( E E a T ) ξ T 3 γ t 3 ( ( R t 0 2 ξ T 2 γ t 2 + 4 R 2 t 0 ξ T γ t + 8 R 3 ) e x p ( ξ T ε ¯ T P | t 0 2 )       4 ( 2 R 3 + 2 R 2 y t ξ T γ t + R y t 2 ξ T 2 γ t 2 ) e x p ( ξ T ε ¯ T P | y t ) )       + E a C ( 8 y c 3 + t 0 3 )       6 ( E E a C ) ξ C 3 γ c 3 ( 4 ( 2 R 3 + 2 R 2 y c ξ C γ c + R y c 2 ξ C 2 γ c 2 ) e x p ( ξ C ε ¯ C P | y c )       ( R t 0 2 ξ C 2 γ c 2 4 R 2 t 0 ξ C γ c + 8 R 3 ) e x p ( ξ C ε ¯ C P | t 0 2 ) ) )
For the equivalent plastic strains we have:
ε ¯ T P | t 0 2 = γ t ( t 0 2 D 2 R γ t σ t E ) ε ¯ T P | y t = γ t ( y t D R γ t σ t E ) ε ¯ C P | y c = γ c ( y c D R γ c σ t E ) ε ¯ C P | t 0 2 = γ c ( t 0 2 D 2 R γ c σ t E )
where D, R, yt and yc are the neutral surface shift, bending radius and the coordinates from the origin to the interface of elastic and plastic zones in tension and compression regions, respectively. It is worth mentioning that the above parameters are constant during the unloading.

3. Case Studies of Pure Bending and Springback

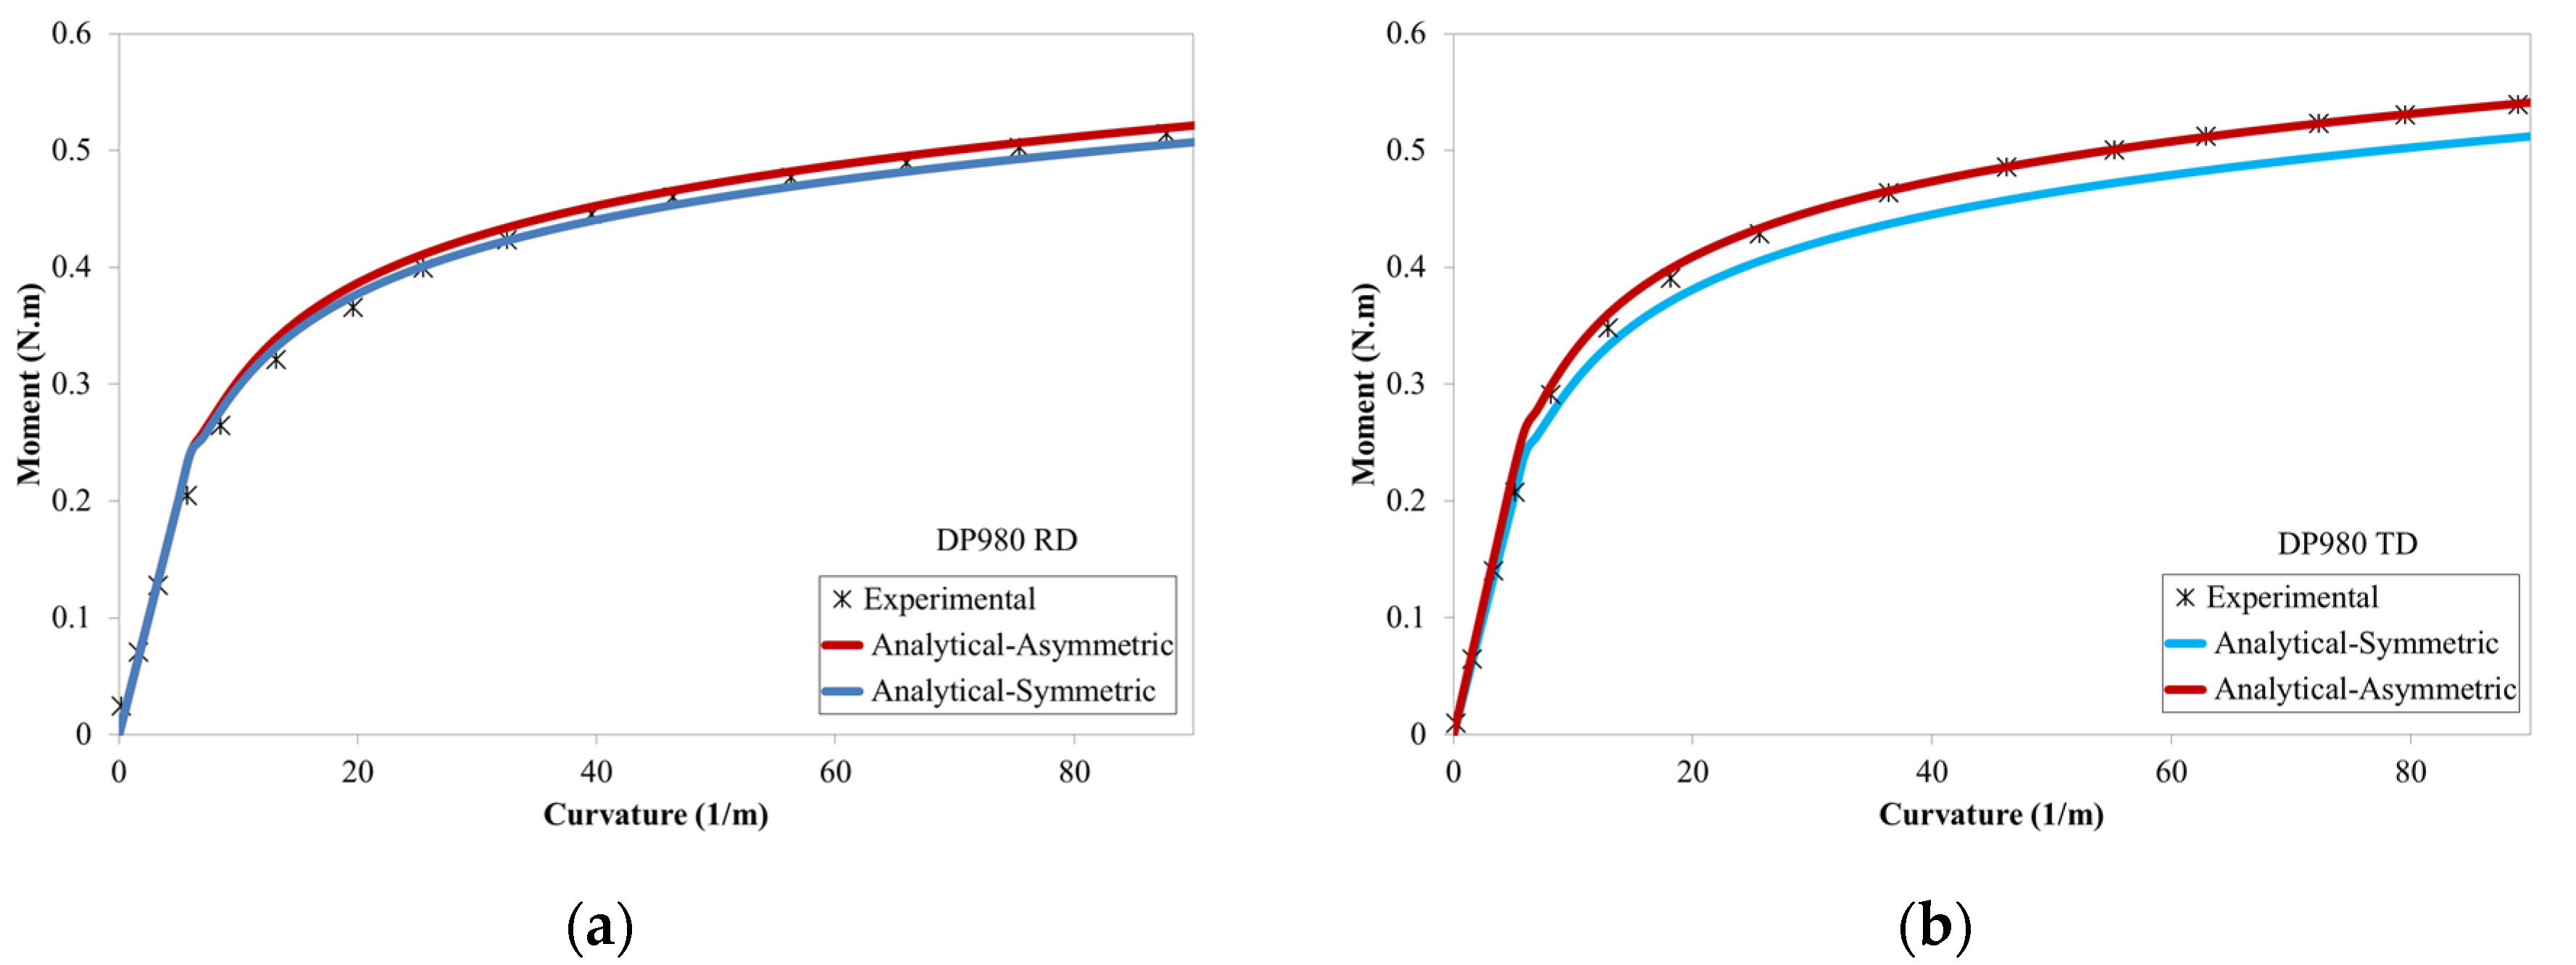
3.1. Pure Bending of DP980

Dual-phase 980 steel has significant applications in the advanced manufacturing of automobiles. They are frequently used in car body applications due to the fact of their high strength. In order to validate the analytical method and the derived equations, pure bending of DP980 sheets in rolling and transverse directions is studied in this section. The analytical results were compared with the experimental data from Maeda et al. [7].
As mentioned in Section 1, a few analytical studies are available in the literature, which are semi-analytical methods. In those studies, the uniaxial stress–strain curves of the materials were divided into several regions, and at each region, the curve was fitted with a specific equation [5,6,7,16,17]. The values of stress were found by using those piecewise fitted curves or directly from the stress–strain curves. Applying these semi-analytical approaches results in using too many parameters and limits the methods only to the uniaxial loading condition. However, continuum plasticity is based on the concepts of yield surface, flow rule and hardening evolution. Although these concepts can be applied in finite element simulations, to the best of the authors’ knowledge, no analytical methods to date were developed for modelling the evolving plastic behaviours of asymmetric materials using continuum plasticity concepts.
One of the benefits of the analytical method presented in this study is that compressive hardening parameters are not necessary. Based on Equations (9) and (10), bending stress is the only function of the tensile hardening parameters and the compressive yield point. In order to fit the stress–strain responses of the material, the Swift hardening rule was applied, and Equation (10) fits to the experimental results in Figure 4. As it can be seen, the proposed model can capture the plastic flow in tension and compression successfully. The material parameters and hardening coefficients applied in the analytical study are listed in Table 3 for reference. The tensile Young’s modulus and tensile and compressive yield points were measured from the experimental stress–strain curves provided in Figure 4, and the hardening parameters were determined by curve fitting. It is worth mentioning that the experimental stress–strain curves used in this study were considered as the reference monotonic tension–compression test data for the DP980. This implies that the material properties among the test specimens were constant and the material was selected from one batch.
Pure bending moment–curvature of DP980 in RD and TD were determined based on Equation (19). The outputs based on symmetric and asymmetric models are compared with the experimental results in Figure 5. As it can be seen, the asymmetric model can successfully model the pure bending of DP980 in both rolling directions, while the symmetric model shows a discrepancy between measured and calculated results.

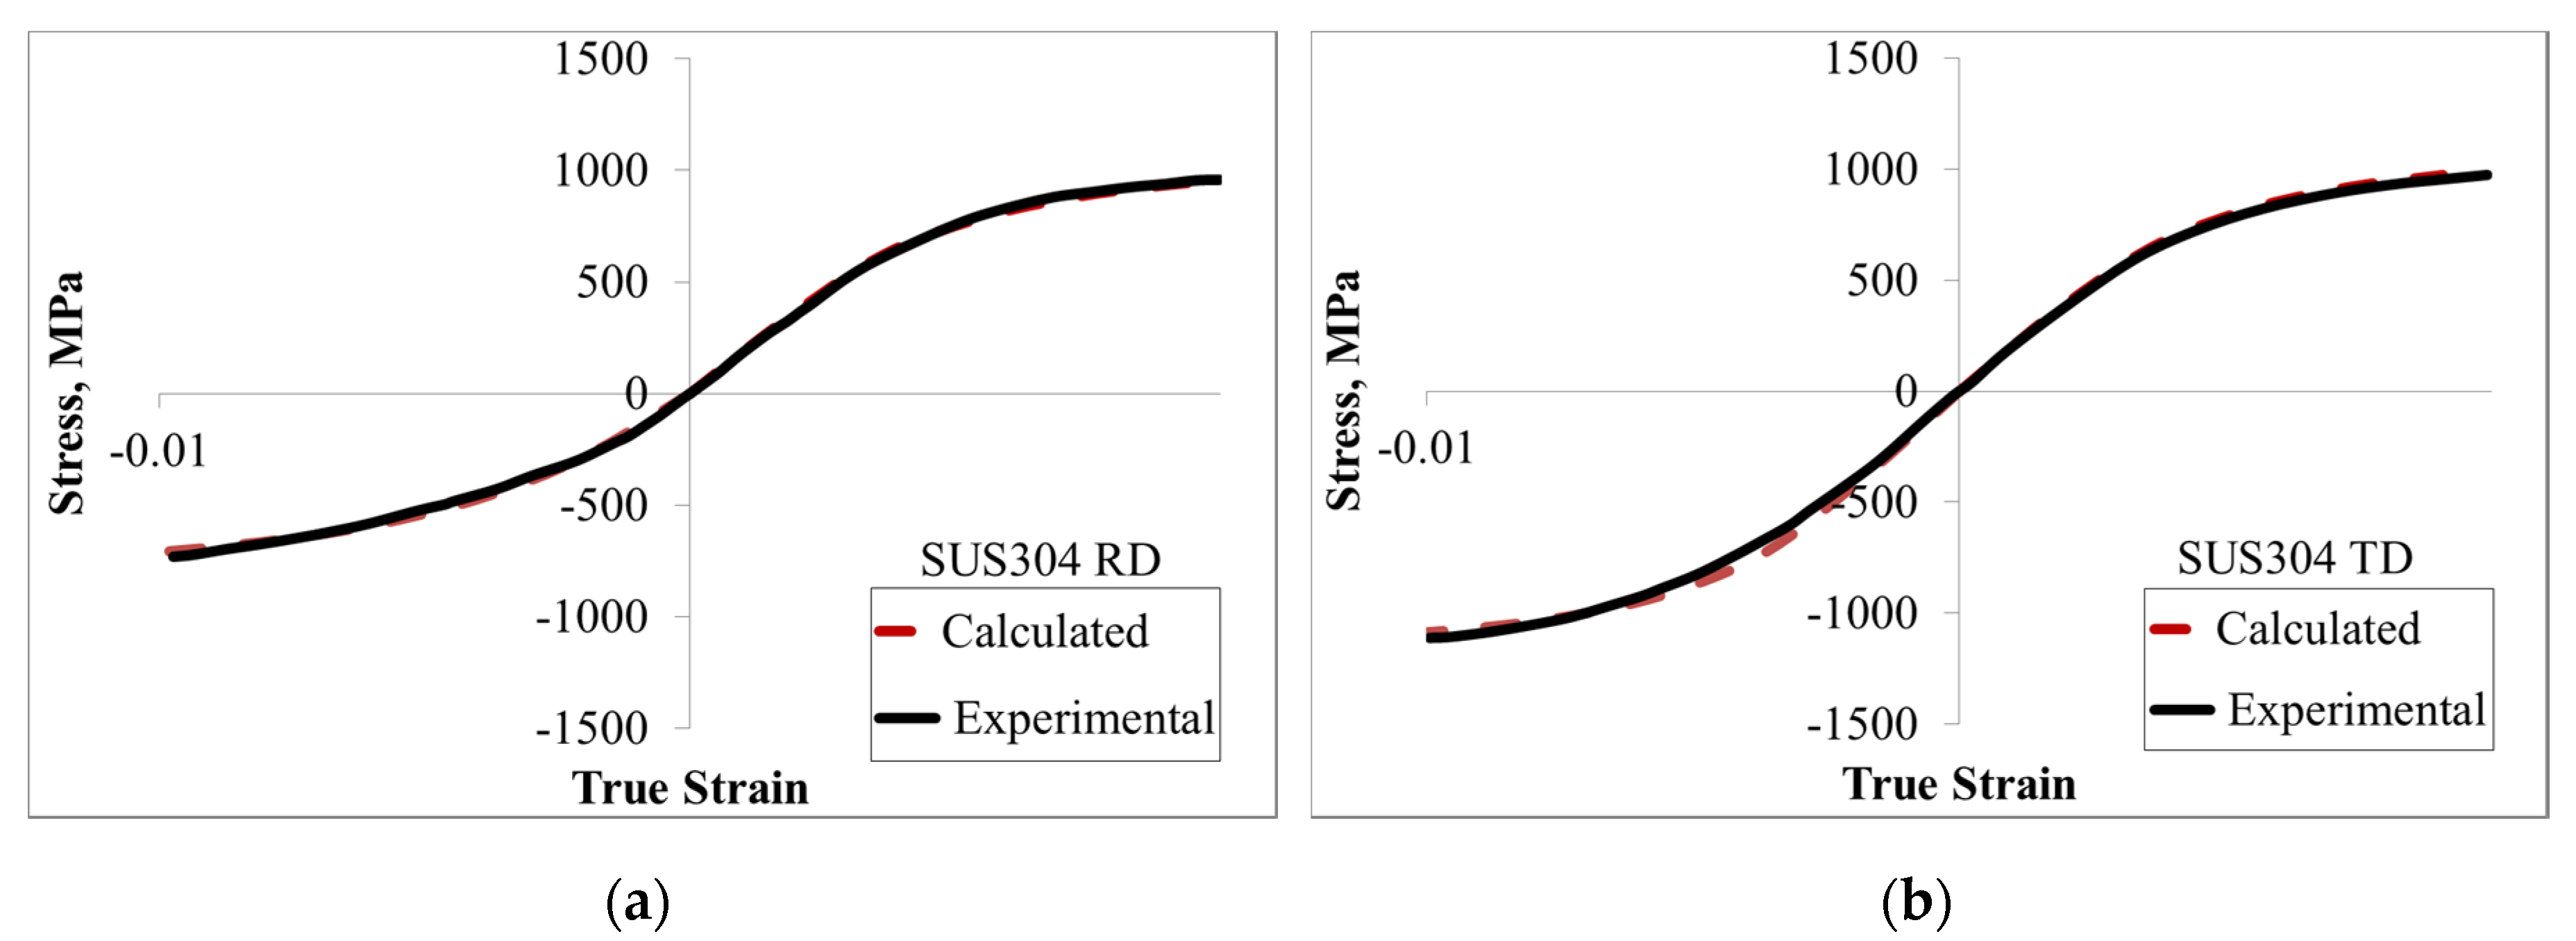
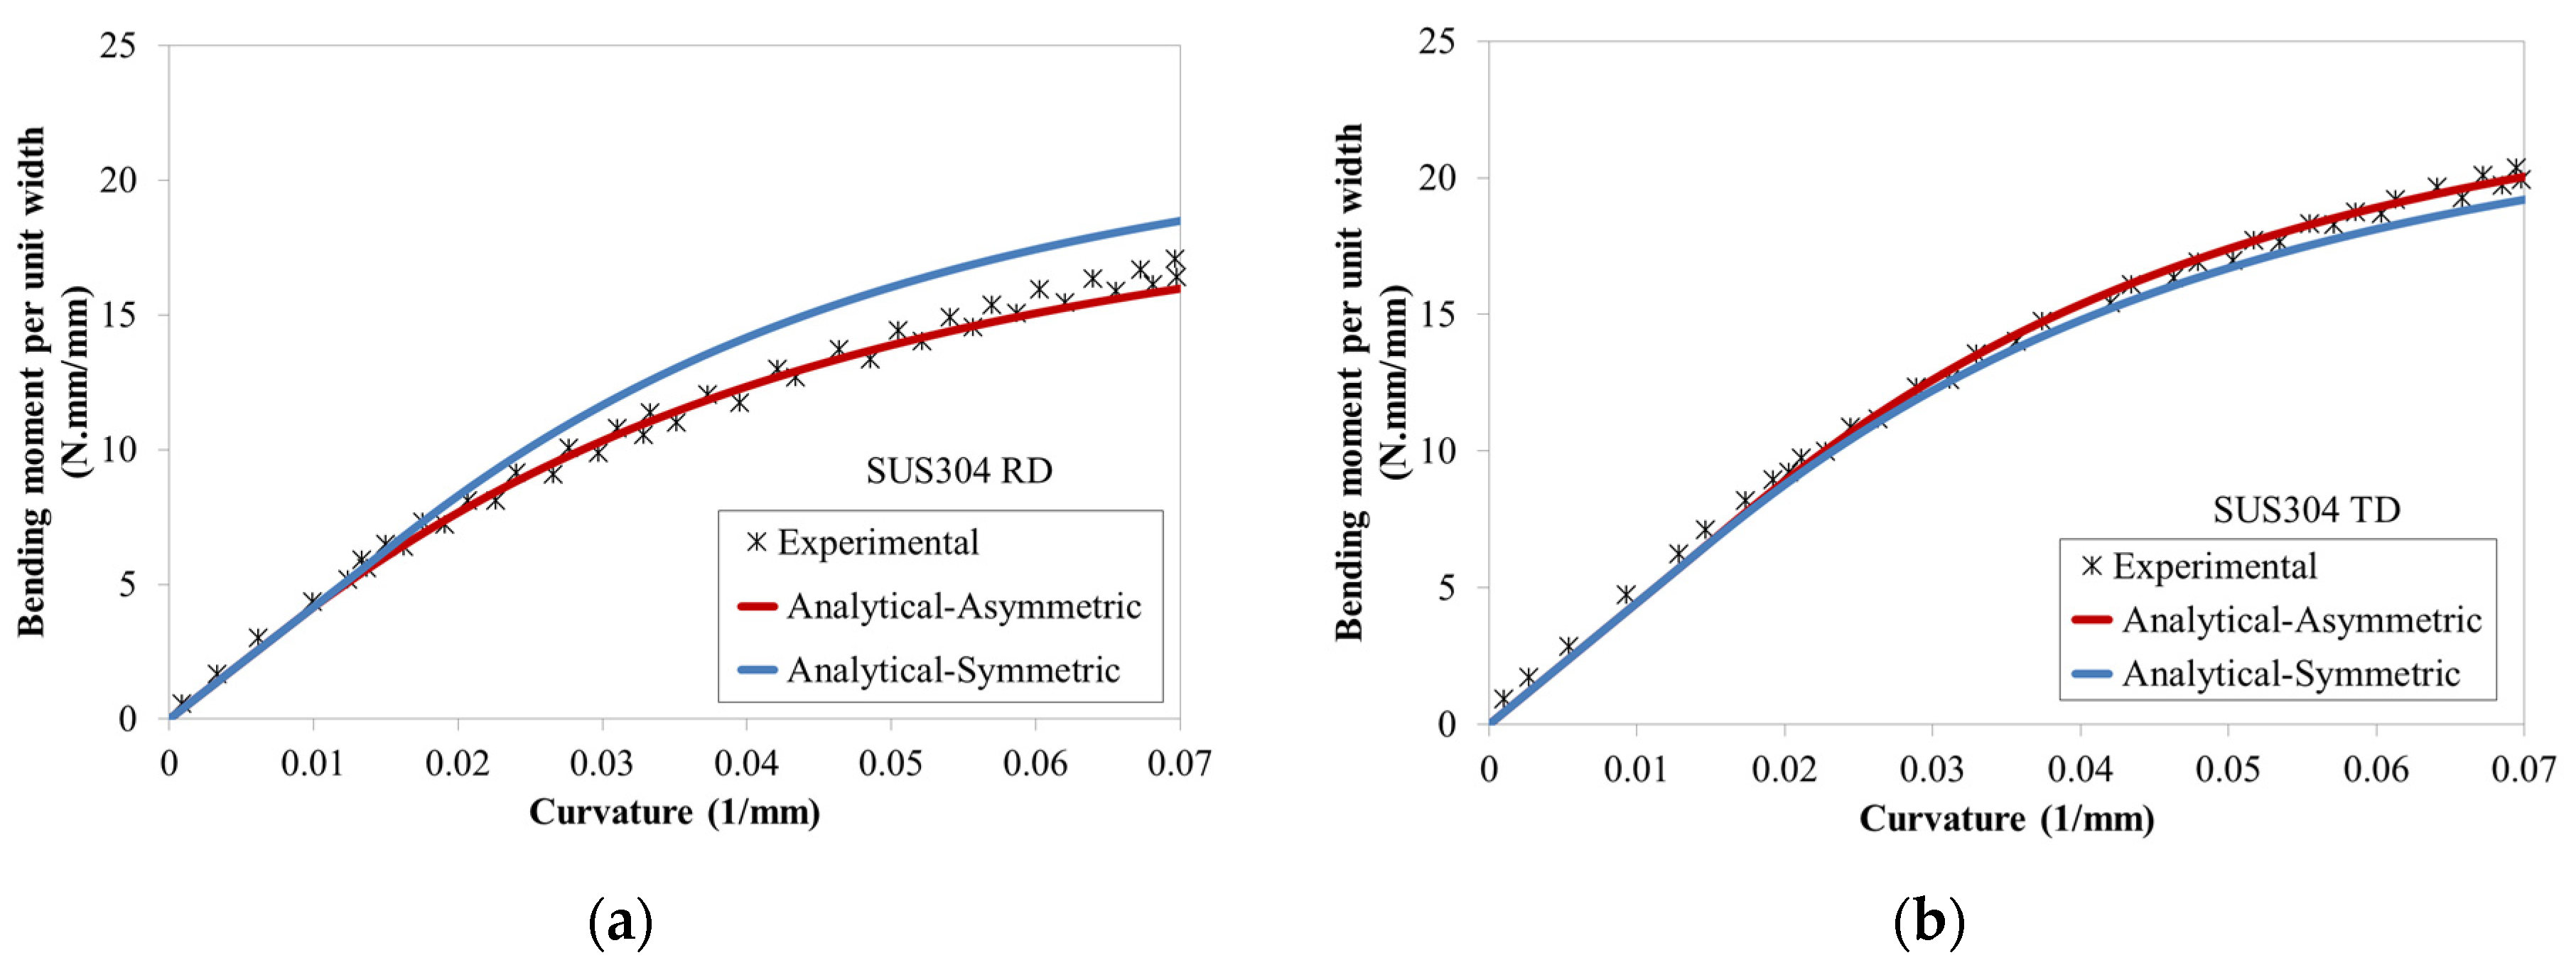
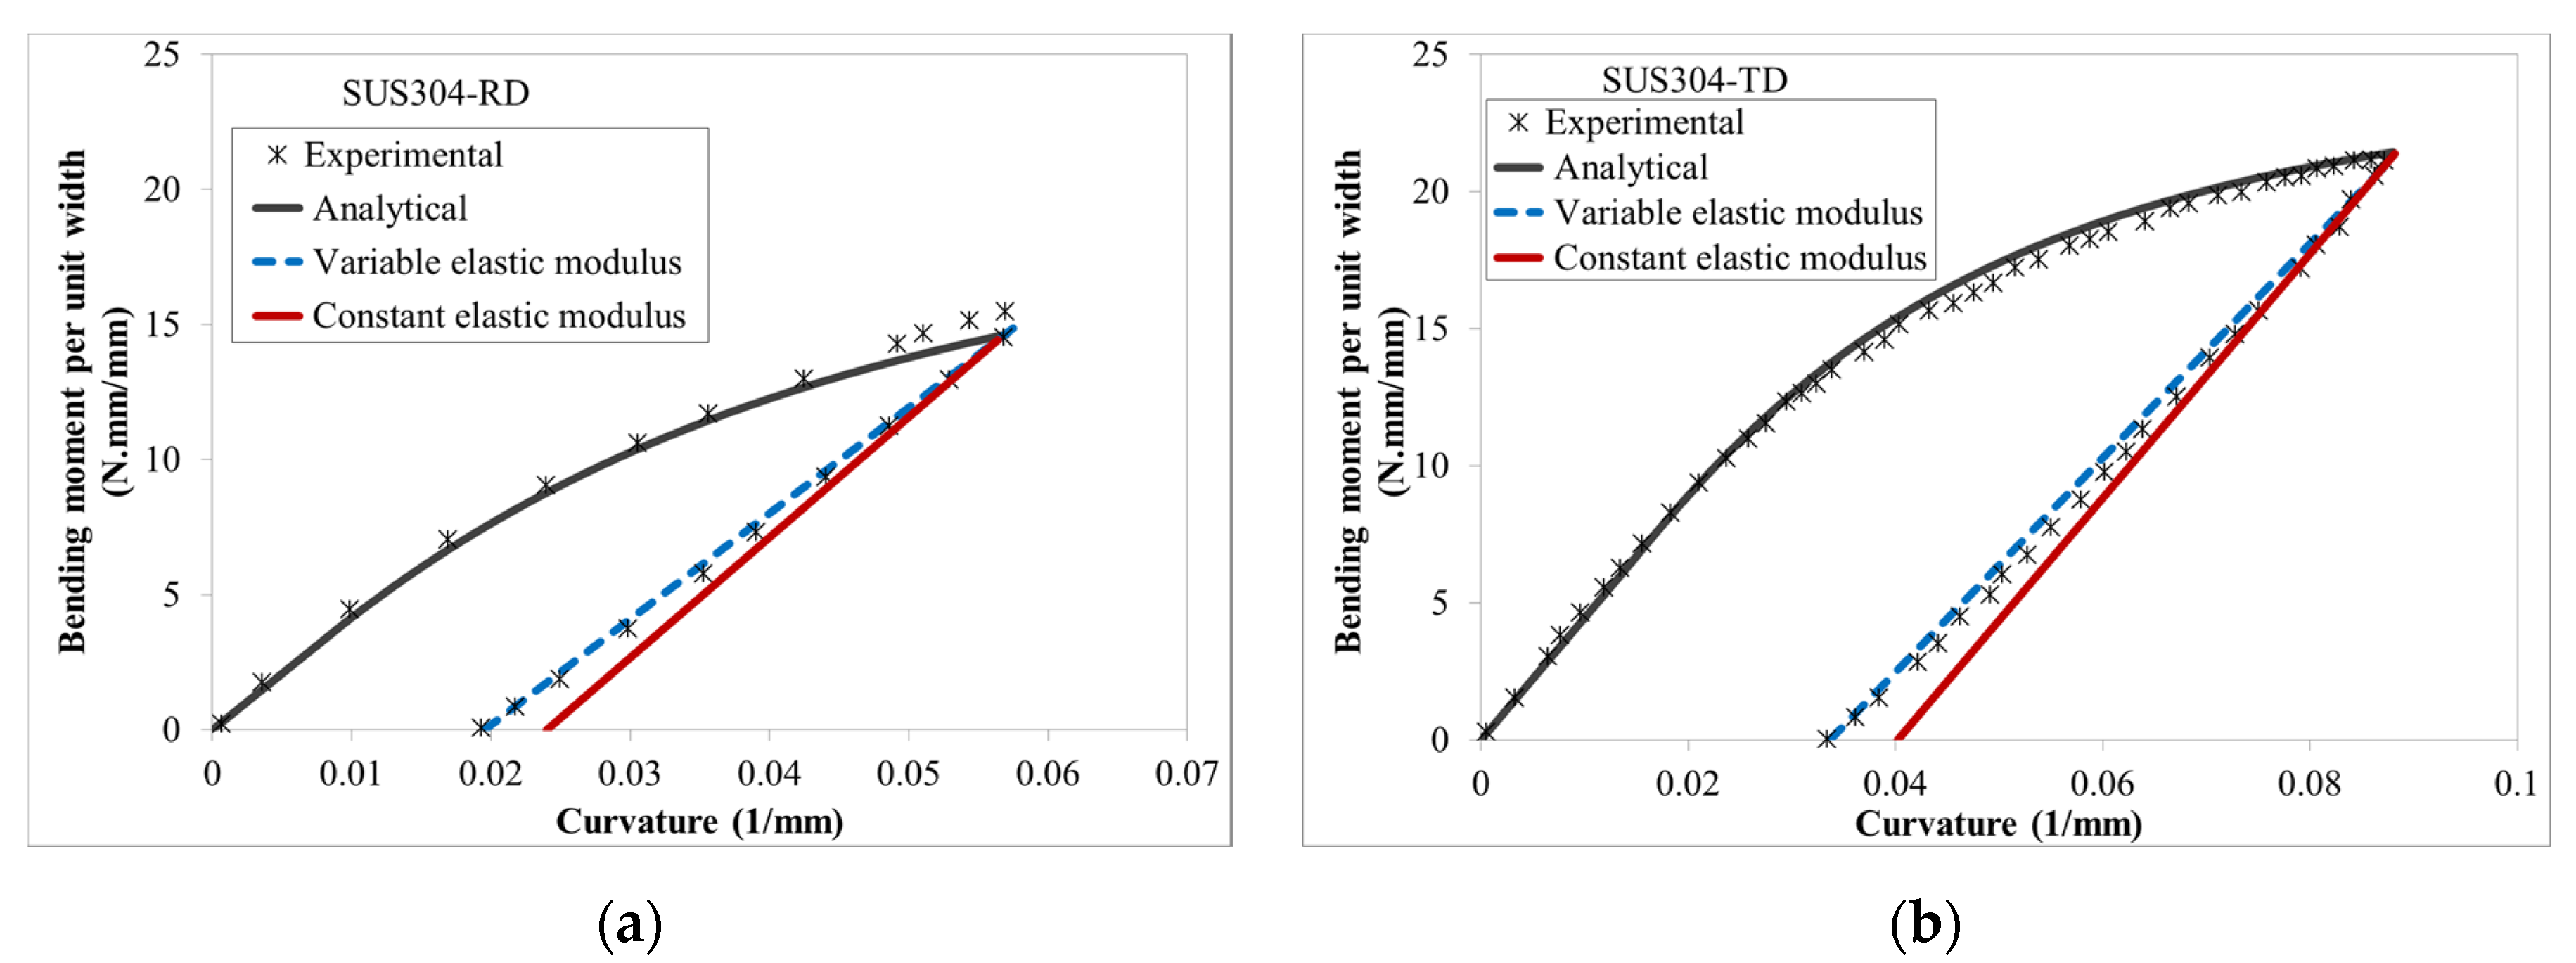
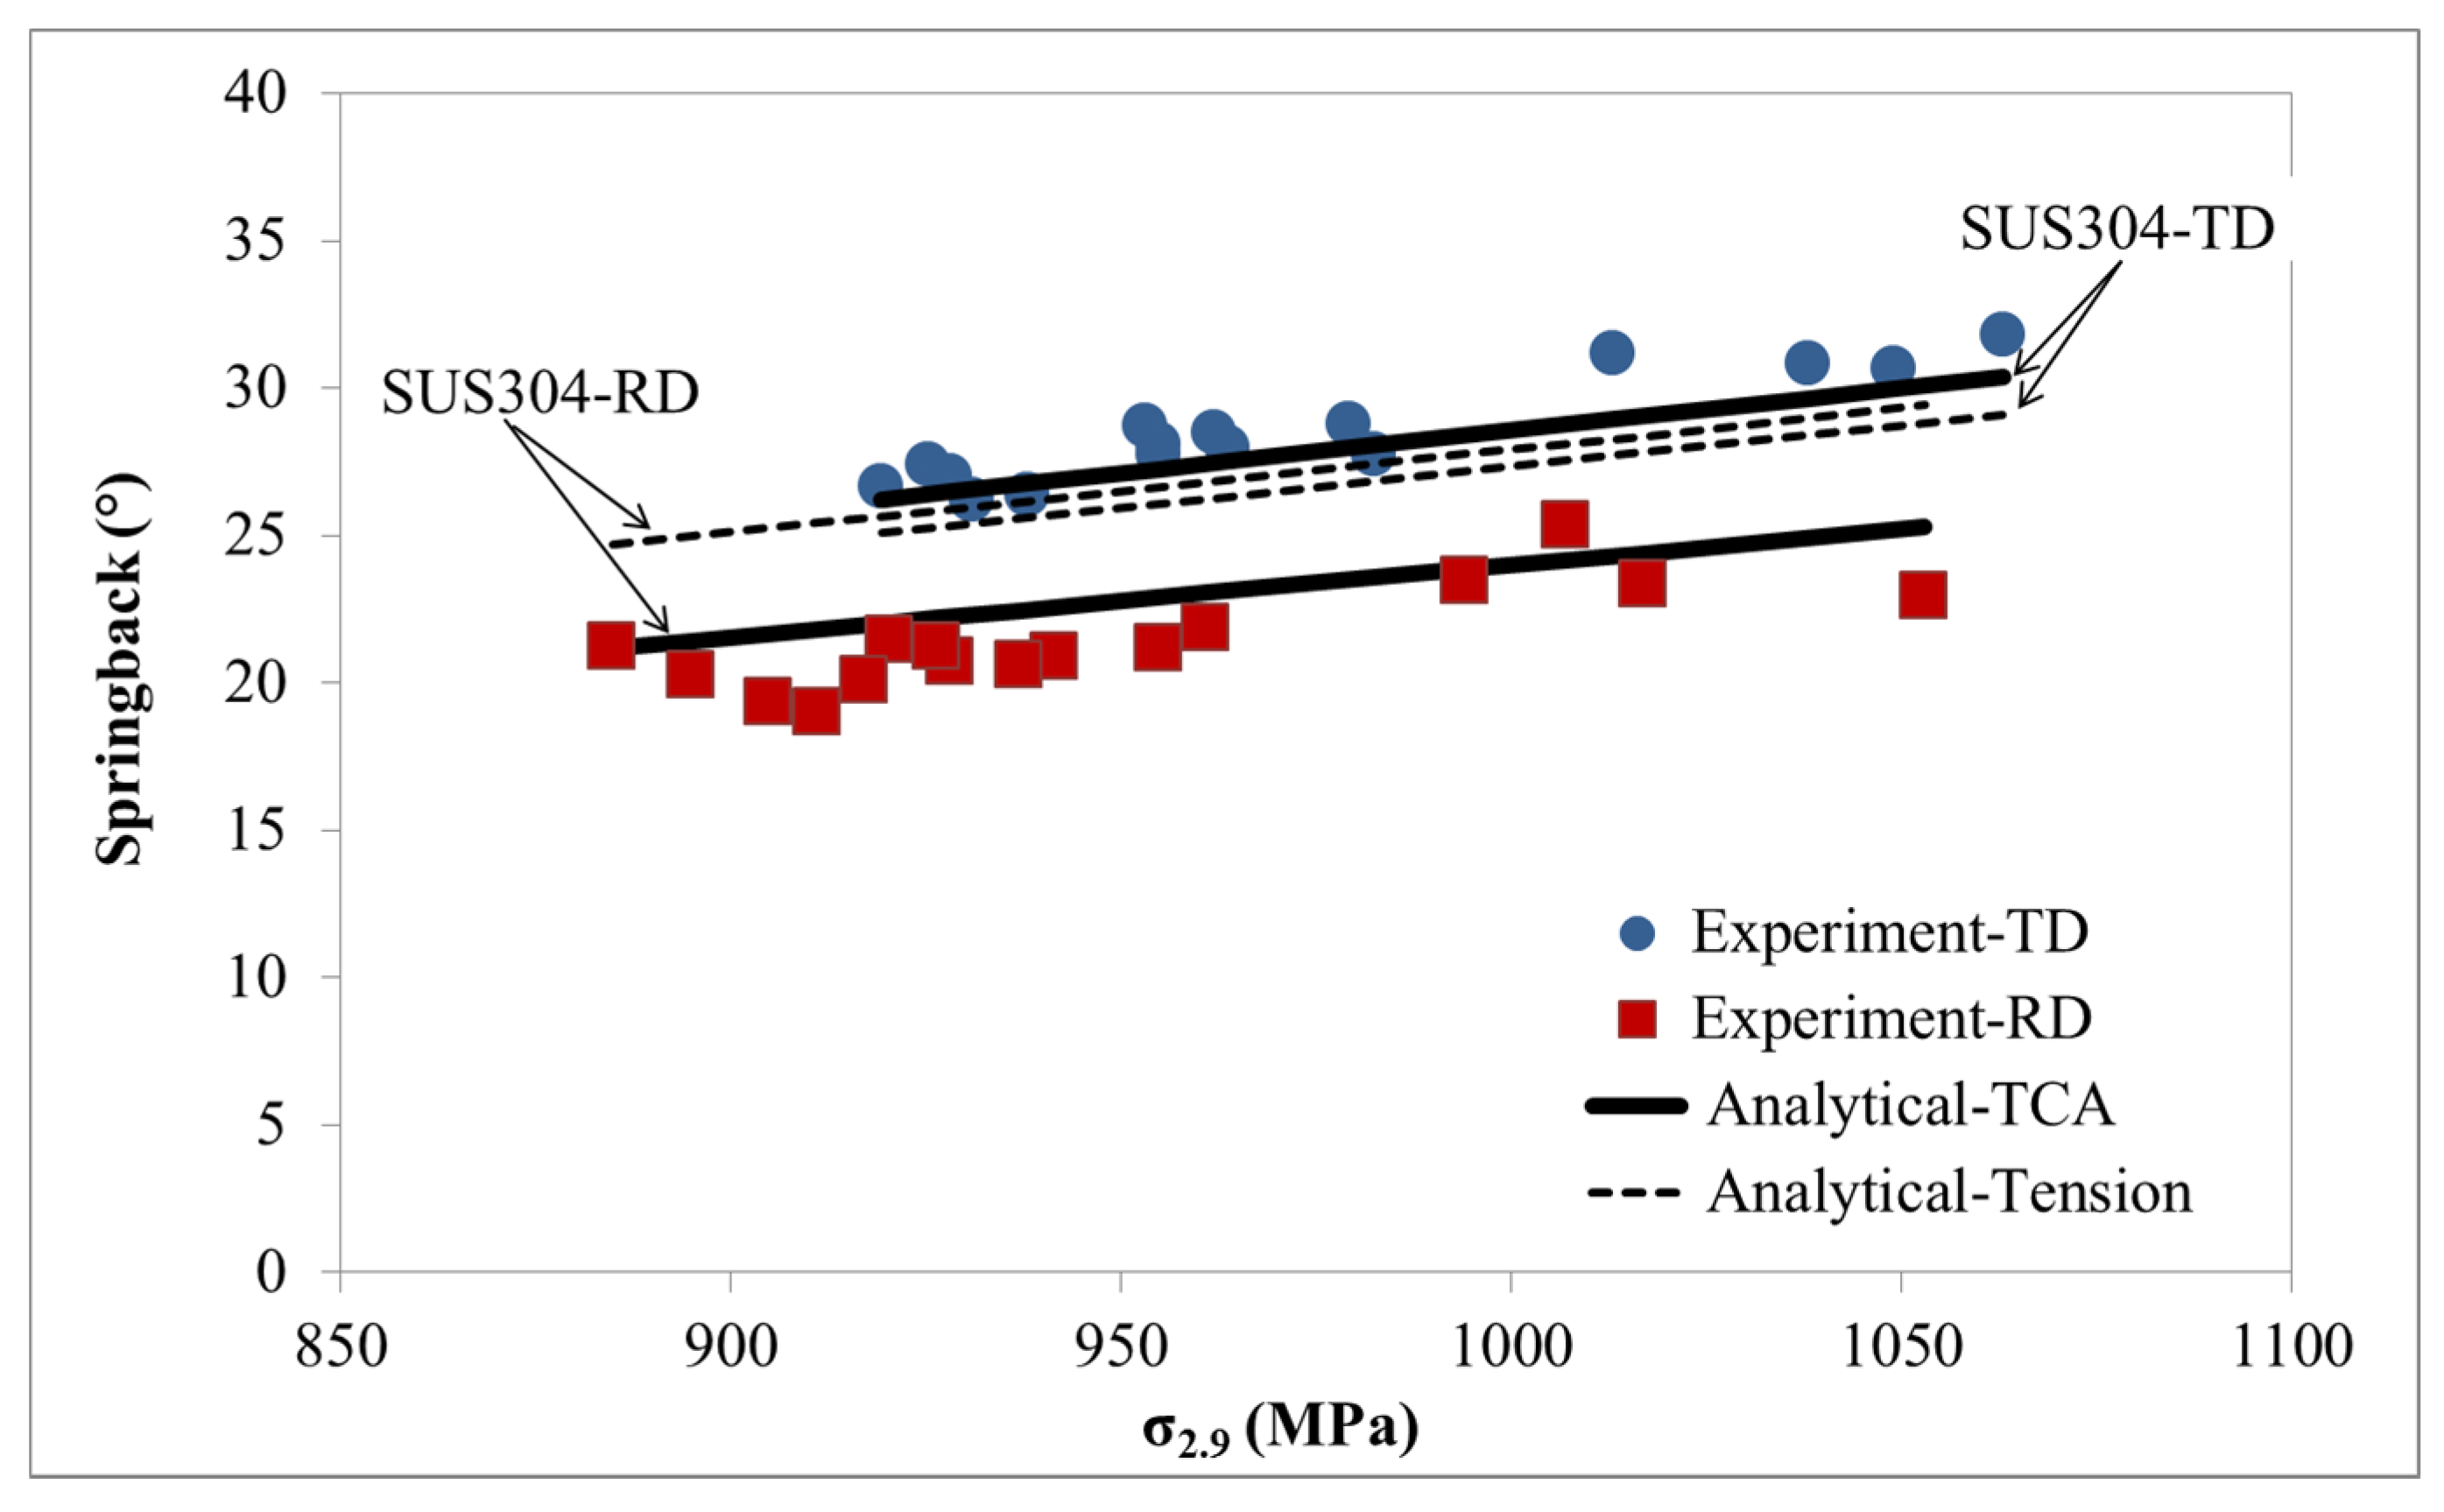
3.2. Pure Bending and Springback of Stainless Steel 304

The Voce hardening defined in Equation (7) is fitted to the experimental results in Figure 6. As it can be seen, both tensile and compressive fitted curves were in good agreement with the experimental results in RD and TD [6], respectively. Moreover, the material parameters applied for fitting are listed in Table 4.
The calculated bending moment–curvatures based on Equation (16) are compared with the experimental results in Figure 7. As it is shown, for both RD and TD specimens, the curvatures considering the TCA were in great agreement with the experimental results. On the other hand, the calculated curves based on symmetric behaviour did not coincide with the experimental results. In this analytical method, the symmetric condition occurs when the asymmetry parameter of the yield function is zero (c = 0).
The variation of neutral surface shift versus the curvature change is shown in Figure 8 for pure bending in RD and TD. As it can be seen, the natural surface shift is zero at the beginning due to the elastic bending. However, by increasing the bending curvature, elastoplastic bending occurs and the natural surface shift increases. Moreover, the neutral surface shifts with a high rate initially and slows down as the plastic deformation governs the bending behaviours. In addition, the neutral surface shifts to the inner and outer radius of bending under bending in TD and RD, respectively. The neutral surface shift in TD shows much lower values than those in RD, because the TCA in TD is much smaller than that in RD.
The unloading paths based on constant and variable elastic moduli are compared with the experimental path for RD and TD specimens in Figure 9. As it can be seen, the unloading path based on Equation (32) with variable elastic modulus matched the experimental path greatly. Because the 1/Δr is equivalent to springback, it can be concluded that the predicted springback behaviours are improved significantly by applying the variable elastic modulus.

3.3. Numerical Study of Pure Bending of DP980 and SUS304

The analytical solution based on Cazacu–Barlat 2004 and the Voce hardening rule was implemented in the UMAT subroutine in ABAQUS/Standard. The radial return algorithm [26], which applies an implicit integration technique, was applied and improved to solve the constitutive equations. In the first step, the pure bending tests were simulated, and the results were compared with the analytical results. For pure bending tests, a 2D strip with the same dimensions used in experimental tests was modelled. Due to the symmetric boundary condition about the plane along the centreline of the sheet, only half of the sheet sample was modelled along with the rigid body to model the clamp as a fixture to the sample, as shown in Figure 10. The clamp was modelled as a discrete rigid part and fused to the right edge of the strip using the tie constraint. The moment was applied at point A, which is the reference point of the clamp. Thirty elements through the thickness were considered, since it showed good convergence in the results. The 4 node bilinear plane stress quadrilateral (CPS4R) element was adopted to model the sheet.
The bending moment–curvature curves of SUS304 and DP980 were obtained by using the proposed model by using UMAT subroutine and by using the default isotropic material in Abaqus (von-Mises), respectively. The results are compared with the analytical results in Figure 11. As it can be seen, the curves based on the default model of Abaqus did not coincide with the analytical curves. However, the analytical and simulation results using the UMAT subroutine were in good agreement for both RD and TD specimens. This shows that the model was implemented in UMAT successfully.

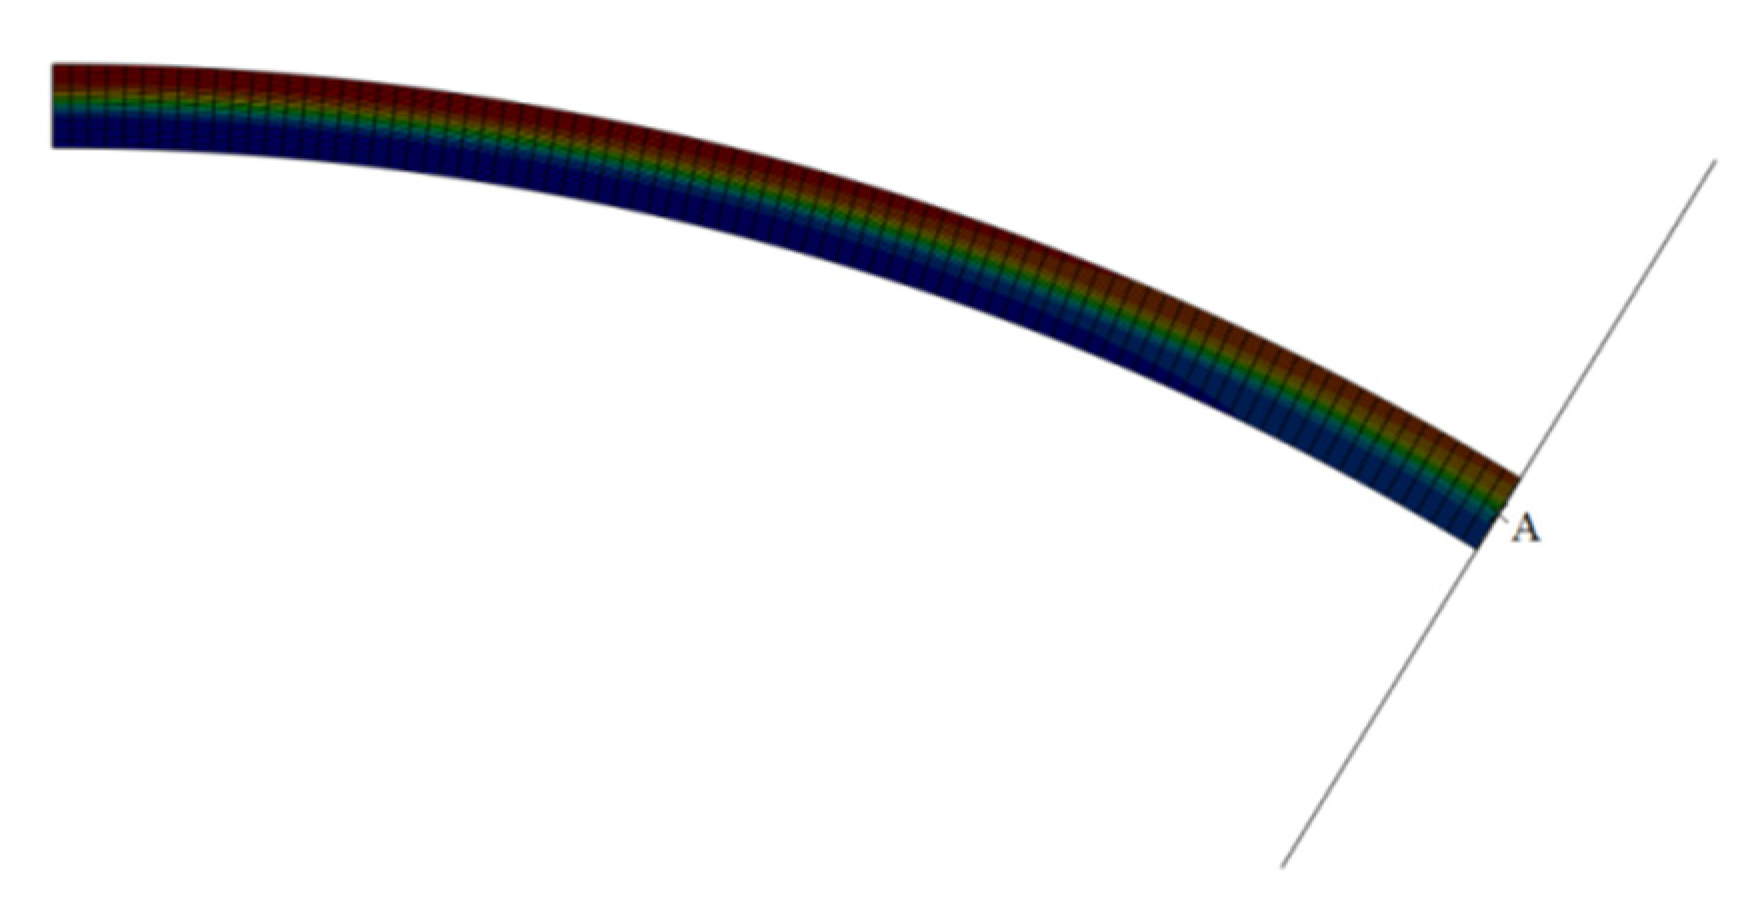
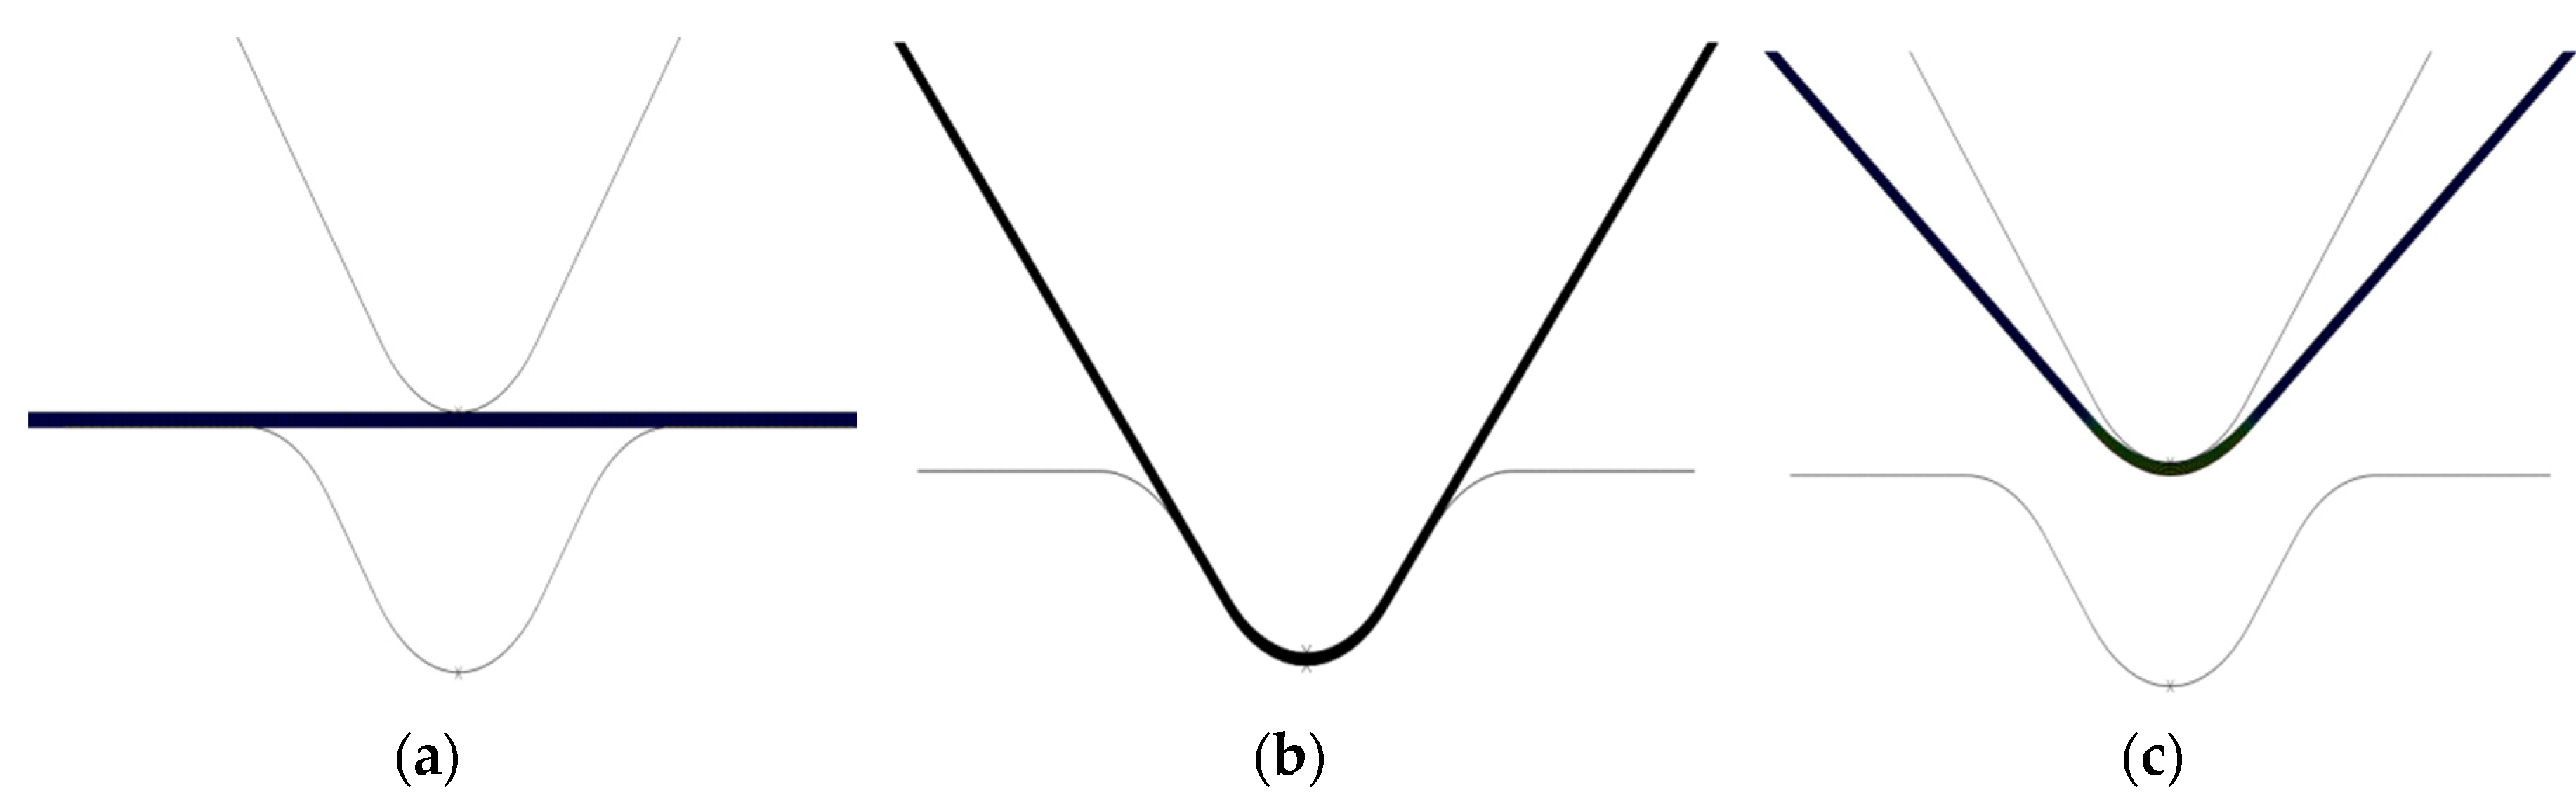
3.4. Numerical Study of SUS304 under V-Bending

To further study the effect of TCA in the springback of the SUS304, the V-bending process was simulated, and the resultant springback was determined and compared with the experimental results. The V-bending simulations were performed on SUS304 plates with 0.3 mm thickness. The bending angle and bending radius were 90° 5.0 mm, respectively. In this simulation, a 2D sheet was modelled along with two discrete rigid parts as punch and die. Like the pure bending simulation, the CPS4R element type was chosen and thirty elements were used through the thickness to secure accuracy after mesh refinement. The V-bending simulation with three stages— before bending, bending and springback—is shown in Figure 12.
In the V-bending process, the friction between sheet, punch and die is inevitable. It was reported by Matuszak [27], Trzepieciński et al. [28] and Ramezani et al. [29] that the average value of friction coefficient in steel sheet forming is in the range of 0.1 to 0.2, depending on the surface properties, geometrical features, velocity and lubricant condition, etc. Therefore, in this study, the average value of 0.15 was considered as the friction coefficient for the process. The predicted springback from the simulation is compared with the experimental results in Figure 13. As it can be seen, considering TCA in calculations improved the springback results significantly. The numerical springback values with TCA are closer to the experimental results, compared to those with tension. By applying TCA in calculations, the relative errors were reduced from −7.86% to −2.11% and 23.01% to 4.32% for TD and RD bending, respectively.

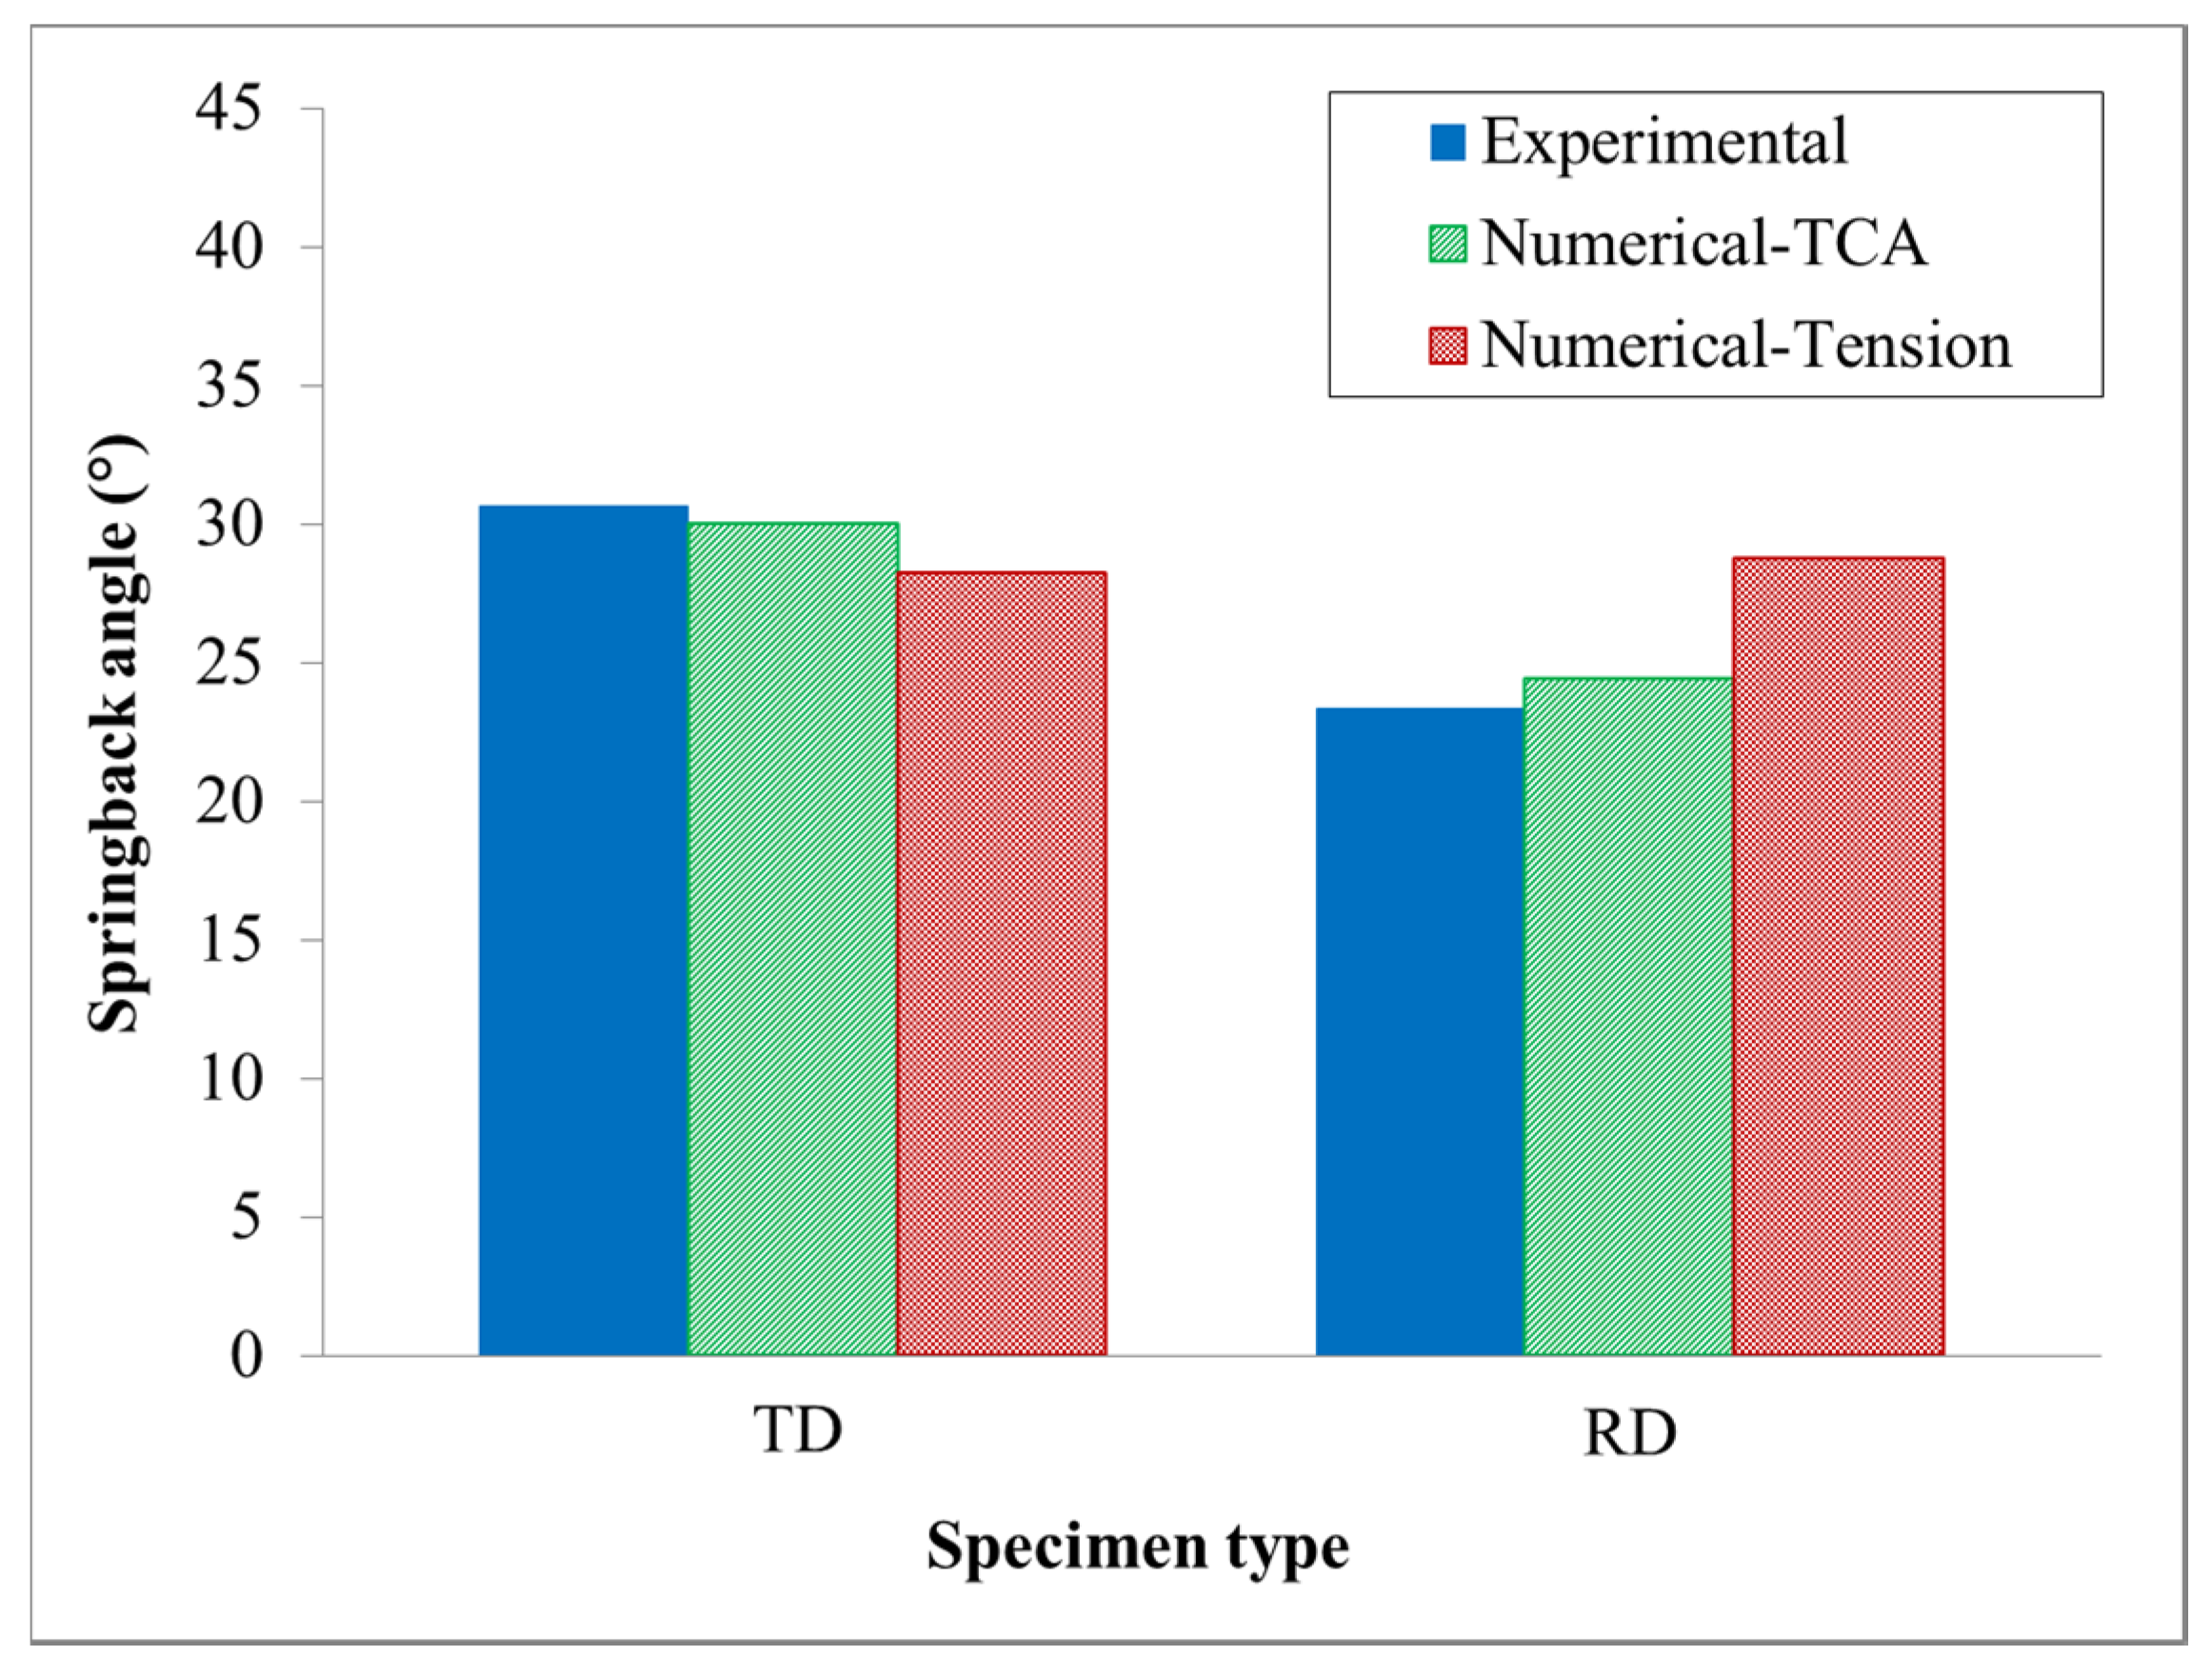
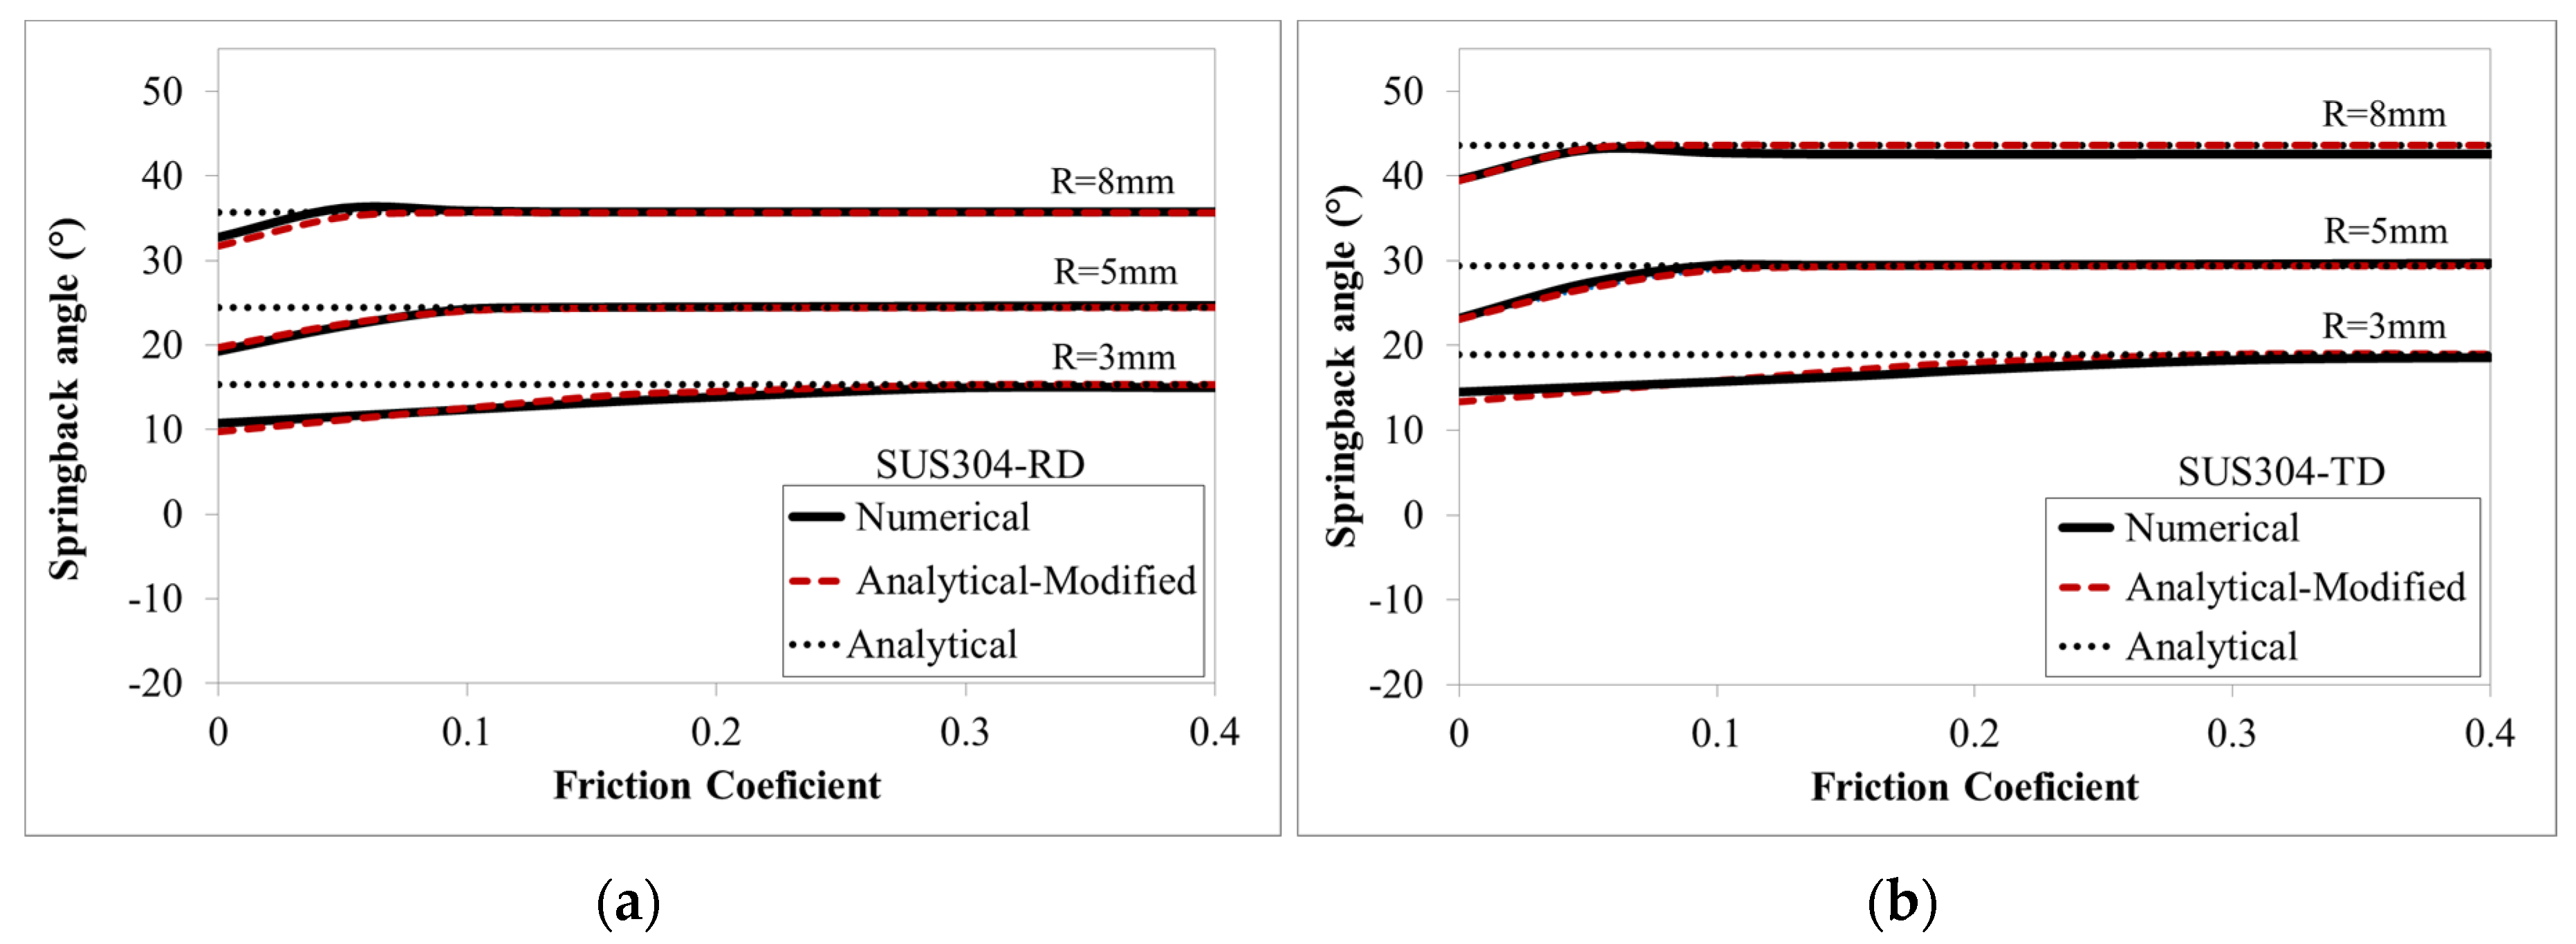
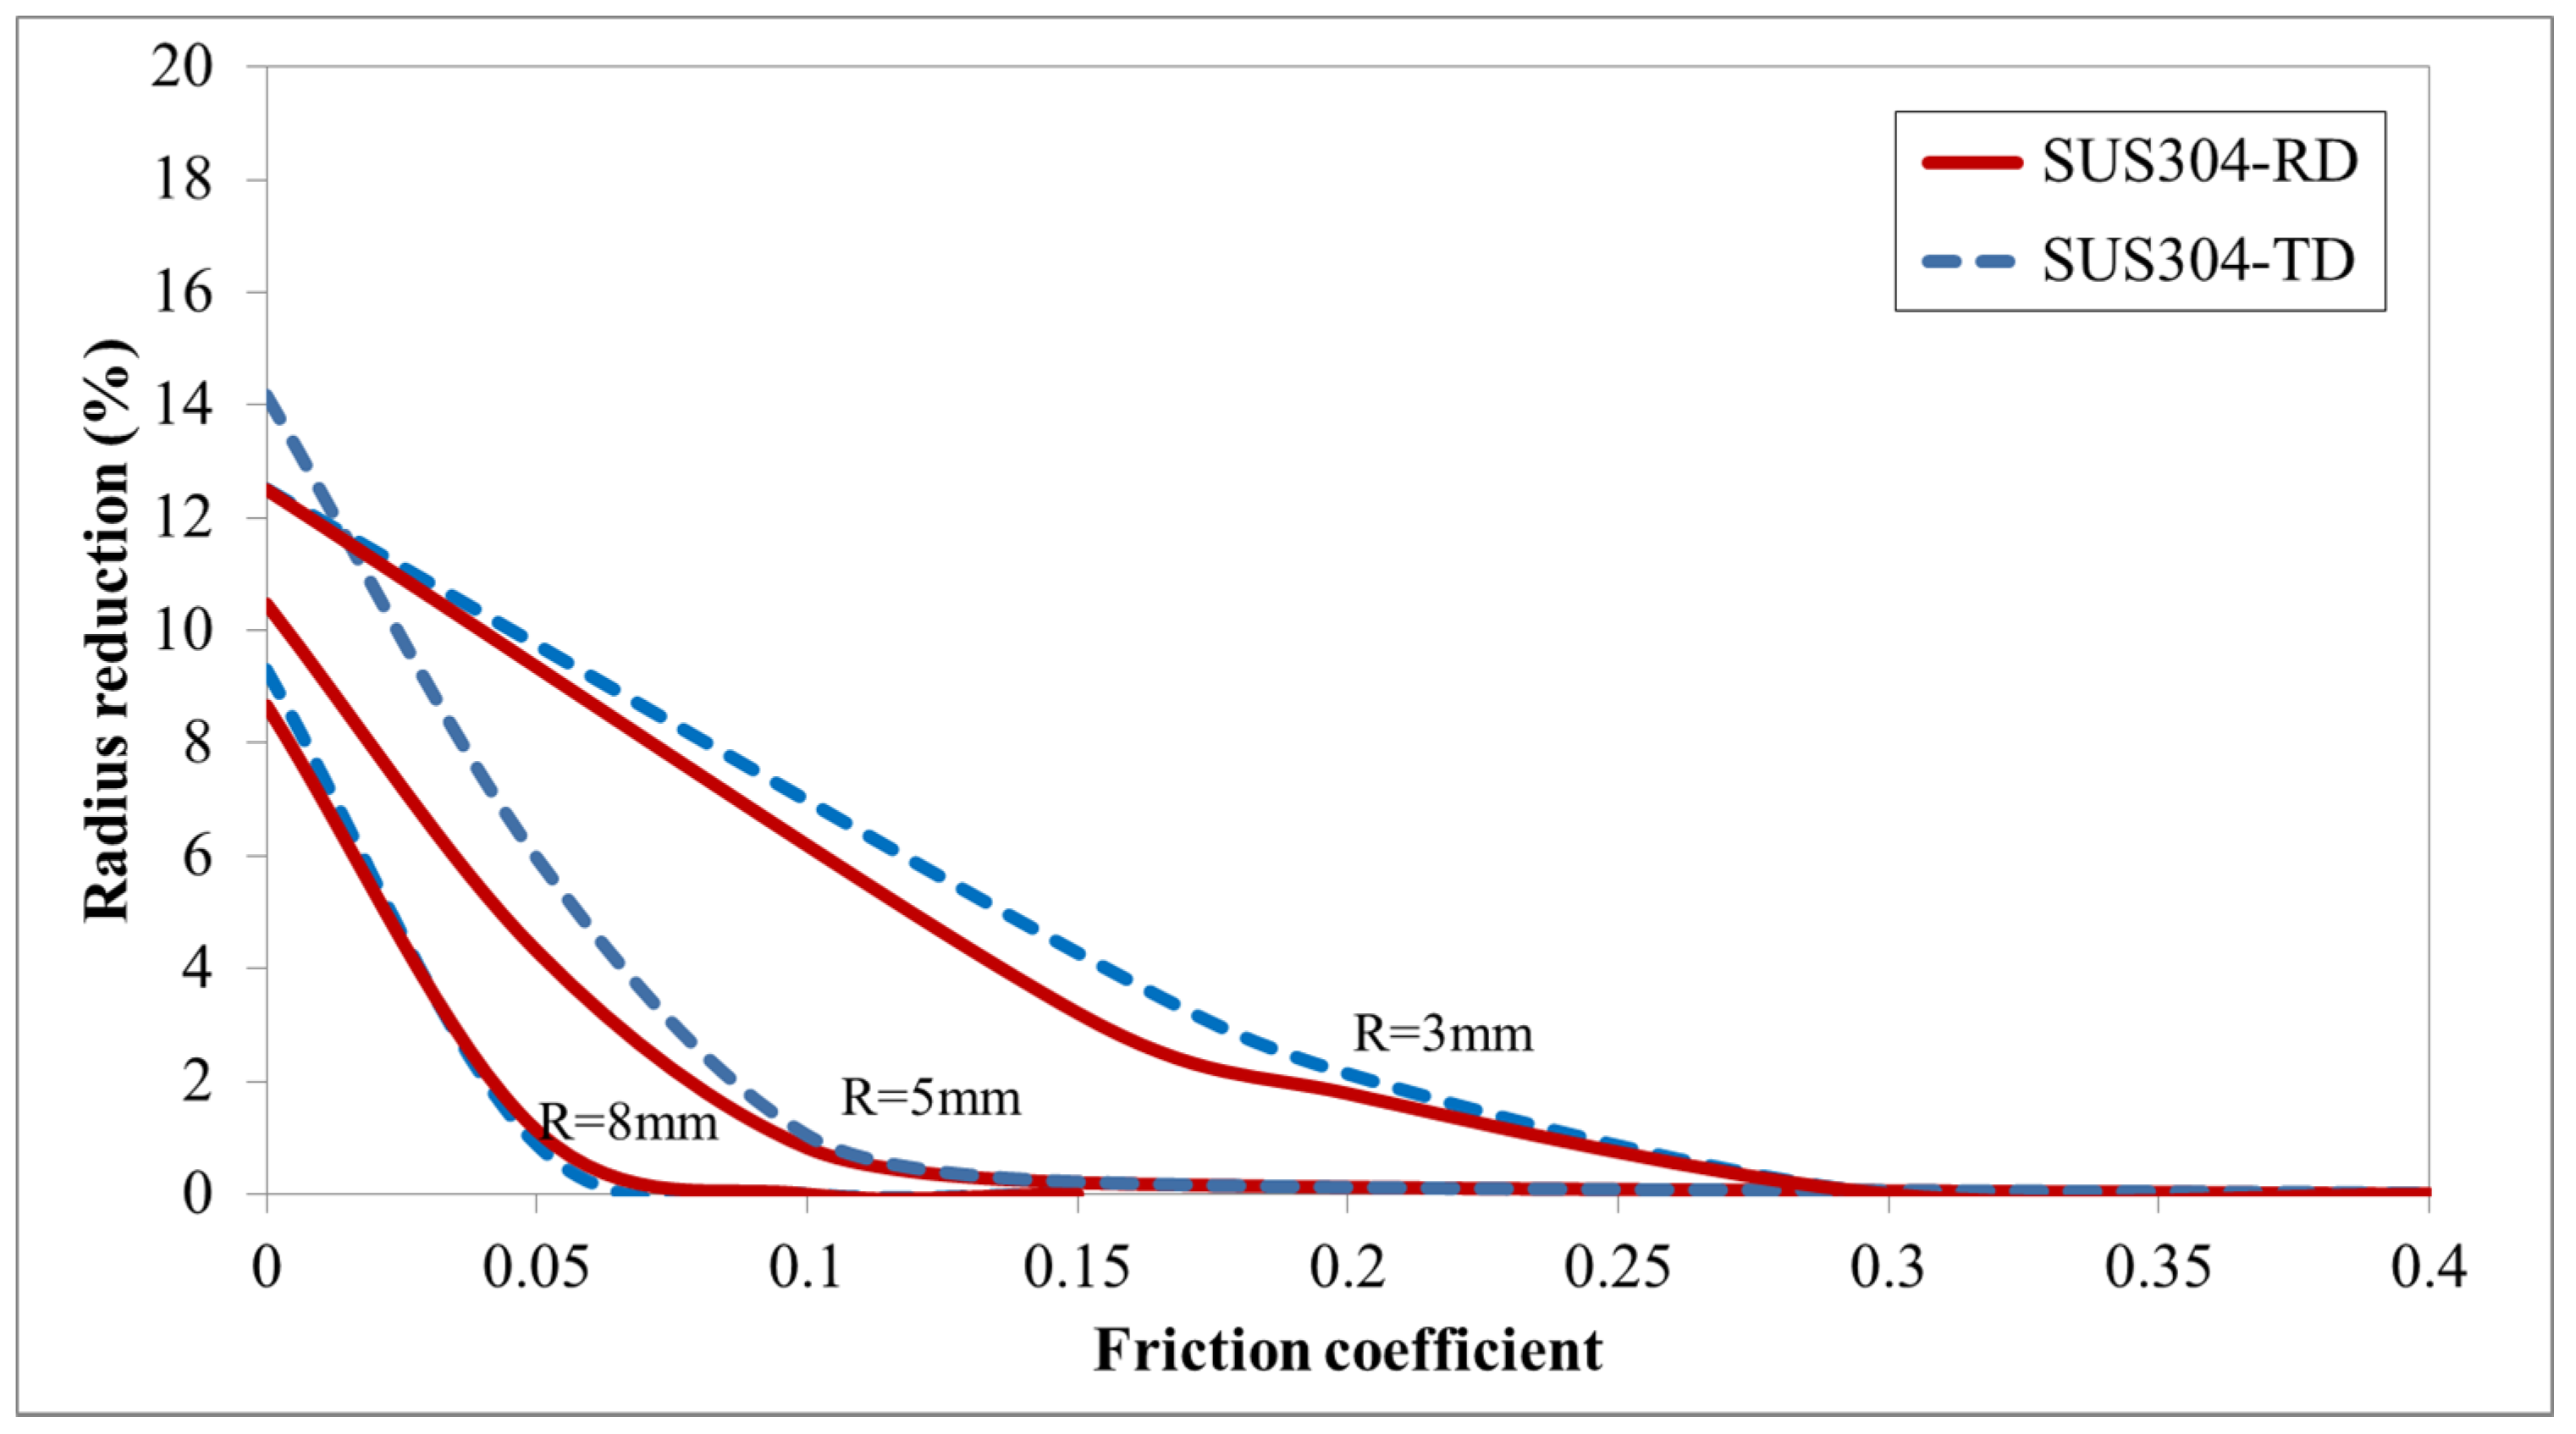
3.5. The Modified Analytical Method for Springback Prediction of SUS304 under V-Bending

In this section, a modified analytical method is developed for springback prediction of V-bending accounting for friction effects, noting that the friction has to be considered in the simulations, but it was always ignored in analytic modelling.
Figure 14 shows the variation of the springback obtained from numerical, analytical and modified analytical models versus the friction coefficient for 3 bending radii of 3, 5 and 8 mm. As it can be seen, for R = 5 mm, the numerical springback values increase by increasing the friction coefficient from 0 to around 0.1. For greater values of the friction coefficient, the springback is approximately constant. It is interesting that as the friction coefficient increases, the numerical values get closer to the analytical values of springback. For example, for the bending radius of 5 mm and the friction coefficients of higher than 0.1, the numerical and analytical springback results are almost the same. This indicates that the springback behaviours in V-bending are sensitive to friction between the sheet and the die for lower friction coefficients. This indicates that the underlying parameter, which causes the difference between the numerical and analytical springback results, is the friction. Therefore, in this section, the analytical model is modified to take the frictional effects into account.
Based on simulation results, it was observed that in the frictionless case, during the bending process, the sheet slipped towards the die and reached the bottom of the die before the bending process ended. This caused the sheet to bend extra at a lower degree (almost 45°) in the middle of the sheet and, consequently, forced it to unbend to the die radius at the end of the bending process. This behaviour causes non-uniform bending in the sheet which consequently reduces the springback. By increasing the friction coefficient, the sheet slip reduces and almost stops for higher friction. Therefore, the radius reduction due to the slip was measured from the simulation results for different friction coefficients. As it can be seen in Figure 15, the radius reduction increases with increasing the coefficient friction and almost reaches zero for higher friction coefficients. This is in line with the variation of springback angle with the friction coefficient which indicates the relationship of radius reduction and springback. The variation of the radius reduction is different for TD and RD bending which shows that the radius reduction is related to material properties. In addition, the radius reduction is related to the bending radius, as it is different for different bending radii. To include the effects of friction in analytical solution, the springback caused by the radius reduction, which is called slip springback in this study, was deducted from the analytical springback results. Therefore, to find the analytical values of springback in the V-bending, the following relationship was defined:
Δ θ V B = Δ θ P B Δ θ S S
where ΔθVB is the V-bending springback, ΔθPB is the pure bending springback and ΔθSS is the slip springback, respectively.
Based on Equation (34), springback values of V-bending in RD and TD for the bending radius of 5 mm were calculated. According to Figure 15, for the bending radius of 5 mm and for friction coefficients higher than 0.1, the radius reduction is zero. Therefore, in this case, the slip springback was zero, and the pure bending and V-bending springbacks were the same. Figure 16 shows the experimental and calculated springback values of V-bending in RD and TD for 16 types of SUS304 with different strengths. The horizontal axis shows the material strength, σ2.9, which is the plastic flow stress when the strain reaches the value of 2.9% in the uniaxial tensile test. In order to estimate the properties of the material with different strengths, the material parameters listed in Table 4 were uniformly changed by keeping the asymmetry ratio constant until the desired strength was reached. While the analytical springback based on tension did not match with the experimental results, the analytical springback considering TCA showed great agreement with the experimental results in both rolling directions. The results based on tension showed a slight difference between springback in RD and TD, since the tensile flow stress was almost the same in both rolling directions. This clearly shows the importance of considering TCA in predicting springback of asymmetric metals.

4. Conclusions

A novel analytic elastic–plastic method based on the Cazacu–Barlat 2004 yield function and isotropic hardening was developed to investigate the bending and springback behaviour of asymmetric materials. Compared to existing methods, the proposed analytical method can be an effective tool to simplify springback prediction of asymmetric sheet metals. This new method can be used for analytic study and numerical analysis by implementing it into the commonly-used commercial finite element analysis package Abaqus/Standard. As a case study, pure bending of stainless steel 304 and DP980 was investigated analytically and numerically. In addition, the V-bending of the stainless steel 304 plates was studied numerically, and the analytical method was modified. The following conclusions can be drawn based on the comparison of the analytical and numerical outputs of the experimental results:
1. The comparison of the analytical and experimental results shows that for pure bending, the new method can successfully capture TCA of the materials with less material parameters;
2. The linear and nonlinear springback of SUS304, determined based on the analytical method, showed great agreement with the experimental results;
3. Implementing the analytical method into the UMAT subroutine, the springback results from the V-bending simulation of SUS304 were a great match with the experimental results. By applying TCA effects in calculations, the relative error was reduced from −7.86% to −2.11% and 23.01% to 4.32% for TD and RD bending, respectively.
4. From simulations, it was observed that, in V-bending of SUS304, the springback increased by increasing the friction coefficient, depending on the bending radius and the material properties. In addition, it was observed that the numerical and analytical springback values were almost the same at higher friction coefficients, and the analytical method can be modified for lower friction coefficients.
5. The modified analytical method can successfully predict the springback behaviours of 16 types of SUS304 in the V-bending process, and the results were consistent the with experimental results.

Author Contributions

Conceptualisation, H.M. and R.Y.; methodology, H.M. and R.Y.; software, H.M.; validation, H.M. and R.Y.; formal analysis, H.M.; investigation, H.M. and R.Y.; resources, R.Y. and B.W.; data curation, H.M. and R.Y.; writing—original draft preparation, H.M.; writing—review and editing, R.Y. and B.W.; visualization, H.M.; supervision, R.Y. and B.W.; project administration, R.Y. and B.W.; funding acquisition, R.Y. and B.W. All authors have read and agreed to the published version of the manuscript.

Funding

The first author was supported by the Postgraduate Scholarship Awards provided by the Western Sydney University, Australia. This research received no external funding.

Acknowledgments

All the co-authors, H.M., R.Y. and B.W., would like to show their gratitude to the School of Engineering, Western Sydney University for the support and assistance with their research activities.

Conflicts of Interest

The authors declare no conflict of interest.

References

  1. Wagoner, R.H.; Lim, H.; Lee, M.-G. Advanced issues in springback. Int. J. Plast. 2013, 45, 3–20. [Google Scholar] [CrossRef]
  2. Lou, X.; Li, M.; Boger, R.; Agnew, S.; Wagoner, R. Hardening evolution of AZ31B Mg sheet. Int. J. Plast. 2007, 23, 44–86. [Google Scholar] [CrossRef]
  3. Kalish, D.; Cohen, M. Anisotropy of properties in martensite as developed by thermomechanical treatments. ASM Trans. Q. 1969, 62, 353–361. [Google Scholar]
  4. Lee, M.-G.; Wagoner, R.; Lee, J.; Chung, K.; Kim, H. Constitutive modeling for anisotropic/asymmetric hardening behavior of magnesium alloy sheets. Int. J. Plast. 2008, 24, 545–582. [Google Scholar] [CrossRef]
  5. Kuwabara, T.; Kumano, Y.; Ziegelheim, J.; Kurosaki, I. Tension–compression asymmetry of phosphor bronze for electronic parts and its effect on bending behavior. Int. J. Plast. 2009, 25, 1759–1776. [Google Scholar] [CrossRef]
  6. Kuwabara, T.; Saito, R.; Hirano, T.; Oohashi, N. Tension-compression asymmetry of SUS304 stainless sheet for electronic parts and its effects on bending and springback behavior. Tetsu Hagane-J. Iron Steel Inst. Jpn. 2009, 95, 732–739. [Google Scholar] [CrossRef] [Green Version]
  7. Maeda, T.; Noma, N.; Kuwabara, T.; Barlat, F.; Korkolis, Y.P. Measurement of the strength differential effect of DP980 steel sheet and experimental validation using pure bending test. J. Mater. Process. Technol. 2018, 256, 247–253. [Google Scholar] [CrossRef]
  8. Lee, M.-G.; Kim, D.; Kim, C.; Wenner, M.; Wagoner, R.; Chung, K. A practical two-surface plasticity model and its application to spring-back prediction. Int. J. Plast. 2007, 23, 1189–1212. [Google Scholar] [CrossRef]
  9. Lee, J.; Kim, S.-J.; Lee, Y.-S.; Lee, J.-Y.; Kim, D.; Lee, M.-G. Distortional hardening concept for modeling anisotropic/asymmetric plastic behavior of AZ31B magnesium alloy sheets. Int. J. Plast. 2017, 94, 74–97. [Google Scholar] [CrossRef]
  10. Muhammad, W.; Mohammadi, M.; Kang, J.; Mishra, R.K.; Inal, K. An elasto-plastic constitutive model for evolving asymmetric/anisotropic hardening behavior of AZ31B and ZEK100 magnesium alloy sheets considering monotonic and reverse loading paths. Int. J. Plast. 2015, 70, 30–59. [Google Scholar] [CrossRef]
  11. Park, N.; Stoughton, T.B.; Yoon, J.W. A criterion for general description of anisotropic hardening considering strength differential effect with non-associated flow rule. Int. J. Plast. 2019, 121, 76–100. [Google Scholar] [CrossRef]
  12. Hosford, W. A generalized isotropic yield criterion. J. Appl. Mech. 1972, 39, 607–609. [Google Scholar] [CrossRef]
  13. Cazacu, O.; Barlat, F. A criterion for description of anisotropy and yield differential effects in pressure-insensitive metals. Int. J. Plast. 2004, 20, 2027–2045. [Google Scholar] [CrossRef]
  14. Drucker, D.C. Relation of experiments to mathematical theories of plasticity. J. Appl. Mech.-Trans. ASME 1949, 16, 349–357. [Google Scholar]
  15. Yoon, J.W.; Lou, Y.; Yoon, J.; Glazoff, M.V. Asymmetric yield function based on the stress invariants for pressure sensitive metals. Int. J. Plast. 2014, 56, 184–202. [Google Scholar] [CrossRef]
  16. Lee, M.; Kim, J.; Chung, K.; Kim, S.; Wagoner, R.; Kim, H. Analytical springback model for lightweight hexagonal close-packed sheet metal. Int. J. Plast. 2009, 25, 399–419. [Google Scholar] [CrossRef]
  17. Kim, J.H.; Lee, M.-G.; Kim, S.-J.; Chung, K.; Wagoner, R.H. Reverse effect of tensile force on sidewall curl for materials with tensile/compressive strength difference. Met. Mater. Int. 2009, 15, 353. [Google Scholar] [CrossRef]
  18. Mehrabi, H.; Yang, C. A theoretical study on pure bending of hexagonal close-packed metal sheet. In AIP Conference Proceedings; AIP Publishing LLC: Melville, NY, USA, 2018; p. 170012. [Google Scholar]
  19. Nguyen, N.-T.; Seo, O.S.; Lee, C.A.; Lee, M.-G.; Kim, J.-H.; Kim, H.Y. Mechanical behavior of AZ31B Mg alloy sheets under monotonic and cyclic loadings at room and moderately elevated temperatures. Materials 2014, 7, 1271–1295. [Google Scholar] [CrossRef] [Green Version]
  20. Kim, H.; Kim, C.; Barlat, F.; Pavlina, E.; Lee, M.-G. Nonlinear elastic behaviors of low and high strength steels in unloading and reloading. Mater. Sci. Eng. A 2013, 562, 161–171. [Google Scholar] [CrossRef]
  21. Sun, L.; Wagoner, R. Complex unloading behavior: Nature of the deformation and its consistent constitutive representation. Int. J. Plast. 2011, 27, 1126–1144. [Google Scholar] [CrossRef]
  22. Lee, J.-Y.; Lee, M.-G.; Barlat, F.; Bae, G. Piecewise linear approximation of nonlinear unloading-reloading behaviors using a multi-surface approach. Int. J. Plast. 2017, 93, 112–136. [Google Scholar] [CrossRef]
  23. Yoshida, F.; Hamasaki, H.; Uemori, T. Modeling of anisotropic hardening of sheet metals including description of the Bauschinger effect. Int. J. Plast. 2015, 75, 170–188. [Google Scholar] [CrossRef]
  24. Pavlina, E.J.; Lee, M.-G.; Barlat, F. Observations on the nonlinear unloading behavior of advanced high strength steels. Metall. Mater. Trans. A 2015, 46, 18–22. [Google Scholar] [CrossRef] [Green Version]
  25. Yoshida, F.; Uemori, T.; Fujiwara, K. Elastic–plastic behavior of steel sheets under in-plane cyclic tension–compression at large strain. Int. J. Plast. 2002, 18, 633–659. [Google Scholar] [CrossRef]
  26. Ortiz, M.; Pinsky, P. Global Analysis Methods for the Solution of Elastoplastic and Viscoplastic Dynamic Problems; Dept. of Civil Engineering, University of California: Berkley, CA, USA, 1981. [Google Scholar]
  27. Matuszak, A. Factors influencing friction in steel sheet forming. J. Mater. Process. Technol. 2000, 106, 250–253. [Google Scholar] [CrossRef]
  28. Trzepieciński, T.; Bazan, A.; Lemu, H. Frictional characteristics of steel sheets used in automotive industry. Int. J. Automot. Technol. 2015, 16, 849–863. [Google Scholar] [CrossRef]
  29. Ramezani, M.; Ripin, Z.M.; Ahmad, R. Modelling of kinetic friction in V-bending of ultra-high-strength steel sheets. Int. J. Adv. Manuf. Technol. 2010, 46, 101–110. [Google Scholar] [CrossRef]
Figure 1. Schematic diagram of stress distributions with the curvature through the sheet thickness.
Applsci 10 03339 g001
Figure 2. Curvature change of the moment–curvature diagram during elastic unloading.
Applsci 10 03339 g002
Figure 3. Variation of effective elastic modulus versus plastic strain.
Applsci 10 03339 g003
Figure 4. Experimental and fitted true stress and strain in tension and compression of DP980 steel in the (a) rolling direction and (b) transverse direction.
Applsci 10 03339 g004
Figure 5. Comparisons of bending moment–curvature diagrams of DP980 under pure bending in the (a) rolling direction and (b) transverse direction.
Applsci 10 03339 g005
Figure 6. Experimental and fitted true stress and strain in tension and compression in the (a) rolling direction and (b) transverse direction.
Applsci 10 03339 g006
Figure 7. Comparison of bending moment–curvature diagrams for pure bending in the (a) rolling direction and (b) transverse direction.
Applsci 10 03339 g007
Figure 8. Variation of the neutral surface shift from the midplane versus curvature.
Applsci 10 03339 g008
Figure 9. Comparison of the analytical and experimental bending moment–curvature diagram and nonlinear unloading in the (a) rolling direction and (b) transverse direction.
Applsci 10 03339 g009
Figure 10. Finite element modelling of the pure bending of the metal sheet sample.
Applsci 10 03339 g010
Figure 11. Comparisons of numerical and analytical bending moment–curvature diagrams: (a) SUS304; (b) DP980.
Applsci 10 03339 g011
Figure 12. Finite element simulation of the V-bending: (a) before bending, (b) bending and (c) springback.
Applsci 10 03339 g012
Figure 13. Comparison of experimental and numerical springback in V-bending.
Applsci 10 03339 g013
Figure 14. Springback relationship with the friction coefficient for different bending in the (a) rolling direction and (b) transverse direction.
Applsci 10 03339 g014
Figure 15. Variation of radius reduction versus friction coefficient.
Applsci 10 03339 g015
Figure 16. Comparisons of experimental and analytical springback in V-bending for SUS304 with different material strengths.
Applsci 10 03339 g016
Table 1. Material parameters in uniaxial conditions.
MaterialLoading DirectionTensile Yield Point, σtCompressive Yield Point, σcc γ t γ c
DP980RD675710−0.1961−1.052
TD706738−0.1721−1.045
SUS304RD3352600.9421−0.776
TD360390−0.3101−1.083
Table 2. Measured coefficients of variable elastic modulus.
MaterialEaT (GPa)EaC (GPa)ξTξC
SUS304148133.860.7675.74
Table 3. Material parameters of DP980 sheets used in the analytical and numerical methods.
Loading DirectionTensile Young’s Modulus, E (GPa)Tensile Yield Point, σtCompressive Yield Point, σcK (MPa)ε0n
RD186,00067571015300.00010.139
TD208,00070673815630.00020.133
Table 4. Material parameters used in the analytical method.
Loading DirectionTensile Young’s Modulus, E (GPa)Tensile Yield Point, σtCompressive Yield Point, σcB (MPa)C
RD185335260680300
TD198360390690300

