Abstract
A portable instrumental system was designed for the routine environmental monitoring of toxic volatile organic compounds (VOCs) in atmospheric conditions based on changes in the photoluminescence emission of semiconductor nanoparticles (quantum dots) entrapped in a sol-gel matrix as the solid sensing material. The sol-gel sensing material displayed a long-lived phosphorescent emission, which is quenched in the presence of trace levels of a volatile organic compound (acetone) in gaseous atmospheres. The developed instrument could measure and process the changes in the photoluminescence of the sensing material after exposure to gaseous acetone. The developed prototype device consists of a deep-ultraviolet ligtht-emitting diode (UV LED), which excites the chemical sensing material; an optical filter to remove scattered light and other non-desirable wavelengths; a photomultiplier tube (PMT) to convert the phosphorescence emission of the sensor phase to an electrical signal; and a microcontroller to correlate the signal with the analyte concentration. The developed prototype was evaluated for its ability to measure low levels of gaseous acetone in contaminated atmospheres with high sensitivity (detection limit: 9 ppm). The obtained results show the feasibility of this type of instrument for environmental analytical control purposes.
1. Introduction
Environmental analytical control requires the development of appropriate sensors that can perform rapid and reliable detection and identification of environmentally relevant chemical species. Among the wide variety of contaminants, the control of high-vapor-pressure toxic species in the form of volatile organic compounds (VOCs) is very important in occupational safety and health control (e.g., in workplace atmospheres) because they can produce harmful effects on human health.
In this vein, acetone is an organic chemical compound found naturally in the environment, and due to its many versatile applications, is mass-produced in the industry. It is extensively used in laboratories and industrial applications. These industries include paint, plastic, artificial fiber, and shoe factories. Acetone is a volatile organic compound that evaporates quickly, remaining in the atmosphere for 15 to 60 days [1]. People working in industries that process and use acetone can be exposed to higher levels of this organic compound. While acetone levels below 100 ppm in air produce no effect, levels ranging between 200 and 500 ppm irritate the respiratory system, with 500 ppm being the maximum recommended 8 h occupational exposure level. Concentrations above these levels can produce different symptoms, including light-headedness, confusion, dizziness, and at high enough levels, could cause loss of consciousness [2].
It is therefore of utmost importance to have instruments that can continuously and accurately monitor the concentration levels of acetone present in gaseous media for safety purposes. The Occupational Safety and Health Administration (OSHA) provides a methodology for acetone quantification based on gas chromatography–flame ionization detection (GC–FID) [3], which is unsuitable for fast, in situ, and continuous measurements, just like the other most common techniques for acetone detection in the gas phase, which are based on mass spectrometry and gas chromatography. Frequently, such methods require complex and long-lasting sample pre-treatment steps.
Compared with those traditional analytical methodologies, gas sensors have been acknowledged as simple and inexpensive tools for the detection and quantification of environmental toxins. Gas sensors are devices that are composed of active sensing materials coupled with a signal transducer. The selection and development of a potential sensing material that can be implemented in a low-cost, simple, and effective portable device for on-site and real-time analysis play an important role in designing high-performance gas sensors. Additionally, the measured signal is a key factor in the development of the prototype. In this sense, photoluminescence gas sensing approaches for the detection of organic molecules have demonstrated excellent performance for gas analysis [4].
In this context, improvements in nanotechnology have allowed for the development of nanomaterials with novel and improved optoelectronic properties. This strategy has allowed for replacing conventional organic phosphors and fluorophores with alternative advantageous luminescent nanomaterials, such as quantum dots (QDs), which have recently demonstrated their high potential in the development of novel luminescent bioanalytical methodologies [5].
QDs are semiconductor inorganic nanoparticles with diameters between 2 and 10 nm that have remarkable optical properties due to the quantum confinement effect that appears when the particles are smaller than their exciton Bohr radius [6,7]. This is usually translated into high luminescence quantum yields, narrow photoluminescence emission, wide absorption spectra, and low photobleaching [8]. QDs’ luminescence is strongly related to their surface state such that physicochemical interactions with other chemical species produce changes in the luminescent output. Using this property as the basis, many novel sensing approaches for the direct analysis of small molecules and ions have been developed. Additionally, incorporating certain metal impurities during the synthesis makes it possible to obtain phosphorescent luminescence instead of the more common fluorescence [9]. Perhaps the most significant advantage of phosphorescent QDs over traditional phosphors is that since the excited states involved are different, QD-phosphorescence is not affected by the same parameters that affect conventional organic phosphorescent molecules, such as the presence of oxygen or heavy atoms and the necessity of a rigid environment.
An example of such phosphorescent QDs is Mn2+-doped ZnS QDs. Compared to traditional QDs (like ZnS or CdSe), the Mn-doped QDs present a larger Stokes shift between the excitation and emission wavelengths and longer luminescent lifetimes in the order of milliseconds, both of which are characteristic of phosphorescent emission. Being able to discriminate between the background fluorescence of the sample and the phosphorescence emitted by the QDs is of great interest for sensing. Mn:ZnS QDs have previously been used for acetone detection in liquid samples [10] in the laboratory by measuring the quenching of the room temperature phosphorescence (RTP) emission of such QDs after direct interaction with the analyte.
Nevertheless, it is necessary that these chemical sensing materials “leave the laboratory” and can be used to solve everyday problems. For this purpose, they must be easily incorporated into portable and easy-to-use instrumentation systems. The main desired requirements for the development of an instrumentation prototype include portability, low cost, minimal interference by ambient light, high sensitivity, and easy to be used by a non-specialized user. In this context, several interesting developments of portable fluorimeters have been reported for the detection of cyanobacteria [11], pH measurements of environmental water [12], fast ultra-trace detection of explosive vapors [13], chlorophyll analysis in marine environments [14], and rapid screening of aflatoxin M1 [15] and Escherichia coli in drinking water [16].
In this work, we successfully incorporated phosphorescence-emitting Mn2+-doped ZnS QDs into a sol-gel solid matrix for the development of an acetone gaseous sensing phase based on the quenching effect that acetone has on their luminescence. The sol-gel sensing phase was then coupled to a luminescent portable device designed with a deep-UV LED as an excitation source and a photomultiplier module working as a light detector. The combination of the sol-gel immobilized QDs with the portable luminescent device allowed for the development of an affordable portable instrumental system for the determination of trace levels of acetone in gaseous samples.
2. Materials and Methods
2.1. Materials and Reagents
All chemical reagents were of analytical grade and were used as received with no further purification. 2-Propanol, L-cysteine hydrochloride, manganese chloride tetrahydrate, methanol, N-ethyl-N-(3-dimethylaminopropyl) carbodiimide hydrochloride (EDC), sodium hydroxide, sodium sulphide nonahydrate, and zinc sulphate heptahydrate were purchased from Sigma-Aldrich (part of Merck KGaA, Darmstadt, Germany). HPLC-gradient grade acetone, ethanol, and methanol were purchased from Prolabo (part of Avantor, Center Valley, PA, USA). The sol-gel precursors 3-aminopropyltrietoxysilane (APTES) and tetramethoxysilane (TMOS) were obtained from Fluka (part of Merck KGaA, Darmstadt, Germany).
2.2. Synthesis of Mn2+-Doped ZnS Quantum Dots Entrapped in a Sol-Gel Matrix
Water-soluble Mn2+-doped ZnS quantum dots were synthesized in our laboratory following a synthetic route previously described by Sotelo-Gonzalez et al. [17]. In short, 50 mL of 0.02 M L-cysteine, 5 mL of 0.1 M ZnSO4, and 0.15 mL of 0.1 M MnCl2 were mixed in a beaker, adjusting the pH to 11 with 1 M NaOH. This mixture was then placed in a three-necked flask under stirring, deoxygenated with argon for 30 min, and 5 mL of 0.1 M Na2S was added to allow for nucleation of the nanoparticles. After 20 min, the solution was aged under an air atmosphere at 50 °C for 2 h to improve the crystallinity. To purify the obtained nanoparticles, they were precipitated with ethanol via centrifuging for 5 min at 5000 rpm. The QDs were then dried under vacuum and stored under an argon atmosphere as a water-soluble brown powder.
After that, the obtained quantum dots were immobilized in a sol-gel matrix by adding them during the polymerization process [18]. For this purpose, 1 mL of Mn:ZnS QDs dissolved in a phosphate buffer at pH 7.4 was mixed with 2.5 mL ethanol in a small Teflon cup under constant stirring. Then, the reagents for the formation of a sol-gel were added: 750 µL APTES, followed by 100 µL EDC, 50 µL 1 M NaOH, and finally, 750 µL TMOS. APTES and TMOS were the necessary reagents to form the sol-gel structure, NaOH was employed as the catalyst, and EDC was employed to covalently bond the amino groups of the surface ligands of the QDs to the polymer structure. Once the polymerization process had taken place, the mixture was left to dry at 40 °C for two weeks.
The obtained dry gel was ground using an agate mortar and the particles generated were separated by particle size using 80, 120, 200, and 300 µm sieves. The 120 µm fraction was selected for further experiments as a compromise: small particle sizes provide a more intense signal but requires higher pressures. The bigger particle sizes provide the better pressure stability although lower signal.
2.3. Optical Characterization of the Sensing Phase
The photoluminescent properties of the sensing phase were studied using a Cary Eclipse Fluorescence Spectrophotometer (Varian Iberica, Madrid, Spain, now part of Agilent Technologies, Santa Clara, CA, USA), equipped with a xenon discharge lamp. To characterize the photoluminescent properties (excitation and emission spectra) of the sensing material, the 120 µm sol-gel powder was directly packed into a conventional Hellma luminescence flow-through cell made of quartz (Model 176.052-QS, Mullheim, Germany) with a 1.5 mm light path.
The phosphorescence spectra and decay curves of the Mn2+-doped ZnS QDs entrapped in the sol-gel were recorded upon excitation at 290 nm using RTP conditions with a delay time of 0.1 ms, a gate time of 2 ms, and slit widths set at 10 nm.
Figure 1a shows that upon excitation at 290 nm, there was an intense emission band centered at 590 nm. Figure 1b displays the decay curves of phosphorescence emission of the sol-gel immobilized doped QDs. Data were fitted between 0.10 and 10 ms to a double-exponential fitting. A short-lifetime component of 0.58 ms and a long-lifetime component of 2.65 ms were observed. Figure 1c shows a TEM image of the QDs to illustrate the size and homogeneity.
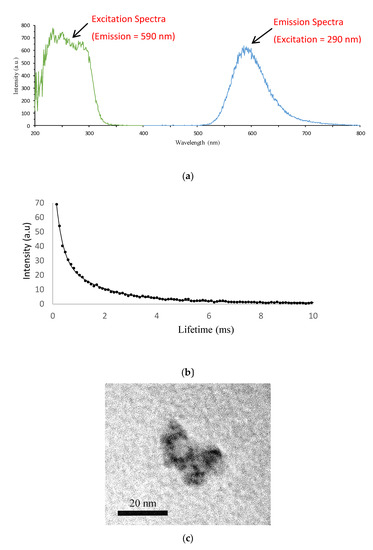
Figure 1.
(a) Excitation and emission spectra of colloidal Mn:ZnS QDs entrapped in the sol-gel. (b) The phosphorescence decay curve of the QDs entrapped in the sol-gel. (c) TEM image of the Mn:ZnS QDs in a PBS buffer.
2.4. Design of the Sensing System Prototype
The development of a portable instrument that is compatible with the sensing phase based on nanomaterials permits bringing this affordable and simple technology to applications that previously required high-cost laboratory instruments. Currently, this is possible thanks to integrated electronic devices that offer high performance on a small scale. Figure 2 shows a block diagram of the proposed system. Briefly, a light source excites the optical sensor inside the flow cell. The light detector is responsible for converting the light emitted by the sensor, which is dependent on the analyte, into an electrical signal.
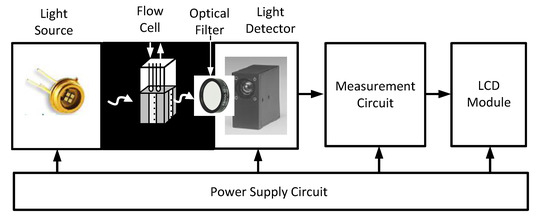
Figure 2.
Block diagram of the proposed instrument system.
2.4.1. Optical Subsystem
In a portable instrument, the focus is on light sources based on semiconductor devices, such as LEDs, and lasers. Currently, advances in nanotechnology have enabled the manufacture of LEDs emitting in the far UV, which was unthinkable until a few years ago. The optical features of the LED must fit the spectral characteristics of the sensing phase shown in Figure 3. A high-intensity blue emission LED (UVTOP275-FW-TO39, Roithner LaserTechnik GmbH, Vienna, Austria) was chosen. It has an emission peak centered at 275 nm, which perfectly matches the band of excitation of the Mn:ZnS QDs. However, due to the novelty of this type of LED, it presents some problems that consist mainly in the form of parasite emissions [19,20]. For this reason, it is necessary to use an optical filter since these parasite emissions match the emission spectrum of the sensing material. Hence, to reduce these interferences, a bandpass filter centered around 550 nm was used. This filter was set on the photomultiplier tube’s (PMT) window. The light detection can be made using a PMT, avalanche photodiodes (APDs), or a Si PIN photodiode. In applications where there is a weak signal, a PMT is the best option [21]. APDs also have the advantage of having a high gain, but being semiconductors, their signal-to-noise ratio is low and highly temperature-dependent. In fact, in previous studies, both options had been evaluated, but it was concluded that to be able to use APD detectors, it must be cooled with a Peltier cell, resulting in a more complex and expensive device [22,23].
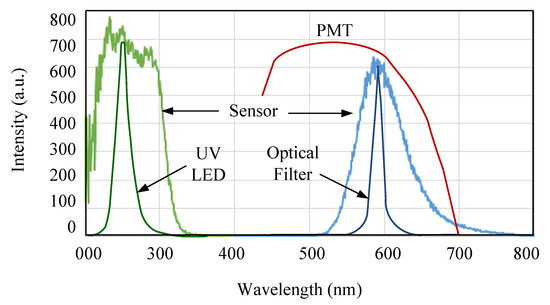
Figure 3.
Spectral response of the chemical sensor, LED, optical filter, and photomultiplier tube (PMT).
Because the QDs have an emission peak centered at 590 nm, the spectral response of the PMT must include this wavelength within the bandwidth. PMTs are very sensitive in that range of the spectrum and can provide a great amplification that retains an excellent signal-to-noise ratio. They provide an output signal in the form of a current that is proportional to the intensity of the incident light. In this work, a H7827-001 photosensor module (Hamamatsu Photonics, Hamamatsu, Japan) was selected. This module incorporates a 19 mm (3/4") diameter head-on PMT tube, a high-voltage power supply circuit, and a low-noise current-to-voltage amplifier. This module has a higher resistance to vibration and shock, making it suitable for portable measurement equipment. This high level of integration simplifies the design and minimizes the electric noise, though it increases the price of the instrument. The spectral response of this photosensor module ranges from 300 nm to 650 nm, its gain can vary between 103 and 107, and uses a digital potentiometer (10 kΩ) that is adjusted via the touch screen liquid-crystal display (LCD). To achieve good sensitivity, the PMT gain must be chosen to be as large as possible but ensuring the output voltage of the PMT is not saturated.
The flow cell that houses the sol-gel sensing material was constructed to avoid the influence of ambient light. However, considering the high sensitivity of the system to light, to ensure an accurate quantitative measurement, it is highly recommended that the system is calibrated every time a measurement is made. The use of a microcontroller device will allow this calibration to be performed automatically, as discussed in the next subsection.
2.4.2. Electronic Subsystem
The electronic subsystem consisted of the measurement circuit, power supply circuit, and the touchscreen display. The measurement circuit consisted of an instrumental amplifier (IA), a microcontroller device (µC), a low-pass filter (LPF), and a digital-to-analog converter (DAC). Figure 4 shows the block diagram of the measuring circuit.
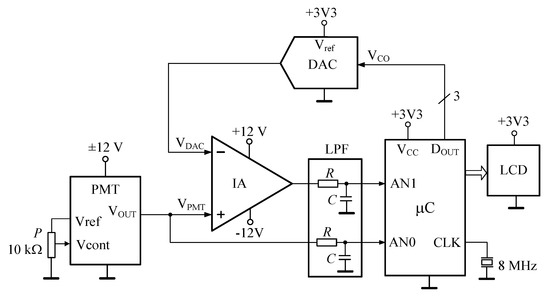
Figure 4.
Simplified electronic schematic of the fluorimeter circuit (IA—instrumental amplifier, PMT—photomultiplier, DAC—digital to analog converter, LPF—low-pass filter, µC—microcontroller, LCD—liquid crystal display, P—potentiometer).
The PMT operates with a high gain; therefore, any small change in the measurement setup due to environmental light, cuvette movement, aging of the LED, etc., can be a source of error. To minimize these issues, a calibration must be done for each measurement. The basic idea of the calibration procedure is to measure without the presence of the analyte (it is called "blank") and saving the value. Then, measuring the presence of the analyte and subtracting the blank value. This calibration procedure was implemented into the hardware with two sequential steps:
- (1)
- Measure without the sol-gel sensing material (i.e., without the photoluminescence emitter in the light path). In this step, the IA is the difference between the output voltage of the PMT (VPMT) and the output voltage of the DAC. This last voltage corresponds also to VPMT and has been converted to digital in the analog-to-digital converter (ADC) of the microcontroller (input AN1). In these conditions, the output of the IA should be approximately zero volts.
- (2)
- Measure with the sol-gel sensing material (i.e., with photoluminescence emitter in the light path). In this step, the IA is also the difference between VPMT and the DAC output, which is the PMT output voltage without the analyte. In this way, the voltage at the output of the IA is due only to the phosphorescence of the sensor. This signal is passed through an RC low-pass filter to avoid the aliasing phenomena when the signal is sampled by the microcontroller (input AN0).
The instrument is powered from the mains through an AC/DC converter of +9 V. Alternatively, a pack of +9 V/2000 mAh Li-ion batteries can be used for in-field applications. To recharge the batteries, an inexpensive current source was implemented around the LM317 adjustable regulator. Two DC/DC converters were used to obtain +3.3 V (JCA0305S03) to power the microcontroller and ±12 V (JCA0205D02) to power the IA and the PMT module. The main consumptions are the PMT module (max. 50 mA), the LCD module (max. 45 mA), and the UV LED (max. 80 mA). This consumption permits working with the instrument for at least two hours. The display was a 3.5” LCD module (MTF-TQ35SP811-AV) from Microtips Technology Inc. (Orlando, FL, USA).
Figure 5 shows the flowchart of the microcontroller firmware and the user interface screens. The microcontroller was programmed in the C language. First, the microcontroller and the touch screen are initialized. Second, the values of the DAC and the digital potentiometer are loaded from the microcontroller. Then, the calibration screen is shown, to measure the “blank.” The ADC reads the blank 10 times, obtains the average value, and stores this value as the zero value. Next, the instrument is ready to measure the analyte and the measurement screen is shown. The ADC also reads the analyte 10 times and the average value is obtained and subtracted from the value of the “blank”. This value is converted into a concentration using the calibration curve and shown on the final screen. It is necessary to calibrate the instrument with each measurement by following the above procedure. The settings screen is accessed by pressing the battery symbol placed at the lower-right corner of the display. It is possible to change the voltage to control the gain of the PMT. Figure 6 shows a view of the instrument prototype.
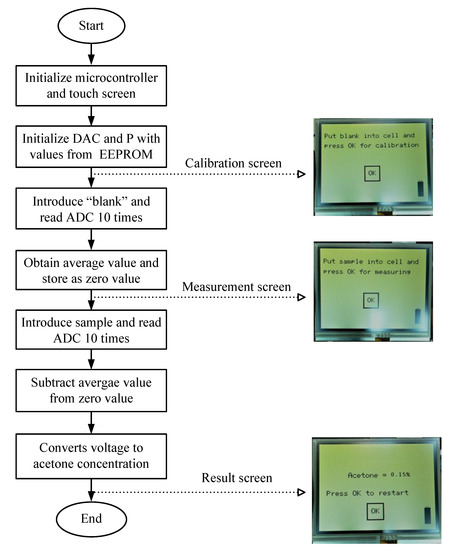
Figure 5.
Microcontroller flowchart and the user interface screens (ADC: analog-to-digital coverter, DAC: digital-to-analog converter, EEPROM: Electrically Erasable Programmable Read-Only Memory; P: Potentiometer).
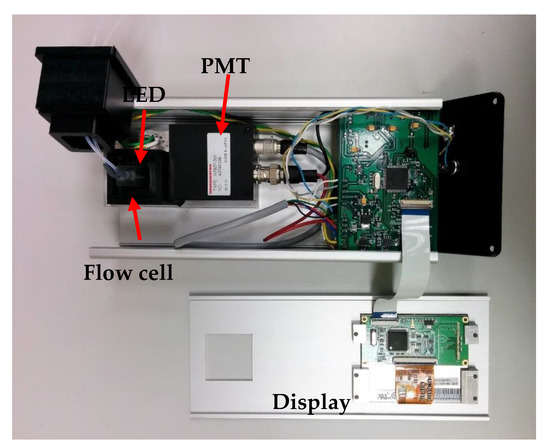
Figure 6.
Image of the portable prototype of the instrument designed for photoluminescence measurements.
3. Results
The luminescent characterization of the sol-gel doped with Mn:ZnS QDs showed that when measuring the photoluminescence under typical phosphorescence conditions, no residual fluorescence at 420 nm was observed (characteristic of ZnS QDs), even though fluorescence is typically a form of emission with much higher quantum yields. This fact confirmed the efficient doping of the ZnS QDs with Mn and the preferable emission of the nanoparticles synthesized as strong phosphorescence-type photoluminescence (emission signal). It is worth noting that one of the main advantages of using this sensing phase from the instrumental point of view is the large separation between the excitation light (centered at 290 nm) and the phosphorescent emission light (centered at 590 nm), as well as the long triplet lifetimes of the phosphorescence emission. Both features allow for using simple optoelectronic components and simplifying the design and construction of the optical system of an instrumental measurement prototype that is compatible with this sensing phase.
To characterize the instrument’s analytical performance, the workbench in Figure 7 was used. An air carrier gas flow was held constant throughout the process using a rotameter. A three-way exponential dilutor was used to introduce gaseous acetone to the system at controlled concentrations. It consisted of a 500 mL glass vessel with an entrance sealed with a septum, through which the sample was introduced (acetone standard) using a syringe of liquid (SGE Syringe, 1 μL, accuracy and reproducibility ± 1%, Supelco Inc, Sigma-Aldrich, St. Louis, Missouri); the other two entrances were closed with two three-way stopcocks. Variable volumes of an analyte standard were introduced in the exponential dilution chamber (through a septum using a 1 μL syringe) to give the required analyte concentration in the 500 mL vessel. The exponential dilutor had two three-way stopcocks that allowed for the synthetic air carrier gas to pass directly through the sensing phase packed inside the flow cell (valve position A in Figure 7) or to go through the vessel, dragging the sample to the sensing phase (valve position B in Figure 7). The system also incorporated blanket heating to heat the exponential dilutor system when it was necessary to maintain the gaseous state sample and a magnetic stirrer (Agimatic, Selecta, Barcelona, Spain) for mixing the gas contained inside the flask. The tubing employed between the flask and the flow-through cuvette was arranged to be as short as possible and was made of Viton® material to minimize unspecific adsorptions of acetone vapor.
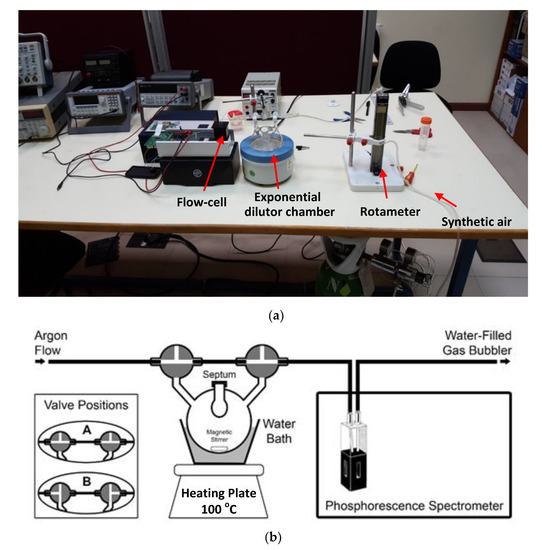
Figure 7.
Experimental setup used to characterize the analytical performance of the phosphorimeter. (a) Picture of the assembled instrumental prototype showing the system used to generate air samples with known acetone concentrations. (b) Diagram of the exponential dilutor chamber.
Different concentrations of gas-phase acetone were prepared by injecting a known amount of pure liquid acetone into the heated exponential dilutor flask using a Hamilton syringe. After the acetone was completely evaporated, a synthetic air gas flow was let into the flask to carry the known acetone concentration to the sensing phase. The initial analyte concentration C0 in the vessel was continuously diluted according to the formula C(t) = C0exp(–Ft/V), where C(t) is the concentration in the vessel at a time t, F is the carrier gas flow rate, t is the time spent after the stopcock was turned, and V is the volume of the vessel. Using this equation, we calculated the concentration of the analyte in the gas stream as a function of the elapsed time [24].
The quenching of the photoluminescence emission of the sol-gel sensing material, produced after passing the gas with a known acetone concentration through the flow-cell, was continuously monitored. Data obtained in the test were processed in the computer to obtain the calibration curve of the instrument, which was then implemented in the microcontroller. Using the exponential dilution system, the calibration curve was obtained by preparing air gas streams containing various concentrations of acetone that passed through the flow-cell containing the sol-gel sensing material, and the luminescent behavior was collected with the aid of the equipment and a software application made in National Instruments LabVIEW 2015. The quencher (acetone) concentration can be directly related to the luminescence intensity using the well-known Stern–Volmer equation:
where I0 is the phosphorescence intensity of the luminescence of the QDs in the absence of the quencher, Ksv is the Stern–Volmer constant, [Q] is the analyte concentration in the gas stream, and I is the phosphorescence intensity in presence of the quencher.
Figure 8a shows the phosphorescent response of the sensing phase to increasing the acetone concentrations in the air gas flow. This figure was obtained at the output of the PMT. The optimal synthetic air gas flow, providing a higher quenching effect for a given acetone concentration, was found to be 250 mL min−1. At higher flow rates, the shorter interaction time between the passing acetone and the sol-gel sensor prevented an adequate quenching effect from taking place. As can be seen, the presence of acetone into the air stream interacted with the sensor by quenching or deactivating the signal emitted by the sensor material. This behavior is common in turn-off luminescent sensors that generate their maximum signal in the absence of analyte and the presence of contaminant causes deactivation of that signal. As can be seen, this is a reversible sensor system. The luminescence signal completely recovered to its initial value when the influence of the contaminant disappeared. This property is of great interest in portable applications since it is not necessary to change the sensing phase between analyses and continuous analyte monitoring can be performed. The dependence of the measured phosphorescent intensity signal with increasing concentrations of acetone was fitted to a Stern–Volmer equation (see Figure 8b), which describes the change in photoluminescence emission as a function of the added quencher. For this purpose, (Io/I) was plotted versus the acetone concentration, where Io is the phosphorescent emission of the sol-gel sensing material exposed to an airflow containing acetone and I is the phosphorescent emission of Mn:ZnS QDs in the presence of increasing concentrations of acetone. The response times, which were the result of the on–off cycling of 157 ppm acetone in gas media over the sensing phase, were found to be < 3 min (see Figure 9). As can be seen, after a fast decrease of the phosphorescence signal once the gaseous acetone arrived in the sensing phase, there was a small drift of the signal that was most probably caused by signal stabilization and kinetics of the interaction between acetone and the sol-gel doped with the QDs, as well as the beginning of the recovery of the signal as the acetone concentration in the airflow started to decrease according to an exponential dilution curve. Once the acetone concentration in the airstream was reduced, the phosphorescence signal completely recovered to the original one.
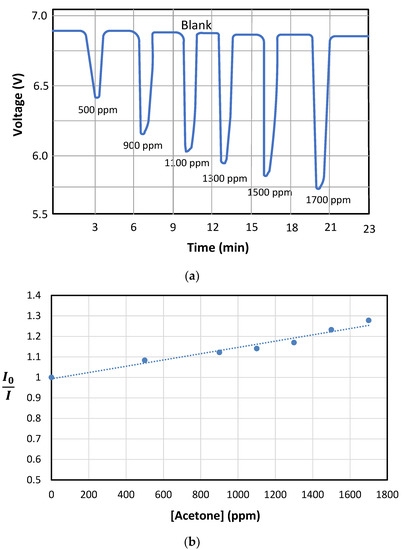
Figure 8.
(a) The phosphorescent response of the sensing phase to increases in acetone concentrations in the gas flow. (b) Calibration curve using the Stern–Volmer equation, which typically governs photoluminescence quenching processes.
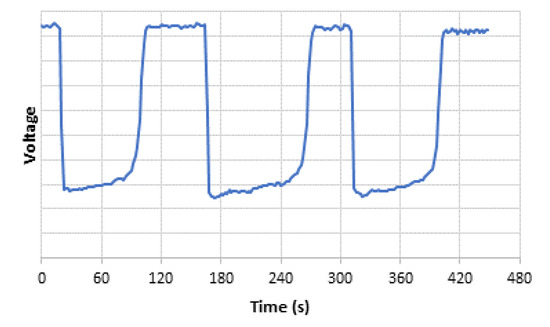
Figure 9.
Quenching effect of acetone (three injections of 157 ppm acetone).
The detection limit of the sensing system, calculated as the acetone concentration that produced an analytical signal three times the standard deviation of the RTP intensity in pure air, was 9 ppm of acetone in air. This value is competitive with those obtained by other reported portable acetone sensing devices, as summarized in Table 1.

Table 1.
Comparison of the detection limits for acetone quantification obtained using the developed sensor with other reported portable acetone sensing devices.
The precision was evaluated in terms of repeatability (n = 4). The RSD values on the blank and samples were below 3% in all cases for the analysis of a gaseous sample containing 157 ppm of acetone. A linear response was found up to 1700 ppm (maximum concentration assayed; see Figure 8b).
The emission stability was evaluated both temporally and by studying the effect of variations on the humidity and temperature of the air stream on the phosphorescence emission under different conditions: dry air flux, humid air flux, hot air flux, and cold air flux. “Dry air flux” refers to the air stream coming directly from the compressed-air cylinders (purity > 99.999%), in which the H2O content is negligible (and is therefore considered to have a 0% relative humidity content). “Humid air flux” refers to air bubbled through a bubble gas humidifier three-quarters filled with water (which is widely assumed to result in a 100% relative humidity content due to the equilibrium present between water and gas in the top part of the bubbler). “Cold air flux” refers to room-temperature readings at 20 °C. “Hot air flux” refers to a system in which the tube used to circulate the air stream is heated using flexible heating blankets to ensure an air temperature of 50 °C.
No significant changes in the emission intensity of the sensing material were observed between dry and humid flows; the difference in intensity was below 3%. However, a significant decrease in luminescence (around 10%) was registered in cold conditions. This could be attributed to the condensation of the impurities present in the gas carrier in the sensing phase or to a change in the optical path due to an increase in the sol-gel packing density at low temperatures.
Species that could potentially interfere with the sensing phase were evaluated by injecting controlled amounts of methanol, ethanol, and isopropyl alcohol gaseous solutions into the three-necked flask, analogous to the acetone sensing procedure. To do that, 100 µL acetone was injected in the 500 mL exponential dilution system to prepare an air sample containing a concentration equal to 157 ppm. Additionally, 500 µL of the assayed species and possible interferents were injected consecutively to ensure concentrations in the air phase of 781 ppm isopropyl alcohol, 757 ppm methanol, and 789 ppm ethanol. Such air samples were analyzed using the sensing system and the phosphorescence signal from the sensing material was monitored in each case. The results showed that the ethanol and isopropyl alcohol caused little or no interference (no significant changes in the phosphorescence emission from the sensing material were observed) at the assayed concentration levels. However, the presence of methanol in the air sample affected the determination of acetone. In fact, an analysis of an air sample containing a 757 ppm concentration of methanol resulted in a decrease of the luminescent analytical signal equivalent to 17% of the one produced by the presence of a 157 ppm acetone concentration. For similar concentration levels of acetone and methanol in the gaseous air sample, the effect of methanol was less than 5% of that produced by acetone. The relative effect of the tested interferents on the luminescence signal of the sensing material is presented in Figure 10.
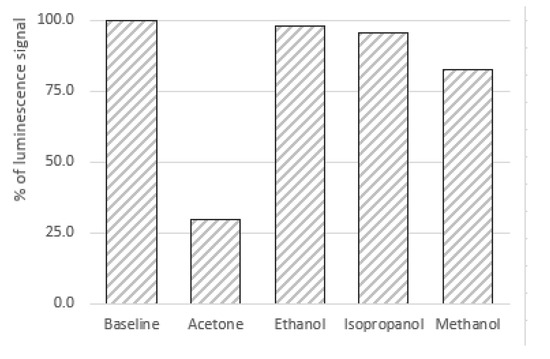
Figure 10.
Effect of the assayed interferents on the luminescence of the sensing phase. The assayed concentrations were 157 ppm of acetone, 781 ppm of isopropyl alcohol, 757 ppm of methanol, and 789 ppm of ethanol.
4. Conclusions
This article reports on the development of an affordable portable instrument for the detection of VOCs using photoluminescent sensing materials. Determination is based on the phosphorescence changes undergone by a solid sensing material after interaction with the gaseous analyte. A portable instrument that is compatible with the sensing phase was designed and constructed using conventional optoelectronic components to be able to measure and process the changes in the photoluminescence of the sensing material, and to convert such changes into concentration information. The sensing system was evaluated in terms of its rapid and reversible acetone quantification in air gas flows. The results showed that the optical signal registered by the prototype was linearly dependent on the amount of acetone present in the gaseous stream, allowing for proper quantification of the acetone analyte with a very good detection limit (9 ppm).
The low-cost sensor modules used to develop this instrumental prototype reduced its overall production costs to provide a comprehensive, portable, and real-time monitoring solution.
Finally, we envisage simple and straightforward industrial applications of this instrument. Not only it is an affordable device but it is also highly versatile; by simply changing the sensing materials (e.g., using a different kind of luminescent nanoparticles, such as ZnS/CdSe quantum dots [36] or photoluminescent carbon dots [37], entrapped in a sol-gel matrix), the light source, and the firmware programming, the system could be directly adapted for the detection of other chemical species (e.g., different VOCs) in different industrial sectors (e.g., printing, paint manufacture, furniture coating, metal surface coating, etc.).
Author Contributions
Conceptualization, F.J.F. and J.M.C.; methodology, J.M.C and A.S.; software, A.L.; validation, M.V., A.S., and M.T.F.-A.; formal analysis, M.V.; investigation, P.L.-S. and M.V.; resources, J.C.C.; data curation, J.C.C.; writing—original draft preparation, F.J.F.; writing—review and editing, F.J.F.; visualization, F.J.F.; supervision, J.M.C.-F.; project administration, A.L.; funding acquisition, J.M.C.-F. All authors have read and agreed to the published version of the manuscript.
Funding
This research was funded by IDEPA (Economic Development Agency of the Principality of Asturias) and ArcelorMittal through grant number SV-PA-15-RIS3-5. Financial support from Principado de Asturias (Spain) through the project FC-GRUPIN-IDI/2018/000166, from the Ministry of Economy and Competitiveness (Spain) through CTQ2016-79412-P, and the Instituto Nacional de Investigación y Tecnología Agraria y Alimentaria Nacional de Investigaciones Agrarias (Spain) through RTA2015-00061/AEI/FEDER, co-financed with european regional development funds (FEDER), is gratefully acknowledged.
Conflicts of Interest
The authors declare no conflict of interest.
References
- Khan, M.A.H.; Cooke, M.C.; Utembe, S.R.; Archibald, A.T.; Maxwell, P.; Morris, W.C.; Xiao, P.; Derwent, R.G.; Jenkin, M.E.; Percival, C.J.; et al. A Study of global atmospheric budget and distribution of acetone using global atmospheric model STOCHEM-CRI. Atmos. Environ. 2015, 112, 269–277. [Google Scholar] [CrossRef]
- Toxicological Profile for Acetone; U.S. Department of Health and Human Services Public Health Service Agency for Toxic Substances and Disease Registry: Atlanta, GA, USA. Available online: https://www.atsdr.cdc.gov/ToxProfiles/tp.asp?id=5&tid=1 (accessed on 1 February 2018).
- Acetone—Sampling and Analytical Methods; Occupational Safety and Health Organization (OSHA): Washington, DC, USA, 1988. Available online: https://www.osha.gov/dts/sltc/methods/organic/org069/org069.html (accessed on 6 February 2018).
- Hodkkinson, J.; Tatam, R.P. Optical gas sensing: A review. Meas. Sci. Technol. 2013, 24, 012004. [Google Scholar] [CrossRef]
- Costa-Fernández, J.M.; Pereiro, R.; Sanz-Medel, A. The use of luminescent quantum dots for optical sensing. Trends Anal. Chem. 2006, 25, 207–218. [Google Scholar] [CrossRef]
- Alivisatos, A.P. Semiconductor Clusters, Nanocrystals, and Quantum Dot. Science 1996, 271, 933. [Google Scholar] [CrossRef]
- Murray, C.B.; Norris, D.J.; Bawendi, M.G. Synthesis and characterization of nearly monodisperse CdE (E = sulfur, selenium, tellurium) semiconductor nanocrystallites. J. Am. Chem. Soc. 1993, 115, 8706. [Google Scholar] [CrossRef]
- Beaulac, R.; Archer, P.I.; Gamelin, D.R. Luminescence in colloidal Mn2+-doped semiconductor nanocrystals. J. Solid State Chem. 2008, 181, 1582–1589. [Google Scholar] [CrossRef]
- Segura-Carretero, A.; Salinas-Castillo, A.; Fernández-Gutierréz, A. A review of heavy-atom-induced room-temperature phosphorescence: A straightforward phosphorimetric method. Crit. Rev. Anal. Chem. 2005, 35, 3–14. [Google Scholar] [CrossRef]
- Sotelo-Gonzalez, E.; Fernandez-Argüelles, M.T.; Costa-Fernandez, J.M.; Sanz-Medel, A. Mn-doped ZnS quantum dots for the determination of acetone by phosphorescence attenuation. Anal. Chim. Acta 2012, 712, 120–126. [Google Scholar] [CrossRef]
- Kim, S.-H.; He, Y.; Lee, E.-H.; Kim, J.-H.; Part, S.M. Portable Fluorometer for Cyanobacteria Detection. IEEE Sens. J. 2017, 17, 8. [Google Scholar] [CrossRef]
- Hossai, A.; Canning, J.; Ast, S.; Rutledg, P.J.; Yen, T.L.; Jamalipour, A. Lab-in-a-Phone: Smartphone-Based Portable Fluorometer for pH Measurements of Environmental Water. IEEE Sens. J. 2015, 15, 9. [Google Scholar]
- Xin, Y.; He, G.; Wang, Q.; Fang, Y. A portable fluorescence detector for fast ultra-trace detection of explosive vapors. Rev. Sci. Instrum. 2011, 82, 102–103. [Google Scholar] [CrossRef] [PubMed]
- Kissinger, J.; Wilson, D. Portable fluorescence lifetime detection for chlorophyll analysis in marine environments. IEEE Sens. J. 2011, 11, 288–295. [Google Scholar] [CrossRef]
- Cucci, C.; Mignani, A.G.; Dall’Asta, C.; Pela, R.; Dossena, A. A portable fluorometer for the rapid screening of M1 aflatoxin. Sens. Actuators B Chem. 2007, 126, 467–472. [Google Scholar] [CrossRef]
- Ferrero, F.J.; Valledor, M.; Campo, J.C.; Marín, L.; Gutiérrez del Rio, I.; Fernández, J.; Lombó, F.; Cobian, N.; Olmos, F.; Méndez, I. A Novel Handheld Fluorimeter for Rapid Detection of Escherichia coli in Drinking Water. IEEE Sens. J. 2016, 16, 5136–5144. [Google Scholar] [CrossRef]
- Sotelo-Gonzalez, E.; Roces, L.; Garcia-Granda, S.; Fernandez-Arguelles, M.T.; Costa-Fernandez, J.M.; Sanz-Medel, A. Influence of Mn2+ concentration on Mn2+-doped ZnS quantum dot synthesis: Evaluation of the structural and photoluminescent properties. Nanoscale 2013, 5, 9156–9161. [Google Scholar] [CrossRef]
- Sotelo-Gonzalez, E.; Coto-Garcia, A.M.; Fernandez-Argüelles, M.T.; Costa-Fernandez, J.M.; Sanz-Medel, A. Immobilization of phosphorescent quantum dots in a sol–gel matrix for acetone sensing. Sens. Actuators B 2012, 174, 102–108. [Google Scholar] [CrossRef]
- Meneghini, M.; Barbisan, D.; Bilenko, Y.; Shatalov, M.; Yang, Y.; Gaska, R.; Meneghesso, G.; Zanoni, E. Defect-related degradation of Deep-UV-LEDs. Microelectron. Reliab. 2010, 50, 1538–1542. [Google Scholar] [CrossRef]
- Shur, M.S.; Gaska, R. Deep-ultraviolet light-emitting diodes. IEEE Trans. Electron. Dev. 2010, 1, 12–25. [Google Scholar] [CrossRef]
- Thorlabs. Optics Selection Guide. Available online: http://www.thorlabs.com/ (accessed on 14 March 2020).
- Hamamatsu Tutorials. A Guide to Choosing the Right Detector. Available online: http://www.hamamatsu.com/us/en/community/optical_sensors/tutorials/guide_to_detector_selection/index.html (accessed on 14 March 2020).
- Campo, J.C.; Barragán, N.; Pérez, M.A.; Álvarez, J.C. A comparison between different excitation/detection systems for luminescence lifetime-based instrumentation. In Proceedings of the IEEE International Conference on Instrumentation and Measurement, Anchorage, AK, USA, 21–23 May 2002. [Google Scholar]
- Sola-Vazquez, A.; Martín, A.; Costa-Fernandez, J.M.; Pereiro, R.; Sanz-Medel, A. Tuneable Microsecond-Pulsed Glow Discharge Design for the Simultaneous Acquisition of Elemental and Molecular Chemical Information Using a Time-of-Flight Mass Spectrometer. Anal. Chem. 2009, 81, 2591–2599. [Google Scholar] [CrossRef]
- Righettoni, M.; Tricoli, A.; Gass, S.; Schmidb, A.; Amann, A.; Pratsinis, S.E. Breath acetone monitoring by portable Si:WO3 gas sensors. Anal. Chim. Acta 2012, 738, 69–75. [Google Scholar] [CrossRef]
- Shi, G.; He, Y.; Luo, Q.; Li, B.; Zhang, C. Portable device for acetone detection based on cataluminescence sensor utilizing wireless communication technique. Sens. Actuator B Chem. 2018, 257, 451–459. [Google Scholar] [CrossRef]
- Hao, X.; Wu, D.; Wang, Y.; Ouyang, J.; Wang, J.; Liu, T.; Liang, X.; Zhang, C.; Liu, F.; Yan, X.; et al. Gas sniffer (YSZ-based electrochemical gas phase sensor) toward acetone detection. Sens. Actuator B Chem. 2019, 278, 1–7. [Google Scholar] [CrossRef]
- Righettoni, M.; Tricoli, A.; Pratsinis, S.E. Si:WO3 Sensors for Highly Selective Detection of Acetone for Easy Diagnosis of Diabetes by Breath Analysis. Anal. Chem. 2010, 82, 3581–3587. [Google Scholar] [CrossRef] [PubMed]
- Kao, K.-W.; Hsu, M.-C.; Chang, Y.-H.; Gwo, S.; Yeh, J.A. A Sub-ppm Acetone Gas Sensor for Diabetes Detection Using 10 nm Thick Ultrathin InN FETs. Sensors 2012, 12, 7157–7168. [Google Scholar] [CrossRef] [PubMed]
- Zhao, J.; Huo, L.H.; Gao, S.; Zhao, H.; Zhao, J.G. Alcohols and acetone sensing properties of SnO2 thin films deposited by dip-coating. Sens. Actuator B Chem. 2006, 115, 460–464. [Google Scholar] [CrossRef]
- Ahn, H.; Wang, Y.; Jee, S.H.; Park, M.; Yoon, Y.S.; Kim, D.-J. Enhanced UV activation of electrochemically doped Ni in ZnO nanorods for room temperature acetone sensing. Chem. Phys. Lett. 2011, 511, 331–335. [Google Scholar] [CrossRef]
- Vomiero, A.; Bianchi, S.; Comini, E.; Faglia, G.; Ferroni, M.; Sberveglieri, G. Controlled growth and sensing properties of In2O3 nanowires. Cryst. Growth Des. 2007, 7, 2500–2504. [Google Scholar] [CrossRef]
- Wang, L.; Teleki, A.; Pratsinis, S.; Gouma, P. Ferroelectric WO3 nanoparticles for acetone selective detection. Chem. Mater. 2008, 20, 4794–4796. [Google Scholar] [CrossRef]
- Kakati, N.; Jee, S.H.; Kim, S.H.; Oh, J.Y.; Young, S.Y. Thickness dependency of sol-gel derived ZnO thin films on gas sensing behaviors. Thin Solid Films 2010, 519, 494–498. [Google Scholar] [CrossRef]
- Murade, P.A.; Sangawar, V.S.; Chaudhari, G.N.; Kapse, V.D.; Bajpeyee, A.U. Acetone gas-sensing performance of Sr-doped nanostructured LaFeO3 semiconductor prepared by citrate sol-gel route. Curr. Appl. Phys. 2011, 11, 451–456. [Google Scholar] [CrossRef]
- Hasani, M.; Coto-García, A.M.; Costa-Fernández, J.M.; Sanz-Medel, A. Sol–gels doped with polymer-coated ZnS/CdSe quantum dots for the detection of organic vapors. Sens. Actuator B Chem. 2009, 144, 198–202. [Google Scholar] [CrossRef]
- Mura, S.; Ludmerczki, R.; Stagi, L.; Garroni, S.; Carbonaro, C.M.; Ricci, P.C.; Casula, M.F.; Malfatti, L.; Innocenzi, P. Integrating sol-gel and carbon dots chemistry for the fabrication of fluorescent hybrid organic-inorganic films. Sci. Rep. 2020, 10, 4770. [Google Scholar] [CrossRef] [PubMed]
© 2020 by the authors. Licensee MDPI, Basel, Switzerland. This article is an open access article distributed under the terms and conditions of the Creative Commons Attribution (CC BY) license (http://creativecommons.org/licenses/by/4.0/).