Article

Renyi’s Entropy Based Multilevel Thresholding Using a Novel Meta-Heuristics Algorithm

1
School of Computer Science, Hubei University of Technology, Wuhan 430070, China
2
Department of Computer Science, Middlesex University, London NW4 4BT, UK
*
Author to whom correspondence should be addressed.
Appl. Sci. 2020, 10(9), 3225; https://doi.org/10.3390/app10093225
Submission received: 1 April 2020 / Revised: 26 April 2020 / Accepted: 29 April 2020 / Published: 6 May 2020
(This article belongs to the Special Issue Intelligent Processing on Image and Optical Information, Volume II)

Abstract

:
Multi-level image thresholding is the most direct and effective method for image segmentation, which is a key step for image analysis and computer vision, however, as the number of threshold values increases, exhaustive search does not work efficiently and effectively and evolutionary algorithms often fall into a local optimal solution. In the paper, a meta-heuristics algorithm based on the breeding mechanism of Chinese hybrid rice is proposed to seek the optimal multi-level thresholds for image segmentation and Renyi’s entropy is utilized as the fitness function. Experiments have been run on four scanning electron microscope images of cement and four standard images, moreover, it is compared with other six classical and novel evolutionary algorithms: genetic algorithm, particle swarm optimization algorithm, differential evolution algorithm, ant lion optimization algorithm, whale optimization algorithm, and salp swarm algorithm. Meanwhile, some indicators, including the average fitness values, standard deviation, peak signal to noise ratio, and structural similarity index are used as evaluation criteria in the experiments. The experimental results show that the proposed method prevails over the other algorithms involved in the paper on most indicators and it can segment cement scanning electron microscope image effectively.

1. Introduction

With the rapid development of computers, technologies of image processing were applied widely in many areas, including quality estimation [1,2], infrared detection [3,4], disease recognition [5,6], agricultural identification [7,8], fingerprint identification [9], and many other aspects [10,11]. Especially, image analysis has become a very useful method in the study of cement microstructure based on the cement SEM (scanning electron microscope) image [12], as it is possible to analyze the mechanism of cement hydration reaction by observing the microstructure of cement in cement stone materials [13]. Image segmentation is the first step of image understanding, and any other steps (such as feature extraction and recognition) largely depend on its results, it is to partition an image into interrelated parts or regions, which are composed of image pixels with related data eigenvalues.
Threshold technology is considered as the most popular image segmentation algorithm, which has the advantages of small storage space, fast processing speed, and easy operation. Some successful thresholding approaches have been proposed for image segmentation, including inter class variance method (OTSU) [14], the maximum entropy-based thresholding method [15], Renyi’s entropy-based thresholding method [16], Tsallis’ entropy based thresholding method [17], and so on. Due to the complexity of the real world, multi-level thresholding-based partition methods have become more broadly used for practical work [18,19,20]. When the one-dimensional threshold algorithm is extended to multiple dimensions, they may show high computational cost and do not meet real-time requirements when the number of classes to be detected increases.
In essence, this problem could be viewed as a combinatorial optimization problem, and meta-heuristics algorithms are often employed to deal with this kind of problem. For instance, Huiyan J, Xiaoqi M, et al. combined improved fruit fly optimization algorithm with support vector machine and used it to classify pancreatic cancer [21], ant colony optimization were utilized for the selection of accounting models, graph anonymization and robot rescue mission [22,23,24], Reddy G T, Srivastava G et al. applied hybrid genetic algorithms to the diagnosis of heart disease [25], and many other evolutionary algorithms have been applied to solve optimization problems in various fields [26,27,28]. There is no doubt that a lot of researches have been conducted around the multi-threshold segmentation handled with evolutionary algorithms, such as hybrid whale optimization algorithm is employed in Kapur entropy for multi-threshold segmentation [29], combine particle swarm optimization algorithm with Tsallis entropy for multi-threshold segmentation [30], ant colony optimization algorithm is employed in OTSU to quickly search for multiple thresholds in images [31], some other optimization algorithms are also used for multi-threshold segmentation, such as water cycle algorithm [32], cuckoo search algorithm [33], knee evolutionary algorithm [34], differential evolution algorithm [35], and bat algorithm [36]. These efforts have achieved good results; however, it is hard for meta-heuristic optimization algorithms to obtain the same optimal solution as the exhaustive method with the increment of the number of thresholds in seconds.
Inspired by the breeding mechanism of Chinese hybrid rice, a novel meta-heuristics algorithm is proposed [37], for simplicity, it is called hybrid rice optimization algorithm (HRO). HRO has the advantages of strong stability, large search range, and strong optimization. In [37], it is shown that HRO prevails over particle swarm optimization (PSO), differential evolution algorithms (DE), genetic algorithm (GA), artificial bee colony (ABC) on the basis of six benchmark functions. At the same time, HRO has also been used for security situation prediction in [38]. Preliminary studies show that it is very prospective and competition for the problem with low or middle dimension. Therefore, HRO is suggested to seek the optimal solution for a multi-level image threshold in the paper as the number of threshold values is less than 12 in common. The presented scheme employs HRO to maximize the objective function of Renyi’s entropy, and GA [39], PSO [40], DE [41], ant lion optimization algorithm (ALO) [42], whale optimization algorithm (WOA) [43], and SALP swarm algorithm (SSA) [44] are also adopted in our presented scheme for comparison experiments.
The remainder of this work is organized as follows: In Section 2, an overview of Renyi’s entropy is given, and the basic principle of the meta-heuristics algorithm derived from the breeding mechanism of Chinese hybrid rice is explained briefly. In Section 3, the thresholding method based on the proposed meta-heuristics algorithm is introduced. In Section 4, the experimental setup and data required for the experiment are introduced, and through several experiments and quantitative analysis, the conclusion proves the effectiveness of the proposed method. Finally, we draw a conclusion in Section 5.

2. Methodological Background

2.1. Renyi’s Entropy

Renyi’s entropy is a generalized form of Shannon’s entropy, in which an adjustable parameter α is introduced, Therefore, the measurement of information coolness is more general and flexible, and when α = 1, Renyi’s entropy is equal to Shannon’s entropy. In the paper, the coefficient of α is 2.
The method of Renyi’s entropy with single threshold is described as follows: suppose I is an image to be segmented with L gray levels, and the probability of each gray level distribution is { p ( 1 ) , p ( 2 ) , p ( 3 ) , p ( i ) , p ( L ) } Suppose there is only one single threshold T to divide image I into two parts: the target C 0 = { 0 , 1 , 2 , , t } and background C 1 = { t + 1 , t + 2 , , L 1 } .
Target and background gray probabilities are calculated, w 0 ( t ) is the probability of C 0 occurrence, w 1 ( t )   is the probability of C 1 occurrence, and w 0 ( t ) + w 1 ( t ) = 1 , the definitions of w 0 ( t ) and w 1 ( t ) are as
w 0 ( t ) = i = 1 t p ( i )
w 1 ( t ) = i = t L 1 p ( i )
According to the definition of Renyi’s entropy, the Renyi’s entropy of image background and target is defined as
R t α 0 ( t ) = 1 1 α l n i = 1 t ( p ( i ) w 0 ( t ) ) α
R t α 1 ( t ) = 1 1 α l n i = t + 1 L 1 ( p ( i ) w 1 ( t ) ) α
The total Renyi’s entropy is calculated by
T ( t ) = R t α 0 ( t ) + R t α 1 ( t )
The optimal threshold T should satisfy Equation (6).
t = a r g   m a x ( T ( t ) )
According to the Renyi’s entropy method of single threshold, the Renyi’s entropy method of multi-threshold could be deduced. Suppose there are N thresholds { t 1 , t 2 , t 3 , , t N } , the histogram is divided into N + 1 regions, the gray probability of the first threshold t could be described as,
w 1 ( t ) = i = 1 t 1 p ( i )
Except for the first and N-th thresholds, the gray probability of other thresholds could be defined as
w n ( t ) = i = t n 1 + 1 t n p ( i )
The gray probability of the last threshold t as
w N ( t ) = i = t N 1 + 1 L 1 p ( i )
The Renyi’s entropy of each region is calculated by Equation (10), where n ranges from 1 to N:
R t α n = 1 1 α l n i = t n 1 + 1 t n ( p ( i ) w n ( t ) ) α
The total Renyi’s entropy is calculated by Equation (11) below.
T ( [ t 1 , t 2 , t 3 , , t N ] ) = n = 1 N R t α n ( t n )
The selected optimal threshold [ t 1 , t 2 , , t N ] should meet Equation (12).
[ t 1 , t 2 , , t N ] = a r g   m a x ( T ( [ t 1 , t 2 , , t N ] ) )

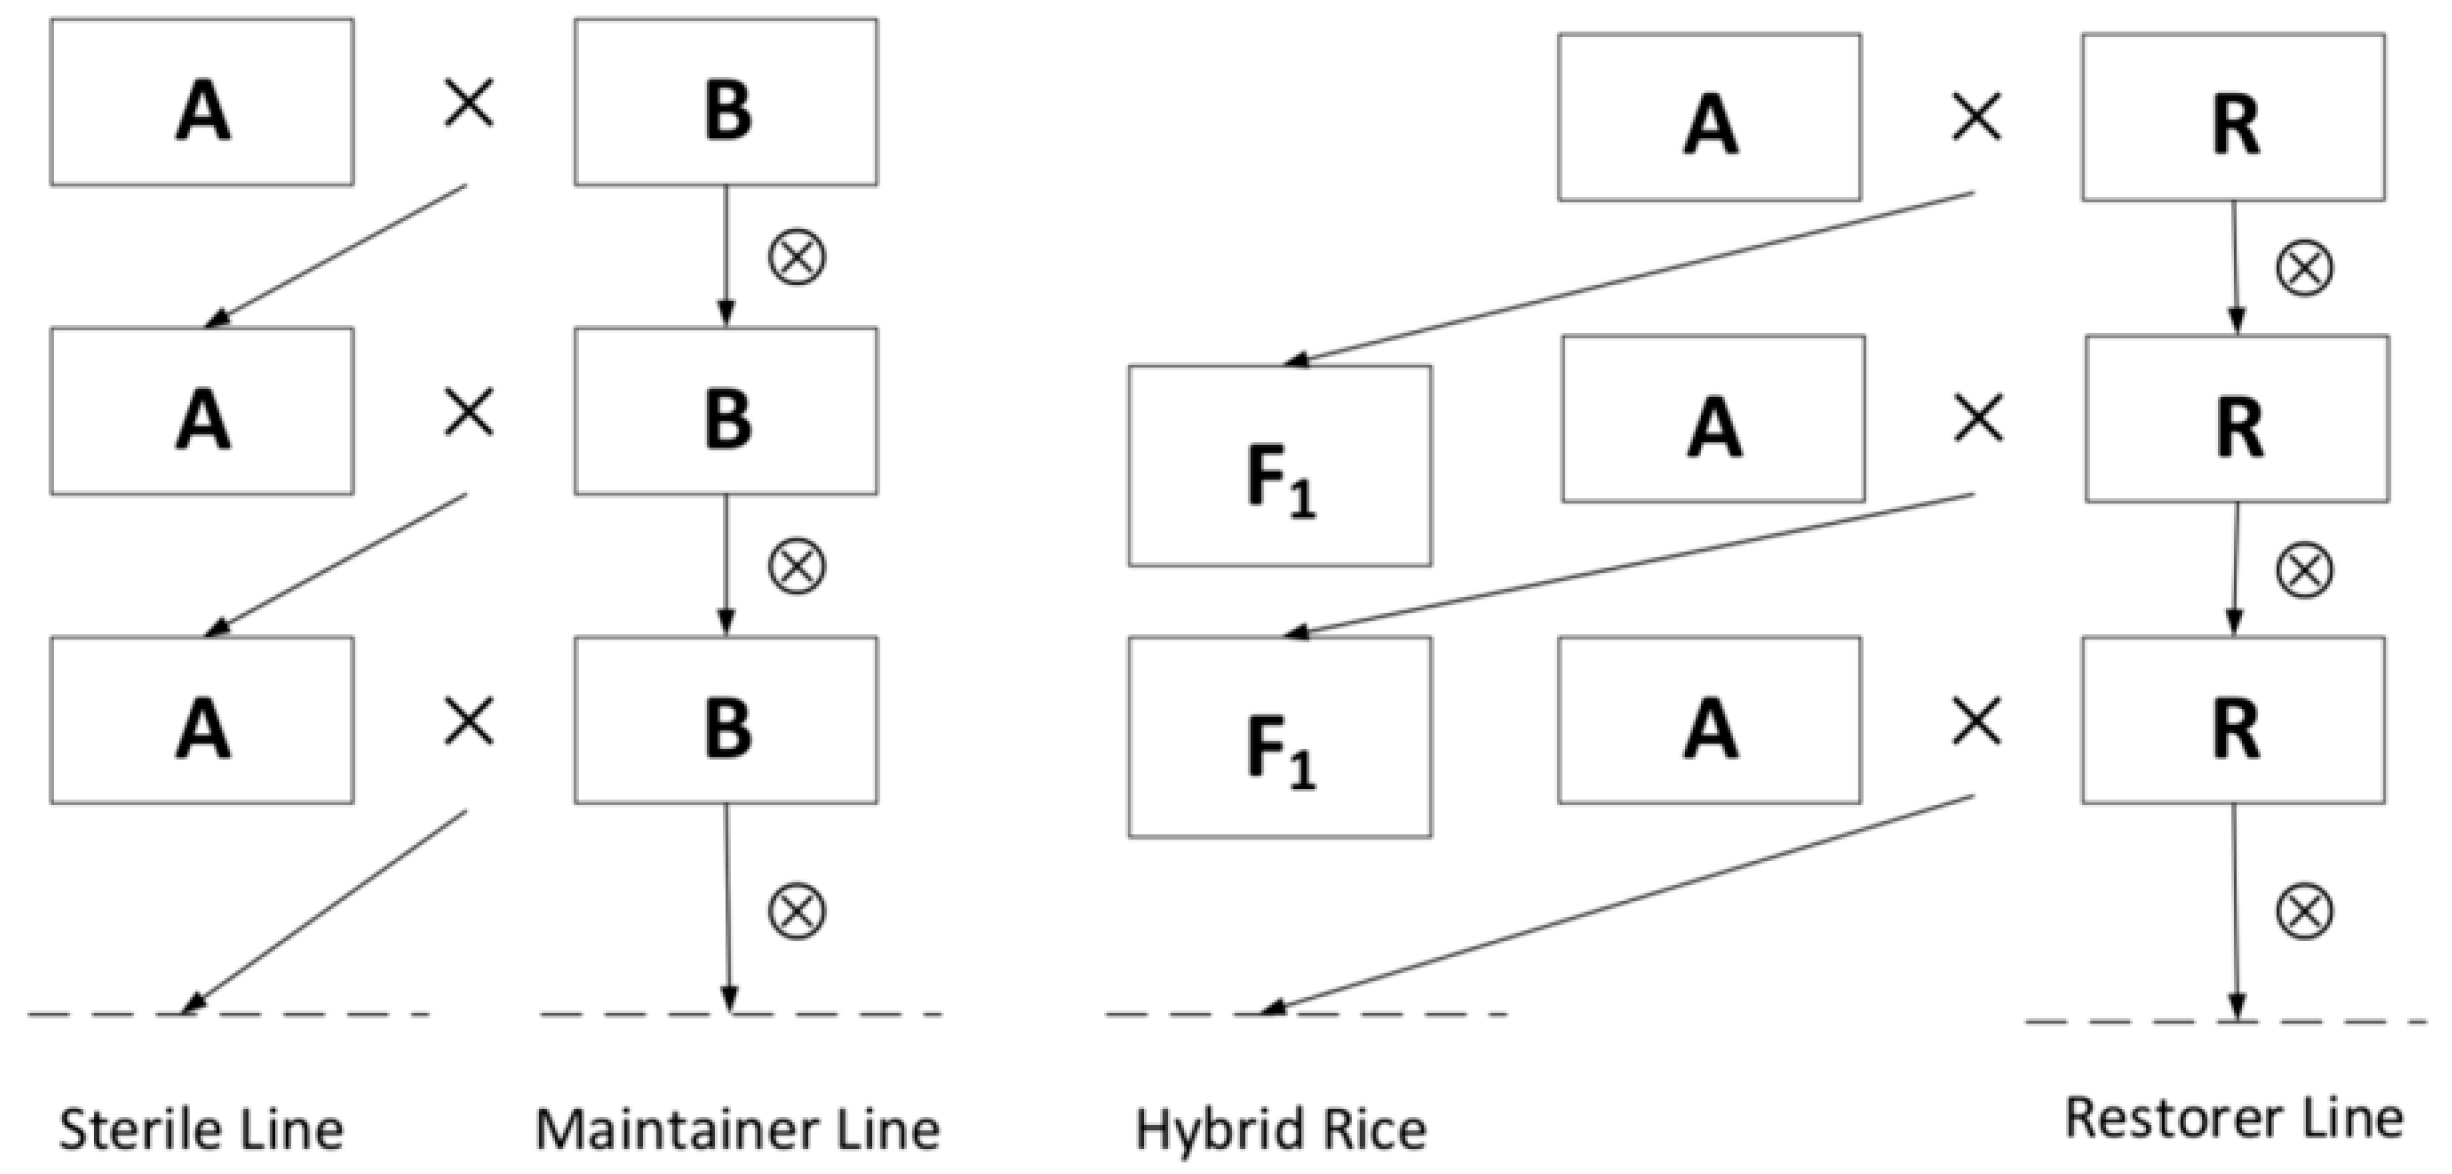
2.2. The Meta-Heuristics Algorithm Derived from the Breeding Mechanism of Chinese Hybrid Rice

The proposed meta-heuristics algorithm is derived from the breeding mechanism of Chinese hybrid rice, which uses rice genes as value in the solution space, and the fitness function is used to measure the pros and cons of the rice gene. According to the pros and cons of their genes, Chinese hybrid rice is divided into sterile lines, maintainer lines, and restorer lines. Figure 1 shows the breeding procedure of three-line Chinese hybrid rice.
The symbols × and denote hybridization and selfing, respectively. Sterile lines (A) refer to a special type of rice that looks similar to regular rice. Due to the abnormal development of male organs in sterile lines, sterile lines are often pollen-free or aborted, and male sterility is controlled by cytoplasmic genes. The development of female organs of male sterile lines is healthy and can accept normal pollen for fertilization. It is one of the important tools to obtain Chinese hybrid rice seeds. Maintainer lines (B) refer to rice varieties that can maintain cytoplasmic male sterility. Maintainer rice seeds have the same nuclear genotype as sterile rice seeds. However, the cytoplasmic genes of the maintainer line are fertile, and the pollen is fertile and capable of self-breeding. Since the maintainer line is the same nuclear genotype as the sterile line, it is not possible to alter sterility controlled by cytoplasm. Therefore, the progeny of the maintainer line and the sterile line are also sterile, that is, A × B A . The restorer line (R) is a variety that can repair cytoplasmic male sterility. It has a nuclear gene that restores cytoplasmic male sterility. When it crosses a sterile line, the seed usually has fertility and heterosis. This offspring is the hybrid rice seed (F1) we need, that is, A × R F 1 . Chinese hybrid rice is the progeny formed by crossing two rice cultivars, sterile line and restorer line, the yield and other important agronomic traits are better than the parent and control varieties.
A meta-heuristic algorithm based on the breeding mechanism of Chinese hybrid rice (hereinafter referred to as HRO) simulates the “three-line” breeding process. There are two main breeding behaviors, that is, crossing, a sterile line is crossed with a maintainer line to update a sterile line individual, selfing, the restorer is inbred to update the next-generation restorer. The cross-breeding of sterile lines and maintainer lines is an evolutionary process, and hybrid dominance can quickly reduce the gap between populations. Therefore, individuals with relatively significant differences are crossed. The self-crossing of restorer lines enables individuals with medium fitness value to reach the current optimal solution quickly, and has the ability to jump out of the local optimal solution.

3. Proposed Method

In this section, an effective method of multi-threshold image segmentation based on HRO is introduced. The specific implementation steps are described below.

3.1. Idea of the Algorithm

The key idea of employing HRO to deal with multi-threshold is mapping of problem solutions. The objective functions of image segmentation used in the paper are Renyi’s entropy. The real-coded HRO is used to quickly obtain the optimal solution of multiple thresholds. A seed in the HRO represents a solution of the problem. The dimension of the gene in the seed is equal to the dimension space of the problem to be solved. For example, if the number of thresholds to be solved is 2, the spatial dimension of the problem is 2, the dimension of gene is 2. The optimal threshold could be obtained by maximizing the value of the objective function. Among them, since hybrid rice is divided into three lines, it is recommended that the population is a multiple of 3, for example, 30, 45, 60.
Definition: The population of rice is N, the proportion of the maintainer line and the sterile line in the population is a%, and the number is A = N × a/100. Then the proportion of the restorer line in the population is (100–2a)%. The number of maintainer lines, sterile lines, and restorer lines is A, A, and N-2A (the number of individuals in the three lines is generally N/3). The dimension of each individual gene is D, the value of D is the number of thresholds, in the paper D = { 2 , 4 , 6 , 8 } . X i t indicates the gene of the i-th individual in the group at the t-th breeding, X i t = ( X i 1 , X i 2 , X i 3 , , X i D 1 , X i D ) . When t = 0, randomly generate N solutions in the solution space: x i 0 = { x 1 0 , x 2 0 , , x N 1 0 , x N 0 } . The specific generation formula is done by Equation (13).
x i j = min   x j + rand ( 0 , 1 ) ( max   x j min   x j )
where j { 1 , 2 , 3 , , D } , max x j and m i n   x j represent the maximum and minimum values of the j-th component of the search space, respectively, the problem solved in the paper is the optimal threshold, so the maximum value is 255 and the minimum value is 0. The fitness value of each individual in the population is calculated and the current optimal value is recorded. The fitness function in HRO is the formula of Renyi’s entropy introduced in the second part of the paper.
The rice population is ranked according to the fitness value from superior to inferior. The top A individuals are taken as maintenance lines, the bottom A individuals are sterile lines, and the remaining N-2A individuals are restorer lines.
Hybridization: Select one of the following hybridization methods as the hybridization method of the entire algorithm.
Random hybridization:
x si j ( t + 1 ) = r 1 x ma j ( t ) + r 2 x sb j ( t ) r 1 + r 2
x s i j ( t + 1 ) represents is the j-th gene in the gene sequence of the i-th rice seed in the sterile line, r 1 , r 2 is a random number between −1 and 1, and r 1 + r 2 0 , in the paper, the threshold value solved by HRO is only positive integer, so r 1 , r 2 is a random number between −0.5 and 1.5, a, b are randomly taken from {1,2,3 … , m}, x m a j is the a-th individual in the maintaining lines, and x s b j is the b-th individual in the sterile lines. Each dimension of the newly generated individual gene sequence is calculated by Equation (14) from rice seed of randomly selected male sterile lines and maintainers.
Corresponding hybridization:
x si j ( t + 1 ) = r 1 x mc j ( t ) + r 2 x sc j ( t ) r 1 + r 2
x m c j ( t ) and   x s c j ( t ) represent the j-th gene in the c-th seed gene sequence of maintainer line and sterile line. The new individuals are randomly obtained from the c-th rice seed of the sterile line and the c-th rice seed of the maintainer line in a certain proportion.
Selfing: In the process of self-crossing breeding, rice seeds are randomly selected to update their genes along the direction of the current optimal solution. Based on the greedy strategy, after calculating the fitness value of the new individual and comparing it with the individual before self-crossing, the number of self-crossing operations of the seed is denoted as zero. Otherwise, the self-intersection operand of the individual is added by 1. When the number of self-crossing operations of restorer line individuals reaches the limit T m a x , they will no longer participate in the self-crossing process of the next round of breeding but will be reset. Selfing could be described as
x ri j ( t + 1 ) = x ri j ( t ) + rand ( 0 , 1 ) ( x best x rk j ( t ) )
where, x r i j ( t + 1 ) represents the new individual generated by self-intersection of the i-th restorer line x r i j ( t ) , and x r k j represents the k-th individual randomly selected from the restorer line. The x b e s t represents the current optimal individual.
Reset: Resume individuals who have reached the maximum number of inbred will reset. Reset could be described as
x ri j = x ri j + rand ( 0 , 1 ) ( x max x min )
where, x r i j represents the new rice produced by the reset operation of restorer line x r i j .   x m a x and x m i n are the upper and lower limits of gene quantization.
If the maximum breeding number is satisfied or less than the predefined error, the current global optimal value is output as the result, otherwise skip to step “Hybridization”.
The time complexity of the multi-level image thresholding algorithm based on HRO is O   ( M a x _ i t e r a t i o n     N     D l o g D ) , where M a x _ i t e r a t i o n is the maximum number of iterations, N is the size of the population, and D is the dimension of the individual, D l o g D represents the time it takes to sort after each position update.

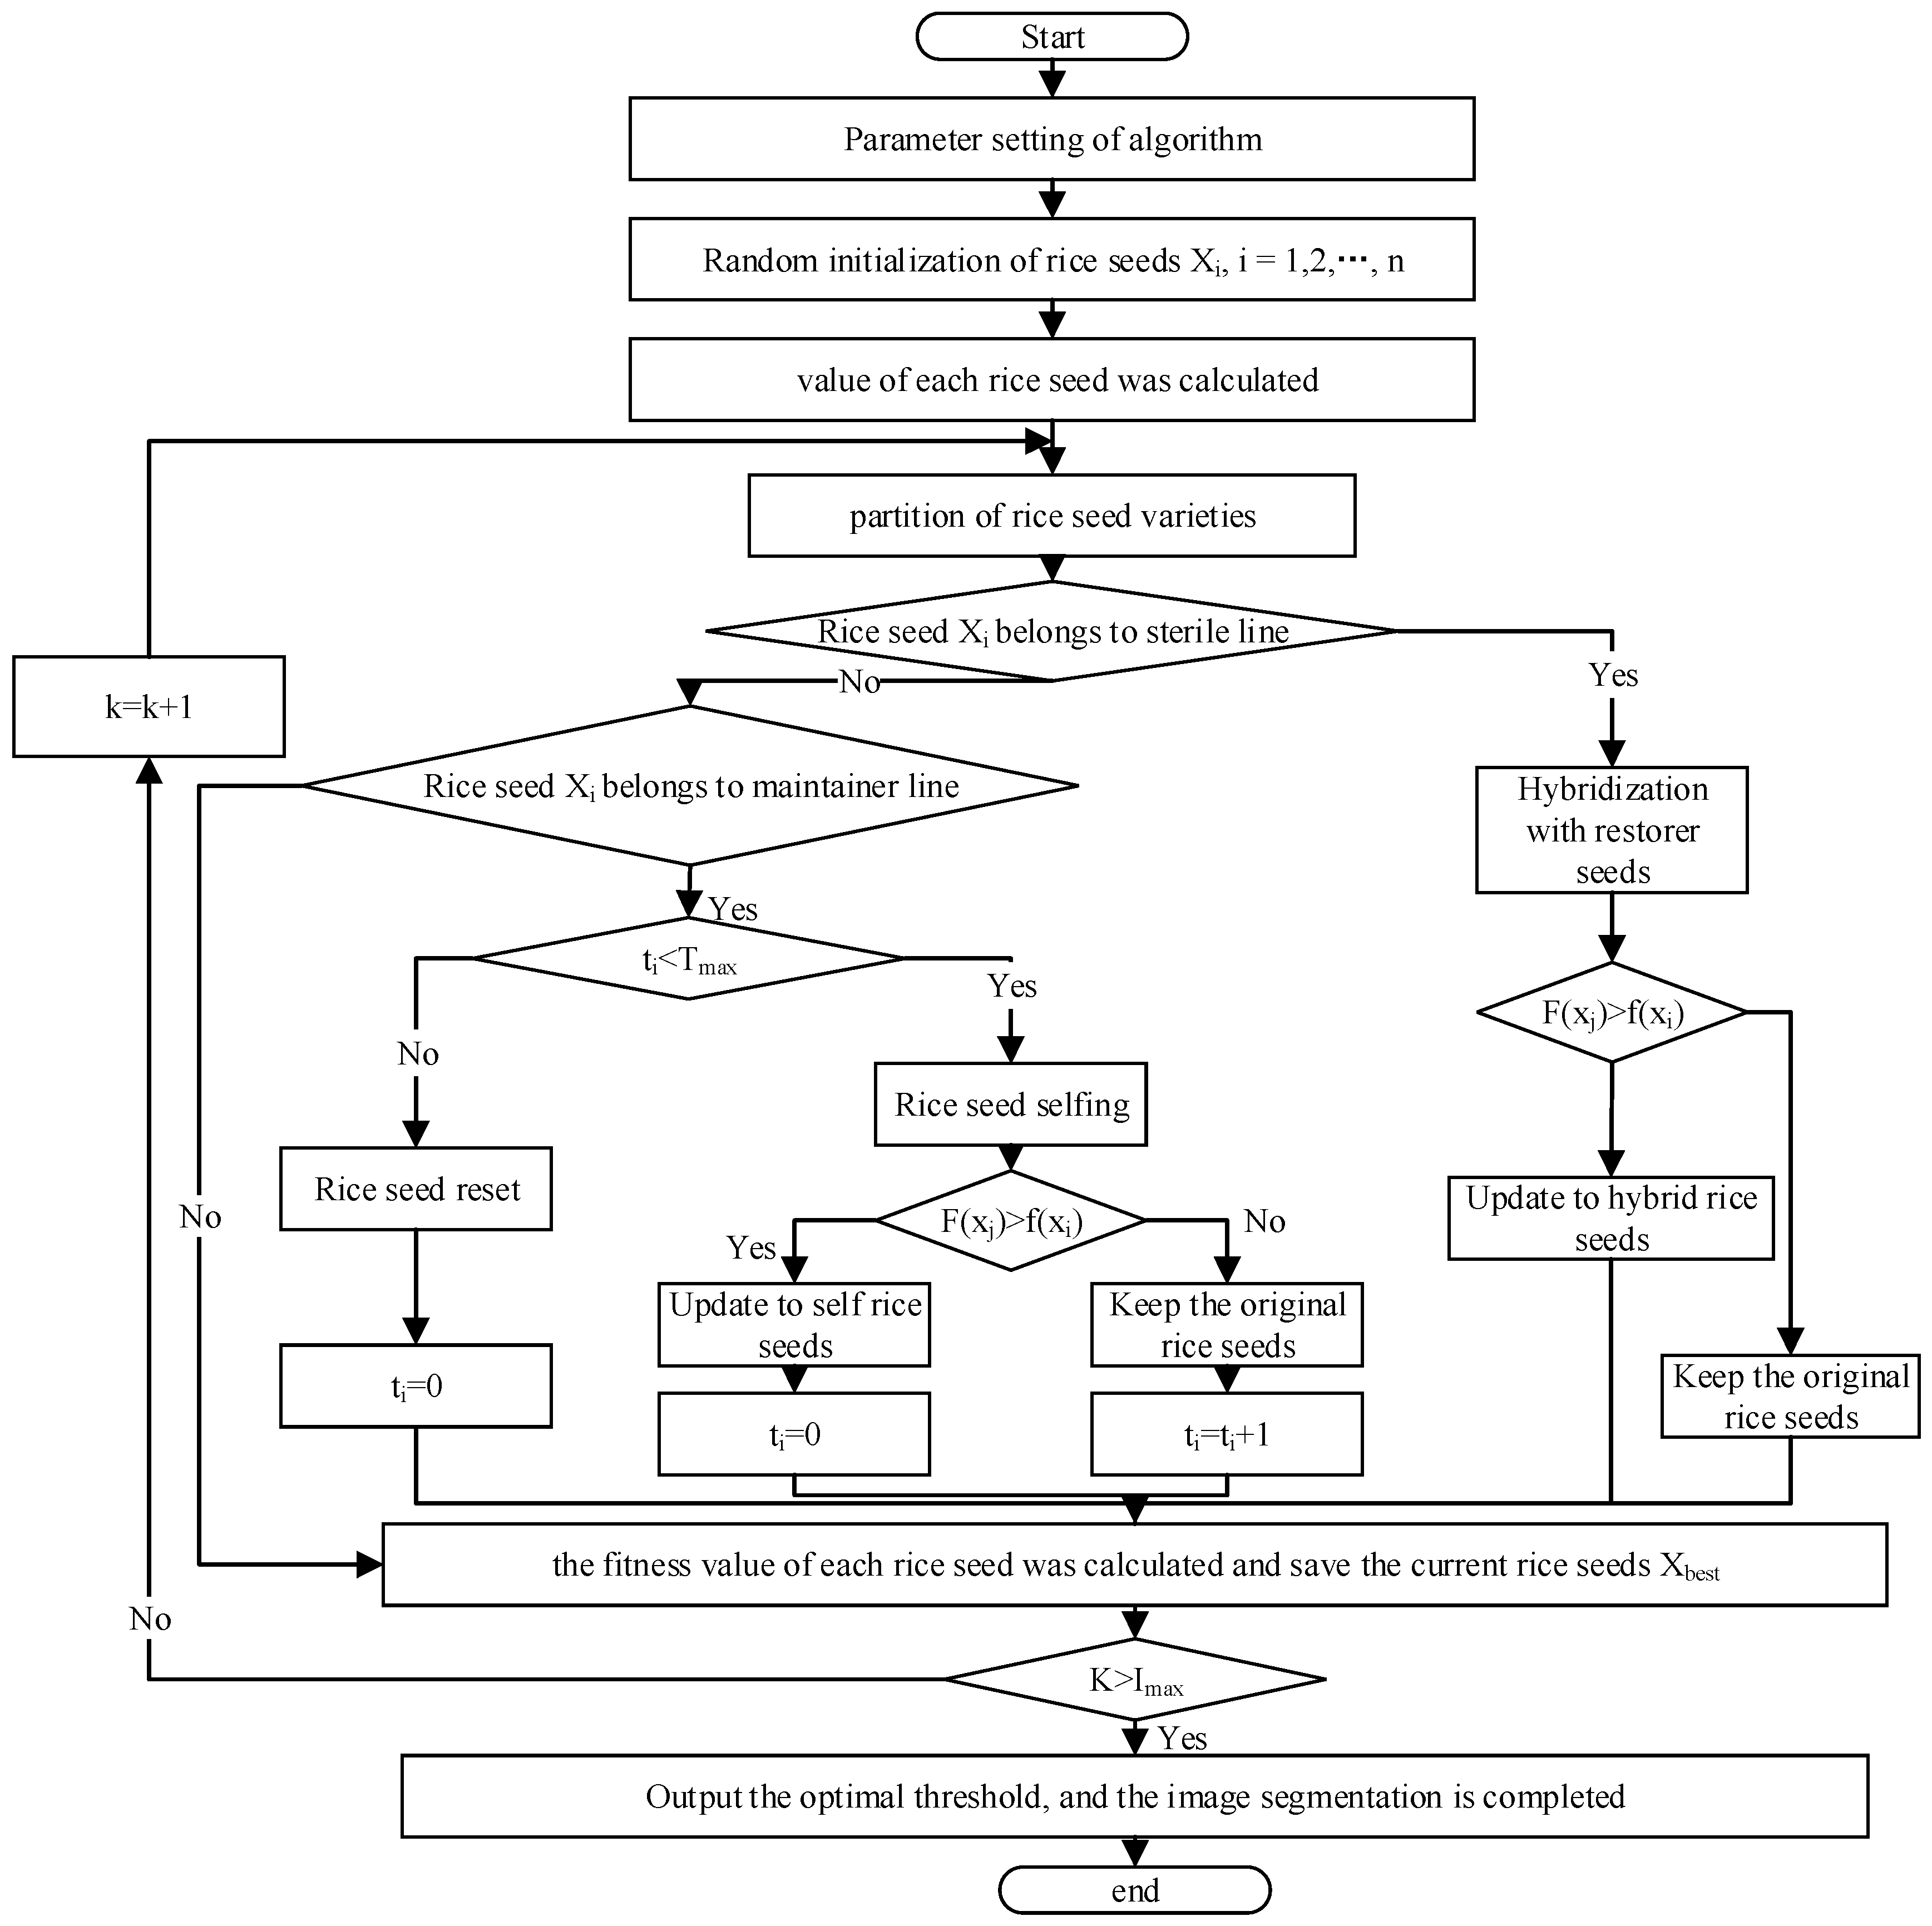
3.2. The Procedure of the Algorithm

Figure 2 shows the procedure of the proposed scheme.
HRO is not easy to fall into the local optimum and has good stability. When the number of thresholds is small, the threshold value can also be calculated by the exhaustive method. However, as the number of threshold values increases, the exhaustive method has high time complexity and low efficiency. In the paper, HRO is applied to search the optimal threshold fast and effectively for Renyi’s entropy-based thresholding method.

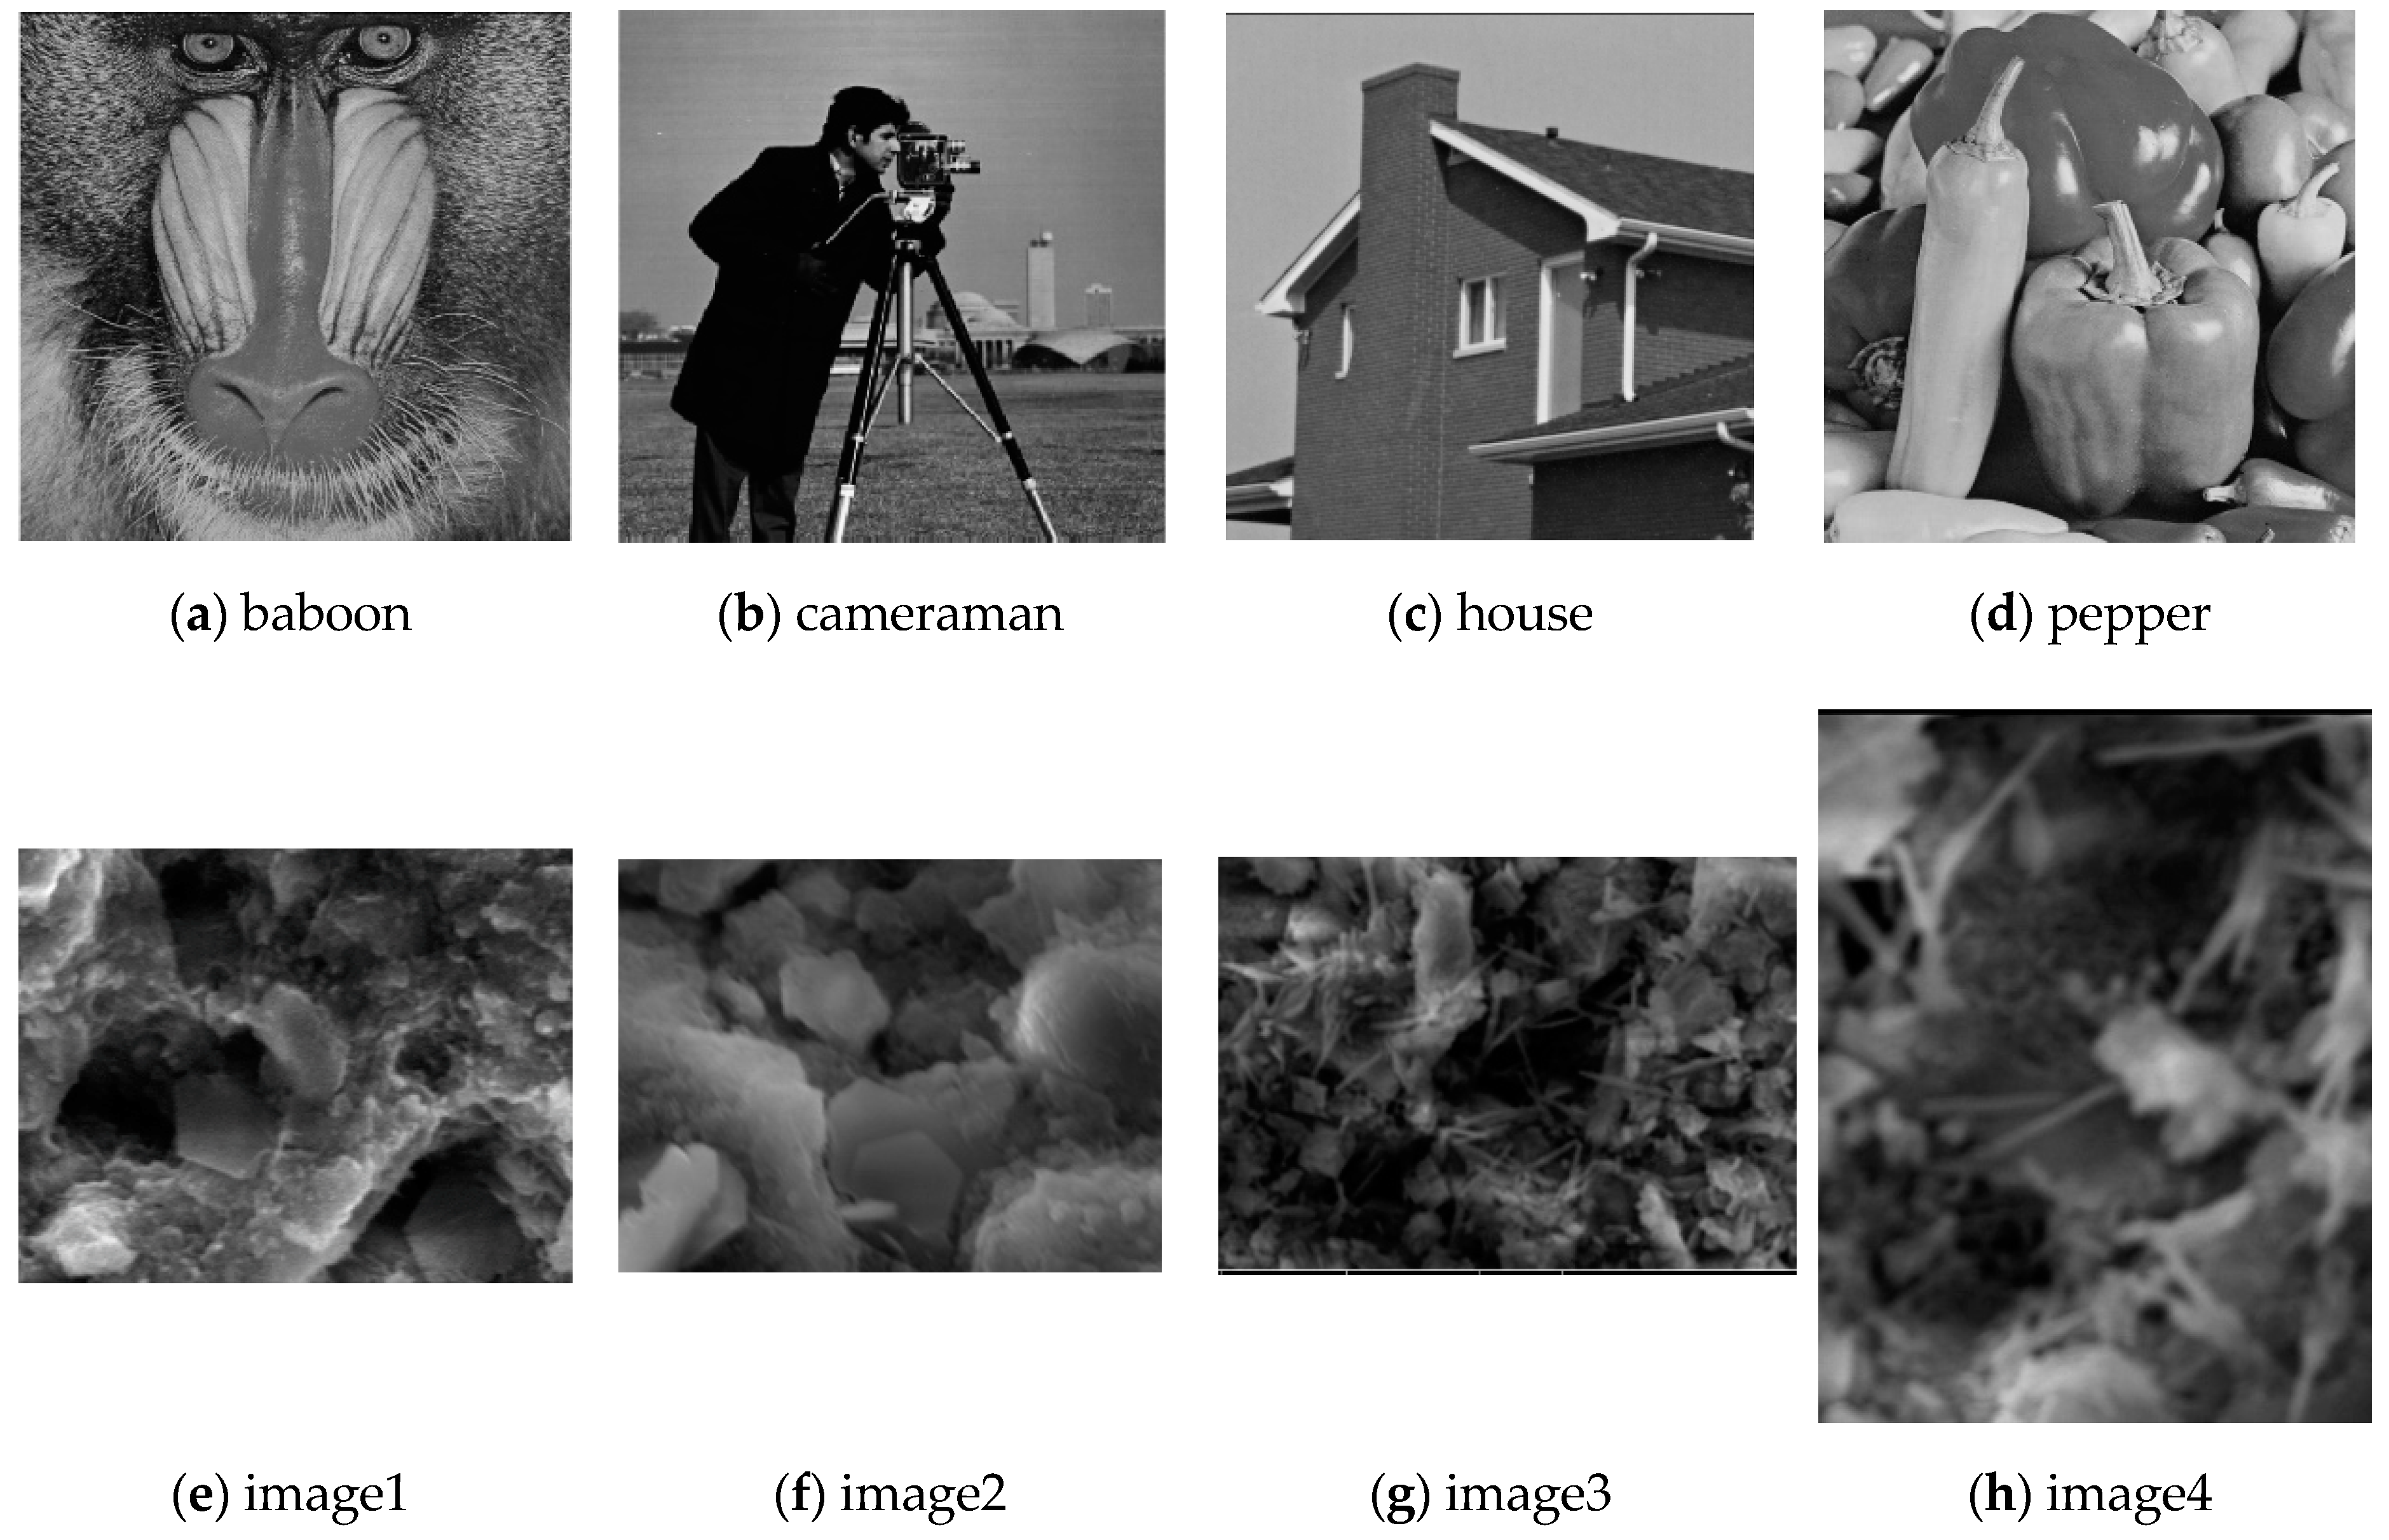
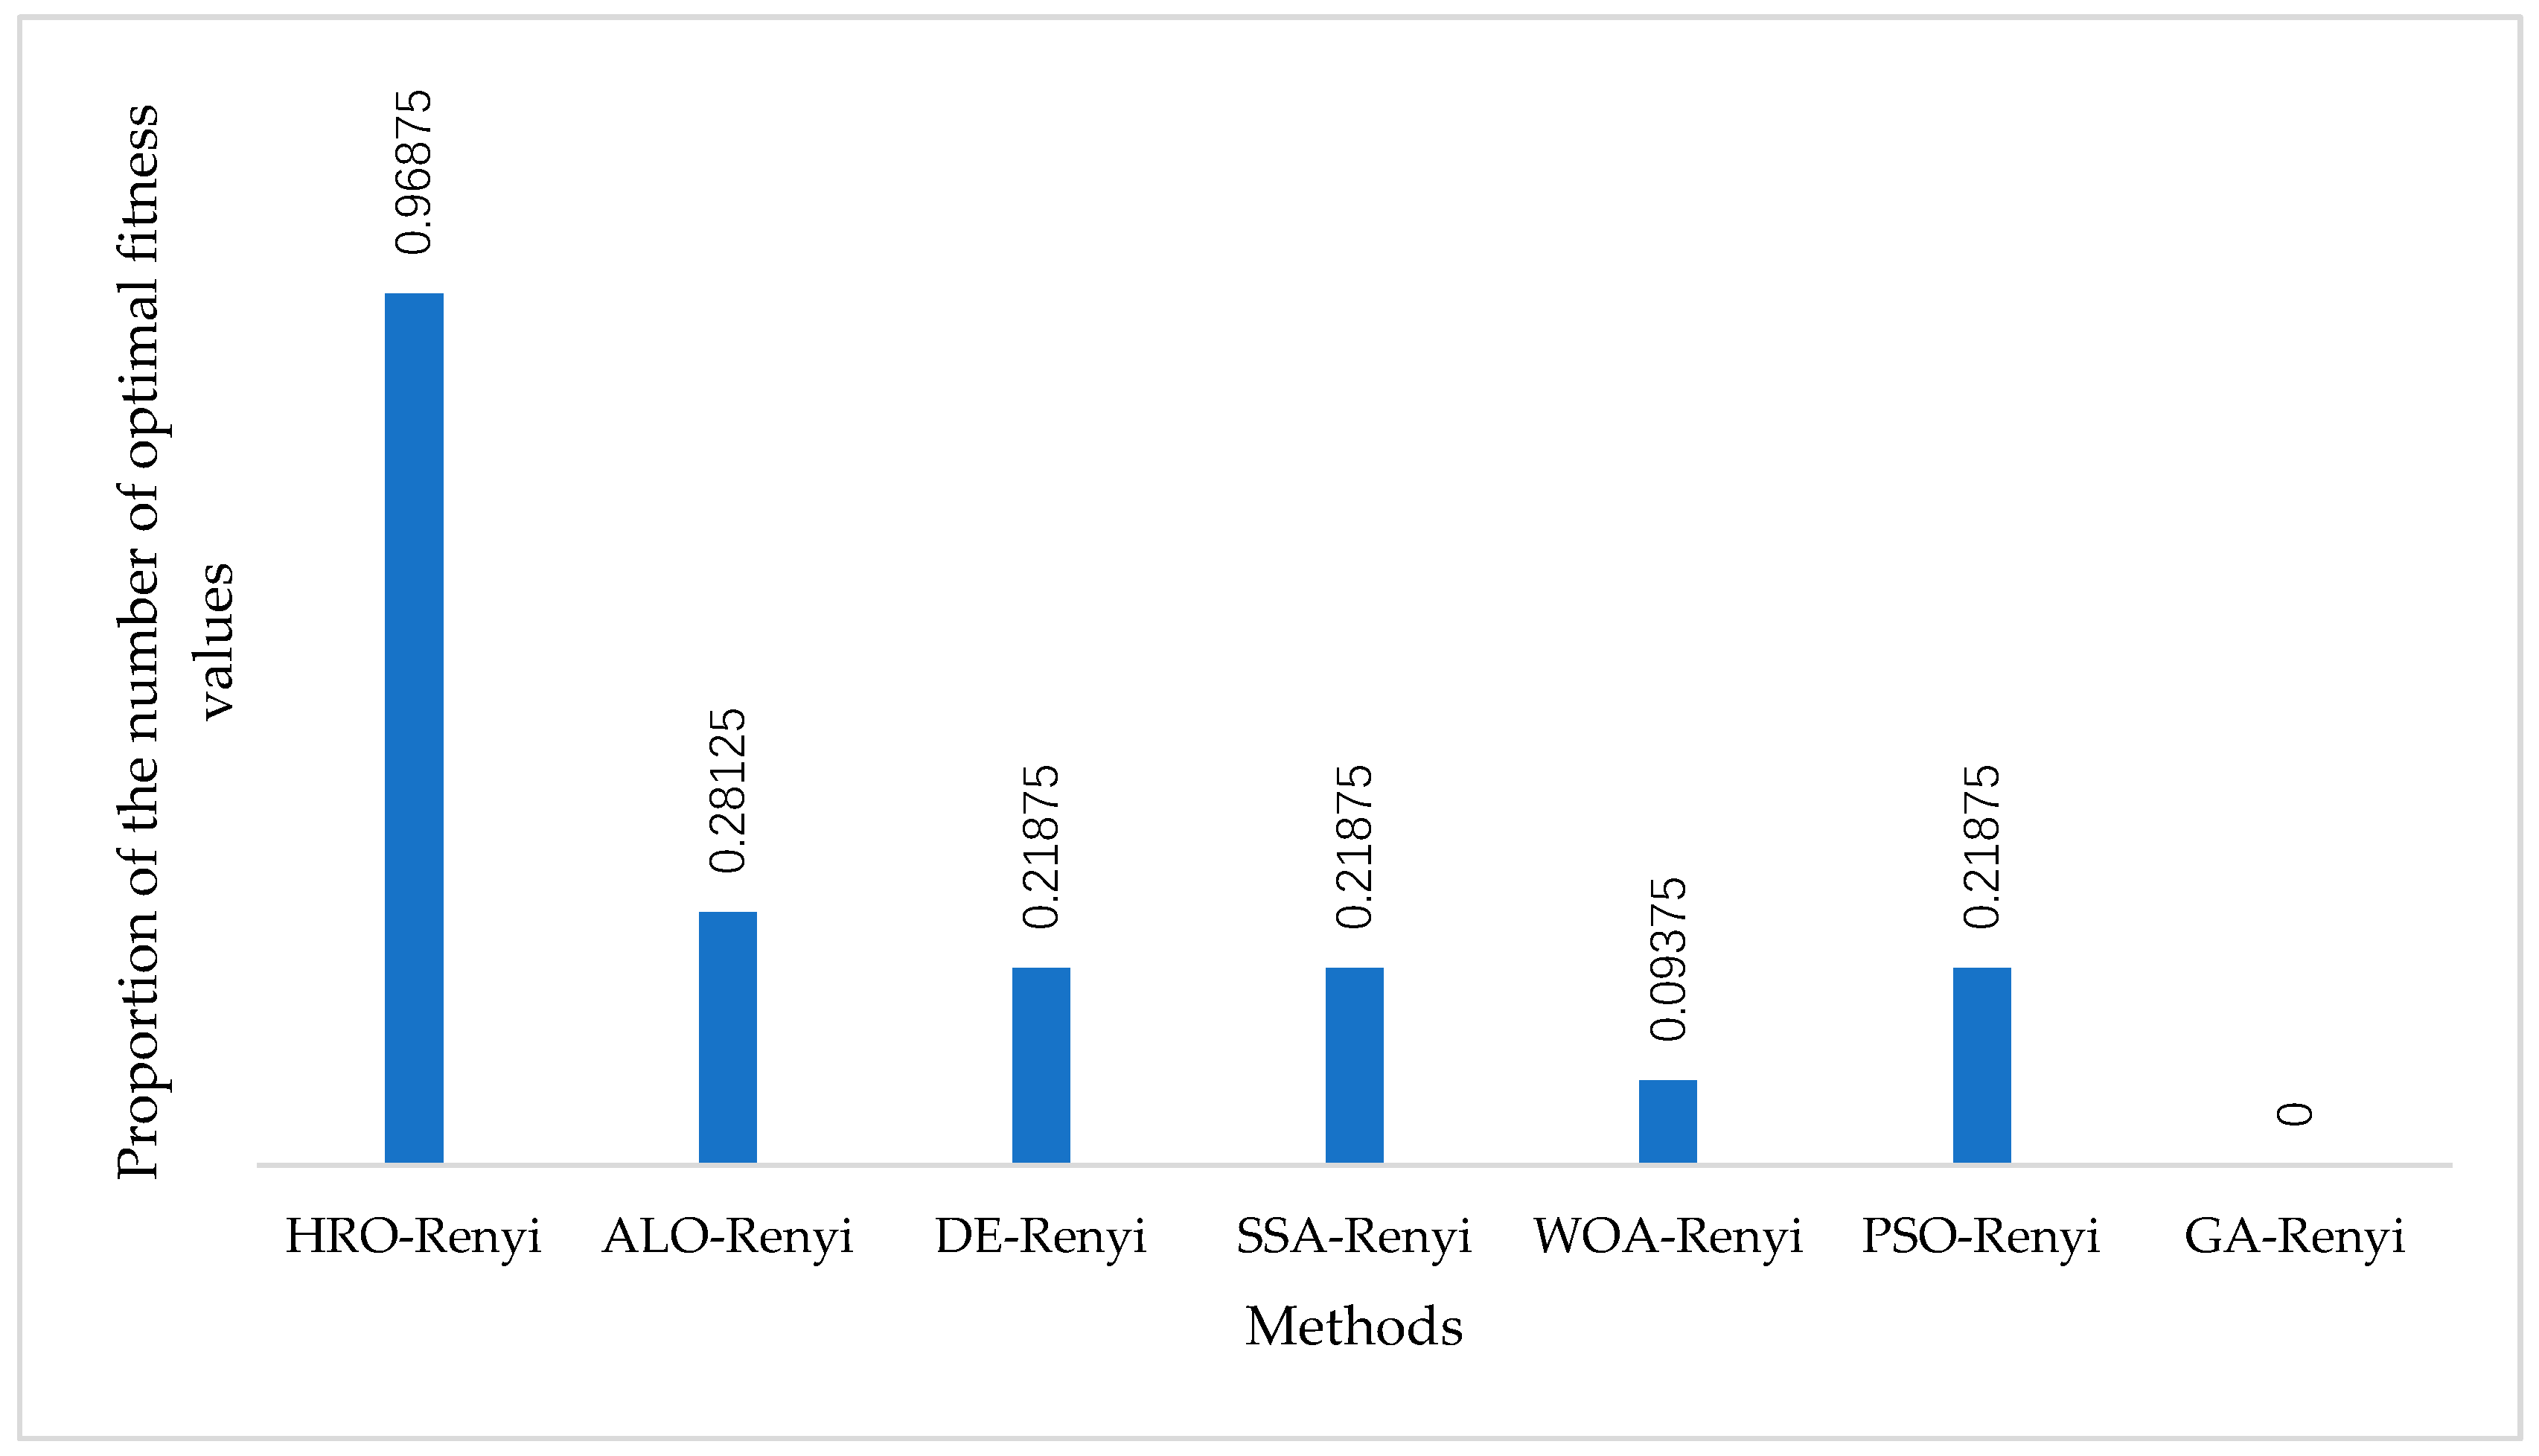
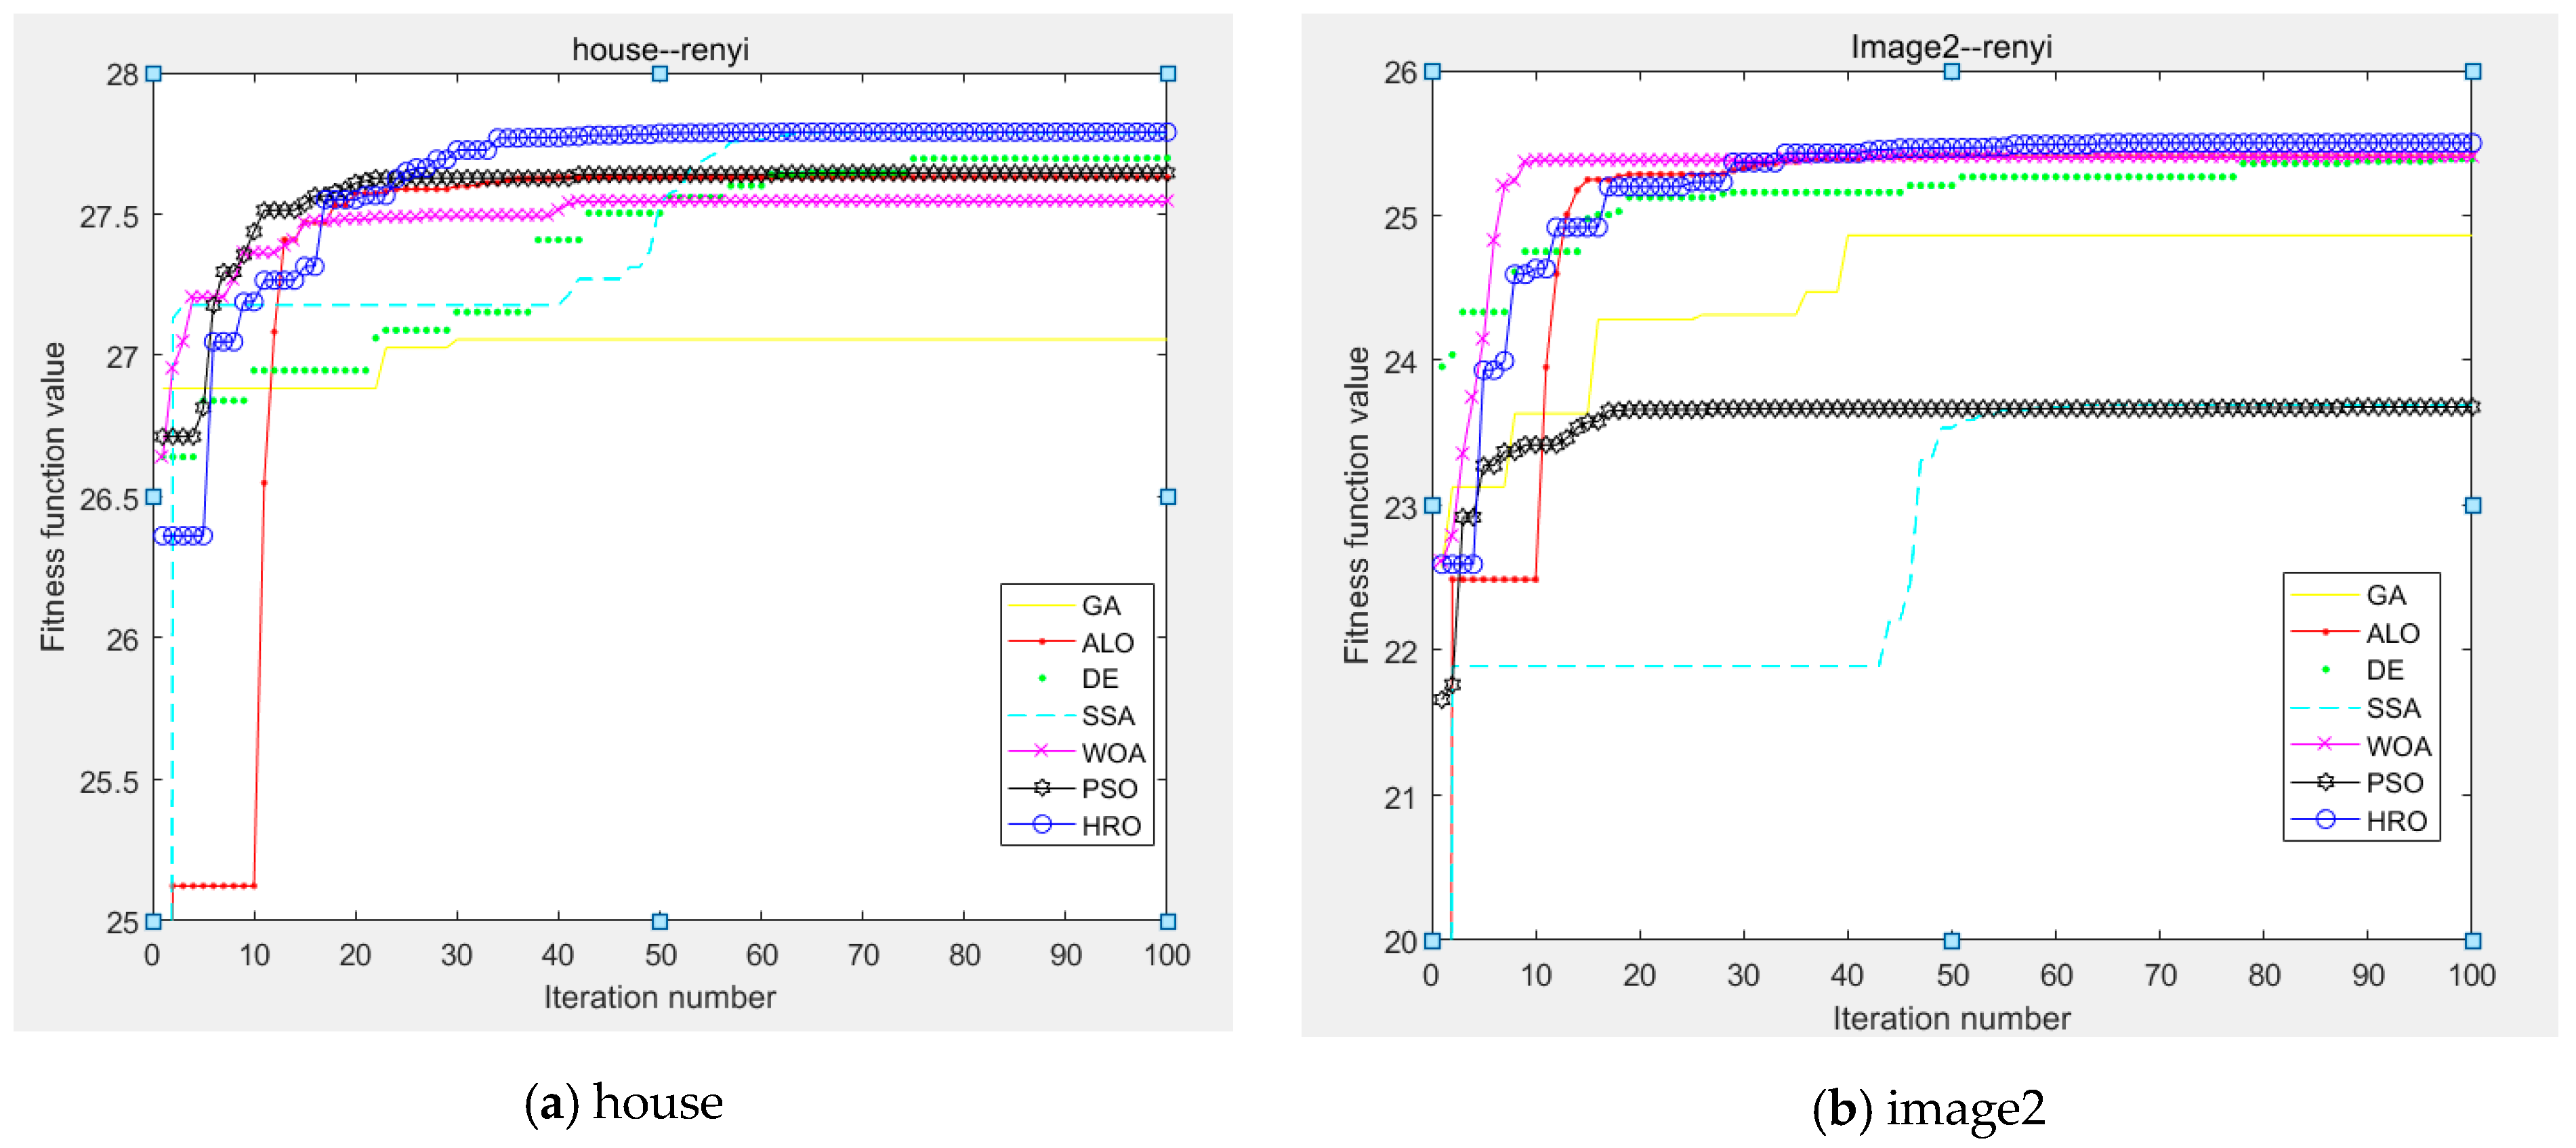
4. Simulation Results and Discussion

We implement the proposed approach by the language of matlab2015 on a personal computer with 8.00 G RAM, a CPU of Intel (R) Core (TM) i5-3470 @3.20 GHz, under Windows10 system. In order to show the advantages of this method, half of our test images are natural images of standard images and the other half are SEM images of cement. The cement image used in the experiment was taken from po42.5 cement produced by Hubei Huaxin Cement Plant, and the water cement ratio was 0.35, which was prepared according to the standard of GB / t17671-1999. Standard images are named “baboon”, “cameraman”, “house”, “pepper”, and we have named SEM images of cement “image1”, “image2”, “image3”, “image4”. The images are shown in Figure 3.
The paper also mentions some commonly used evolutionary algorithms or swarm intelligence algorithms to seek the best multiple thresholds. In order to make a purposeful and effective comparison, the selected threshold segmentation method is Renyi’s entropy, which is optimized by evolutionary algorithm or swarm intelligence optimization algorithm. The paper uses HRO-based Renyi’s entropy (HRO-Renyi). The threshold segmentation methods for comparison experiments are: GA-based Renyi’s entropy (GA-Renyi), PSO-based Renyi’s entropy (PSO-Renyi), DE-based Renyi’s entropy (DE-Renyi), ALO-based Renyi’s entropy (ALO-Renyi), WOA-based Renyi’s entropy (WOA-Renyi), SSA-based Renyi’s entropy (SSA-Renyi). GA, PSO, DE, ALO, WOA, and SSA all use their standard algorithms, parameters of algorithm are shown in Table 1. The number of iterations of all algorithms is 100 and the number of populations is 60. To test the stability of the algorithm, all algorithms are run 50 times. In this section, we provide some comparative experimental results, including some segmentation examples, performance evaluation tables, and function convergence graphs, which clearly demonstrate the advantages of the proposed method. Here we present 2-level, 4-level, 6-level, and 8-level thresholding for visual evaluation of natural images. Because the number of thresholds is too large, the exhaustive method is not applicable, our main interest is the optimization ability, which is mainly demonstrated through the fitness value of the objective function and stability analysis. For a further comparison, a multi-threshold segmentation method based on inter-class variance is also implemented in the paper, which is optimized using HRO (HRO-OTSU). The HRO-OTSU method is compared with the HRO-Renyi method, the accuracy of target segmentation is evaluated by peak signal to noise ratio (PSNR) and structural similarity index (SSIM).
PSNR is a widely used method of image quality evaluation index, which is based on the gray value of image pixels for statistics and average calculation. Although there may be a large deviation between the quality of some images or video quality evaluation and the quality of subjective perception, PSNR is still effective for most image quality evaluation.
Given an image I with a size of m     n and an image K after threshold segmentation, MSE is defined as Equation (18):
MSE = 1 mn i = 0 m 1 j = 0 n 1 [ I ( i , j ) K ( i , j ) ] 2
PSNR is defined as Equation (19):
PSRN = 10 log 10 ( MAX I 2 MSE )
M A X I 2 is the maximum possible pixel value of the image. If each pixel is represented by 8-bit binary, it is 255. Generally, if the pixel value is represented by B-bit binary, then M A X I = 2 B 1 . Generally, for uint8 data, the maximum pixel value is 255, and for floating-point data, the maximum pixel value is 1.
SSIM is an index to measure the similarity of two images. It measures the similarity of images from three aspects of luminance, contrast and structure. SSIM is defined as:
S S I M ( x , y ) = [ l ( x , y ) α · c ( x , y ) β · s ( x , y ) γ ]
l ( x , y ) = 2 μ x μ y + c 1 μ x 2 + μ y 2 + c 1
c ( x , y ) = 2 σ x σ y + c 2 σ x 2 + σ y 2 + c 2
s ( x , y ) = σ xy + c 3 σ x σ y + c 3
Where x and y are the two image blocks for comparison, μ x is the mean of x , μ y is the mean of y, σ x 2 is the variance of x , σ y 2 is the variance of y , σ xy is the covariance of x and y. c 1 = ( k 1 L ) 2 , c 2 = ( k 2 L ) 2 , c 3 = c 2 / 2 , c 1 , c 2 and c 3 are used to avoid the divisor of the equation being 0, L is the range of pixel values 2 B 1 , k 1 = 0.01 ,   k 2 = 0.03 , all are default values. α, β, γ is a positive number, weight used to adjust brightness, contrast and structural correlation. When α = β = γ = 1, the SSIM equation could be described as:
SSIM ( x , y ) = ( 2 μ x μ y + c 1 ) ( 2 σ x σ y + c 2 ) ( μ x 2 + μ y 2 + c 1 ) ( σ x 2 + σ y 2 + c 2 )
Finally, SSIM (x, y) of all image blocks is averaged to obtain SSIM of the whole image:
MSSIM ( X , Y ) = 1 M i = 1 M SSIM ( x i , y i )
Among them, M is the number of X and Y image blocks of the two compared images. If the SSIM is larger, it means that the difference between the output image and the original image is smaller, the image quality is better.

4.1. Quantitative Evaluation of Segmented Results

In order to quantitatively evaluate the performance of the threshold segmentation method based on HRO, this section uses the value of the indicator to explain the effectiveness and stability of the algorithm. The evaluation methods are: fitness value, standard deviation (STD), PSNR and SSIM, the higher the fitness value, the stronger the optimization ability, the lower the STD, the more stable the algorithm, and the higher the values of PSNR and SSIM, the better the segmentation effect.
Table 2 shows the average fitness values of HRO, GA, PSO, DE, ALO, WOA, and SSA in Renyi’s entropy after 50 experiments. k in the table represents the threshold-levels, and the bold numbers indicate that the corresponding algorithm’s average fitness value is the largest in the test image, that is, the optimization capability is the strongest.
The results in Table 2 display that HRO is better than other algorithms in finding the best threshold of Renyi’s entropy. As is known there are 32 groups of the optimal thresholds (8 test images, 4 groups of thresholds for each image). Among the best average fitness values shown in the table, HRO-Renyi gets the optimal average solution 31 times, which takes the first place, ALO-Renyi got the optimal solution 9 times, the difference between them is 22. The number of times that other algorithms have obtained the optimal solution is less than 10 times. Figure 4 shows the proportion of the optimal average fitness values of each method, with the horizontal axis representing each method and the longitudinal axis representing the proportion. It could be seen that the number of times HRO-Renyi has found the best fitness accounts for 96.875% of the total number of experiments. In most cases, HRO-Renyi can find the optimal solution stably. In eight images, when the threshold level k = 2, all methods except GA-Renyi can find the optimal solution. When the threshold level k = 4, HRO-Renyi can get the optimal average fitness value in all images, and ALO-Renyi can get the optimal solution in some images, and the performance of other algorithms begins to decline. When the threshold-level k=6, the average fitness value obtained by HRO-Renyi in the seven images is the largest. Although WOA-Renyi performs best in “image3“, the average fitness value of HRO-Renyi is close to WOA-Renyi, the difference is only 0.0891. When the threshold-level k = 8, the average optimal fitness value of HRO-Renyi is the maximum in the eight images.
When the threshold-level k = {2,4}, all the optimization algorithms have good performance and can get better solutions, but when the number of thresholds increases, HRO is more stable and the optimization ability is better than other methods. HRO can effectively find the optimal threshold.
Figure 5 shows the convergence curve of the optimal fitness values with 8 thresholds (“house” and “image2”). These threshold methods are HRO-Renyi, DE-Renyi, PSO-Renyi, SSA-Renyi, ALO-Renyi, WOA-Renyi, GA-Renyi. It could be seen that some algorithms are prone to fall into a local optimum or not converge to the maximum entropy, resulting in a lower average fitness value. However, the HRO-based threshold segmentation algorithm has achieved the maximum fitness value in these two cases, indicating that the algorithm is more effective than other algorithms. The accuracy of HRO-Renyi to find the optimal solution is the highest among all methods, but the number of iterations required to find the optimal solution is more than that of PSO-Renyi and ALO-Renyi, it can converge at about 40 to 50 iterations. When the number of iterations is 50, the optimal solution obtained by HRO-Renyi is already better than other methods, DE-Renyi and SSA-Renyi need more iterations to converge, they probably need about 70 iterations, while the number of iterations required for convergence of WOA-Renyi and GA-Renyi is close to HRO-Renyi, but the accuracy is not as good as HRO-Renyi.
In this section, STD is used to measure the stability of each optimization algorithm in each threshold segmentation algorithm. STD is the arithmetic ordinary root of variance, and the average of the distance (deviation from average) of each data deviation. STD can reflect the dispersion degree of a data set.
Table 3 represents the STD of each optimization algorithm after 50 tests in Renyi’s entropy (Bold is best). When the STD is smaller, the algorithm is more stable. After the minimum STD of all methods is calculated, HRO-Renyi has the lowest STD in 28 of 32 experiments, accounting for 87.5% of all experiments, the minimum STD times of other methods are: ALO-Renyi has 12 times, DE-Renyi has 8 times, SSA-Renyi has 6 times, WOA-Renyi has 2 times, PSO-Renyi has 9 times, and GA-Renyi has 0 times. When the threshold-level is 2, except for WOA-Renyi, SSA-Renyi, and GA-Renyi, other methods have a STD of 0 or close to 0 in most test images, which means that the optimal solutions obtained by these methods in 50 experiments are all equal and have strong stability. As the number of thresholds increases, the STD increases, the optimization algorithm easily falls into a local optimum, which leads to the instability of the algorithm. As could be seen from the Table 3, when the threshold-levels k = {2, 4}, STD of HRO-Renyi method is mostly 0 or close to 0. When the threshold-levels k = {6, 8}, the maximum STD is 0.176. Compared with other algorithms, HRO has the minimum STD and the best stability.
It has been manifested above that the HRO-Renyi method has achieved good results in terms of the best fitness function and algorithm stability. HRO-OTSU is also used to segment the experimental image, quantitative results are defined by PSNR, SSIM. To improve the richness of experimental results, the experimental image is divided into two parts in this discussion, one is the image in the standard data set, and the other is the SEM image of cement.
The optimal PSNR and SSIM values obtained by HRO-OTSU and HRO-Renyi are given in Table 4. It could be found that, in terms of PNSR, performance of HRO-Renyi on the standard data set is basically the same as that of HRO-OTSU. However, on the SEM image of cement data set, no matter if threshold-levels k = {2, 4, 6, 8}. HRO-Renyi is larger than HRO-OTSU, which shows that HRO-Renyi has good robustness and good segmentation quality. In terms of SSIM, HRO-Renyi performs slightly better than HRO-OTSU on the standard data set, but when threshold-levels k = {6, 8}, the former is often larger than the latter, and on the SEM image of cement data set, regardless of whether threshold-levels k = {6, 8}, HRO-Renyi is larger than HRO-OTSU, which shows that performance of HRO-Renyi in multi-dimensional threshold segmentation is better than HRO-OTSU. Therefore, the HRO-Renyi method is more robust and more suitable for multi-dimensional threshold segmentation of SEM images of cement.

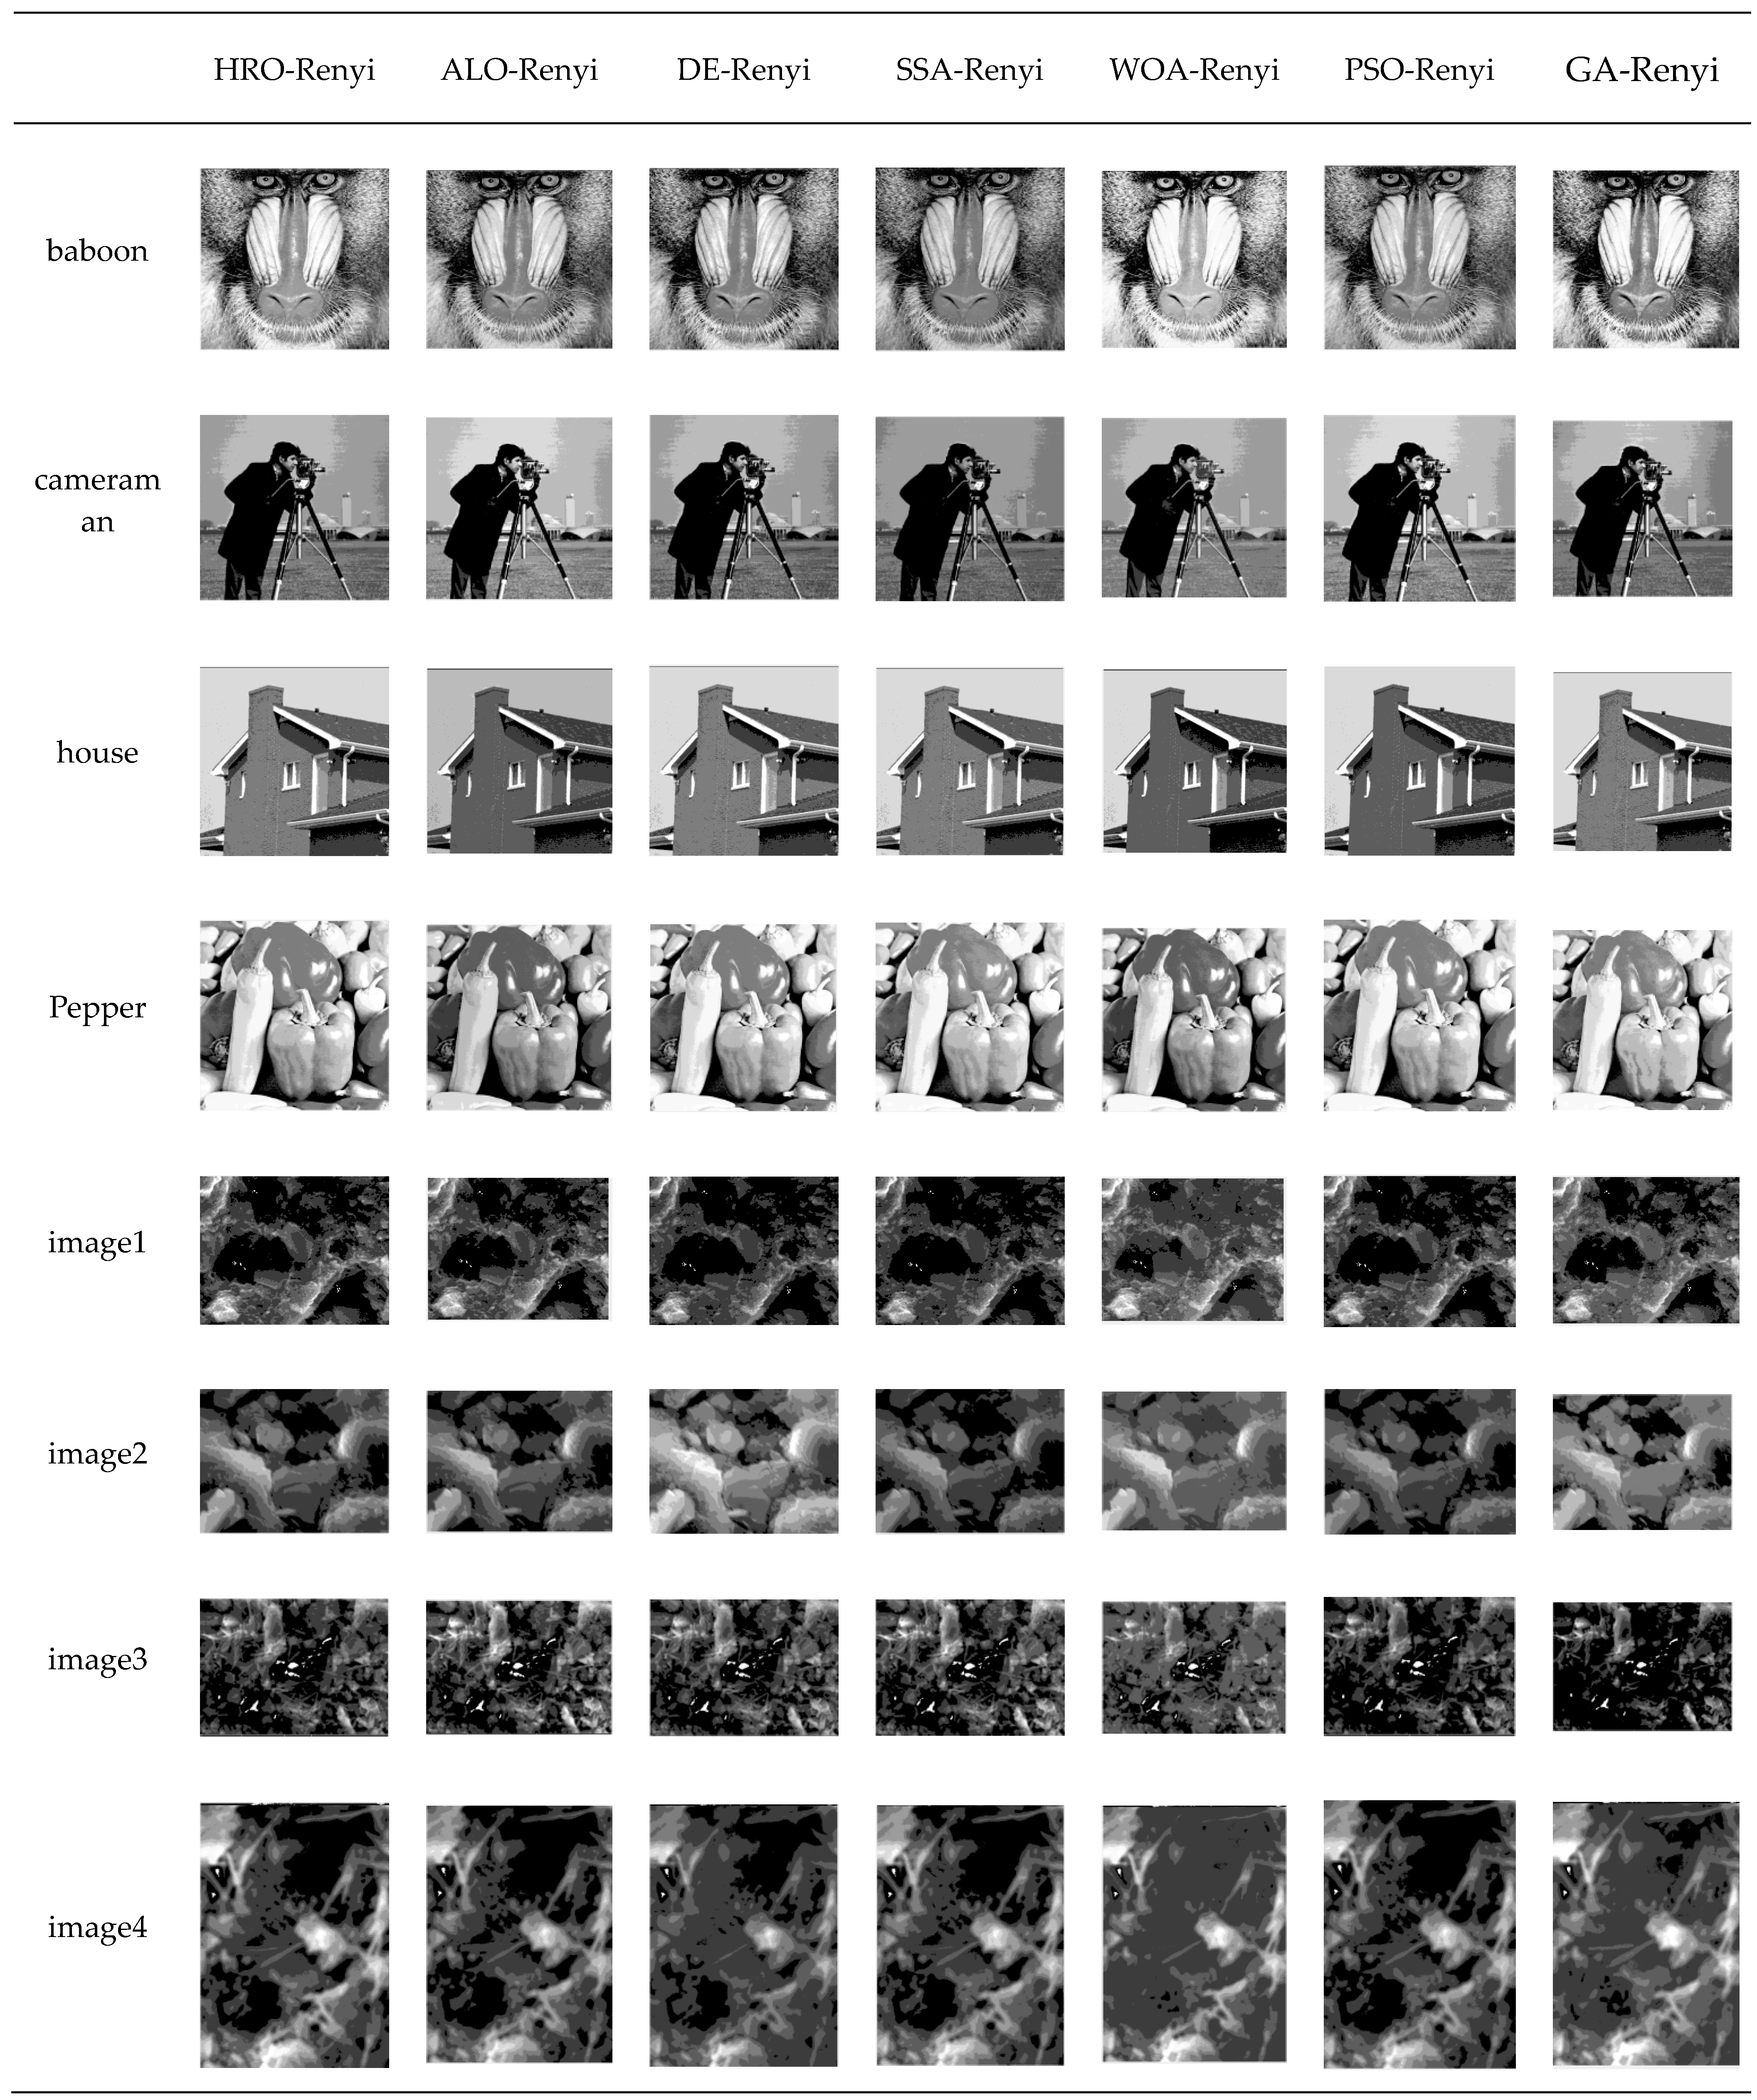
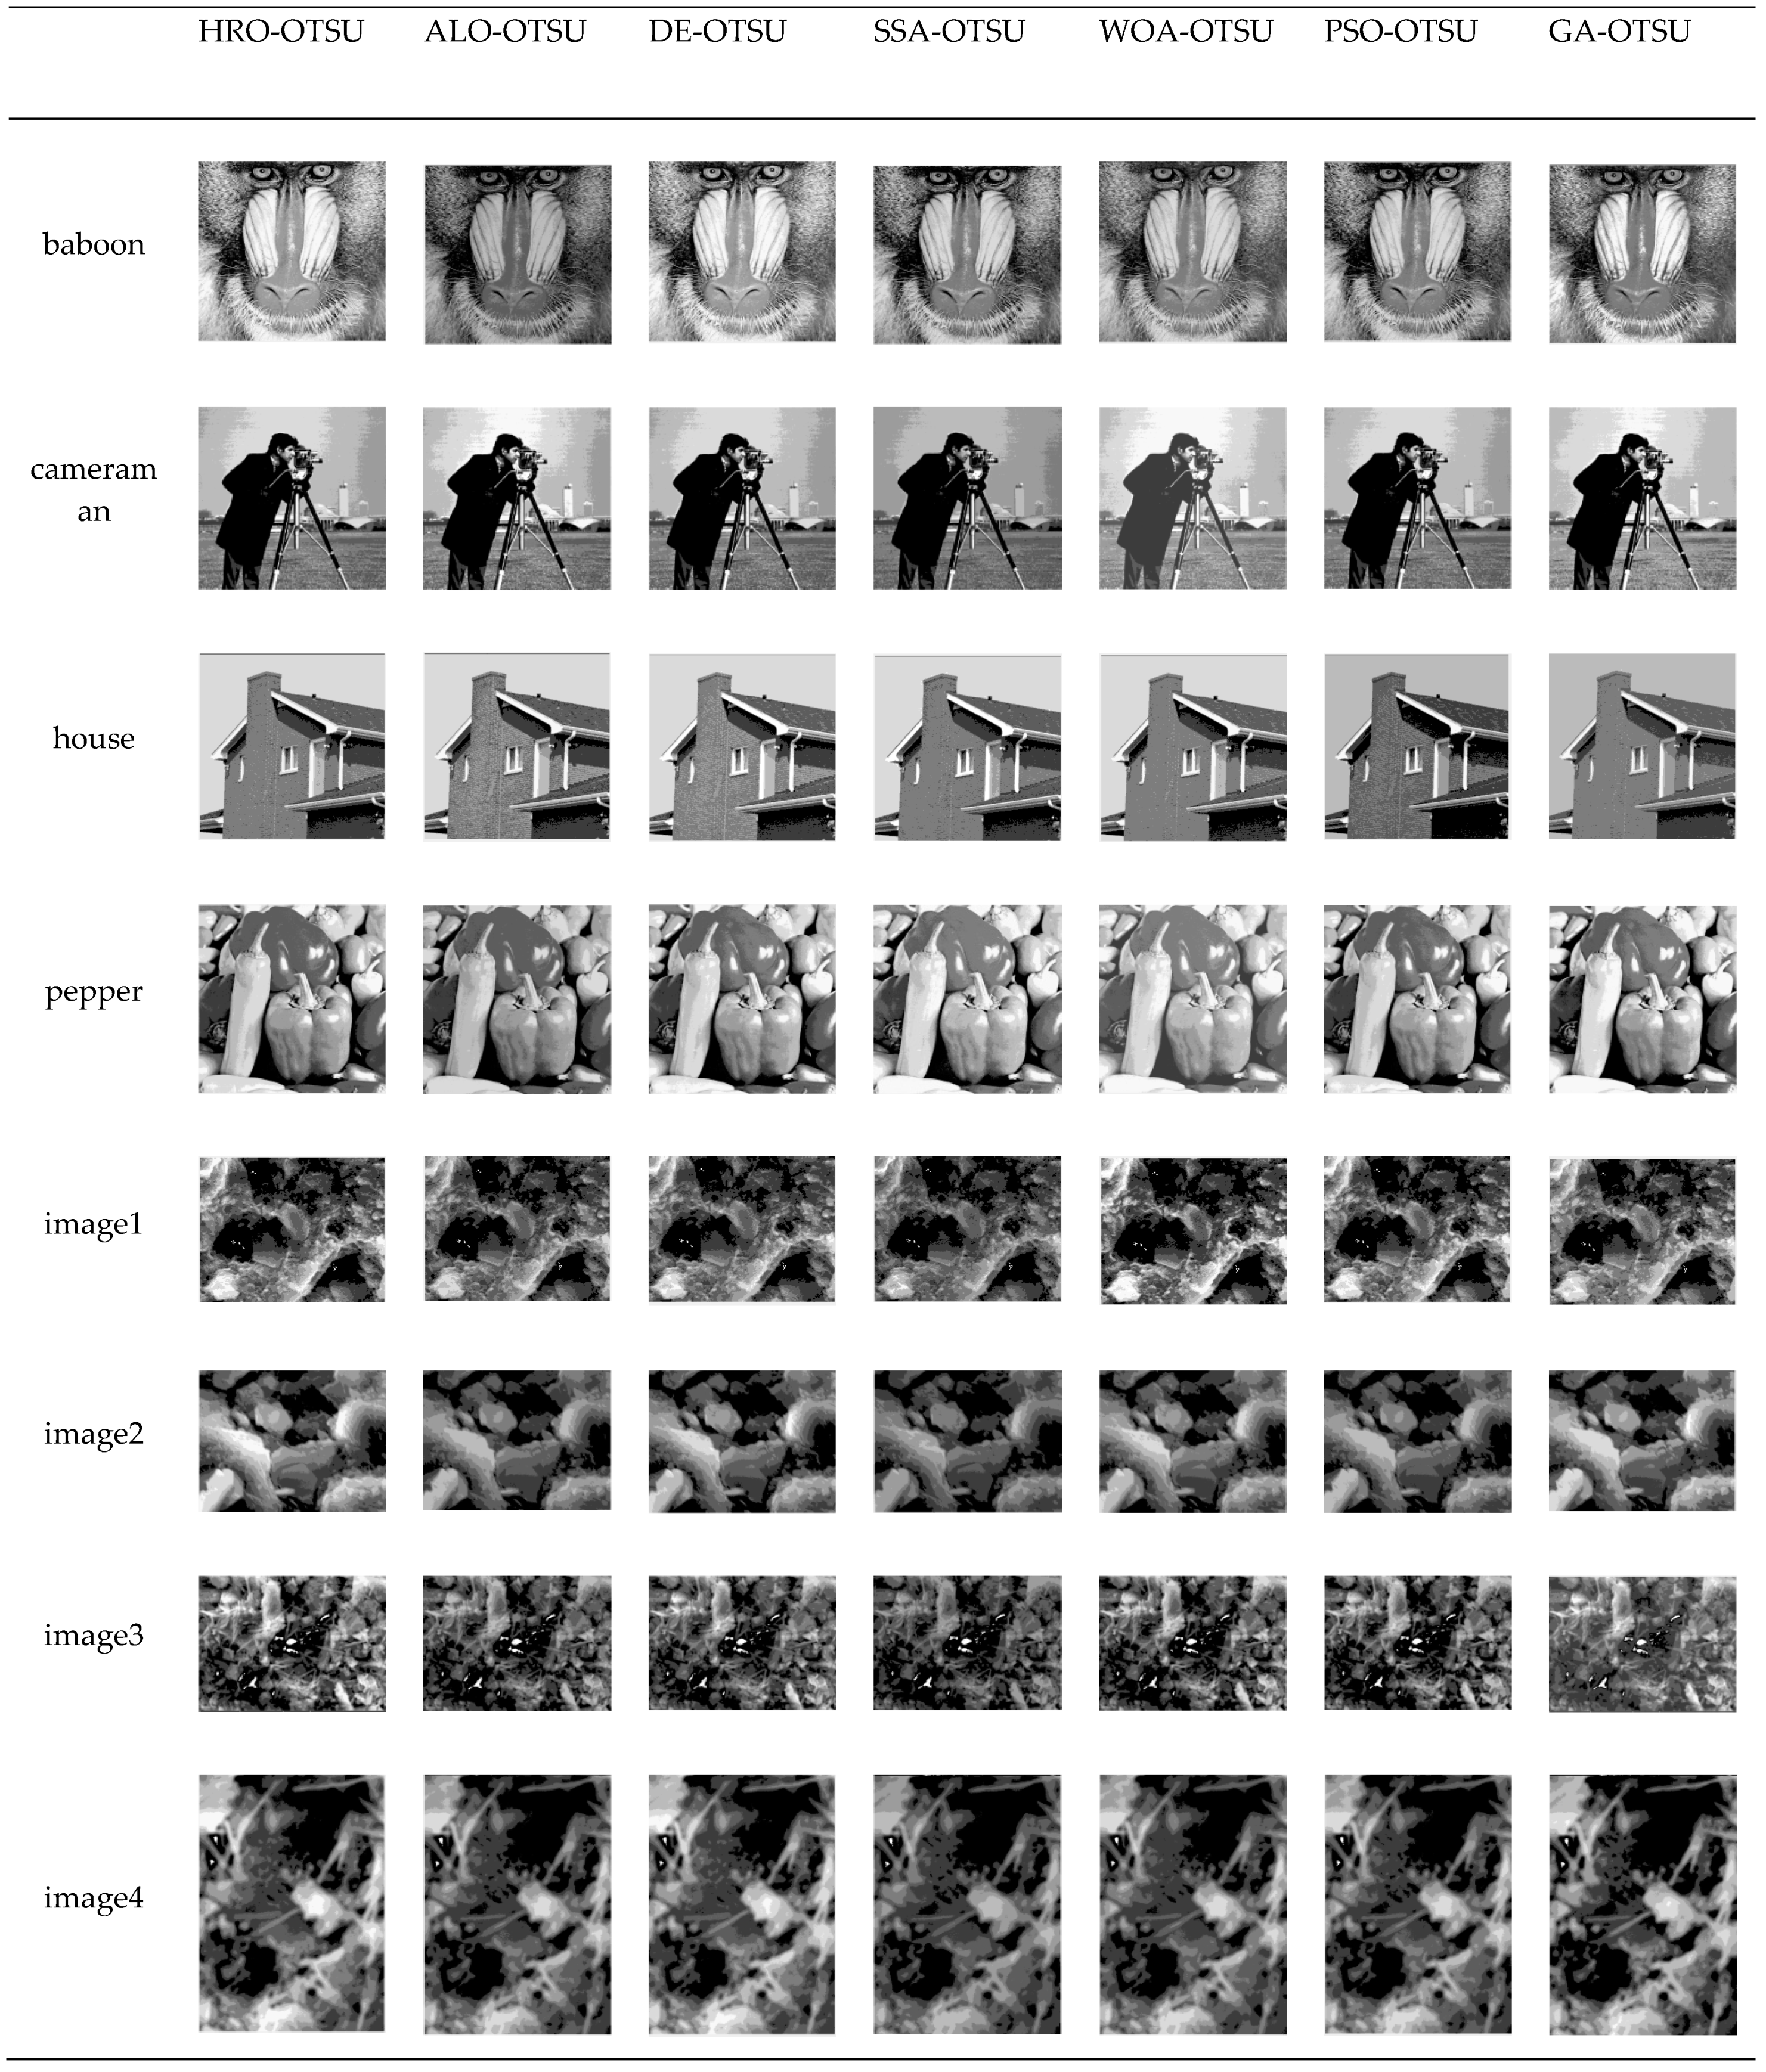
4.2. Visual Evaluation of the Segmented Image

The following Figure 6 and Figure 7 are the segmented images with threshold-level k = 8, through observation, we could obtain that our proposed method can effectively segment images. Hydration products could be separated in the microscopic image of cement.
In Figure 6, when the threshold level is 8, in the test image “Baboon”, the image segmented by ALO-Renyi, DE-Renyi, SSA-Renyi, PSO-Renyi is darker overall, the color and contrast difference between the baboon’s nose and the surrounding area is not very obvious. At the same time, the images segmented by WOA-Renyi and GA-Renyi are brighter overall. The areas of the baboon face are not distinguished clearly, but the overall image of the “Baboon” segmented by HRO-Renyi is moderate in brightness. The area of the image has obvious contrast; in the test image “cameraman”, the boundary between the person and the background in the segmented image by HRO-Renyi is clearer, and the color contrast between the regions is obvious; in the test images “house” and “pepper”, compared with other methods, the segmented images by HRO-Renyi has better visual effects and stronger layering. Therefore, HRO-Renyi has better perceptual quality and more obvious contrast on standard image datasets than other algorithms as a whole.
In the SEM image of cement “image1”, the microscopic cement material in the image divided by WOA-Renyi shows a large-area adhesion phenomenon, which makes it difficult to distinguish the components of each material. Images segmented by ALO-Renyi, DE-Renyi, SSA-Renyi, PSO-Renyi, and GA-Renyi contain relatively little cement micro-materials, while the images segmented by HRO-Renyi, not only are the cement microscopic substances easy to identify, but they are rich in variety and quantity. In the SEM image of cement “image2, image3”, the images segmented by HRO-Renyi contain the most cement microscopic matter, and it does not show blurring. Therefore, for the SEM image of cement, the image segmented by HRO-Renyi has a clear sense of hierarchy and contains rich and recognizable cement microscopic substances. In the SEM image of cement “image4”, it could be seen that HRO-Renyi is the only one that can clearly segment cement hydrate and pores. Images segmented by WOA-Renyi and GA-Renyi are relatively fuzzy, where substances cannot be classified. When ALO-Renyi, DE-Renyi, SSA-Renyi, and PSO-Renyi are used to segment cement SEM images, it is easy to segment some dark light into pores, although they also separate the pores of cement.
In Figure 7, HRO-OTSU can also segment the hydration products and pores in the cement. However, divided by HRO-OTSU, the SEM image of cement “image1, image2, image3, image4” still has some noise locally. HRO-Renyi performs better than HRO-OTSU in the PNSR and SSIM of SEM images of cement, which means proves HRO-Renyi is more effective.

5. Conclusions

In the paper, a multi-level image segmentation technique using HRO-based Renyi’s entropy algorithm for microscopic images of cement is proposed. Taking Renyi’s entropy as the objective function, HRO is used to search the optimal threshold values and compared with other optimization algorithms (GA, PSO, DE, ALO, WOA, SSA), four standard image sets and four SEM images of cement are selected, and the threshold-levels are 2-level, 4-level, 6-level, and 8-level. After 50 experiments, the experimental results are evaluated from the best fitness value and STD. It could be seen that the performance of HRO is better than other optimization algorithms in terms of average optimal fitness value and STD. Further, HRO-OTSU is employed for comparison experiments, and the results show that HRO-Renyi performs better in terms of PSNR and SSIM in standard images and microscopic images of cement, indicating that it is more suitable for threshold segmentation. In the future, chaotic strategy and other local search strategies like Levy flight could be also used to develop HRO algorithm for image segmentation and other applications. In addition, the combination of HRO and other evolutionary algorithms is also the interesting research direction.

Author Contributions

Conceptualization, W.L. and Z.Y.; methodology, Y.H.; software, Y.H. and W.C.; validation, Y.H. and W.C.; formal analysis, Y.H.; investigation, Y.H. and S.Y.; resources, W.L.; data curation, Y.H. and W.C.; writing—original draft preparation, Y.H.; writing—review and editing, Z.Y., X.C. and I.F.; project administration, W.L.; funding acquisition, W.L. and Z.Y.; visualization, Y.H.; supervision, W.L. and Z.Y. All authors have read and agreed to the published version of the manuscript.

Funding

This research is supported by the National Natural Science Foundation of China (61772180, 61602162), technological innovation project of Hubei Province 2019 (2019AAA04), the Hubei Provincial Natural Science Foundation of China (2015CFB594), State Key Laboratory of Geo-Information Engineering (SKLGIE2014-M-3-3), and the Green Industry Leadership Program of Hubei University of Technology (YXQN2017002).

Conflicts of Interest

The authors declare no conflict of interest.

References

  1. Zhan, Y.; Zhang, G. An Improved OTSU Algorithm Using Histogram Accumulation Moment for Ore Segmentation. Symmetry 2019, 11, 431. [Google Scholar] [CrossRef] [Green Version]
  2. Sun, H.; Yang, X.; Gao, H. A spatially constrained shifted asymmetric Laplace mixture model for the grayscale image segmentation. Neurocomputing 2019, 331, 50–57. [Google Scholar] [CrossRef]
  3. Bai, X.; Wang, Y.; Liu, H.; Guo, S. Symmetry information based fuzzy clustering for infrared pedestrian segmentation. IEEE Trans. Fuzzy Syst. 2017, 26, 1946–1959. [Google Scholar] [CrossRef]
  4. Yeom, S. Multi-level segmentation of infrared images with region of interest extraction. Int. J. Fuzzy Log. Intell. Syst. 2016, 16, 246–253. [Google Scholar] [CrossRef] [Green Version]
  5. Bai, J.; Jiang, H.; Li, S.; Ma, X. NHL Pathological Image Classification Based on Hierarchical Local Information and GoogLeNet-Based Representations. BioMed Res. Int. 2019, 2019, 1–13. [Google Scholar] [CrossRef] [PubMed] [Green Version]
  6. Wang, G.; Li, W.; Zuluaga, M.A.; Pratt, R.; Patel, P.A.; Aertsen, M.; Doel, T.; David, A.L.; Deprest, J.; Ourselin, S.; et al. Interactive medical image segmentation using deep learning with image-specific fine tuning. IEEE Trans. Med. Imaging 2018, 37, 1562–1573. [Google Scholar] [CrossRef]
  7. Li, J.; Luo, W.; Wang, Z.; Fan, S. Early detection of decay on apples using hyperspectral reflectance imaging combining both principal component analysis and improved watershed segmentation method. Postharvest Biol. Technol. 2019, 149, 235–246. [Google Scholar] [CrossRef]
  8. Wei, Y.; Wei, L.; Ji, T.; Hu, H. A Novel Image Classification Approach for Maize Diseases Recognition. Recent Adv. Electr. Electron. Eng. 2020, 13, 331–339. [Google Scholar]
  9. Krish, R.P.; Fierrez, J.; Ramos, D.; Alonso-Fernandez, F.; Bigun, J. Improving automated latent fingerprint identification using extended minutia types. Inf. Fusion 2019, 50, 9–19. [Google Scholar] [CrossRef] [Green Version]
  10. Hong, G.; Chao, Z.; Lin, L.; Wenting, L. Sub-pixel extraction of laser stripe in complex background. Opto-Electron. Eng. 2019, 46, 180457. [Google Scholar] [CrossRef]
  11. Pham, T.X.; Siarry, H.; Oulhadj, H. Integrating fuzzy entropy clustering with an improved PSO for MRI brain image segmentation. Appl. Soft Comput. 2018, 65, 230–242. [Google Scholar] [CrossRef]
  12. Liu, W.; Shi, H.; He, X.; Pan, S.; Ye, Z.; Wang, Y. An application of optimized Otsu multi-threshold segmentation based on fireworks algorithm in cement SEM image. J. Algorithms Comput. Technol. 2018, 13, 1–12. [Google Scholar] [CrossRef] [Green Version]
  13. Igarashi, S.; Kawamura, M.; Watanabe, A. Analysis of cement pastes and mortars by a combination backscatter-based SEM image analysis and calculations based on the Powers model. Cem. Concr. Compos. 2004, 26, 977–985. [Google Scholar] [CrossRef] [Green Version]
  14. Otsu, N. A Threshold Selection Method from Gray-Level Histograms. IEEE Trans. Syst. Man Cybern. 1979, 9, 62–66. [Google Scholar] [CrossRef] [Green Version]
  15. Kapur, J.N. Maximum Entropy Models in Science and Engineering; John Wiley & Sons, Wiley Eastern Limited: New Delhi, India, 1989; pp. 333–334. [Google Scholar]
  16. Sahoo, P.; Wilkins, C.; Yeager, J. Threshold selection using Renyi’s entropy. Pattern Recognit. 1997, 30, 71–84. [Google Scholar] [CrossRef]
  17. Tsallis, C.; Levy, S.V.F.; Souza, A.M.C.; Maynard, R. Statistical-Mechanical Foundation of the Ubiquity of Lévy Distributions in Nature. Phys. Rev. Lett. 1995, 75, 3589–3593. [Google Scholar] [CrossRef] [Green Version]
  18. Mittal, H.; Saraswat, M. An optimum multi-level image thresholding segmentation using non-local means 2D histogram and exponential Kbest gravitational search algorithm. Eng. Appl. Artif. Intell. 2018, 71, 226–235. [Google Scholar] [CrossRef]
  19. Oliva, D.; Hinojosa, S.; Elaziz, M.A.; Ortega-Sánchez, N. Context based image segmentation using antlion optimization and sine cosine algorithm. Multimed. Tools Appl. 2018, 77, 25761–25797. [Google Scholar] [CrossRef]
  20. Wang, W.; Zhang, J.; Wu, W.; Zhou, S. An Automatic Approach for Retinal Vessel Segmentation by Multi-Scale Morphology and Seed Point Tracking. J. Med. Imaging Health Inform. 2018, 8, 262–274. [Google Scholar] [CrossRef]
  21. Jiang, H.; Zhao, D.; Zheng, R.; Ma, X. Construction of Pancreatic Cancer Classifier Based on SVM Optimized by Improved FOA. BioMed Res. Int. 2015, 2015, 1–12. [Google Scholar] [CrossRef] [Green Version]
  22. Tang, Z.; Srivastava, G.; Liu, S. Swarm intelligence and ant colony optimization in accounting model choices. J. Intell. Fuzzy Syst. 2020, 38, 2415–2423. [Google Scholar] [CrossRef]
  23. Srivastava, G.; Citulsky, E.; Tilbury, K. The Effects of Ant Colony Optimization on the Anonymization of Graphs. J. Comput. (JoC) 2016, 5, 92–101. [Google Scholar]
  24. Zhang, X.; Peng, J.; Hu, H.; Lin, K.-C.; Wang, J. Target attraction-based ant colony algorithm for mobile robots in rescue missions. Int. J. Model. Identif. Control 2012, 17, 133–142. [Google Scholar] [CrossRef] [Green Version]
  25. Reddy, G.T.; Reddy, M.P.K.; Lakshmanna, K.; Rajput, D.S.; Kaluri, R.; Srivastava, G. Hybrid genetic algorithm and a fuzzy logic classifier for heart disease diagnosis. Evol. Intell. 2019, 2019, 1–12. [Google Scholar] [CrossRef]
  26. Chen, W.; Hong, H.; Panahi, M.; Shahabi, H.; Wang, Y.; Shirzadi, A.; Pirasteh, S.; Alesheikh, A.A.; Khosravi, K.; Panahi, S.; et al. Spatial Prediction of Landslide Susceptibility Using GIS-Based Data Mining Techniques of ANFIS with Whale Optimization Algorithm (WOA) and Grey Wolf Optimizer (GWO). Appl. Sci. 2019, 9, 3755. [Google Scholar] [CrossRef] [Green Version]
  27. Strumberger, I.; Bacanin, N.; Tuba, M.; Tuba, E. Resource Scheduling in Cloud Computing Based on a Hybridized Whale Optimization Algorithm. Appl. Sci. 2019, 9, 4893. [Google Scholar] [CrossRef] [Green Version]
  28. Moayedi, H.; Kalantar, B.; Foong, L.K.; Bui, D.T.; Motevalli, A. Application of Three Metaheuristic Techniques in Simulation of Concrete Slump. Appl. Sci. 2019, 9, 4340. [Google Scholar] [CrossRef] [Green Version]
  29. Lang, C.; Jia, H. Kapur’s Entropy for Color Image Segmentation Based on a Hybrid Whale Optimization Algorithm. Entropy 2019, 21, 318. [Google Scholar] [CrossRef] [Green Version]
  30. Borjigin, S.; Sahoo, P.K. Color image segmentation based on multi-level Tsallis–Havrda–Charvát entropy and 2D histogram using PSO algorithms. Pattern Recognit. 2019, 92, 107–118. [Google Scholar] [CrossRef]
  31. Qin, J.; Shen, X.; Mei, F.; Fang, Z. An Otsu multi-thresholds segmentation algorithm based on improved ACO. J. Supercomput. 2018, 75, 955–967. [Google Scholar] [CrossRef]
  32. Kandhway, P.; Bhandari, A.K. A Water Cycle Algorithm-Based Multilevel Thresholding System for Color Image Segmentation Using Masi Entropy. Circuits Syst. Signal Process. 2018, 38, 3058–3106. [Google Scholar] [CrossRef]
  33. Suresh, S.; Lal, S. An efficient cuckoo search algorithm based multilevel thresholding for segmentation of satellite images using different objective functions. Expert Syst. Appl. 2016, 58, 184–209. [Google Scholar] [CrossRef]
  34. Elaziz, M.A.; Lu, S. Many-objectives multilevel thresholding image segmentation using knee evolutionary algorithm. Expert Syst. Appl. 2019, 125, 305–316. [Google Scholar] [CrossRef]
  35. Tarkhaneh, O.; Shen, H. An adaptive differential evolution algorithm to optimal multi-level thresholding for MRI brain image segmentation. Expert Syst. Appl. 2019, 138, 112820. [Google Scholar] [CrossRef]
  36. Dhar, S.; Kundu, M.K. A novel method for image thresholding using interval type-2 fuzzy set and Bat algorithm. Appl. Soft Comput. 2018, 63, 154–166. [Google Scholar] [CrossRef]
  37. Ye, Z.; Ma, L.; Chen, H. A hybrid rice optimization algorithm. In Proceedings of the 2016 11th International Conference on Computer Science & Education (ICCSE); Institute of Electrical and Electronics Engineers (IEEE), Nagoya, Japan, 23–25 August 2016; pp. 169–174. [Google Scholar]
  38. Zhang, X.; Ye, Z.; Yan, L.; Wang, C.; Wang, R. Security Situation Prediction based on Hybrid Rice Optimization Algorithm and Back Propagation Neural Network. In Proceedings of the 2018 IEEE 4th International Symposium on Wireless Systems within the International Conferences on Intelligent Data Acquisition and Advanced Computing Systems (IDAACS-SWS); Institute of Electrical and Electronics Engineers (IEEE), Lviv, Ukraine, 20–21 September 2018; pp. 73–77. [Google Scholar]
  39. Whitley, D. A Genetic Algorithm Tutorial. Stat. Comput. 1994, 4, 65–85. [Google Scholar] [CrossRef]
  40. Kennedy, J.; Eberhart, R. Particle swarm optimization. In Proceedings of the ICNN’95-International Conference on Neural Networks, Perth, Australia, 27 November–1 December 1995; pp. 1942–1948. [Google Scholar]
  41. Storn, R.; Price, K. Differential Evolution—A Simple and Efficient Heuristic for global Optimization over Continuous Spaces. J. Glob. Optim. 1997, 11, 341–359. [Google Scholar] [CrossRef]
  42. Mirjalili, S. The Ant Lion Optimizer. Adv. Eng. Softw. 2015, 83, 80–98. [Google Scholar] [CrossRef]
  43. Mirjalili, S.; Lewis, A. The Whale Optimization Algorithm. Adv. Eng. Softw. 2016, 95, 51–67. [Google Scholar] [CrossRef]
  44. Mirjalili, S.; Gandomi, A.H.; Mirjalili, S.Z.; Saremi, S.; Faris, H.; Mirjalili, S.M. Salp Swarm Algorithm: A bio-inspired optimizer for engineering design problems. Adv. Eng. Softw. 2017, 114, 163–191. [Google Scholar] [CrossRef]
Figure 1. Breeding mechanism of three-line Chinese hybrid rice.
Applsci 10 03225 g001
Figure 2. The procedure of the proposed scheme.
Applsci 10 03225 g002
Figure 3. The eight images used in the experiment.
Applsci 10 03225 g003
Figure 4. The proportion of optimal average fitness value obtained by each method in the total number of experiments.
Applsci 10 03225 g004
Figure 5. Convergence curve of the maximum fitness functions of each algorithm in Renyi’s entropy.
Applsci 10 03225 g005
Figure 6. Segmented image obtained from the methods of HRO-Renyi, DE-Renyi, PSO-Renyi, SSA-Renyi, ALO-Renyi, WOA-Renyi, GA-Renyi.
Applsci 10 03225 g006
Figure 7. Segmented image obtained from the methods of HRO-OTSU, DE-OTSU, PSO-OTSU, SSA-OTSU, ALO-OTSU, WOA-OTSU, GA-OTSU.
Applsci 10 03225 g007
Table 1. Parameter setting of algorithms used.
AlgorithmParameter SettingValueReference
HRO s e l f i n g T i m e m a x 30[37]
GApc0.8[39]
pm0.1
PSOc12[40]
c22
v[−6, 6]
DEfr0.1[41]
cr0.6
WOAa1[0, 2][43]
a2[−2, −1]
R1rand
R2rand
SSAC2rand[44]
C3rand
ALO//[42]
Table 2. The average fitness values of each algorithm under Renyi’s entropy.
Test ImagekHRO-RenyiALO-RenyiDE-RenyiSSA-RenyiWOA-RenyiPSO-RenyiGA-Renyi
baboon211.468611.468611.468611.468411.468611.468611.468
416.589716.58816.587416.577916.579116.585416.5549
621.058921.058521.037121.030320.975921.05320.8251
824.883924.496524.755224.379824.657224.775424.3504
cameraman212.486412.486412.486412.486412.486312.486412.4863
418.405718.347118.405218.390918.397518.400918.3846
623.779523.720023.772923.757023.747323.747523.6548
828.661228.597428.634828.643728.583928.641728.3456
house211.806411.806411.806411.806411.8061611.806411.80631
417.332917.332917.3322417.332917.3237917.3329117.30065
622.021822.0214122.0022822.0117121.9792422.0197321.89545
826.152225.6983726.006625.3330826.0437125.7697425.77073
pepper212.521812.521812.521812.521812.521812.521812.5217
418.319918.319918.319418.317818.318518.319818.3047
623.491023.490923.484623.485423.46323.488823.3293
828.039127.995228.012127.997827.993728.028927.6193
image1212.546012.545812.546012.545612.545812.545912.5456
418.722918.722218.722318.720818.718818.721718.6988
624.064124.061724.052224.052724.038524.060423.9386
828.821928.807828.771028.686128.725028.759728.4813
image2211.353911.353911.353911.353911.352111.353911.3533
416.687816.685516.686916.687416.681016.684116.6592
621.442121.221921.373921.120821.327621.430221.1757
825.477725.238525.227724.473825.248824.881124.9524
image3211.341711.341711.341711.341711.341311.341711.3416
416.675916.675916.674116.675716.668716.675716.6499
621.010320.826321.075920.775021.099420.775720.9413
825.100525.094725.083325.089625.023825.092324.8731
image4211.806411.806411.806411.806411.806311.806411.8063
417.332917.332917.332717.332917.327717.332917.3053
622.021821.936222.003222.013321.997122.019821.8579
826.152225.785925.985625.490126.044425.759725.7633
Table 3. STD of each algorithm under Renyi’s entropy.
T × 10 st Imag × 10 kHRO-R × 10 nyiALO-R × 10 nyiD × 10 -R × 10 nyiSSA-R × 10 nyiWOA-R × 10 nyiPSO-R × 10 nyiGA-R × 10 nyi
baboon20.00 × 10+000.00 × 10+000.00 × 10+004.00 × 10−042.00 × 10−040.00 × 10+007.00 × 10−04
42.21 × 10−036.00 × 10−033.10 × 10−031.24 × 10−028.80 × 10−038.50 × 10−031.63 × 10−02
61.01 × 10−021.01 × 10−021.62 × 10−024.95 × 10−028.14 × 10−029.60 × 10−031.10 × 10−01
86.31 × 10−037.66 × 10−017.97 × 10−027.66 × 10−011.69 × 10−013.75 × 10−011.97 × 10−01
cam × 10 raman23.65 × 10−153.59 × 10−153.59 × 10−153.59 × 10−153.65 × 10−043.59 × 10−152.13 × 10−04
42.53 × 10−041.05 × 10−011.11 × 10−035.86 ×10 −021.02 × 10−023.48 × 10−021.49 × 10−02
61.47 × 10−049.63 × 10−025.56 × 10−034.88 × 10−024.60 × 10−026.09 × 10−025.31 × 10−02
89.16 × 10−049.61 × 10−021.48 × 10−024.56 × 10−026.76 × 10−024.36 × 10−021.29 × 10−01
hous × 10 23.65 × 10−153.65 × 10−153.65 × 10−153.65 × 10−155.67 × 10−043.65 × 10−152.48 × 10−04
43.91 × 10−060.00 × 10+001.14 × 10−031.27 × 10−051.21 × 10−021.23 × 10−042.39 × 10−02
68.07 × 10−048.85 × 10−042.74 × 10−022.10 × 10−027.33 × 10−021.52 × 10−036.43 × 10−02
81.25 × 10−027.94 × 10−011.09 × 10−018.38 × 10−017.11 × 10−027.27 × 10−011.36 × 10−01
p × 10 pp × 10 r20.00 × 10+000.00 × 10+000.00 × 10+000.00 × 10+000.00 × 10+000.00 × 10+005.00 × 10−04
40.00 × 10+000.00 × 10+001.70 × 10−036.80 × 10−031.50 × 10−032.00 × 10−041.04 × 10−02
68.44 × 10−053.00 × 10−045.10 × 10−032.94 × 10−022.41 × 10−021.20 × 10−037.44 × 10−02
87.31 × 10−043.02 × 10−011.47 × 10−026.93 × 10−024.88 × 10−023.90 × 10−031.26 × 10−01
imag × 10 126.07 × 10−055.48 × 10−048.97 × 10−156.54 × 10−046.72 × 10−043.39 × 10−048.99 × 10−04
40.00 × 10+001.67 × 10−031.20 × 10−032.63 × 10−033.63 × 10−031.92 × 10−031.84 × 10−02
64.81 × 10−035.25 × 10−039.34 × 10−031.04 × 10−022.21 × 10−024.58 × 10−034.93 × 10−02
87.13 × 10−034.31 × 10−022.72 × 10−029.33 × 10−026.17 × 10−027.83 × 10−029.49 × 10−02
imag × 10 228.97 × 10−158.97 × 10−158.97 × 10−158.97 × 10−155.75 × 10−038.97 × 10−153.95 × 10−03
45.89 × 10−031.14 × 10−024.72 × 10−036.23 × 10−031.30 × 10−028.88 × 10−031.61 × 10−02
61.09 × 10−146.39 × 10−015.48 × 10−026.77 × 10−018.24 × 10−024.22 × 10 −021.02 × 10−01
83.52 × 10−025.78 × 10−012.25 × 10−019.50 × 10−011.42 × 10−018.45 × 10−011.71 × 10−01
imag × 10 321.79 × 10−151.79 × 10−151.79 × 10−151.79 × 10−151.37 × 10−031.79 × 10−153.79 × 10−05
43.65 × 10−153.59 × 10−151.86 × 10−037.86 × 10−041.02 × 10−024.16 × 10−042.15 × 10−02
61.76 × 10−011.84 × 10−016.64 × 10−021.49 × 10−011.78 × 10−021.48 × 10−019.31 × 10−02
87.58 × 10−041.67 × 10−028.93 × 10−032.70 × 10−029.70 × 10−024.11 × 10−031.00 × 10−01
imag × 10 425.38 × 10−155.38 × 10−155.38 × 10−155.38 × 10−154.84 × 10−045.38 × 10−155.90 × 10−04
43.91 × 10−060.00 × 10+006.52 × 10−041.85 × 10−045.93 × 10−035.31 × 10−051.82 × 10−02
68.07 × 10−044.23 × 10−012.71 × 10−022.06 × 10−023.33 × 10−021.51 × 10−037.46 × 10−02
81.25 × 10−027.24 × 10−011.72 × 10−018.28 × 10−019.86 × 10−027.17 × 10−011.24 × 10−01
Table 4. PNSR, SSIM, regional consistency, and regional contrast.
Test ImagekPNSRSSIM
HRO-OTSUHRO-RenyiHRO-OTSUHRO-Renyi
baboon26.79816.73630.30640.3046
48.71019.89920.49040.551
613.991712.18540.69130.659
815.08414.9530.74770.7657
cameraman26.66958.50970.46800.4088
411.955315.8950.53380.5502
612.070913.95440.58760.6126
814.246319.67210.61790.6813
house26.61187.00590.43830.4045
412.221312.31940.60330.7013
610.869912.79080.65340.6687
815.143916.25060.73870.7747
pepper26.98527.30170.43420.4176
414.386711.7970.56310.5484
615.704614.23760.62960.6346
820.563215.82490.69240.6949
image126.429311.68510.10160.0731
49.42714.22480.24540.2398
611.593517.41160.37350.3996
813.233917.2990.48710.5351
image225.910510.4120.17590.0712
49.023111.74940.27330.2611
69.852314.04870.34830.4269
811.142314.22330.40680.5407
image325.678810.05470.1240.0804
48.672511.39310.20260.1928
69.483213.06160.26720.31
810.070316.54180.32470.419
image426.17268.78710.15820.1142
49.07311.79710.24180.2189
611.186113.52190.33620.3522
812.08216.28380.40510.4489

