Featured Application
The spray-dried eugenol formulation can be used as a food preservative preparation or for pharmaceutical purposes. The encapsulation formulation and method can be applied to other essential oils.
Abstract
Eugenol has many functional properties for food and pharmaceutical purposes, especially as an antimicrobial agent. However, its use is constrained by its volatility and shelf life because it is easily degraded due to temperature, oxidation, and light. Research on encapsulation technology using biopolymers is still required to obtain the appropriate formulation in a eugenol delivery system. The aims of this research were to develop a new formulation of protein and polysaccharides in eugenol encapsulation and to determine the effect of eugenol and chitosan concentration on the characteristics of the emulsions and spray-dried powder produced. In this study, eugenol was encapsulated in whey protein–maltodextrin conjugates and chitosan through the double layer encapsulation method. The emulsions which were prepared with 2.0% eugenol were relatively more stable than those of 1.0% eugenol based on the polydispersity index and zeta potential values. Spray-dried powder which was prepared using an emulsion of 2.0% w/w eugenol and 0.33% w/w chitosan had the highest eugenol loading. The presence of chitosan resulted in more stable emulsions based on their zeta potential values, improved thermal stability of eugenol, increased eugenol loading to become twice as much as the loading obtained without chitosan, and modified release profile of eugenol from the spray-dried powders.
1. Introduction
Eugenol (C10H12O2) which is a phenylpropanoid group consisting of an allyl chain-substituted by guaiacol is a major bioactive compound that has a concentration of 45–90% in clove. This essential oil has shown many pharmacological uses due to its antibacterial, antifungal, antiplasmodial, antivirus, anthelmintic, anti-inflammatory, analgesic, and antioxidant activities [1]. However, eugenol has limited applications, because of its volatility, slight solubility in water, and ease of damage when exposed to high temperatures, air, and light. Nevertheless, encapsulation technology has been used to overcome these problems and to improve the utilization of essential oils as pharmaceuticals and food ingredients. Some benefits of encapsulating essential oils include increasing stability, protecting active compounds from interaction with other ingredients, increasing the activity or functional properties, and decreasing volatility and toxicity [2,3]. In addition, encapsulation protects active compounds from oxidation, masks flavor, allows controlled release, and increases bioavailability and efficacy [4,5,6].
The benefit of encapsulation is achieved by using an appropriate polymer matrix as a wall material. Some factors affecting the retention and release of active compounds from the film include the type of polymer, the preparation method, the interaction between polymeric and active compounds, and the environment [7,8]. Generally, protein and carbohydrates are good combinations for wall materials for encapsulation [9]. Whey protein (WP) as a protein and maltodextrin (MD) as a polysaccharide are frequently used as a matrix in essential oil encapsulation, emulsifying agents, and stabilizers [10,11]. Moreover, protein-conjugated polysaccharides are better emulsifiers than proteins or polysaccharides alone. The difference between the present work and previous studies lies in the type of whey protein used. The whey protein used in this study was derived from bovine milk and had a protein content of 7–11%, whereas the isolates had a protein content of more than 90%.
No research has been conducted on double-layer eugenol encapsulation using a whey protein–maltodextrin (WPMD) conjugate as the first layer and the effect of chitosan as the second layer. Generally, double-layer encapsulation is formed using layer-by-layer electrostatic deposition of polyelectrolytes on oppositely charged surfaces and is processed by emulsification and homogenization [12,13]. The advantages of a double-layer system are better stability against environmental stress than a single layer [14] and the controlled release of active compounds [15].
Chitosan was chosen as the second layer in consideration of its characteristics and the findings of some related research. Previous studies have confirmed that a multilayer oil-in-water emulsion containing lecithin, chitosan, and pectin made through the layer-by-layer method exhibited good stability to aggregation [16]. Several studies on the effectiveness of chitosan as an encapsulating agent and its profile release have been carried out by some researchers [17,18,19]. Furthermore, according to Estevinho et al. [20], chitosan has the ability to form ionic or covalent bonds with crosslinking agents and form a network in which the active compounds can be maintained. These properties are highly advantageous and necessary for controlling the release of active compounds.
The objectives of this study were (1) to develop a new formulation of biopolymers using the double-layer method for eugenol encapsulation and (2) to investigate the effect of different eugenol and chitosan concentrations on emulsification, encapsulation performance, and the physical properties of spray-dried powders. In addition, the kinetics and mechanism of eugenol release from microcapsules were also evaluated.
2. Materials and Methods
2.1. Materials
WP from bovine milk (W1500) was obtained from Sigma-Aldrich, and technical MD was obtained from PT Sarana Mitra Anugrah (Bogor, Indonesia). Food-grade chitosan (88.59% degree of diacetylation) was purchased from Biotech Surindo (Cirebon, West Java, Indonesia), sodium acetate was purchased from Merck (127-09-4|106268), and eugenol (W246700) was obtained from Sigma-Aldrich.
2.2. Preparation of Whey Protein–Maltodextrin (WPMD) Conjugates
The preparation of WPMD conjugates was adopted from Shah et al. and Akhtar and Dickinson [11,21] with modifications. Whey protein was dissolved at 40 g/1000 g in distilled water and stirred for 15 min to homogenize the solution. The maltodextrin (80 g) was dissolved in the whey protein solution, which was, then, hydrated up to 18 h at room temperature (28–30 °C). The samples were spray-dried at 150 °C inlet temperature, 0.4 kPa compressed air, and 52 m3/h air flow rate using a spray dryer (Lab Plant Spray Dryer SD05). The outlet temperature was recorded at 70–80 °C, then, the spray-dried powders were heated at 90 °C in a cabinet oven for 1.5 h, which was then continued at 110 °C for 1.5 h.
2.3. Encapsulation of Eugenol by Emulsification and Spray Drying
Emulsification to encapsulate eugenol in the WPMD conjugate and chitosan as the wall material was adopted from the method reported by Shah et al. and Preetz et al. [11,12] with modifications. The WPMD conjugate product (5% w/w) was dissolved in distilled water and stirred using a magnetic stirrer at 700 rpm for 15 min to homogenize the solution. The conjugate solution had two functions, i.e., an emulsifier to emulsify the essential oil and a first layer in the double-layer system. In the first step, the emulsification was prepared using a high-shear homogenizer (Ultraturrax homogenizer, IKA T25, Germany). The conjugate solution was homogenized at 15,000 rpm for 1 min to produce the primary emulsion. This was achieved by adding eugenol of 2.0% or 1.0% w/w of the WPMD conjugate solution mass into the solution of WPMD conjugates under stirring at 15,000 rpm. Chitosan solutions (0.0%, 0.067%, 0.2%, and 1.0% in 0.1 M acetate buffer, pH 4.5) were gradually added, separately, to the primary emulsion according to the treatments that were determined. The addition was carried out under stirring at 15,000 rpm for 3 min to obtain the secondary emulsion. The mass ratio between the eugenol primary emulsion and chitosan solution was 2:1. The secondary emulsion was treated with a high-pressure homogenizer (Panda 2000, Gea Niro Soavi) for five cycles at 400–450 bar. There were eight emulsion samples consisting of four chitosan concentrations in each of two eugenol concentrations. The final emulsions had eugenol concentrations of 2.0% and 1.0% and were coded as F1 and F2, respectively. The chitosan concentrations in the final emulsion were 0.0%, 0.067%, 0.20%, and 0.33%. All emulsion samples were spray-dried at 150 °C inlet temperature to obtain dried powder samples. The formulation and the name of the samples is described in Table 1.

Table 1.
The formulation of emulsion and name of the samples obtained.
2.4. Encapsulation Performance
Total eugenol was determined using the method of Shah et al. [11] with modifications. The spray-dried powder (40 mg) was dissolved in 10 mL of 60% methanol by sonication for 30 min. The samples were filtered through a membrane with a 0.45 µm pore size and the injection volume was 20 µL. Analyses were performed using HPLC equipped with an RS diode array detector at 280 nm. The mobile phase consisted of 60 mL/100 mL aqueous methanol using an isocratic mode at a flow rate of 1 mL/min in a C-18 column (Agilent, Zorbax Eclipse Plus; 4.6 mm × 25 cm, 5 µm, 100 Å). The eugenol concentration was determined from the sample peak area and used in the calculation of the loading capacity (LC). Encapsulation efficiency (EE) is defined as the percentage of total eugenol mass in spray-dried product with reference to the corresponding mass of eugenol in feed. The calculation of mass of eugenol in feed involved non-solvent mass in emulsion and mass of collected product.
2.5. Particle Size and Zeta Potential Measurement of Emulsion and Spray-Dried Powder Dispersion
The particle size and zeta potential of the emulsion and the dispersion of dried powder were measured using a Zetasizer Nano ZS (Malvern Instrument, Malvern, UK). The measurement principle for particle size was based on dynamic light scattering, while zeta potential was determined using laser doppler micro electrophoresis. The light source is He-Ne laser and a detector angle of 173°. Three drops (0.07 g) of emulsion samples were diluted in 20 mL of distillation water. The particle dimension of the spray-dried powder was measured by dispersing the powder (1.33 mg) in distilled water (20 mL), followed by sonication (Branson 3510) for 5 min. The dispersion was poured into the disposable plastic micro cuvette for particle size and disposable folded capillary cell (DTS 1070), for zeta potential measurement. The particle size measurement results showed the mean of a droplet diameter (z-average) and polydispersity index (PdI) value. Each data value was an average of three measurements.
2.6. Differential Scanning Calorimetry (DSC)
The thermal denaturation properties of eugenol-encapsulated microparticles using the WPMD conjugate and chitosan as wall materials were analyzed with a DSC 8000 Perkin Elmer. The samples were weighed to be approximately 7–10 mg and prepared in aluminum pans. The samples were heated from 40 to 300 °C at a rate of 10.00 °C/min. The thermal transitions were evaluated in terms of peak transition temperature (Tp) and enthalpy (ΔH). On the basis of the International Confederation for Thermal Analysis and Calorimetry (ICTAC) standard, the peak value in DSC thermograms is known as the melting point in polymer samples https://www.perkinelmer.com/CMSResources/Images/44-74542GDE_DSCBeginnersGuide.pdf.
2.7. Fourier Transform Infrared (FTIR)
All infrared spectra of eugenol microcapsules were obtained using a Nicolet iS50 FTIR spectrometer (Thermo Scientific). The instrument was equipped with a KBr beam splitter and a DTGS KBr detector. The scanning process was carried out at a resolution of 2 cm−1 with a frequency range of 400 and 4000 cm−1.
2.8. Study of In Vitro Release of Eugenol and Release Kinetic
The in vitro release test of eugenol followed the method used by Hosseini et al. [22] and Chen et al. [23]. The sample (40 mg) was placed in an Erlenmeyer flask containing 10 mL of 60% phosphate-buffered saline (pH 7.4) and 40% ethanol. Agitation was carried out using a shaker incubator at a temperature of 27–30 °C with a speed of 75 rpm. At the appointed time intervals, 5 mL of the sample was sucked out for analysis and replaced with 5 mL of the buffer phosphate solution. The sample was transferred into a tube for further filtration using 0.45 µm PVDF and put into a 2 mL vial for the measurement process by HPLC. The cumulative percentage of the amount of active compound/essential oil released from the spray-dried powder was obtained by dividing the cumulative amount of essential oil released at any given time interval (Mt) by the initial weight of the encapsulated essential oil (M0) (Equation (3)):
The release mechanism and release kinetics of eugenol from the spray-dried powder were investigated using the Korsmeyer–Peppas kinetic model [24] (Equation (4)). Mt is the amount of eugenol released at a given time, M0 is the initial amount of eugenol contained in the spray-dried powder or the maximum amount of eugenol that can be released from the spray-dried powder, t is the release time, k is the kinetic constant for the system, and n is the release characteristic and determines the release mechanism.
2.9. Statistical Analysis
The data analyses were carried out with the MINITAB 19 software using analysis of variance (ANOVA), and differences were considered significant at α < 0.05.
3. Results and Discussion
3.1. Effect of Chitosan and Eugenol Concentration on Eugenol Emulsions
The data showed that the droplet size of F1 emulsions tended to increase along with the increasing concentration of chitosan solution as the second layer in the eugenol encapsulation (Table 2). This result is in line with that of Lertsurthiwong and Rojsitthisak [25], who investigated oil encapsulation using chitosan and alginate as a biopolymer. The increased droplet size indicated polymer attachment on the surface of the oil core. However, the eugenol emulsion F2 did not show the same phenomenon. The results of the ANOVA test indicated that the increase in droplet size, due to the chitosan concentration, was not significantly different. Furthermore, the Tukey’s test results showed that there were significant differences in droplet size between F2-chi 0.0% and F2-chi 0.067%.
Table 2.
Droplet size, polydispersity index, and zeta potential of emulsions.
The eugenol emulsion of F2-chi 0.067% had the largest particle size and was significantly different from the other samples. This was probably due to the instability of the emulsion, which eased the aggregation. The instability of the emulsion was also shown by its PdI and zeta potential values. The PdI of F2-chi 0.067% was the highest among all the samples, whereas the zeta potential value was the lowest (Table 2). A high PdI value indicates instability of an emulsion [26].
Overall, the data showed that F1 emulsions had PdI values closer to 0.2, which represented the homogeneity of the emulsions. The F1 emulsions also showed a higher zeta potential than F2, but they were not significantly different. The F1 emulsion-chi 0.0% and the F2 emulsion-chi 0.0% showed negative values of zeta potential due to the absence of chitosan. The values were close to 30 mV, which revealed the stability of the emulsions. Zeta potential is an indicator of the stability of an emulsion and is influenced by the electric charge of the interface [27,28]. This phenomenon indicated that the formula F1 emulsion was more stable than the formula F2 emulsion. The difference between the F1 and F2 emulsion formulas was in the eugenol concentration. The ratios of the mass emulsifier (WPMD conjugates) and eugenol in F1 and F2 emulsions were 5:3 and 5:1.5, respectively. The higher eugenol concentration in this study produced a better emulsion. The effect of the clove oil content on droplet size and stability in nanoemulsions was investigated by Shahavi et al. [29].
3.2. Performance of Spray-Dried Powder
The spray-dried samples redispersed in water had a larger mean droplet size of emulsion before spray-drying. This phenomenon denoted that some of the nanoparticles formed aggregations during the spray-drying process. Similar studies on the change of particle size during drying have shown that the particle size of essential oils encapsulated in zein nanoparticle samples also increased after lyophilizing [30]. Increased particle size was probably caused by the imperfections of the hydration or the occurrence of structural changes within atomized droplets during spray-drying. From the research by Chen et al. [23], structural changes can occur due to the differences in the distribution of essential oils that evaporated and condensed during spray-drying which later cooled. The difference in the concentration of eugenol used in the F1 and F2 treatment samples perhaps caused differences in the particles’ structural changes during drying. Therefore, F1 samples (2.0% eugenol) had a larger dispersed particle size than that of the F2 samples (1.0% eugenol). Moreover, increasing the chitosan concentration also increased the size of the dried particles. The chitosan content of 0.33% in the emulsion significantly increased the size of the spray-dried powder particles. The F1 powder-chi 0.33% had the largest particle size (1243 nm), as well as PdI value (0.71) (Table 3).
Table 3.
Particle size, polydispersity index, and zeta potential of powders.
In contrast to the emulsions, the F1 spray-dried samples had smaller zeta potential values than that of the F2 spray-dried samples. However, the trend remained the same, where F1-chi 1.0% had a higher zeta potential value than that of the F1-chi 0.2% and F1-chi 0.067%, likewise for the F2 samples.
Encapsulation performance of eugenol using WPMD conjugates and chitosan was determined by the percentage of encapsulation efficiency (EE) and loading capacity (LC). The percentage of EE and LC increased with increasing levels of chitosan concentration of 0.067%, 0.2%, and 0.33% (Table 4). Chitosan content of 0.33% in formula F1 significantly increased the LC and EE, however, formula F2 showed a different phenomenon. This finding is similar to that of Dima et al. [31], who concluded that coriander essential oil-loaded microspheres prepared in an alginate/chitosan system with a 1:2 ratio had a higher value of entrapment efficiency than microspheres prepared in an alginate/chitosan system with a 1:1 ratio.
Table 4.
Eugenol feed and encapsulation performance.
The F1 spray-dried sample with 0.33% chitosan solution (F1 powder-chi 0.33%) had the highest loading capacity and was significantly different from the other samples (Table 4). The spray-dried samples with 0.067% chitosan solution for both formulas F1 and F2 showed the lowest percentage of EE and LC. These values were lower than the EE and LC of formulas F1 and F2 without chitosan. This could be attributed to the instability of the emulsion and the droplet size. Chen et al. [23] stated that large particle sizes at low pH caused a decrease in total oil content and encapsulation efficiency in spray-dried powder. Another researcher stated that during the spray-drying process, smaller particles had a higher mass transfer rate and more quickly formed semipermeable membranes around the atomized droplets, which reduced the loss of volatile compounds [32]. This phenomenon could have happened to the F2-chi 0.067% spray-dried powder sample. This sample came from an emulsion that had the largest emulsion droplet size, the highest PdI value, and a low zeta potential value. However, the spray-dried powder of F1-chi 0.067% had a small particle size and PdI value, and therefore the opinion of Jafari et al. [32] is not appropriate for this case. There could be differences in interactions between the WPMD conjugate, eugenol, and chitosan solutions in the acetate buffer and the interactions between the WPMD conjugates, eugenol, and acetate buffer without chitosan. The difference in interaction caused a higher percentage of LC and EE of eugenol in the spray-dried powder F1-chi 0.0% than in F1-chi 0.067%, as well as between F2-chi 0.0% and F2-chi 0.067%.
The eugenol spray-dried powder produced from this research had higher loading than some similar research results. The eugenol loading of the F1 sample powder-chi 0.33% (16.8%) was higher than the result of Woranuch and Yoksan [33]. They stated that eugenol loading in their eugenol-loaded chitosan nanoparticle study ranged from 0.85% to 12.80%. Research on eugenol loaded in zein/casein nanocomplexes resulted in a loading of 5.5% [23]. The encapsulation with the WPMD conjugate produced a loading ranging from 5.0% to 7.9% [11]. Generally, the encapsulation efficiency of the F2 powders was higher than that of the F1 powders, except for F1-chi 0.33%. We found that a higher eugenol concentration lowered the encapsulation efficiency. This result is in line with that of Hosseini et al. [22], who reported that EE decreased with an increase in the initial essential oil content. This could be due to the saturation of essential oil loading into the wall material during the encapsulation process and also the effect of chitosan concentration.
The level of saturation of eugenol was known from experiments encapsulating eugenol with four levels of eugenol concentration. The result showed that the percentage of EE increased at eugenol concentrations up to 2%, and then decreased when loaded with 4.0% eugenol. The LC increased until 4.0% eugenol concentration, and then decreased at 8% eugenol concentration (Figure S1). Volatile compound retention can be influenced by an optimum percentage of infeed solid that varies for each carrier or encapsulating agent. However, in this research, all formulas used the same mass and type of infeed solid (WPMD conjugate and chitosan). Each formulation is distinguished by the percentage of eugenol. In general, the encapsulation process with spray drying usually used 20% flavor load based on carrier solids. The higher percentage of that flavor load usually causes unacceptably high losses of flavors during spray drying [34]. The formula with a concentration of eugenol 2% (F-2%) has a maximum percentage of encapsulation efficiency (EE). The EE is influenced by the mass of eugenol in feed, which also involves a solid carrier in its calculation. The percentage of eugenol in feed for formula F-2% is 35.71% (data not shown). This value was greater than the formula with 1% eugenol (21.74%) and smaller than the eugenol formula 4% (52.63%), and the eugenol formula 8% (68.97%). The percentage of eugenol in feed for F-2% was probably the optimum value in the formulation of this study because it produced the maximum percentage of EE, although the maximum loading was at F-4%. At F-4% the percentage of EE decreased. The ANOVA test results showed that the loading percentage between F-2% and F-4% was not significantly different, while the percentage of EE was significantly different. Therefore, it can be concluded that the 2.0% eugenol concentration was the best at obtaining the optimal percentages of loading and encapsulation efficiency in the encapsulation of double-layer eugenol using WPMD conjugates and chitosan.
3.3. Differential Scanning Calorimetry
All spray-dried powders containing chitosan, except the microcapsule of F2 powder-chi 0.067%, showed endothermic processes of temperature peak at 74.8 °C until 78.6 °C (Figure 1A,B). Chitosan had two endothermic peaks at 85.88 and 275.26 °C (Figure S2). The endothermic peak for eugenol is 258.81 °C [35]. The disappearance of the peaks located at these temperatures indicated that there was an interaction between the WPMD conjugates and eugenol, as well as with chitosan. Previous studies reported that the individual characteristics of the graph polymer wall material and the active compounds are not visible in the DSC graphs if the interaction and encapsulation efficiency are good [36,37,38]. The interaction between core and the wall material determined the retention of the active compound. According to Hill et al. [39], the varied ratio of essential oil to the wall material resulted in the differences in the interaction of essential with the wall material which, then, influenced the encapsulation efficiency.
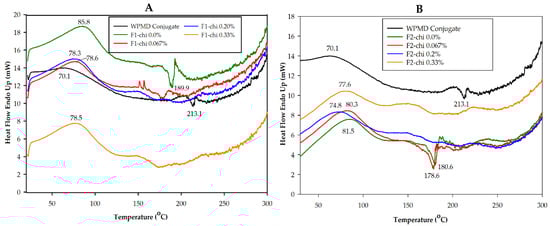
Figure 1.
Differential scanning calorimetry (DSC) thermogram of F1 (A) and F2 (B) spray-dried powders.
According to the thermograms, the spray-dried powders with 0.067%, 0.2%, and 0.33% chitosan concentrations for both eugenol concentrations (F1 and F2) appeared to have adjacent endothermic peak temperatures (Figure 1A,B). Therefore, the chitosan concentration did not have a different effect on the thermal behavior of the eugenol spray-dried powder. However, the addition of chitosan as the second layer in eugenol encapsulation can protect the sample from denaturation and decomposition. This was indicated by the absence of the exothermic peak and only one endothermic peak with temperatures below 100 °C. The endothermic peak in the range of 100 °C can be related to the gelatinization process. There was a decomposition of carbohydrates and similar structures in the presence of water during heating. This process was complex because, at the same time, water vaporization also occurred. Meanwhile, the endothermic peak in the range of 200 °C is related to the melting materials and the possibility of partial and liquid evaporation [40].
The thermograms showed that the formulations without chitosan (F1 powder-chi 0.0% and F2 powder-chi 0.0%) had endothermic and exothermic peak temperatures. The F1 powder-chi 0.0% had 85.75 and 189.97 °C endothermic and exothermic peaks, respectively. The temperature peaks of F2 powder-chi 0.0% at 81.49 and 180.61 °C, respectively, were lower than those of F1 powder-chi 0.0%. These two types of peak temperatures were also observed in the thermograms of the WPMD conjugate powder and the F2 powder-chi 0.067% at 70.14 and 213.09 °C and at 80.32 and 178.62 °C, respectively. The exothermic peak was attributed to the occurrence of decomposition.
According to Ronkart et al. [41] and Beirão-da-Costa et al. [42], the material reorganization during the spray-drying process could affect the changes in microcapsule melting temperatures. In their investigation, reorganization occurred when the polymer was heated above its transition glass temperature (Tg). In this study, the spray-drying process was held at 150 °C. The DSC measurements showed that the temperature of Tg maltodextrin and chitosan was not detected, while the Tg temperature of whey protein was 119.47 °C (Figure not shown). Therefore, the occurrence of material reorganization in eugenol encapsulation cannot be ascertained.
3.4. Fourier Transform Infrared Spectroscopy (FTIR)
The eugenol spray-dried powder of formula F1 with different levels of chitosan concentrations had similar spectra profiles (Figure 2A). The presence of eugenol and the formation of encapsulation could be detected from the appearance of peaks at wavenumbers in the range of 1517–1561 cm−1 in the F1 spray-dried powder samples. The encapsulation process caused a shift in wavenumbers of the spray-dried powder sample, however, the wavenumbers were in the range of functional groups that represent C = C aromatic ring and secondary amines, NH bend. This wavenumbers’ shift probably indicated physical interactions among eugenol, WPMD, and chitosan. The results of Piletti [43] explained that the physical interaction between eugenol with the β-cyclodextrin molecules caused the modification of the O-H functional group. The IR bands of eugenol, WPMD conjugates, and chitosan are presented in Table S1. The existence of a functional group in the sample could also be shown by the percentage of transmittance. In general, the percentage of transmittance in the wavenumber range of 1550–1650 cm−1 for F1-chi 0.0% was lower than for F1-chi 0.067% and F1-chi 0.33%. This proved that F1-chi 0.33% had more chitosan than other F1 samples.
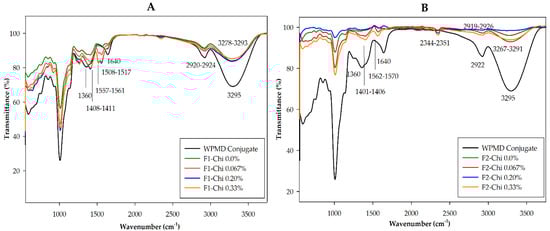
Figure 2.
Infrared spectra of F1 (A) and F2 (B) spray-dried powders.
The existence of a C = C aromatic group in all F1 powder samples was seen from peaks in the 1508 cm−1 region. These results are in line with those of Sajomsang et al. [44] and Woranuch and Yoksan [33]. Strong absorption was detected in F1 powder-chi 0.33%, indicating the higher eugenol content (Table S2). The data in Table 2 show that the F1 powder-chi 0.33% had the highest percentage loading capacity of eugenol. This was also reinforced by the detection of the OH bend at 1408–1411 cm−1 and a C–H aromatic ring at 559–998 cm−1. The wavenumber range of 1400–1419 cm−1 represents phenol and OH bend groups [45]. The intensity of these peaks in F1 powder-chi 0.33% was slightly higher than in F1 powder-chi 0.0%, 0.067%, and 0.2% (Figure 2A). The peak shifts that occurred were also likely related to the physical interaction between eugenol and the wall materials in the encapsulation process as explained above.
The profiles of FTIR spectra of F2 spray-dried powder samples were generally different from F1 powders (Figure 2B). Compared with the spectra of F1 powders, the percentage of transmittance of spectra of F2 powders was higher, meaning that the absorption was lower, which indicates the weak intensity of certain functional groups (Table S3). Peaks in the range of 3271–3295 cm−1 experienced an increase in transmittance. This indicated the intensity of the hydrogen bonds between eugenol and the WPMD conjugate or between eugenol and free maltodextrin in F2 powders was lower than in F1 powders. Peaks in the range of 1563–1577 cm−1 in a spray-dried powder containing chitosan represented NH functional groups that showed the presence of chitosan. The existence of eugenol was detected at peaks of 1401–1402 cm−1, which could have been shifted from specific wavenumbers of eugenol (Table S1). However, the intensity of these wavenumbers was lower than that of F1 powders, as seen from the percentage of the transmittance (Figure 2A,B). This was because the eugenol loading of F2 powders was lower than that of F1 powders (Table 4).
3.5. In Vitro Release Characteristic of Eugenol
A release study of eugenol from the spray-dried powder was carried out to determine the effect of chitosan concentration on the eugenol released from microcapsules at a predetermined time. The results showed that F1-chi 0.0% powder had the lowest cumulative percentage of eugenol release (41.35%) among other F1 spray-dried powders at the end of the observation time (Figure 3A). However, among the samples containing chitosan, F1-chi 0.33% powder showed the lowest eugenol cumulative release (57.22%) as compared with F1-chi 0.067% (69.78%) and F1-chi 0.2% (59.22%). Chitosan concentration seemed to have the effect of inhibiting the release of eugenol in F1 encapsulation formulations.
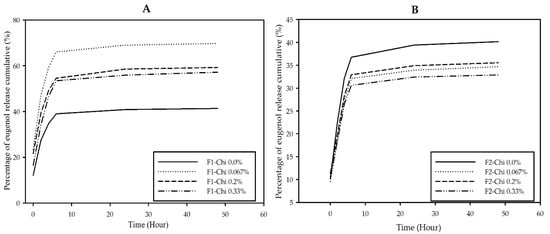
Figure 3.
Release profile of eugenol from F1 (A) and F2 (B) spray-dried powders.
The difference in eugenol concentration affected its interaction with the WPMD conjugates and chitosan, which was thought to influence the release profile of eugenol from F2 microcapsules. The spray-dried powder of F2-chi 0.0% (40.16%) had a greater percentage of eugenol cumulative release than the F2 powder containing chitosan at the end of the observation time (Figure 3B). The F2-chi 0.067% (34.68%), 0.6% (35.55%), and 1.0% (32.89%) had adjacent release graphs; however, the F2-chi 0.33% appeared to have the lowest cumulative release percentage at 48 h. Thus, it can be concluded that the presence of chitosan retarded the release of eugenol from microcapsules.
The percentage of eugenol release increased for 6 h and began to slow down after that until 48 h (Figure 3A,B). The retardation of eugenol release was probably related to the diffusion of active compounds contained in the particles [24]. Furthermore, Agnihotri et al. [46] explained that drug release through a diffusion mechanism began with penetration of the medium into the particle system, which caused the particles to swell, and then the drug was released from the swollen matrix.
The mechanism and eugenol release kinetic model of the spray-dried powders were also studied. The calculation to determine the mechanism and release kinetics used the Korsmeyer–Peppas equation (Equation (5)). The results of the calculation of the release kinetics showed that the values of the diffusion exponential (n) of all samples were less than 0.43 (Table 5). This indicates that the release mechanism in the eugenol microcapsules followed Fickian release (case I transport).
Table 5.
Kinetic data of eugenol released from microcapsules using the Korsmeyer–Peppas kinetic model.
Release of eugenol occurred through a diffusion process. Ritger and Peppas [47] explained the criteria of the n value as follows: n ≤ 0.43 indicates Fickian release, n = 0.85 indicates case II transport, and 0.43 < n < 0.85 indicates non-Fickian release (an anomalous behavior). The results also revealed the diffusion constant value (k) and Pearson coefficient (R2). The k value indicates the kinetics of the release. The greater the value of k, the faster the release of an active compound from microcapsules [48].
Regarding some of the phenomena encountered in this experiment, the F1 formula samples had a cumulative release percentage greater than the formula F2 samples. The result was supported by the k value of the samples. The k value of F1 samples was higher than that of the F2 samples, indicating that the release of eugenol from F1 samples was faster than that from the F2 samples. The F1-chi 0.0% had the lowest cumulative release percentage and k value among other F1 microcapsules, while F2-chi 0.0% had the highest cumulative release percentage among other F2 microcapsules. According to Keawchaoon and Yoksan [24], the amount and release rate of a component were influenced by the pH of the media. However, the media used in this release trial had the same pH (7.4) for all samples. The differences between each sample were the combination of eugenol concentration and chitosan concentration. The eugenol spray-dried powders were obtained from eugenol emulsions with different emulsion pH values. The addition of different concentrations of chitosan solution to the first eugenol emulsion (primary emulsion) produced a different pH value in the second eugenol emulsion (secondary emulsion). The F1-chi 0.0% and F2-chi 0.0% emulsions had a lower pH than F1 and F2 containing chitosan. The pH value of the emulsion formula F1 was lower than the pH value of the emulsion formula F2. The pH difference could have influenced the electrostatic interaction among eugenol, WPMD conjugates, and chitosan which, then, influenced the release of eugenol. The mechanism was explained by Combrinck et al. [48]. Another possible reason for the release phenomenon of F1 and F2 powders is the difference in eugenol loading (Table 4). An increase in the rate of release of essential oils from microcapsules containing more essential oils is due to a decrease in the thickness of the microcapsule wall because insufficient wall material encapsulates the oil completely [49].
4. Conclusions
In this study, WPMD conjugates acted as an emulsifier, as well as a coating agent, in eugenol encapsulation. The concentration of eugenol and chitosan had an effect on the properties of the emulsions and spray-dried powders, including particle size, zeta potential, encapsulation efficiency, and loading capacity. The spray-dried powder prepared using an emulsion of 2.0% w/w eugenol and 0.33% w/w chitosan had the highest eugenol loading of 16.8%. The eugenol loading of this formulation with chitosan was twice as much as the loading obtained without chitosan reported previously. The eugenol encapsulation using chitosan as the second layer turned out to be effective at stabilizing the emulsion, as revealed by the zeta potential value. The presence of chitosan also improved the thermal stability and prevented the decomposition of the encapsulation product. The differences in eugenol concentration affected the release profile, whereas chitosan concentration had a role in slowing eugenol release. Generally, the results of the study indicate that the eugenol-loaded formulation yielded a biocompatible product with potential applications as food additives and pharmaceuticals.
Supplementary Materials
The following are available online at https://www.mdpi.com/2076-3417/10/9/3205/s1, Figure S1: Encapsulation efficiency and loading capacity of eugenol microcapsules loading with various concentration of eugenol, Figure S2: DSC thermogram of chitosan powder, Table S1: IR band WPMD conjugate, eugenol, and chitosan obtained from the FTIR measurement of the research, Table S2: IR band and % transmittance of F1 samples, Table S3: IR band and % transmittance of F2 samples.
Author Contributions
Conceptualization, I.A., K.M. and M.N.; methodology, I.A. and K.M.; formal analysis, I.A.; investigation, I.A.; data curation, I.A. and K.M.; writing—original draft preparation, I.A.; writing—review and editing, I.A., K.M. and M.N.; visualization, I.A.; supervision, K.M. and M.N.; project administration, I.A. All authors have read and agreed to the published version of the manuscript.
Funding
This research received funding for the experimental work (2017–2020) and the APC (2020) from the Indonesian Agency for Agricultural Research and Development.
Acknowledgments
The authors thank the Indonesia Agency for Agricultural Research and Development, Ministry of Agricultural and Universitas Indonesia for the research funding.
Conflicts of Interest
The authors declare no conflict of interest.
References
- Kamatou, G.; Vermaak, I.; Viljoen, A. Eugenol—From the Remote Maluku Islands to the International Market Place: A Review of a Remarkable and Versatile Molecule. Molecules 2012, 17, 6953–6981. [Google Scholar] [CrossRef] [PubMed]
- Donsi’, F.; Annunziata, M.; Sessa, M.; Ferrari, G. Nanoencapsulation of essential oils to enhance their antimicrobial activity in foods. LWT 2011, 44, 1908–1914. [Google Scholar] [CrossRef]
- Bilia, A.R.; Guccione, C.; Isacchi, B.; Righeschi, C.; Firenzuoli, F.; Bergonzi, M.C. Essential Oils Loaded in Nanosystems: A Developing Strategy for a Successful Therapeutic Approach. Evid. Based Complement. Altern. Med. 2014, 2014, 1–14. [Google Scholar] [CrossRef] [PubMed]
- Nedović, V.; Kalusevic, A.; Manojlovic, V.; Levic, S.; Bugarski, B. An overview of encapsulation technologies for food applications. Procedia Food Sci. 2011, 1, 1806–1815. [Google Scholar] [CrossRef]
- Neethirajan, S.; Jayas, D.S. Nanotechnology for the Food and Bioprocessing Industries. Food Bioprocess Technol. 2010, 4, 39–47. [Google Scholar] [CrossRef] [PubMed]
- Sowasod, N.; Nakagawa, K.; Tanthapanichakoon, W.; Charinpanitkul, T. Development of encapsulation technique for curcumin loaded O/W emulsion using chitosan based cryotropic gelation. Mater. Sci. Eng. C 2012, 32, 790–798. [Google Scholar] [CrossRef]
- Cagri, A.; Ustunol, Z.; Ryser, E.T. Antimicrobial Edible Films and Coatings. J. Food Prot. 2004, 67, 833–848. [Google Scholar] [CrossRef]
- Cha, D.; Cooksey, K.; Chinnan, M.; Park, H. Release of nisin from various heat-pressed and cast films. LWT 2003, 36, 209–213. [Google Scholar] [CrossRef]
- Young, S.; Sarda, X.; Rosenberg, M. Microencapsulating Properties of Whey Proteins. 2. Combination of Whey Proteins with Carbohydrates. J. Dairy Sci. 1993, 76, 2878–2885. [Google Scholar] [CrossRef]
- Rodea-González, D.A.; Cruz-Olivares, J.; Román-Guerrero, A.; Rodríguez-Huezo, M.E.; Vernon-Carter, E.J.; Pérez-Alonso, C. Spray-dried encapsulation of chia essential oil (Salvia hispanica L.) in whey protein concentrate-polysaccharide matrices. J. Food Eng. 2012, 111, 102–109. [Google Scholar] [CrossRef]
- Shah, B.; Davidson, P.M.; Zhong, Q. Encapsulation of eugenol using Maillard-type conjugates to form transparent and heat stable nanoscale dispersions. LWT 2012, 49, 139–148. [Google Scholar] [CrossRef]
- Preetz, C.; Rübe, A.; Reiche, I.; Hause, G.; Mäder, K.; Mäder, K. Preparation and characterization of biocompatible oil-loaded polyelectrolyte nanocapsules. Nanomed. Nanotechnol. Boil. Med. 2008, 4, 106–114. [Google Scholar] [CrossRef]
- Calero, N.; Muñoz, J.; Cox, P.; Heuer, A.; Guerrero, A. Influence of chitosan concentration on the stability, microstructure and rheological properties of O/W emulsions formulated with high-oleic sunflower oil and potato protein. Food Hydrocoll. 2013, 30, 152–162. [Google Scholar] [CrossRef]
- Zhang, Y.; Niu, Y.; Luo, Y.; Ge, M.; Yang, T.; Yu, L.; Wang, Q. Fabrication, characterization and antimicrobial activities of thymol-loaded zein nanoparticles stabilized by sodium caseinate—Chitosan hydrochloride double layers. Food Chem. 2014, 142, 269–275. [Google Scholar] [CrossRef] [PubMed]
- Weiss, J.; Gaysinsky, S.; Davidson, M.; McClements, J. CHAPTER 24—Nanostructured Encapsulation Systems: Food Antimicrobials. In Global Issues in Food Science and Technology; Barbosa-Cánovas, G., Mortimer, A., Lineback, D., Spiess, W., Buckle, K., Colonna, P., Eds.; Academic Press: San Diego, CA, USA, 2009; pp. 425–479. [Google Scholar] [CrossRef]
- Ogawa, S.; Decker, E.A.; McClements, D.J. Production and Characterization of O/W Emulsions Containing Droplets Stabilized by Lecithin−Chitosan−Pectin Mutilayered Membranes. J. Agric. Food Chem. 2004, 52, 3595–3600. [Google Scholar] [CrossRef]
- Hsieh, W.-C.; Chang, C.-P.; Gao, Y.-L. Controlled release properties of Chitosan encapsulated volatile Citronella Oil microcapsules by thermal treatments. Colloids Surf. B Biointerfaces 2006, 53, 209–214. [Google Scholar] [CrossRef]
- Peng, H.; Xiong, H.; Li, J.; Xie, M.; Liu, Y.; Bai, C.; Chen, L. Vanillin cross-linked chitosan microspheres for controlled release of resveratrol. Food Chem. 2010, 121, 23–28. [Google Scholar] [CrossRef]
- Souza, J.M.; Caldas, A.L.; Tohidi, S.D.; Molina, J.; Souto, A.P.; Fangueiro, R.; Zille, A. Properties and controlled release of chitosan microencapsulated limonene oil. Rev. Bras. Farm. 2014, 24, 691–698. [Google Scholar] [CrossRef]
- Estevinho, B.N.; Rocha, F.; Santos, L.; Alves, A. Microencapsulation with chitosan by spray drying for industry applications—A review. Trends Food Sci. Technol. 2013, 31, 138–155. [Google Scholar] [CrossRef]
- Akhtar, M.; Dickinson, E. Whey protein—Maltodextrin conjugates as emulsifying agents: An alternative to gum arabic. Food Hydrocoll. 2007, 21, 607–616. [Google Scholar] [CrossRef]
- Hosseini, S.F.; Zandi, M.; Rezaei, M.; Farahmandghavi, F. Two-step method for encapsulation of oregano essential oil in chitosan nanoparticles: Preparation, characterization and in vitro release study. Carbohydr. Polym. 2013, 95, 50–56. [Google Scholar] [CrossRef] [PubMed]
- Chen, H.; Zhong, Q. A novel method of preparing stable zein nanoparticle dispersions for encapsulation of peppermint oil. Food Hydrocoll. 2015, 43, 593–602. [Google Scholar] [CrossRef]
- Keawchaoon, L.; Yoksan, R. Preparation, characterization and in vitro release study of carvacrol-loaded chitosan nanoparticles. Colloids Surf. B Biointerfaces 2011, 84, 163–171. [Google Scholar] [CrossRef] [PubMed]
- Rojsitthisak, P.; Rojsitthisak, P.; Nimmannit, U. Preparation of turmeric oil-loaded chitosan-alginate biopolymeric nanocapsules. Mater. Sci. Eng. C 2009, 29, 856–860. [Google Scholar] [CrossRef]
- Eid, A.; Elmarzugi, N.; El Enshasy, H. Preparation and evaluation of olive oil nanoemulsion using sucrose monoester. Int. J. Pharm. Pharm. Sci. 2013, 5, 434–440. [Google Scholar]
- Gharsallaoui, A.; Saurel, R.; Chambin, O.; Cases, E.; Voilley, A.; Cayot, P. Utilisation of pectin coating to enhance spray-dry stability of pea protein-stabilised oil-in-water emulsions. Food Chem. 2010, 122, 447–454. [Google Scholar] [CrossRef]
- Bouyer, E.; Mekhloufi, G.; Rosilio, V.; Grossiord, J.-L.; Agnely, F. Proteins, polysaccharides, and their complexes used as stabilizers for emulsions: Alternatives to synthetic surfactants in the pharmaceutical field? Int. J. Pharm. 2012, 436, 359–378. [Google Scholar] [CrossRef]
- Shahavi, M.H.; Hosseini, M.; Jahanshahi, M.; Meyer, R.L.; Darzi, G.N. Evaluation of critical parameters for preparation of stable clove oil nanoemulsion. Arab. J. Chem. 2019, 12, 3225–3230. [Google Scholar] [CrossRef]
- Wu, Y.; Luo, Y.; Wang, Q. Antioxidant and antimicrobial properties of essential oils encapsulated in zein nanoparticles prepared by liquid–liquid dispersion method. LWT 2012, 48, 283–290. [Google Scholar] [CrossRef]
- Dima, C.; Cotarlet, M.; Balaes, T.; Bahrim, G.; Alexe, P.; Dima, S. Encapsulation of Coriander Essential Oil in Beta-Cyclodextrin: Antioxidant and Antimicrobial Properties Evaluation. Rom. Biotechnol. Lett. 2014, 19, 9128–9140. [Google Scholar]
- Jafari, S.M.; He, Y.; Bhandari, B. Effectiveness of encapsulating biopolymers to produce sub-micron emulsions by high energy emulsification techniques. Food Res. Int. 2007, 40, 862–873. [Google Scholar] [CrossRef]
- Woranuch, S.; Yoksan, R. Eugenol-loaded chitosan nanoparticles: I. Thermal stability improvement of eugenol through encapsulation. Carbohydr. Polym. 2013, 96, 578–585. [Google Scholar] [CrossRef] [PubMed]
- Reineccius, G.A. Flavor encapsulation. Food Rev. Int. 1989, 5, 147–176. [Google Scholar] [CrossRef]
- Pramod, K.; Suneesh, C.V.; Shanavas, S.; Ansari, S.H.; Ali, J. Unveiling the compatibility of eugenol with formulation excipients by systematic drug-excipient compatibility studies. J. Anal. Sci. Technol. 2015, 6, 265. [Google Scholar] [CrossRef]
- Cocero, M.J.; Martín, Á.; Mattea, F.; Varona, S.; Alonso, M.J.C. Encapsulation and co-precipitation processes with supercritical fluids: Fundamentals and applications. J. Supercrit. Fluids 2009, 47, 546–555. [Google Scholar] [CrossRef]
- Feyzioglu, G.C.; Tornuk, F. Development of chitosan nanoparticles loaded with summer savory (Satureja hortensis L.) essential oil for antimicrobial and antioxidant delivery applications. LWT 2016, 70, 104–110. [Google Scholar] [CrossRef]
- Souza, A.C.P.; Gurak, P.D.; Marczak, L.D.F. Maltodextrin, pectin and soy protein isolate as carrier agents in the encapsulation of anthocyanins-rich extract from jaboticaba pomace. Food Bioprod. Process. 2017, 102, 186–194. [Google Scholar] [CrossRef]
- Hill, L.E.; Gomes, C.; Taylor, T.M. Characterization of beta-cyclodextrin inclusion complexes containing essential oils (trans-cinnamaldehyde, eugenol, cinnamon bark, and clove bud extracts) for antimicrobial delivery applications. LWT 2013, 51, 86–93. [Google Scholar] [CrossRef]
- Otálora, M.C.; Carriazo, J.G.; Iturriaga, L.; Nazareno, M.A.; Osorio, C. Microencapsulation of betalains obtained from cactus fruit (Opuntia ficus-indica) by spray drying using cactus cladode mucilage and maltodextrin as encapsulating agents. Food Chem. 2015, 187, 174–181. [Google Scholar] [CrossRef]
- Ronkart, S.N.; Paquot, M.; Blecker, C.S.; Fougnies, C.; Doran, L.; Lambrechts, J.C.; Norberg, B.; Deroanne, C. Impact of the Crystallinity on the Physical Properties of Inulin during Water Sorption. Food Biophys. 2008, 4, 49–58. [Google Scholar] [CrossRef]
- Beirão-Da-Costa, S.; Duarte, C.; Bourbon, A.I.; Pinheiro, A.C.; Januário, I.; Vicente, A.A.; Da Costa, M.L.B.; Delgadillo, I. Inulin potential for encapsulation and controlled delivery of Oregano essential oil. Food Hydrocoll. 2013, 33, 199–206. [Google Scholar] [CrossRef]
- Piletti, R.; Bugiereck, A.; Pereira, A.; Gussati, E.; Magro, J.D.; Mello, J.; Dalcanton, F.; Ternus, R.; Soares, C.; Riella, H.G.; et al. Microencapsulation of eugenol molecules by β-cyclodextrine as a thermal protection method of antibacterial action. Mater. Sci. Eng. C 2017, 75, 259–271. [Google Scholar] [CrossRef] [PubMed]
- Sajomsang, W.; Nuchuchua, O.; Gonil, P.; Saesoo, S.; Sramala, I.; Soottitantawat, A.; Puttipipatkhachorn, S.; Ruktanonchai, U.R. Water-soluble β-cyclodextrin grafted with chitosan and its inclusion complex as a mucoadhesive eugenol carrier. Carbohydr. Polym. 2012, 89, 623–631. [Google Scholar] [CrossRef] [PubMed]
- Coates, J. Interpretation of Infrared Spectra, a Practical Approach. Encycl. Anal. Chem. 2006, 12, 10815–10837. [Google Scholar] [CrossRef]
- Agnihotri, S.A.; Mallikarjuna, N.N.; Aminabhavi, T.M. Recent advances on chitosan-based micro- and nanoparticles in drug delivery. J. Control. Release 2004, 100, 5–28. [Google Scholar] [CrossRef]
- Ritger, P.L.; Peppas, N.A. A simple equation for description of solute release II. Fickian and anomalous release from swellable devices. J. Control. Release 1987, 5, 37–42. [Google Scholar] [CrossRef]
- Combrinck, J.; Otto, A.; Du Plessis, J. Whey Protein/Polysaccharide-Stabilized Emulsions: Effect of Polymer Type and pH on Release and Topical Delivery of Salicylic Acid. AAPS PharmSciTech 2014, 15, 588–600. [Google Scholar] [CrossRef]
- Patil, D.K.; Agrawal, D.S.; Mahire, R.R.; More, D.H. Synthesis, characterization and controlled release studies of ethyl cellulose microcapsules incorporating essential oil using an emulsion solvent evaporation method. Am. J. Essent. Oils Nat. Prod. 2016, 4, 9. [Google Scholar]
© 2020 by the authors. Licensee MDPI, Basel, Switzerland. This article is an open access article distributed under the terms and conditions of the Creative Commons Attribution (CC BY) license (http://creativecommons.org/licenses/by/4.0/).