Article

Directional Elastic Pseudospin and Nonseparability of Directional and Spatial Degrees of Freedom in Parallel Arrays of Coupled Waveguides

Department of Materials Science and Engineering, University of Arizona, Tucson, AZ 85721, USA
*
Author to whom correspondence should be addressed.
Appl. Sci. 2020, 10(9), 3202; https://doi.org/10.3390/app10093202
Submission received: 25 March 2020 / Revised: 28 April 2020 / Accepted: 29 April 2020 / Published: 4 May 2020
(This article belongs to the Special Issue Next Generation Mechanical Metastructures)

Abstract

:
We experimentally and numerically investigated elastic waves in parallel arrays of elastically coupled one-dimensional acoustic waveguides composed of aluminum rods coupled along their length with epoxy. The elastic waves in each waveguide take the form of superpositions of states in the space of direction of propagation. The direction of propagation degrees of freedom is analogous to the polarization of a quantum spin; hence, these elastic waves behave as pseudospins. The amplitude in the different rods of a coupled array of waveguides (i.e., the spatial mode of the waveguide array) refer to the spatial degrees of freedom. The elastic waves in a parallel array of coupled waveguides are subsequently represented as tensor products of the elastic pseudospin and spatial degrees of freedom. We demonstrate the existence of elastic waves that are nonseparable linear combinations of tensor products states of pseudospin/ spatial degrees of freedom. These elastic waves are analogous to the so-called Bell states of quantum mechanics. The amplitude coefficients of the nonseparable linear combination of states are complex due to the Lorentzian character of the elastic resonances associated with these waves. By tuning through the amplitudes, we are able to navigate both experimentally and numerically a portion of the Bell state Hilbert space.

1. Introduction

The phenomenon of quantum entanglement [1] has generated great scientific interest and value right from the beginning of quantum mechanics. The paradox suggested by Einstein, Podolsky, and Rosen was codified into a verifiable experimental inequality by Bell [2]. Quantum entanglement can be considered as combining two characteristics of quantum system, namely nonlocality and nonseparability. The realization of nonlocality is uniquely the province of quantum phenomena; however, recently, classical systems able to capture the characteristic of nonseparability [3,4,5,6,7] between different degrees of freedom of the same physical manifestation. In particular, in the field of optics, degrees of freedom of photon states that span different Hilbert spaces can be made to interact in a way that leads to local correlations [5,7,8,9,10,11,12,13,14,15,16,17]. In contrast, little attention has been paid to the nonseparability of sound waves; yet, remarkable new behaviors of sound, analogous to quantum physics, such as the notions of elastic pseudospin [18,19,20,21,22,23,24,25,26,27] and Zak/Berry phase [28,29,30,31,32,33,34,35,36], are emerging.
The concept of pseudospin, when one exists, is useful for understanding many fundamental quantum-like phenomena, such as the anomalous quantum Hall effect [21]. In 1932, Heisenberg originally introduced the concept of pseudospin when he described the structure of the atomic nucleus as composed of neutrons and protons and modeled as two states of the same particle [37]; hence, a pseudospin is a coherent superposition of states. The pseudospin was traditionally considered as an unmeasurable quantity. Recently, however, it has been suggested that pseudospin is a real angular momentum that might manifest itself as an observable quantity. Unlike the quantum spin, which is an intrinsic property of a particle, an elastic pseudospin is a property induced by the material that supports the elastic wave; hence, the state of superposition of the pseudospin is observable and measurable without wave function collapse. The concept of pseudospin has recently been introduced in various topological systems [38]. Building on the similar principles of photonic [39,40] and plasmonic [41] systems, we proposed theoretically the concept of a one-dimensional (1D) elastic pseudospin. We have shown an analogy between the propagation of elastic waves on an elastic pseudospin (composed of elastically coupled 1D waveguides) and quantum phenomena [18,23,24,25,26]. More specifically, the projection on the direction of propagation of elastic waves in this pseudospin is isomorphic to the spin of a quantum particle. The pseudospin states of elastic waves in these systems can be described via a Dirac-like equation and possess spinor amplitudes. In addition, for an elastic pseudospin that is constituted of parallel arrays of elastically coupled 1D waveguides, the amplitude also spans an N dimensional Hilbert subspace, where N is the number of waveguides, and represents spatial mode degrees of freedom across the array of waveguides [42,43,44,45]. These two degrees of freedom can be used to create classical nonseparability, i.e., the nonseparable superposition of elastic states in the form of linear combinations of tensor products of spatial modes and spinor amplitudes, so-called elastic Bell states. Ref. [44] reported the experimental preparation, measurement and tunability of elastic Bell states in a single system composed of three coupled waveguides. The current study expands significantly that report by analyzing elastic waves in N = 1, 2 and 3 waveguide systems. Particular attention is paid to the pseudospin character of elastic waves (via their dispersion character) in the two and three coupled waveguides systems. Furthermore, we report here an extensive theoretical and numerical analysis of pseudospin and nonseparable states in coupled waveguides to shed light on the experimental findings. For this, we have developed a numerical model of externally driven elastically coupled waveguides including dissipation. This model is fitted to some of our experimental data which it reproduces with good fidelity. This model is then used to explore the different ways of manipulating the Bell states complex amplitudes. This model shows that the driving frequency, the relative driving amplitudes and phases applied to the waveguides, are essential parameters for controlling the elastic Bell states. Finally, the model highlights the importance of the resonant frequencies of the bands associated with spatial modes and the damping coefficient of the elastic system in achieving Bell states with complex amplitudes.
Let us consider an elastic system composed of N identical 1D waveguides coupled elastically along their length and arranged in parallel array fashion (cf. Figure 1). In the continuum limit, the propagation of longitudinal modes is characterized by [43]:
{ H · I N × N + α 2 M N × N } u N × 1 = 0
where the dynamical differential operator,
H = 2 t 2 β 2 2 x 2
models the propagation of elastic waves in the direction x along the waveguides. The parameter β is proportional to the speed of sound in the waveguides. The parameter α measures the strength of the elastic coupling between the waveguides and we assume that α is the same for all coupled waveguides. u N × 1 is a vector whose components, u i ,   i = 1 , 2 , , N , represent the displacement of the ith waveguide? I N × N is the N × N identity matrix and the coupling matrix operator M N × N describes the elastic coupling between waveguides?
Dirac factorizing the Klein-Gordon (KG) Equation (1) leads to:
{ U N × N σ 1 t + β U N × N ( i σ 2 ) x ± i α U 2 N × 2 N M N × N σ 1 } Ψ 2 N × 1 = 0
The KG equation is used to describe relativistic particles in quantum mechanics. Dirac factorized the KG equation and established the theoretical foundation for the positron. The mathematical formulation of the Dirac equation naturally reveals the spin of relativistic particles. The factorization of the KG Equation (1) into a Dirac-like Equation (3) leads to non-trivial eigen modes that have spinor character and therefore non-conventional topology in wave number space [18,25]. Moreover, from Equation (3) we see that the equation does not satisfy time-reversal symmetry ( t t ) , T-symmetry, nor parity symmetry ( x x ) , P-symmetry, separately. That is, one does not recover Equation (3) when the sign of time and position are changed individually, though, they obey time and parity (PT) symmetry when applied simultaneously.
In Equation (3), U N × N and U 2 N × 2 N are antidiagonal matrices with unit elements, and
σ 1 = ( 0 1 1 0 )   and   σ 2 = ( 0 i i 0 )
are two of the Pauli matrices. Ψ 2 N × 1 is a 2 N -dimensional vector which represents the modes of vibration of the N waveguides projected in the two possible directions of propagation (forward and backward). M N × N is the square root of the coupling matrix. The square root of a matrix is not unique since the eigen vectors of M N × N are also the eigen vectors of the coupling matrix M N × N itself; the non-uniqueness of M N × N does not introduce difficulties in determining the elastic modes of the coupled system in the Dirac representation. We choose the components of the Ψ 2 N × 1 vector in the form of plane waves:
ψ I = a I e i k x e i ω t
with I = 1 , , 2 N ; k and ω being a wave number and an angular frequency, respectively. The amplitude vector ( a 2 N × 1 ) can be written as:
a 2 N × 1 = e n , N × 1 s 2 × 1 ,
where e n , N × 1 is the eigen vector of the matrix M N × N (i.e., M N × N ) with eigen value λ n . The operato M N × N , its eigen values and eigen vectors are representative of the spatial modes across the planar array of the waveguides. Inserting this tensor product solution into Equation (3) yields:
e n { ( [ ω I 2 × 2 β k σ z ] ± α λ n σ x ) s 2 × 1 } = 0
For non-trivial eigen vectors e n , the problem in the space of the directions of propagation reduces to finding solutions of
( [ ω I 2 × 2 β k σ z ] ± α λ n σ x ) s 2 × 1 = 0
In obtaining Equation (7), we have also used the fact that e n is an eigen vector of I N × N with eigen value 1 and we note that Equation (8) is the 1D Dirac equation for an elastic system which solutions,
s 2 × 1 = ( s 1 s 2 )
have the properties of Dirac spinors [18]. This eigen equation gives the dispersion relation
ω n 2 = ( β k ) 2 + ( α λ n ) 2
and the following spinor eigen vectors projected into the space of directions of propagation:
s 2 × 1 ( n ) ( ± ) = s 0 ( ω n + β k ± ω n β k )
The upper script in s 2 × 1 ( n ) refers to the spinor associated with band “n”. The spinors components represent elastic wave amplitude propagating in the forward and backward directions of propagation [18]; hence,
Ψ 2 N × 1 ( k ) = { s 2 × 1 ( n ) ( + k ) u N × 1 s 2 × 1 ( n ) ( k ) u N × 1 }
However, due to the finite length of the experimental setup (i.e. the acoustic waveguides) that only supports standing wave modes, the components of the spinors has to be converted which includes equi-amplitudes superposition of forward and backward components. Nonetheless, the wave vector, k , is still a good number to characterize the standing wave state in the system. By means of laser vibrometry, one can experimentally map the elastic standing waves states and their corresponding pseudospin states (as is done in [26,46]).
Since Equation (3) is linear, any superposition of modes is also a solution. Thus, it is possible to create a nonseparable superposition of elastic states in an array of coupled waveguides [42,43,44]. It is true that at steady states, the displacement field, u N × 1 , takes the form of a linear combination of frequency modes (see Supplementary Materials and [45]). However, it is possible to choose a particular isofrequency driver, which will minimize the amplitude of the e 1 , N × 1 spatial mode compared to that of e 2 , N × 1 and e 3 , N × 1 ( e 2 , N × 1 and e 3 , N × 1 correspond to two pseudospin bands with non-zero spatial eigen values [42,43,44]). For instance, exploiting the orthogonality of e 1 , N × 1 , e 2 , N × 1 and e 3 , N × 1 , one may employ a driving force such that it will be a linear combination of e 2 , N × 1 and e 3 , N × 1 . Finally, at a particular isofrequency state, it is also possible to limit the excitation to a single plane wave state in each band, i.e., k 2 for e 2 , N × 1 spatial mode band and k 3 for e 3 , N × 1 spatial mode band (as will be shown later) [42,43,44]. Nonetheless, we could choose to excite two plane wave states in each spatial band (as is done in [45]), and the total dimensionality of Hilbert space can be, in principle, increased by considering multi-level systems [46]. Hence, by exciting an isofrequency state ω = ω n = ω n and by limiting a single plane wave state in each band ( k n   and   k n ; k n k n ), we create acoustic nonseparable states as:
u N × 1 = ( A e n , N × 1 e i k n x + B e n , N × 1 e i k n x ) e i ω t
The quantities A and B will be shown later to be controllable complex amplitudes. Therefore, the objective of this paper is to demonstrate experimentally and numerically the realization of nonseparable superposition of isofrequency states in an array of elastically coupled waveguides. We need to have at least three coupled rods so that there are two non-zero spatial mode eigen values [42,43,44]. Hence, in the current study, we fabricated acoustic waveguides composed of up to three rods, i.e., N = 1 ,   2 ,   and   3 , and carried out physical and numerical experiment demonstrating the existence of (a) elastic modes taking the form of tensor products of spatial modes and spinor degrees of freedom, as well as (b) nonseparable linear combinations of these elastic modes with controllable amplitudes.

2. Materials and Methods

2.1. Fabrication of the Samples

The acoustic waveguides consist of aluminum rods (McMaster-Carr 1615T172: diameter D = 1 / 2 , length L = 0.6096   m , and density ρ = 2660 kg / m 3 ). The rods are coupled along their length with epoxy with a lateral gap of 2 mm and filling length L e = 0.5786   m (50176 KwikWeld Syringe). We consider two- and three-rod arrays (see Figure 1).

2.2. Experimental Fixtures and Procedures

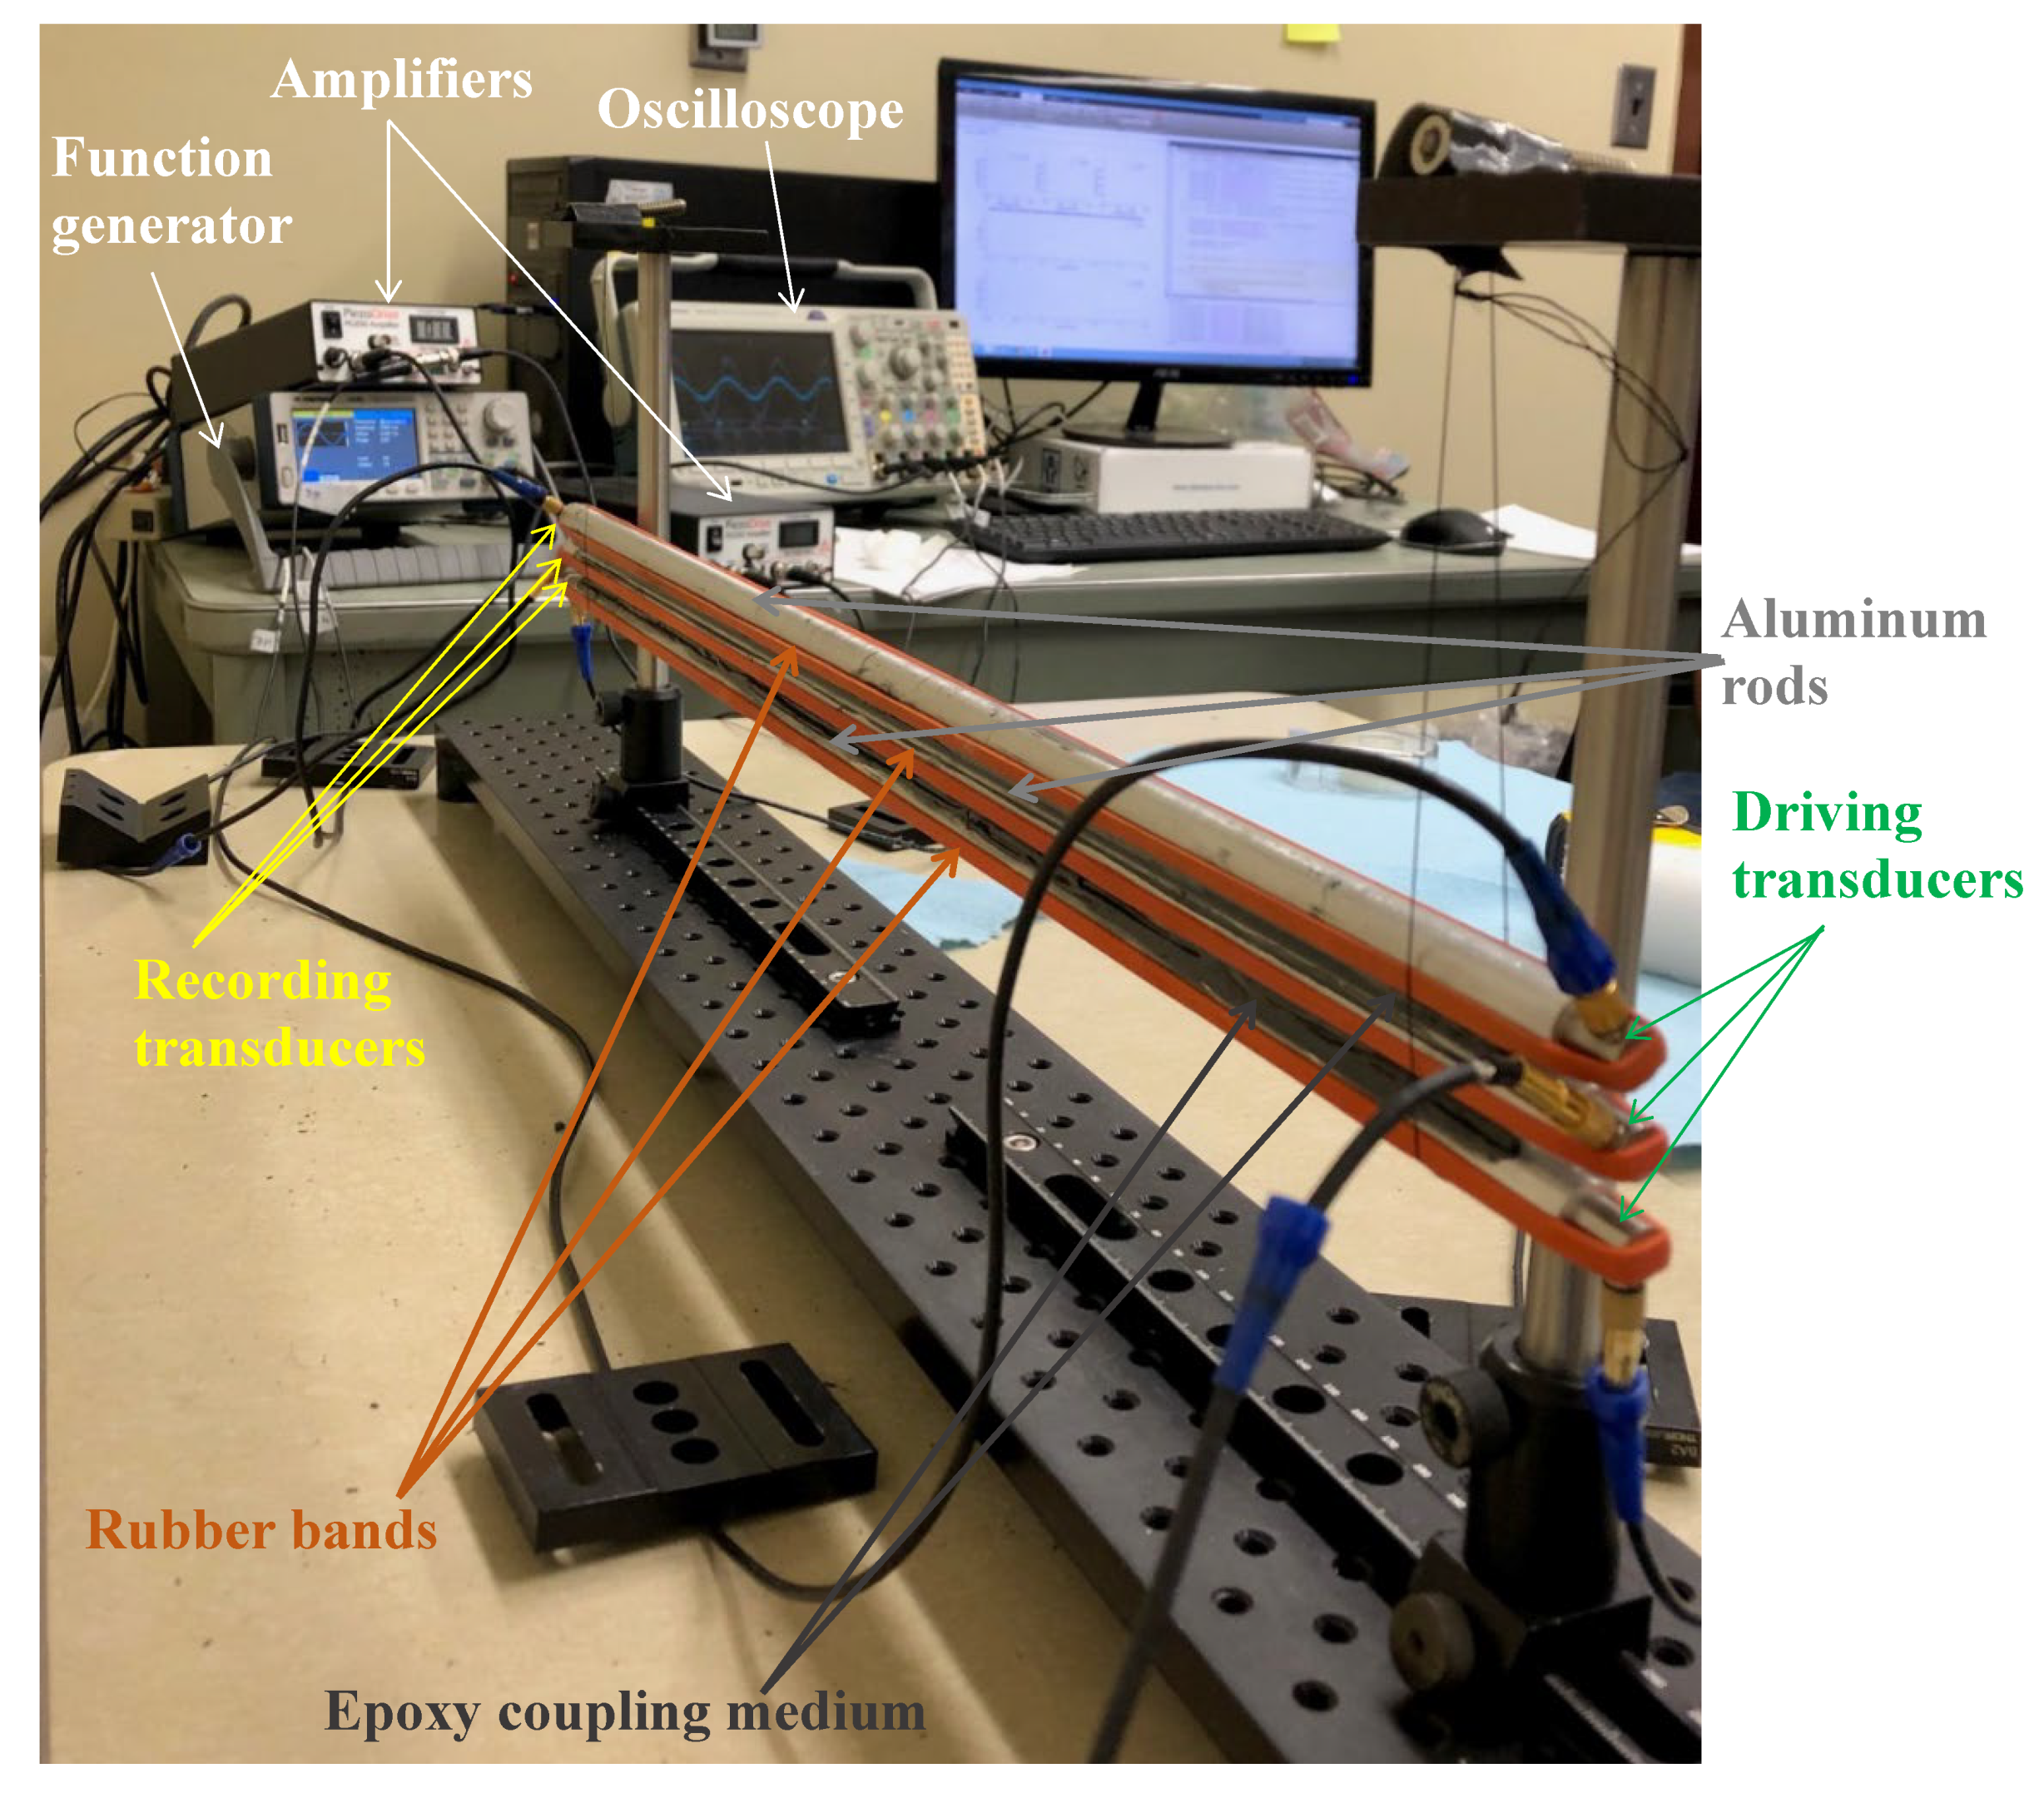
The experimental fixture is shown in Figure 2. The coupled rod arrays are suspended using thin threads to two supporting stands. Transducers (Olympus V133-RM Fingertip case style with ¼ inch element diameter) are used to drive rods in the coupled arrays at one end and to detect at the other end. The driving transducers are connected to arbitrary function generators (APG) (BK Precision 4055B) thorough amplifiers (PD200 60W Voltage Amplifier). The detecting transducers are connected to oscilloscopes (Tektronix MDO3024) to register signals transmitted to the other end of the rods. To drive the rods, we use sine waves with a scan in frequency between 1 kHz and 100 kHz in steps of 50 Hz. The driving and response signals, averaged over 256 time series, are collected in the oscilloscope. The APG and oscilloscope are connected to a computer, which controls the experiment and performs data processing by using an in-house developed and implemented algorithm in MATLAB R2019a. In the experiment, optimal resolution of the elastic wave modes is achieved by wrapping the transducer/rod assembly with bands (Alliance Rubber 08997 SuperSize Bands). Honey is used as coupling between the rods and the transducers. Rubber bands also ensures a constant pressure on the transducers. The phase of the driving transducers can be controlled to excite specific spatial eigen modes.

3. Experimental Results

3.1. Single Rod Acoustic Waveguide, N = 1

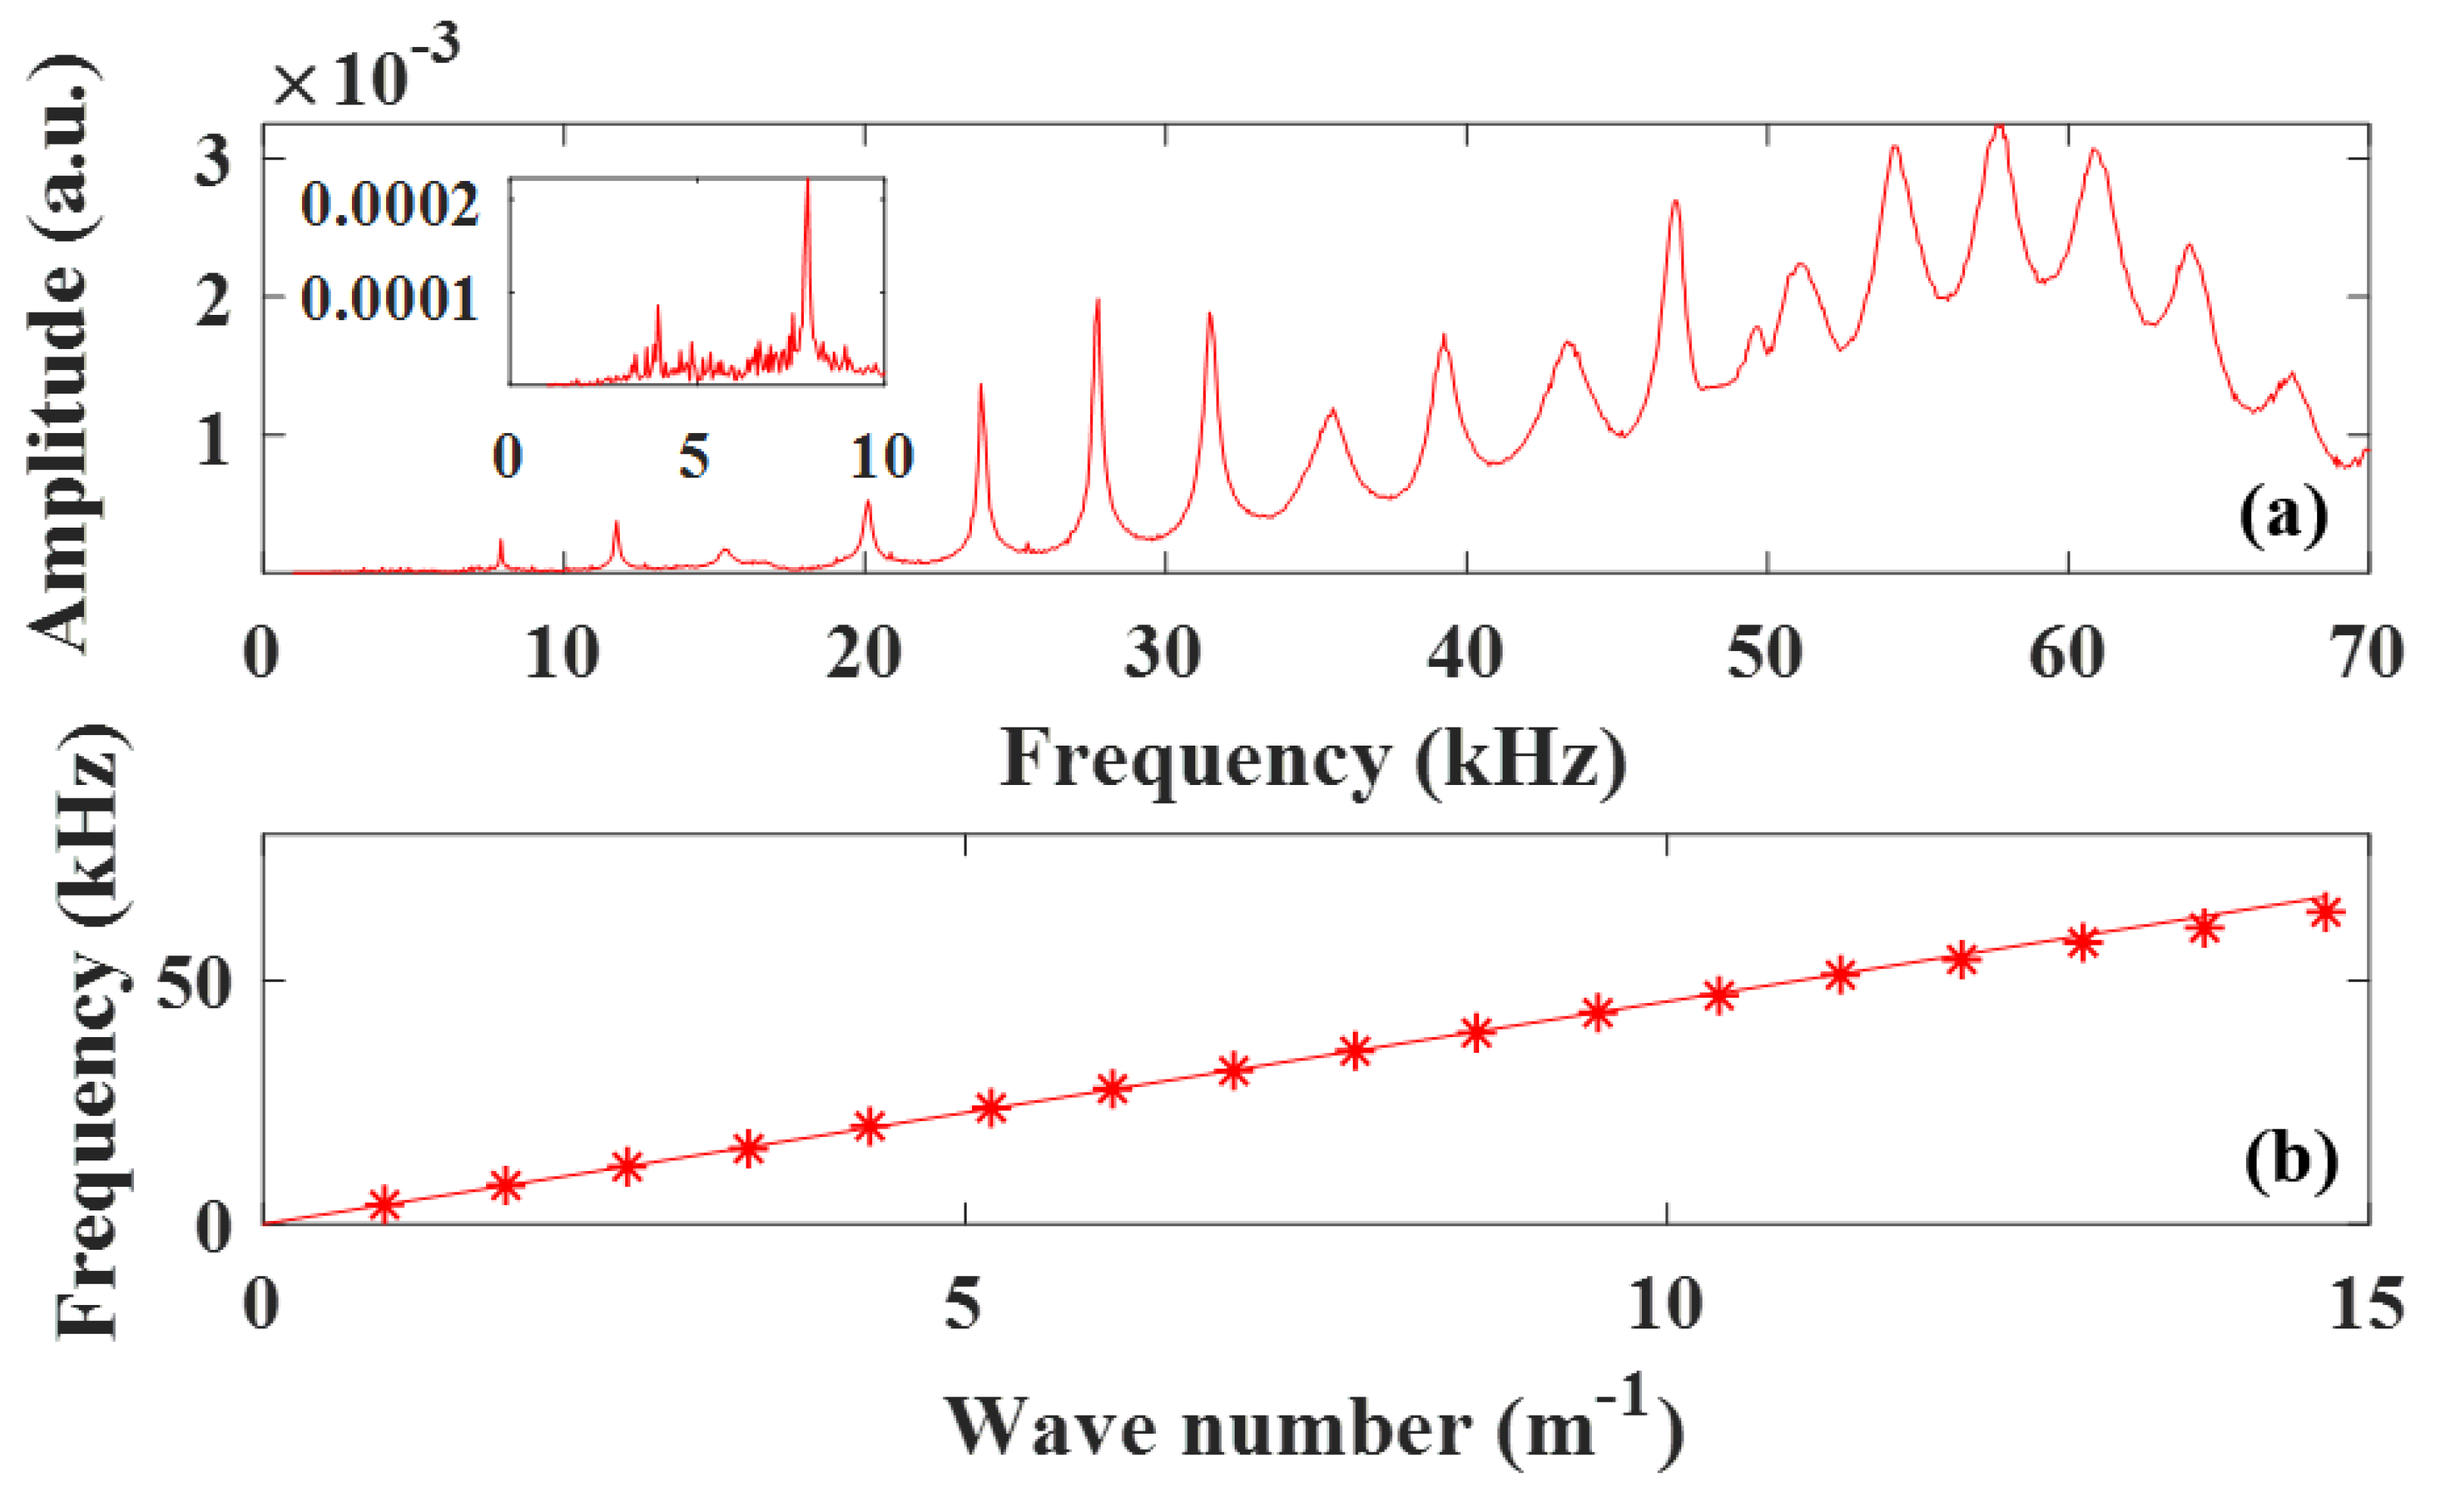
Prior to investigating arrays of elastically coupled rods, we establish the characteristics of a single ( N = 1 ) free standing aluminum rod. Figure 3 reports the measured experimental transmission spectrum. Figure 3 depicts resonances of the standing wave modes of the finite length waveguide. The peak positions of Figure 3 define the resonance frequencies (i.e., the modes) of the system. The wavelength of the standing waves can be calculated by λ = 2 L / n ; n is an integer corresponding to the number of nodes of the standing waves (this is discussed in the numerical study of Section 3). A value of n is assigned to each standing wave mode and hence the wave number becomes k = 1 / λ . Figure 3b shows the resultant dispersion relation. The speed of sound ( β ) of the nearly 1D acoustic waveguide is obtained as 4571 m/sec (by fitting, see Figure 3b). In Figure 3, we also observe that for frequencies above 60 kHz the resonant modes begin to deviate from the linear dispersion relation indicating that for short wavelengths the rod with finite cross section does not behave like a 1D elastic waveguide.

3.2. Coupled Two-Rod Waveguides, N = 2

In the case of two coupled rod waveguides, the coupling matrix ( M 2 × 2 ) of Equation (1) and (3) takes the form: M 2 × 2 = ( 1 , 1 ; 1 , 1 ) . Therefore, the two spatial mode eigen vectors corresponding to the eigen values λ 1 = 0 , and λ 2 = 2 , are: e 1 = 1 2 ( 1 1 ) ,   e 2 = 1 2 ( 1 1 ) , and the associated dispersion relations are ω k 2 = ( β k ) 2 and ω k 2 = ( β k ) 2 + 2 ( α ) 2 . Here, we drive the coupled waveguides with amplitudes corresponding to the symmetric eigen vector e 1 and anti-symmetric eigen vector e 2 . The transmission spectra of the two spatial eigen modes are shown in Figure 4a. It is clear from the figure that the transmission spectra depends on the stimulation types. The e 2 anti-symmetric mode shows negligible transmission below around 20 kHz. Above 20 kHz, the transmission spectrum shows well defined resonances with non-uniform frequency spacing. The resonances appear to be spaced more closely at low frequency. Therefore, the spectra show a passing band with well-defined resonances. In addition, in this band the experimental conditions enable us to resolve resonances with frequencies very close to the cutoff frequency, which helps us to calculate the dispersion relation. Figure 4b shows the resultant dispersion relation for both bands. For the symmetric band, we use the technique discussed above and use k = 1 / λ = n / 2 L e . We find the speed of sound β = 4502 m/s. To calculate the dispersion relation of the e 2 band, i.e., ω k 2 = ( β k ) 2 + 2 ( α ) 2 , we need ( k , ω k ) i.e., the wave number and the associated resonant frequency. Similarly, to the case of the symmetric band, the wave numbers for the anti-symmetric band are multiples of 2 L e (since finite length waveguides only support standing waves). Therefore, we label each resonance with the lowest resolvable frequency as being m = 1 and rewrite the dispersion relation as ω k , m 2 = β 2 Δ k 2 ( m 0 + m ) 2 + 2 ( α ) 2 . The lsqcurvefit function of MATLAB is used to determine α and m 0 from the frequency resonances of Figure 4a, and we obtain α = 14.31   kHz and m 0 = 1 . The cutoff frequency of ( 2 α = )   20.24   kHz is consistent with the measured transmission spectra of Figure 4a.

3.3. Coupled Three-Rod Waveguides, N = 3

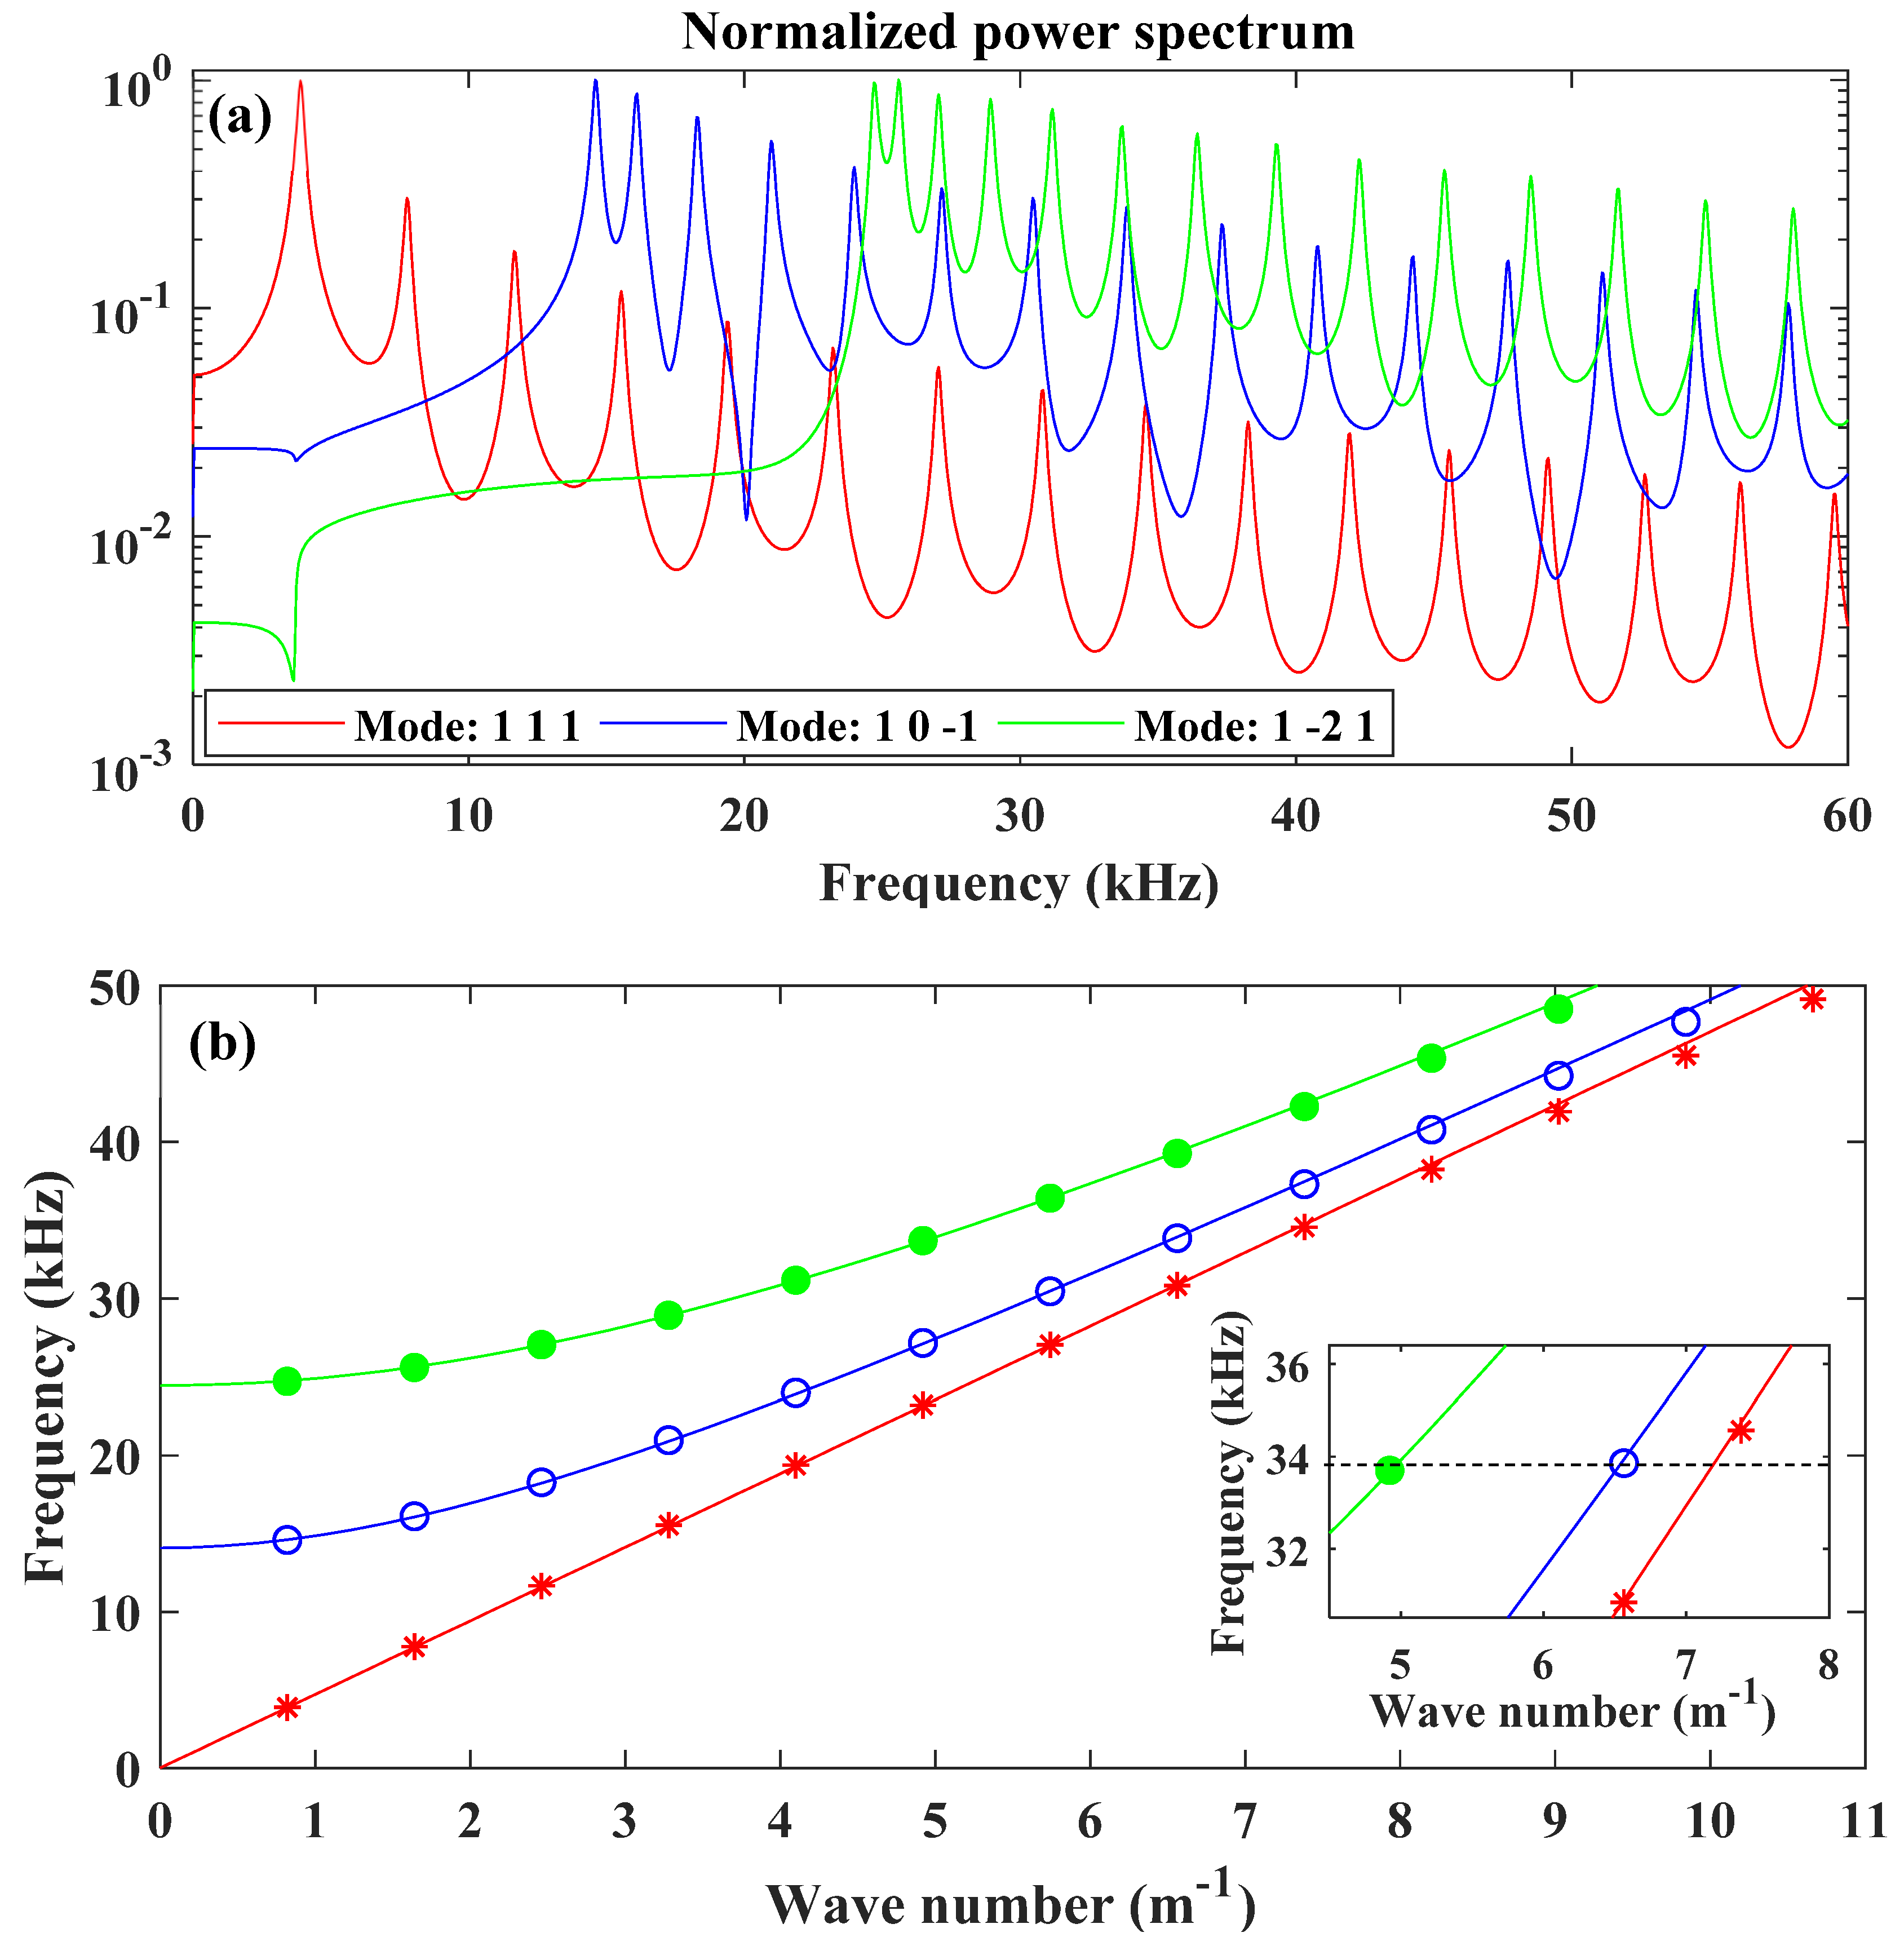
For N = 3 , M 3 × 3 = ( 1 1 0 1 2 1 0 1 1 ) and the three spatial eigen vectors corresponding to the eigen values λ 1 = 0 , λ 1 = 1 , and λ 3 = 3 , are: e 1 = 1 3 ( 1 1 1 ) ,   e 2 = 1 2 ( 1 0 1 ) ,   e 3 = 1 6 ( 1 2 1 ) . The associated dispersion relations are ω k 2 = ( β k ) 2 , ω k 2 = ( β k ) 2 + ( α ) 2 and ω k 2 = ( β k ) 2 + 3 ( α ) 2 . The frequency spectrum of the three spatial eigen modes are shown in Figure 5a. The spectra shows well-defined resonances of the standing waves. The second ( e 2 ) and third ( e 3 ) spatial eigen modes (Mode 1 0 −1: blue and Mode 1 −2 1: green of Figure 5a) transmission spectra differ from e 1 (first) eigen mode (Mode 1 1 1: red). e 2 and e 3 eigen modes show a significant depression in the transmission amplitude below a cutoff frequency and the resonances are spaced more closely near the cutoff. Figure 5b shows the resultant dispersion relation determined and calculated from spectra of Figure 5a. The speed of sound, β = 4467 m/s, is extracted from the first eigen vector. By comparing the speed of sound of the coupled waveguides to the single waveguide, we see that the speed of sound decreases from 4571 m/s to 4467 m/s as the number of rods in the waveguides increases from N = 1 to N = 3 . This can be attributed to the added mass in the coupled waveguides coming from the epoxy coupling medium, as well as an effect of the different cross-sectional geometry of the coupled rods compared to the single rod. Finally, the lsqcurvefit function of MATLAB is used again to obtain the dispersion relation of the second and third bands with cutoff frequencies 14.23   kHz for e 2 and 24.27   kHz for e 3 .
The resonances shown in Figure 5 correspond to separable states, i.e., states expressible as tensor products of spatial and spinor degrees of freedom. To realize a nonfactorizable superposition of elastic states, i.e., an acoustic Bell state that is not separable, we construct the superposition of isofrequency states of the three coupled rods system corresponding to the two non-zero spatial eigen values: Ψ 6 × 1 = A e 2 s 2 × 1 ( k 2 )   e i k 2 x e i ω t + B e 3 s 2 × 1 ( k 3 )   e i k 3 x e i ω t . Here, A and B are the Bell state coefficients, which maybe complex, and we have chosen ω 2 = ω 3 = ω . The wave numbers k 2 and k 3 are in the e 2 and e 3 bands with isofrequency ω . In this superposition, both the eigen vectors of the spatial mode and the spinors are different. This superposition of states cannot be written in the form of a tensor product of one spatial eigen vector and one spinor.
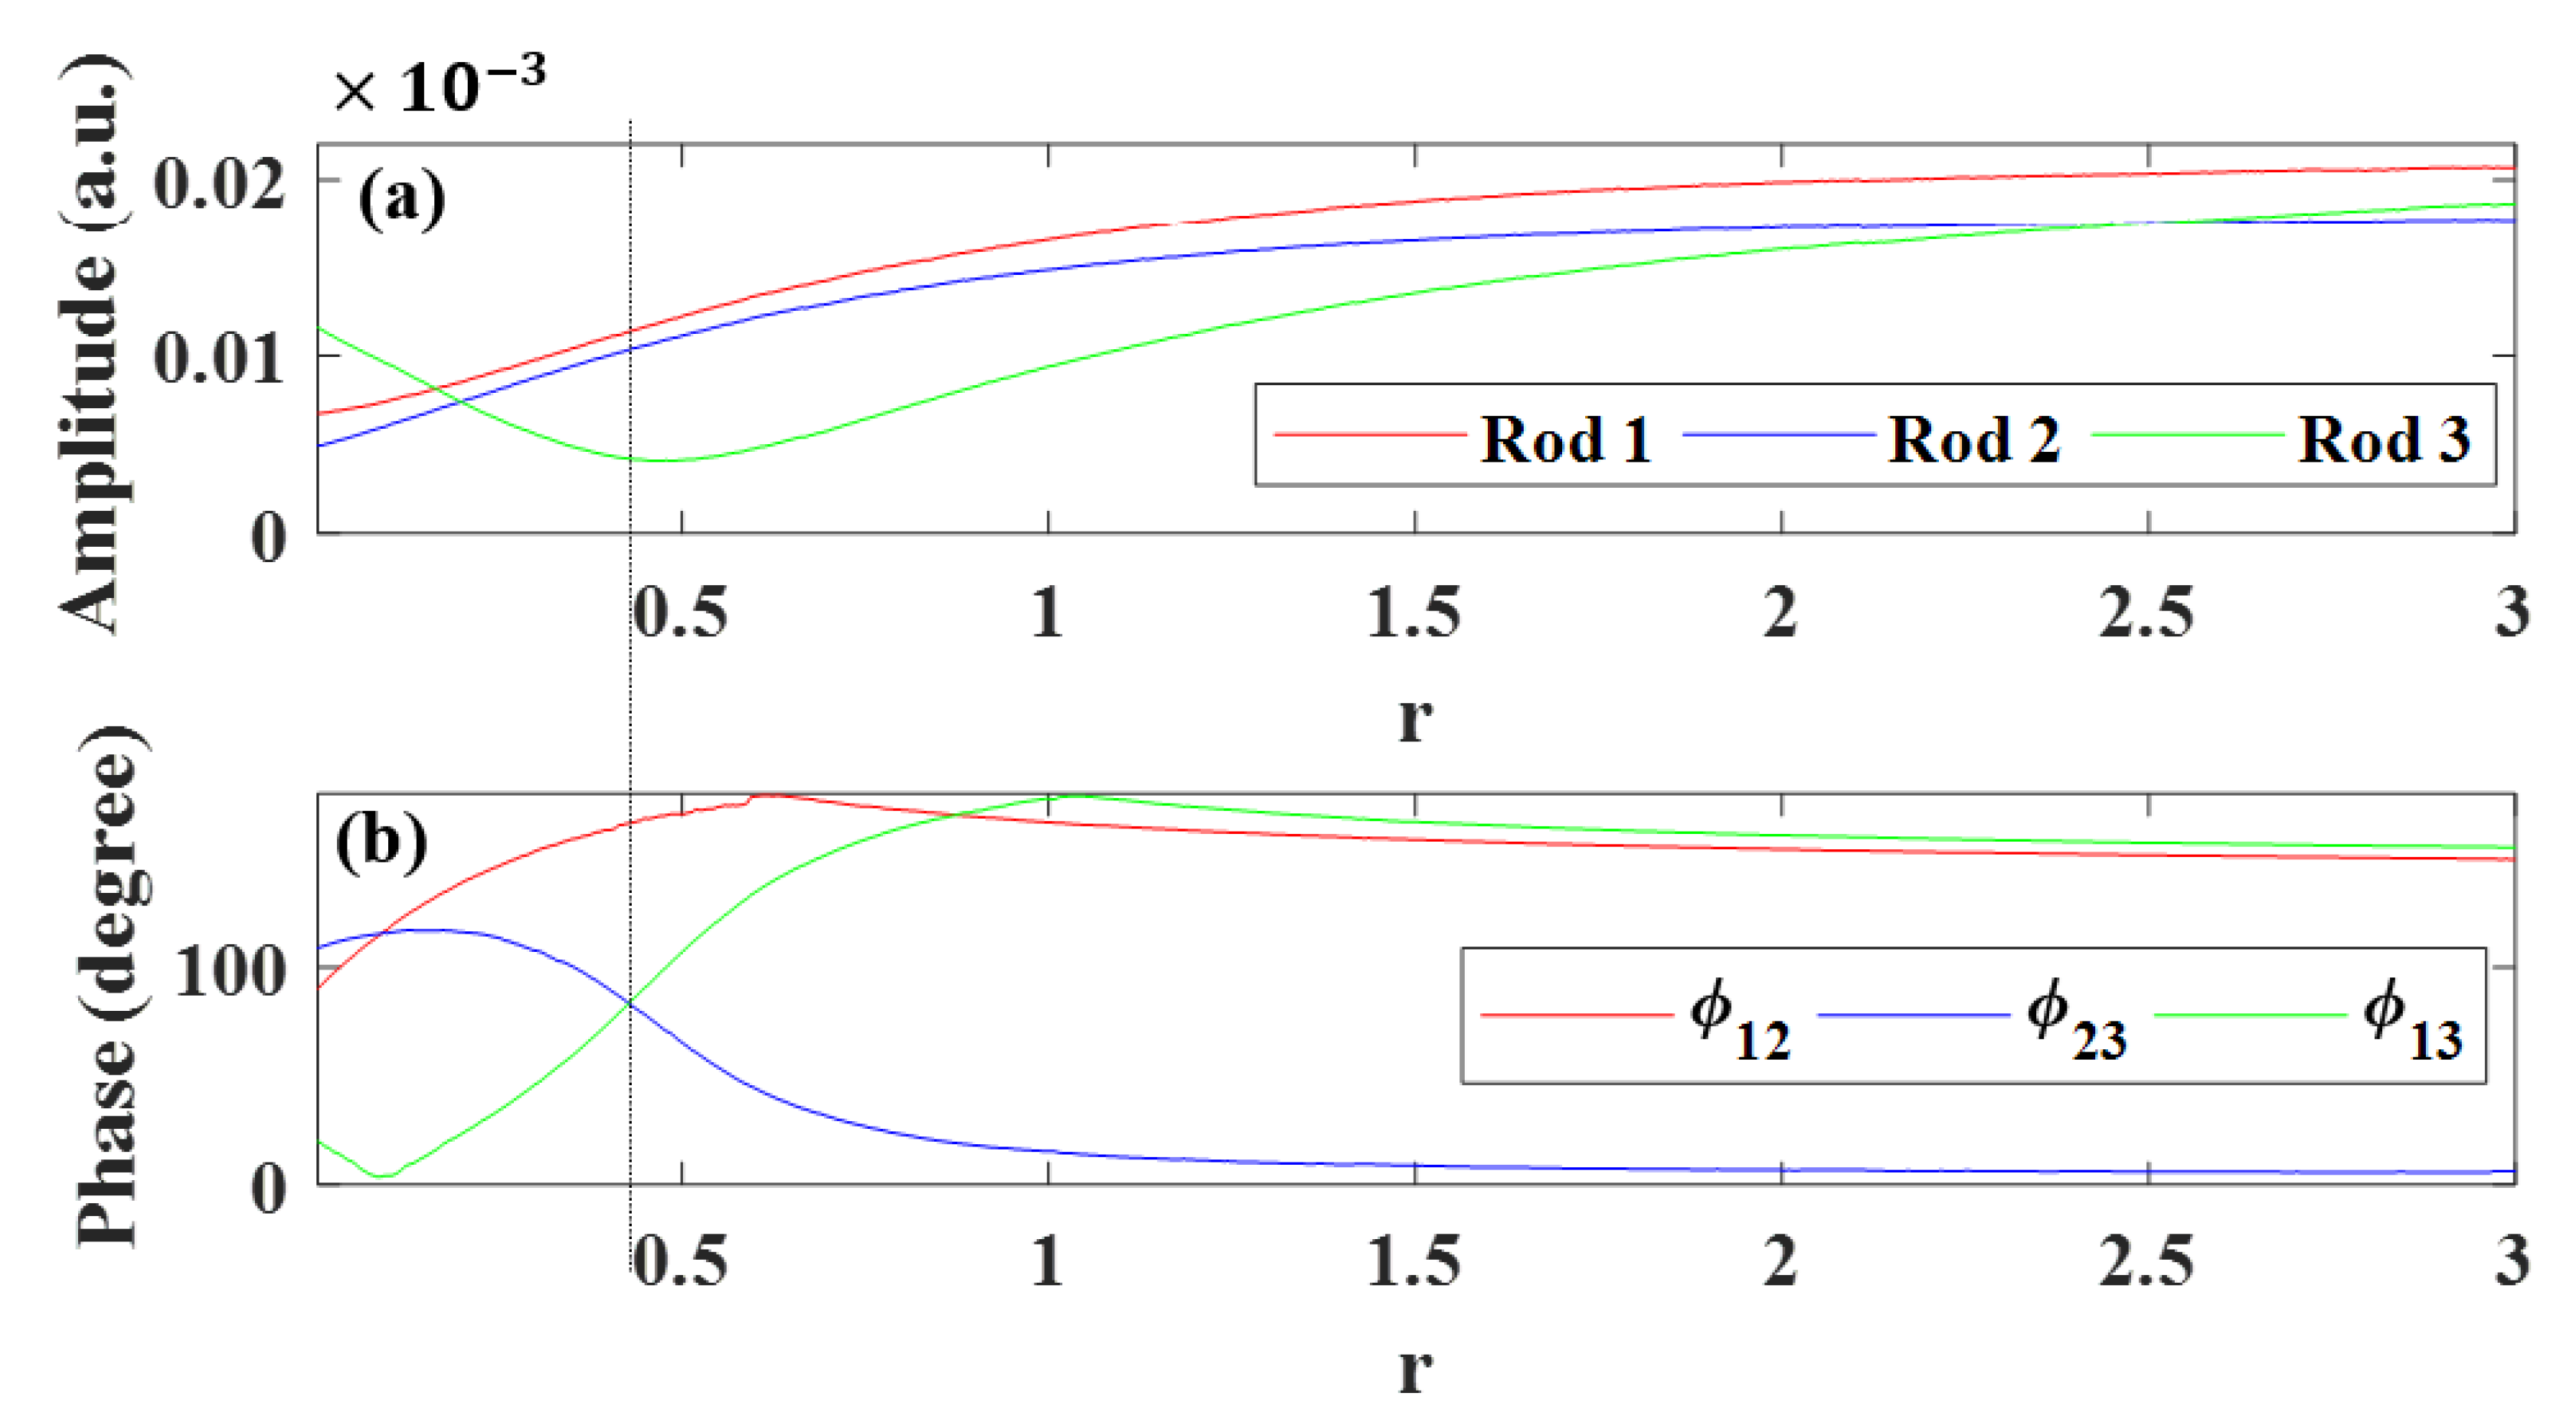
To create such a nonseparable elastic state experimentally, we identify a isofrequency state of 33.25 kHz (see insets of Figure 5a,b). At this frequency, there is substantial transmission of e 2 and e 3 eigen modes with negligible transmission of e 1 . We drive the system at 33.25 kHz by
( F 1 sin ( ω t ) F 2 sin ( ω t + π ) 0 ) ,
where F 1 , F 2 are the excitation amplitudes of rod 1 and 2, respectively. We also define r = | F 1 / F 2 | , the excitation amplitude ratio. Figure 6a shows the transmission amplitudes of each rod, and Figure 6b shows the phase difference, ϕ i j ;   i , j = 1 , 2 , 3   and   i j , between the transmission of rods as a function of r . From Figure 6b, we see that by manipulating only one parameter r , the excitation amplitude ratio, the eigen modes superposition can be experimentally tuned. From Figure 6, we also see that, for a particular excitation amplitude ratio r = 0.4356 (dashed line in Figure 6), the transmitted amplitudes of rod 1 and 2 are almost equal and for rod 3 is small (close to zero). In addition, phase difference between rods 2 and 3 ( ϕ 23 ) , as well as 1 and 3 ( ϕ 13 ) , are π / 2 and between 1 and 2 ( ϕ 12 ) is close to π . This relation signifies that though the driving amplitude of rods 1, 2, and 3 are F 0 ( 0.4356 , 1 , 0 ) , the transmitted amplitudes are A 0 ( 1 , 1 , ϵ ) , where ϵ 1 and F 0 and A 0 are constants. To accommodate these conditions using Equation (8), the Bell state coefficients, A and B , must be complex.
We now determine A and B , the Bell state (complex) coefficients, for the excitation amplitude ratio r = 0.4356 . The Bell state is constructed as a superposition of elastic waves, each a product of a plane wave part and a spatial mode part:
u 3 × 1 = ( A e 2 e i k 2 x + B e 3 e i k 3 x ) e i ω t .
For the case of isofrequency state at ω = 33.25   kHz , from Figure 5b, we have k 2 = 2 π 2 L 8 and k 3 = 2 π 2 L 6 (in the finite waveguide, the wave numbers are integer multiples of π / L ). At that frequency and at x = L , Equation (15) reduces to:
A 2 ( 1 0 1 ) + B 6 ( 1 2 1 ) = ( C 1 e i ϕ 1 C 2 e i ϕ 2 C 3 e i ϕ 3 ) .
In Equation (16), C i ;   i = 1 ,   2 ,   3 are the maximum displacement amplitudes of each rod recorded at the detecting end of the waveguide, and ϕ i ;   i = 1 ,   2 ,   3 are the corresponding phases. Equation (16) can be simplified in terms of the phase differences, ϕ i j ; i , j = 1 , 2 , 3   and   i j , between the transmission of each rods as:
( C 1 e i ϕ 12 C 2 C 3 e i ϕ 23 ) ,
where ϕ 12 = ϕ 1 ϕ 2 , ϕ 23 = ϕ 2 ϕ 3 , and for the sake of simplicity we assume ϕ 2 = 0 . From Equation (16) and (17) it is clear that if B is a real number (which could be normalized to one), A has be a complex. For the specific excitation amplitude ratio, we find, arg ( A ) 7 8 π , with an estimated experimental uncertainty of 1 12 π . The complex coefficients arise naturally due to the Lorentzian character of the resonance modes as will be shown in the numerical modeling of Section 3 and a theoretical model (see Supplementary Materials). Therefore, the arg   ( A ) and, hence, the Bell state coefficients A and B depends on the amplitudes ( C i ) and phases ( ϕ i ) of each detecting rods, which also depends on the excitation amplitudes of each rods as shown in Figure 6. Therefore, Equations (16) and (17) shows how to tune the eigen mode superposition, i.e., the Bell state. In summary, by manipulating a single input, the relative driving amplitudes of the two rods (rods 1 and 2), the Bell state coefficients can be tuned, which allows to navigate a portion of the Hilbert space. Further, we anticipate that exploration of the Bell state Hilbert space can be enlarged by choosing other choices of input parameters of the drivers.

4. Numerical Modeling: Mass-Spring Waveguides

We develop a numerical model based on mass-spring waveguides that can be used to shed light on the complex behavior of nonseparable states in coupled rod systems. For this, we assume that each rod can be represented by a 1D harmonic crystal composed of connected identical masses and springs and that no pre-compression exists in the chain. We further assume that the masses of each chain are constrained to move only in the horizontal direction. Therefore, the coupled rod system can be represented as a set of 1D harmonic crystals coupled along their length by longitudinal harmonic springs. Dissipative effects in the medium are modeled by linear viscous damping elements.

4.1. Single Chain Mass-Spring Waveguides

For a single mass-spring chain with a total of N m identical masses, the discrete elastic equations of motion are:
m u ¨ n k n n ( u n + 1 2 u n + u n 1 ) + η u ˙ n = 0
In Equation (18), u n is the displacement of n t h mass of the chain, m is the mass, and the viscous damping coefficient η models the dissipation. The term k n n describes the coupling constant of the nearest-neighbor interaction. To model the excitation applied by the transducer, the prescribed base periodic excitation F u ( t ) = F 0 u ω i sin ( ω i t ) is applied to the first mass of the chain, where F 0 u and ω i are the amplitude and frequency of the applied force. We use free boundary conditions; hence, the equations of motion for the first mass and last mass in the chain are:
m u ¨ 1 k n n ( u 2 u 1 ) + η u ˙ 1 = F u ( t ) ,
m u ¨ N k n n ( u N + u N 1 ) + η u ˙ N = 0
.
To mimic the physical experiment, in the numerical model we have used m = m R / N m and k n n = E A / a , where a ( = L / N m ) is the inter-mass spacing, and m R ( = ρ A L ) , E ( = 60   GPa ) and A ( = π d 2 / 4 ) are the mass, Young’s modulus and cross-sectional area of the aluminum rod, respectively.
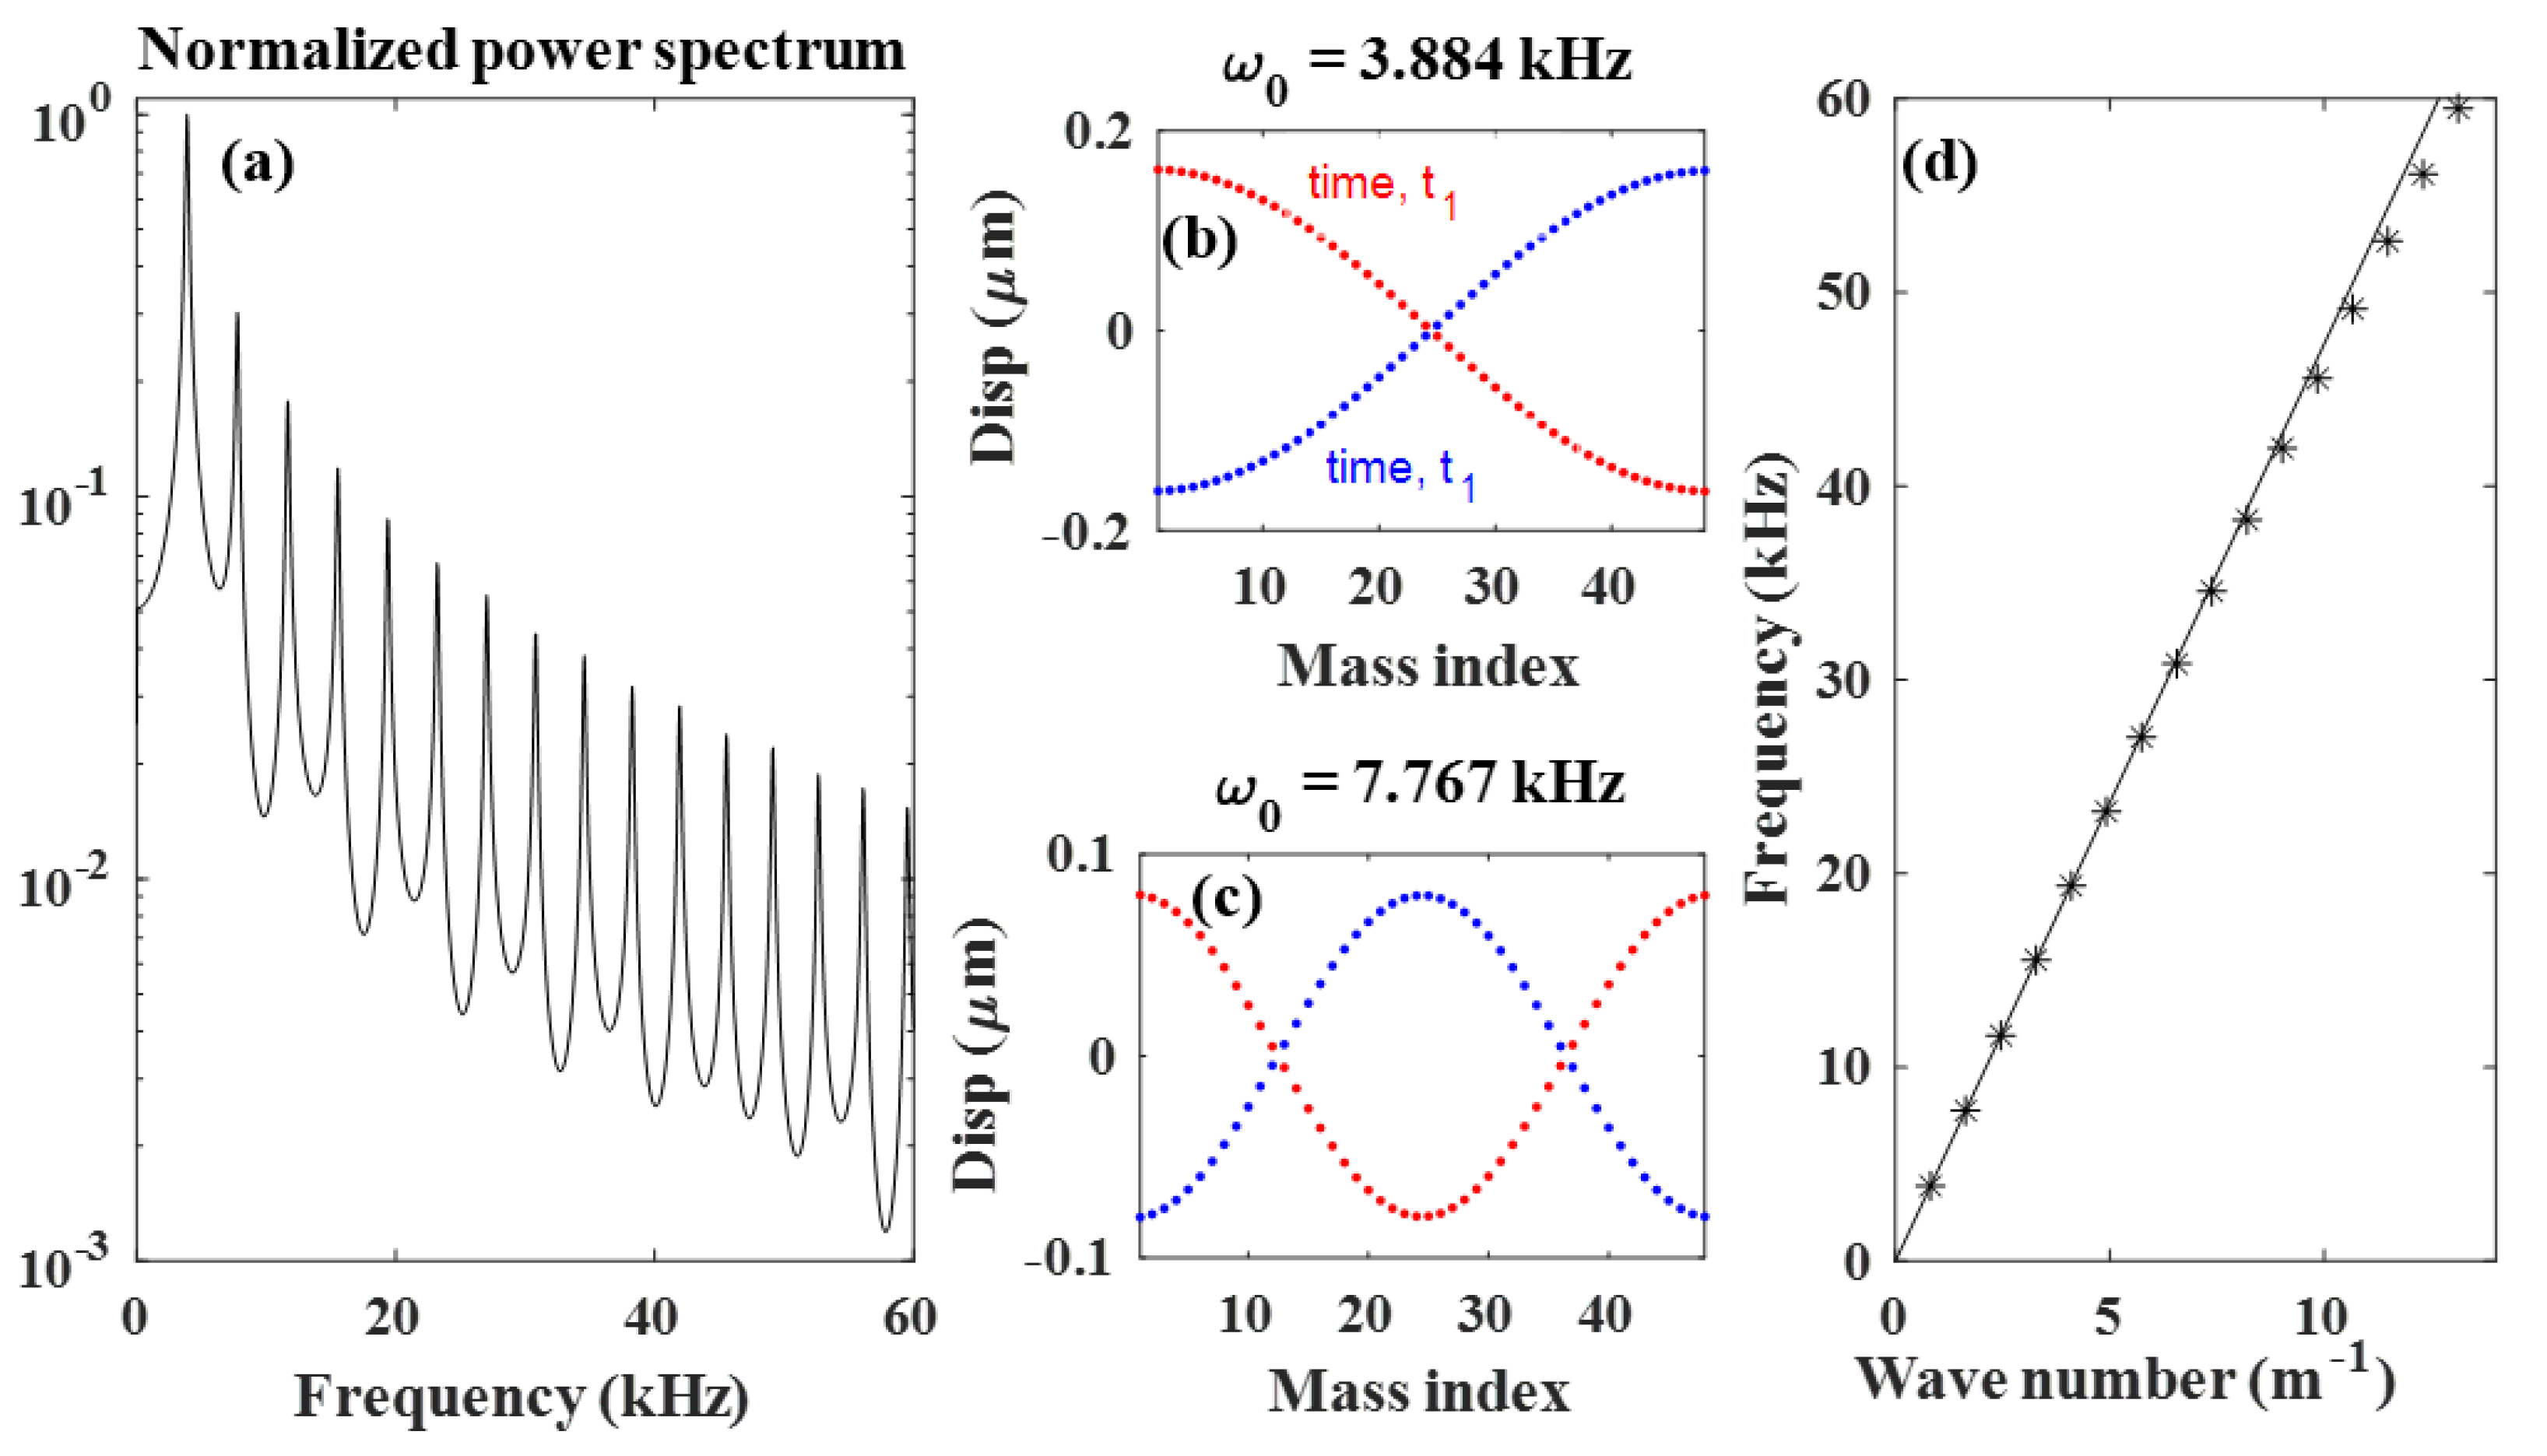
Figure 7a shows the normalized power spectral density of the last mass displacement time series. Figure 7a shows resonance frequencies of the standing waves of the finite mass-spring waveguides. The peak positions define the eigen frequencies (i.e., the resonance modes) of the system with uniform frequency spacing. After calculating the eigen frequencies from Figure 7a, we drive the first mass of the chain with a single driving frequency of 3884   kHz (Figure 7b) and 7.767   kHz (Figure 7c) that corresponds to the first and second resonance mode of the system. In Figure 7b,c, we present snapshots of the displacements of all masses. Figure 7b,c depicts the spatial distributions of the displacement components at two different time instants, t 1 and t 2 . We can clearly note the spatially extended response of the chain with only a single node (Figure 7b) or two nodes (Figure 7c). Therefore, the wavelength and the wave number are λ = 2 N m a / n ; n being the number of nodes, and k = 1 / λ . Figure 7d shows the resultant dispersion relation obtained from Figure 7a–c. The speed of sound equals 4706 m/sec, which is slightly higher than the experimental value of 4571 m/sec for single rod, however, close to the model value of β = k n n a 2 / m = E / ρ = 4750   m / s . In Figure 7, we limited the analysis to frequencies below 60 kHz, since above that value the resonant modes begin to deviate from the linear dispersion relation (cf. Figure 7d), i.e., is dispersive, indicating that at high frequency regime the discretized mass spring model does not represent the 1D continuous elastic waveguides.

4.2. Coupled Two-Chain Mass-Spring Waveguides

The discrete elastic equations of motion of the coupled two-chain mass-spring waveguides are:
m u ¨ n k n n ( u n + 1 2 u n + u n 1 ) k c ( v n u n ) + η u ˙ n = 0 ,
m v ¨ n k n n ( v n + 1 2 v n + v n 1 ) k c ( u n v n ) + η v ˙ n = 0
.
In Equations (21) and (22), u n and v n are the displacements of n t h mass of chain 1 and 2, respectively. The term k c describes the stiffness of the springs that couples the chains. To model the excitation applied by the transducer, the prescribed base periodic excitation F u ( t ) = F 0 u ω i sin ( ω i t ) and F v ( t ) = F 0 v ω i sin ( ω i t + ϕ 0 v ) are applied to the first mass of each chain, where F 0 v and ϕ 0 v are the amplitude and phase of the applied force to chain 2.
In the numerical experiment, first we excite the coupled chains with the first eigen vector (Mode: 1 1) to the first mass of each chain. In Figure 8a, we show the normalized power spectral density of the last mass displacement time series of the first chain for this symmetric mode. The resultant dispersion relation of the symmetric band is shown in Figure 8b. We then excite the coupled chains with the second eigen vector (Mode: 1 −1). To obtain a model which behavior mimics that of the experimental system, we vary the stiffness of the springs that couples the chains, i.e., k c to obtain a cutoff frequency close to 20.24   kHz (see Figure 4). In Figure 8a, we show the normalized power spectral density of the last mass displacement time series of the first chain for the anti-symmetric mode (Mode: 1 1) for k c = 33.5 × 10 6   N / m . This second spatial eigen mode (Mode 1 −1: blue of Figure 8a) exhibits a spectrum that differs from that of the symmetric one. This spectrum shows negligible transmission amplitude below the cutoff frequency. Above the cutoff frequency, the transmission spectrum possesses clear resonances with non-uniform frequency spacing, though at low frequency the resonances are closely spaced. Since the wave numbers for the second band are also multiples of 2 N m a , the corresponding dispersion relation can be calculated using the expression ω k 2 = ( β k ) 2 + 2 ( α ) 2 . The lsqcurvefit function of MATLAB is used to numerically obtain the cutoff frequency of 19.91   kHz .

4.3. Coupled Three-chain Mass-Spring Waveguides

For three coupled mass-spring chains, the discrete elastic equations of motion are given by:
m u ¨ n k n n ( u n + 1 2 u n + u n 1 ) k c ( v n u n ) + η u ˙ n = 0
m v ¨ n k n n ( v n + 1 2 v n + v n 1 ) k c ( u n v n ) k c ( w n v n ) + η v ˙ n = 0 ,
m w ¨ n k n n ( w n + 1 2 w n + w n 1 ) k c ( v n w n ) + η w ˙ n = 0
.
In Equations (23)–(25), u n ,   v n , and w n are the displacements of n t h mass of chain 1, 2, and 3, respectively. Here, we take k c to be the same for all coupled chains, which is justified since the experimental sample ensures uniform epoxy fillings between the rods. To model the excitation applied by the transducer, the prescribed base periodic excitation F u ( t ) = F 0 u ω i sin ( ω i t ) ,   F v ( t ) = F 0 v ω i sin ( ω i t + ϕ 0 v ) and F w ( t ) = F 0 w ω i sin ( ω i t + ϕ 0 w ) are applied to the first mass of each chain, where F 0 w and ϕ 0 w are the amplitude and phase of the applied force to chain 3.
Figure 9a reveals the eigen frequencies of the coupled three-chain mass-spring waveguides for the three spatial eigen modes, and Figure 9b shows the resultant dispersion relations. Similarly to the experimental result of Figure 5, the second and third spatial eigen modes differ from the first eigen mode. Below the cutoff frequencies, the transmissions are negligible. The resonances are clearly defined and closely spaced as one approaches the cutoff frequencies. Again, the wave numbers for all the bands are multiples of 2 N m a . We also use the coupling spring stiffness as k c = 33.5 × 10 6   N / m , obtained from the model of two coupled chains. With this choice, we obtain the cutoff frequencies of 14.08 kHz and 24.43 kHz in excellent agreement with experimental values. This model of two and three coupled chains can therefore be used to interpret the experimentally observed behaviors.
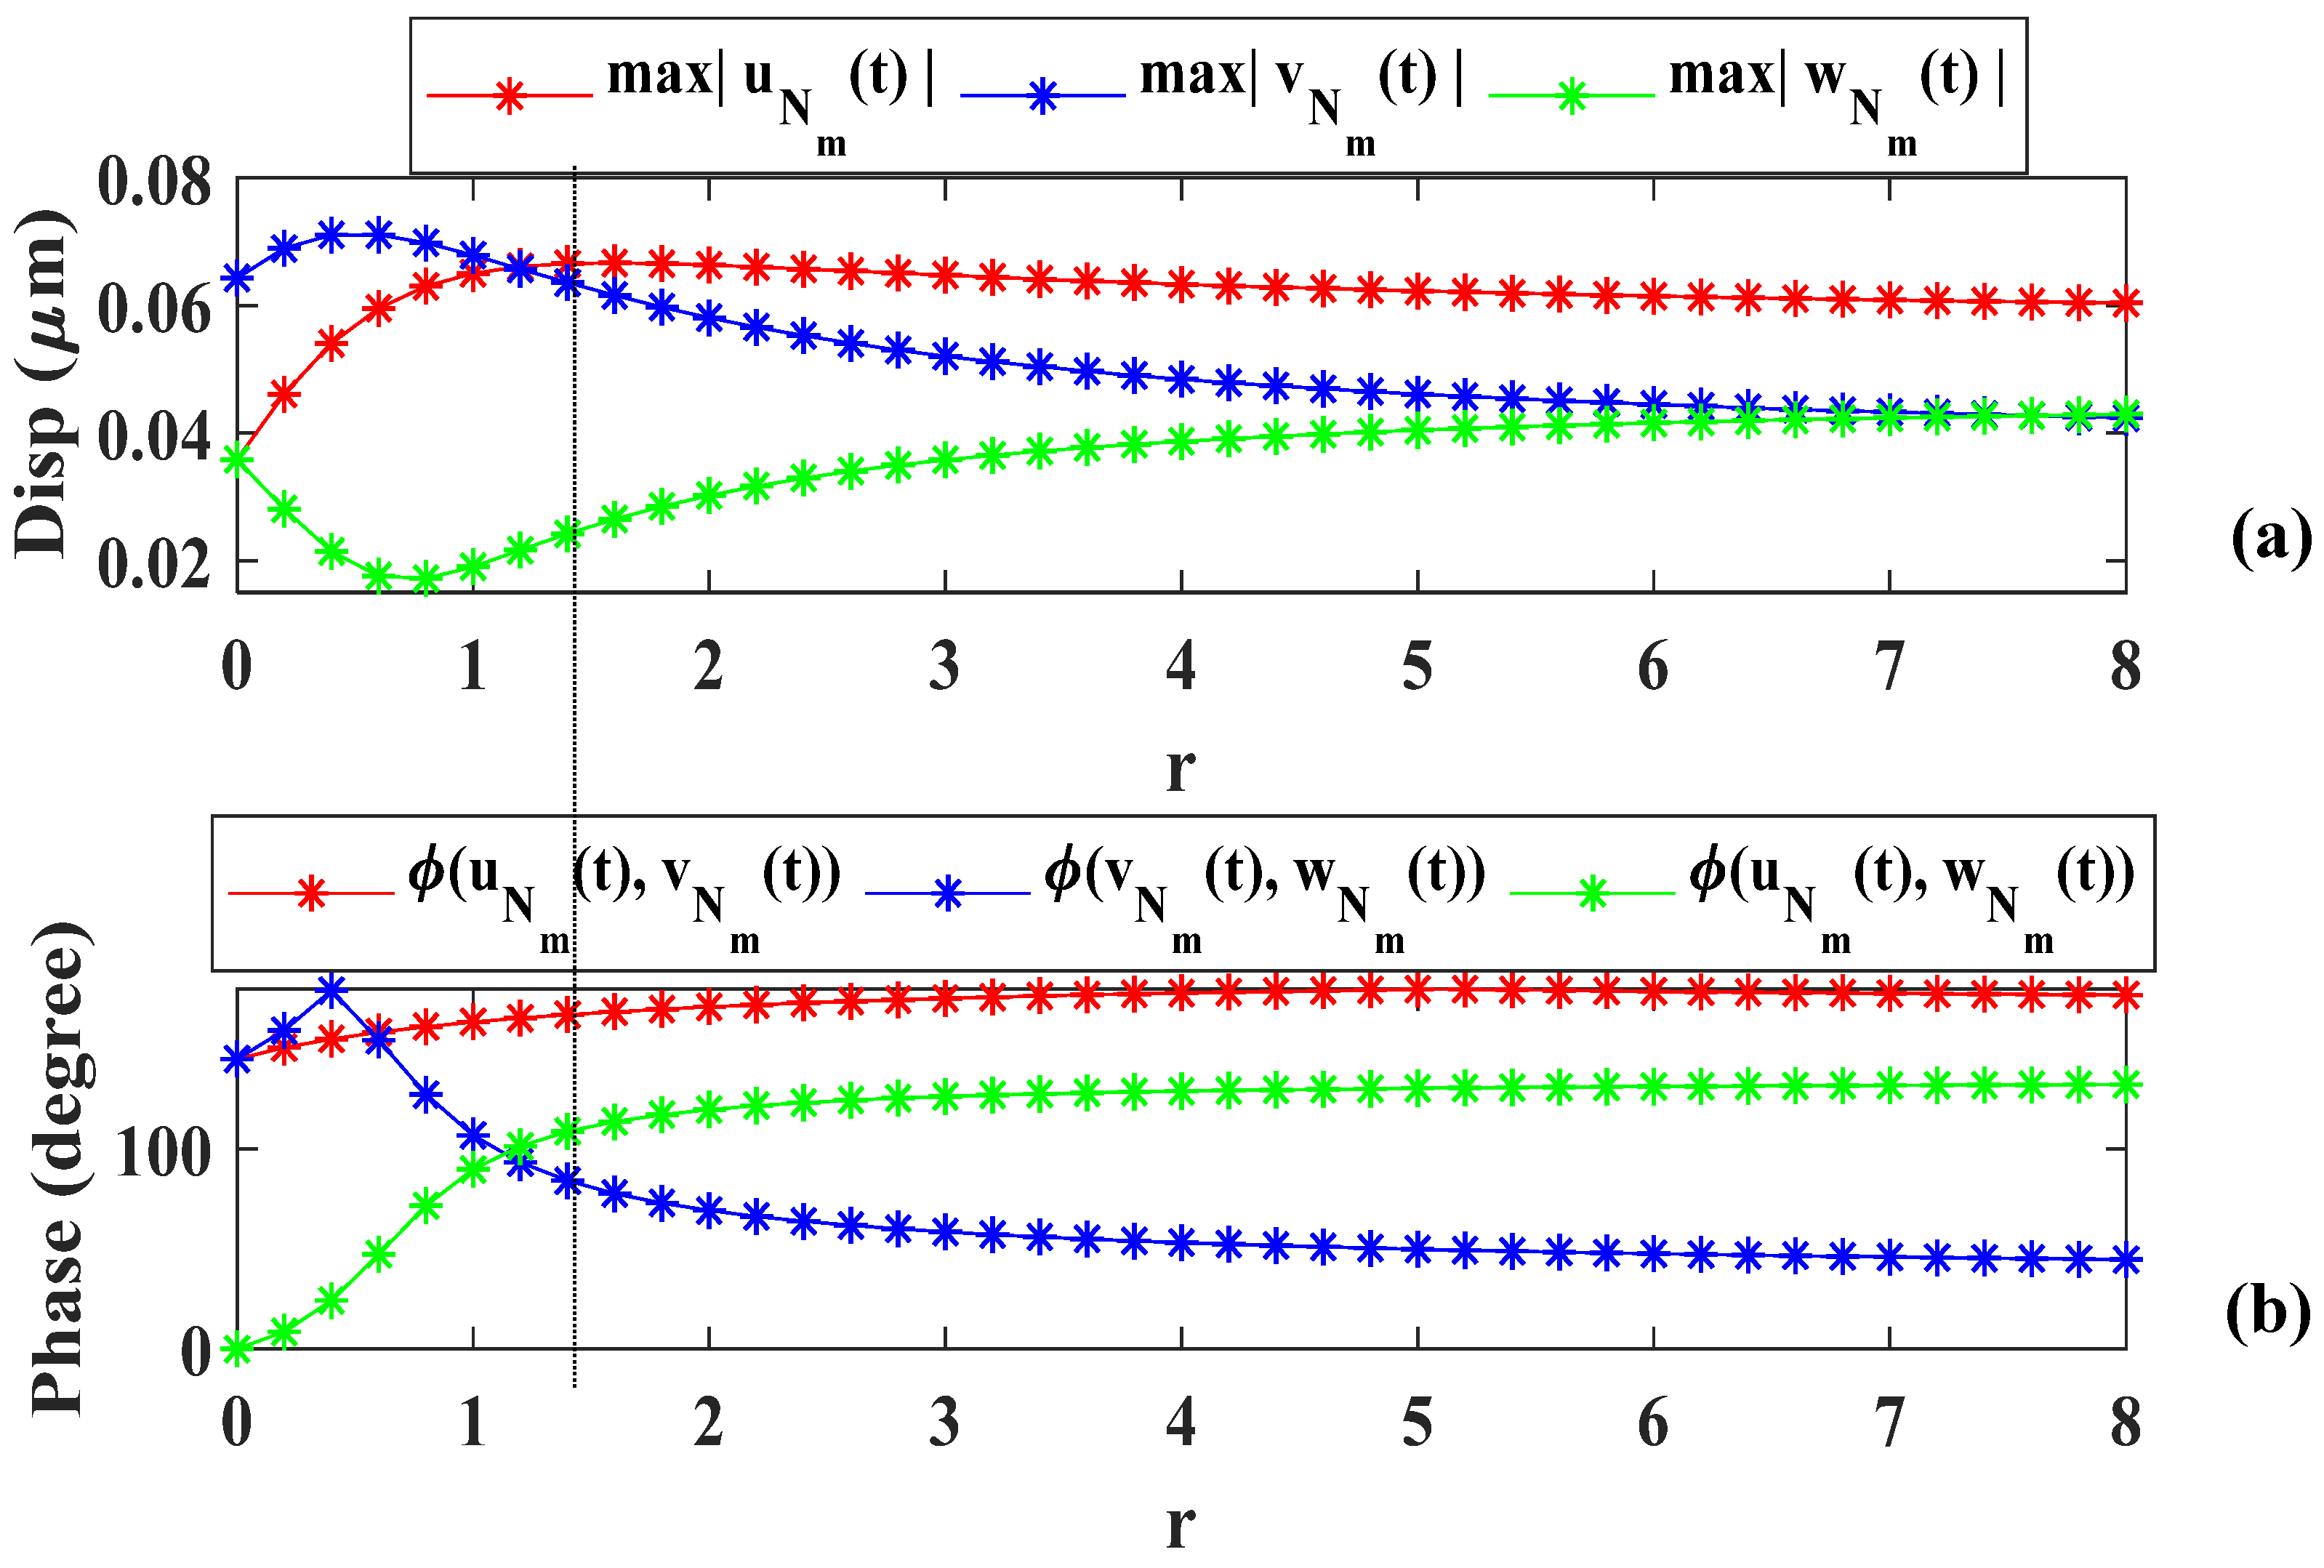
We identified an isofrequency ( 33.78   kHz ) corresponding to nearly overlapping (1 0 −1) and (1 −2 1) resonances and to a trough between two resonances frequencies in the (1 1 1) eigen mode. We can therefore use this frequency to numerically realize a nonseparable superposition of states. In accord with the experiment, we excite such a nonseparable state by driving the three-chain mass-spring waveguides at a frequency of 33.78 kHz. We excite the first masses of chain 1 and 2 at out of phase, and we do not apply any force on chain 3 as represented by ( F 0 u , F 0 v , 0 ) with the excitation amplitude ratio r = | F 0 u / F 0 v | . Figure 10a shows the maximum amplitudes of the last mass ( N m ) of each chain and the corresponding phase differences ( ϕ ) between each pair of chains of mass N m as a function of r , where ϕ ( x , y ) = 180 π cos 1 ( x · y | x | | y | ) .
We do indeed see that manipulation of the excitation amplitude ratio can be used to tune the eigen mode superposition. Therefore, by only tuning a single input, the relative excitation amplitudes of chains 1 and 2, we can navigate a sizeable portion of the Hilbert space of nonseparable states. Similar to the experimental result of Figure 6 and Figure 10 shows that for a particular excitation amplitude ratio r = 1.2 (dashed line in Figure 10), the transmitted amplitudes of chains 1 and 2 are almost equal and that of rod 3 is small. In addition, phase difference between chains 2 and 3, ϕ ( v N m ( t ) , w N m ( t ) ) , as well as 1 and 3, ϕ ( u N m ( t ) , w N m ( t ) ) , are almost π / 2 and phase difference between chains 1 and 2, ϕ ( u N m ( t ) , v N m ( t ) ) , is approximately π . This relation signifies that though the driving amplitude of rods 1, 2, and 3 are F 0 ( 1.2 , 1 , 0 ) , the transmitted amplitudes are A 0 ( 1 , 1 , ϵ ) , where ϵ 1 and F 0 and A 0 are constants. As seen above in the experimental results for the three-rod system, these relations require that the Bell state coefficients be complex.

5. Discussion and Concluding Remarks

In this work, we have shown the theoretical requirements for realizing a pseudospin in a system of coupled elastic waveguides and for the creation of states that couple the pseudospin and spatial degrees of freedom across the array of waveguides, which might be manipulated to create Bell states. We have fabricated a system that supports pseudospin using two aluminum rods coupled along their length with epoxy and confirmed with both measurement and modeling that the signature of a cutoff frequency in the elastic band structure is observed, at 20.24 kHz in experiment and 19.91 kHz in the numerical simulation. A system comprised of three aluminum rods coupled with epoxy along their length has been fabricated and shown to support two pseudospins with cutoff frequencies of 14.08 kHz and 24.43 kHz. By choosing a frequency at which the two pseudospins are resonant 33.25 kHz in the experiment, or 33.78 kHz in the simulation, we make combinations of the pseudospin and spatial modes that may or may not be separable. Varying the ratio of two input transducers that are out of phase, allows us to navigate the Bell state Hilbert space and, indeed, create nonseparable superpositions of the spatial modes and pseudospin state. Remarkably, these nonseparable states require complex coefficients to account for the phase differences in the outputs from the three rods. Through a single input, the relative excitation amplitudes of the coupled waveguides, these complex amplitudes are experimentally and numerically tuned, allowing the navigation of a sizeable portion of the nonseparable (‘classically entangled’) states of elastic wave states in the tensor product Hilbert space of the directional spinor amplitudes and spatial mode subspaces.
Nonseparable or ‘classically entangled’ states of elastic waves offer the advantage of stability over entangled states of true quantum systems. Nonseparable superpositions of elastic waves are robust against decoherence and will not require operating at cryogenic temperatures to maintain the delicate balance of the superpositions. Nonseparable superpositions of elastic waves do not suffer from the phenomenon of wave function collapse upon measurement. A coherent superposition of quantum states collapses into a pure state upon measurement. Multiple statistical measurements are, therefore, necessary to obtain information on the original superposition. Moreover, the demonstration of our “entangled’ states realizes the potential of acoustic waves in capturing phenomena previously associated with optics. Recently, the use of classical light with entangled degrees of freedom have found applications in quantum information [47] and metrology [5,48]. Our works suggests that the same sort of applications can be realized with acoustic systems. In acoustic system, coupling can be easily manipulated by choices of materials and fabrication. Moreover, due to the flexibility of elastic system, the coupling can easily be tailored to be linear, periodic, and nonlinear (with different types or degrees of nonlinearity) [49,50,51]. Finally, extending this notion of classical nonseparability or classical “entanglement” to the field of phononics, opens the door for acoustic analogues to true quantum system in quantum information processing. The combination of experiment and numerical simulation employed in this manuscript provides the basis for a more extensive and predictive design of systems with elastic pseudospins for future information processing applications.

Supplementary Materials

The following are available online at https://www.mdpi.com/2076-3417/10/9/3202/s1, Figure S1. Variations of the (a) maximum amplitudes at x = L , and (b) the corresponding phase differences between pairs at x = L of the three coupled waveguides as a function of the ratio of the excitation amplitude of chain 1 to the excitation amplitude of chain 2, r = | F 0 u / F 0 v | and F 0 w = 0 . System parameters: ω 02 ( k 2 ) = 33.86   kHz ,   ω 03 ( k 3 ) = 33.7   kHz and η = 18.24   Ns / m . The driving frequency is 33.78 kHz.

Author Contributions

Conceptualization, M.A.H., L.C., K.R. and P.A.D.; methodology, M.A.H., L.C., K.R. and P.A.D.; validation, M.A.H., L.C. and T.L.; formal analysis, M.A.H., L.C., P.L., K.R. and P.A.D.; writing—original draft preparation, M.A.H., K.R. and P.A.D.; writing—review and editing, M.A.H., L.C., P.L., K.R. and P.A.D. All authors have read and agreed to the published version of the manuscript.

Funding

This research was funded by the W. M. Keck Foundation.

Conflicts of Interest

The authors declare no conflict of interest.

References

  1. Horodecki, R.; Horodecki, P.; Horodecki, M.; Horodecki, K. Quantum entanglement. Rev. Mod. Phys. 2009, 81, 865–942. [Google Scholar] [CrossRef] [Green Version]
  2. Bell, J.S. On the Einstein Podolsky Rosen paradox. Phys. Phys. Fiz. 1964, 1, 195–200. [Google Scholar] [CrossRef] [Green Version]
  3. Spreeuw, R.J.C. A Classical Analogy of Entanglement. Found. Phys. 1998, 28, 361–374. [Google Scholar] [CrossRef]
  4. Ghose, P.; Mukherjee, A. Entanglement in Classical Optics. Rev. Theor. Sci. 2014, 2, 274–288. [Google Scholar] [CrossRef] [Green Version]
  5. Töppel, F.; Aiello, A.; Marquardt, C.; Giacobino, E.; Leuchs, G. Classical entanglement in polarization metrology. New J. Phys. 2014, 16, 073019. [Google Scholar] [CrossRef]
  6. Karimi, E.; Boyd, R.W. Classical entanglement. Science 2015, 350, 1172–1173. [Google Scholar] [CrossRef]
  7. Aiello, A.; Töppel, F.; Marquardt, C.; Giacobino, E.; Leuchs, G. Quantum-like nonseparable structures in optical beams. New J. Phys. 2015, 17, 043024. [Google Scholar] [CrossRef]
  8. Buono, W.T.; Moraes, L.F.C.; Huguenin, J.A.O.; Souza, C.E.R.; Khoury, A.Z. Arbitrary orbital angular momentum addition in second harmonic generation. New J. Phys. 2014, 16, 093041. [Google Scholar] [CrossRef]
  9. Souza, C.E.R.; Huguenin, J.A.O.; Milman, P.; Khoury, A.Z. Topological Phase for Spin-Orbit Transformations on a Laser Beam. Phys. Rev. Lett. 2007, 99, 160401. [Google Scholar] [CrossRef] [Green Version]
  10. Chen, L.; She, W. Single-photon spin-orbit entanglement violating a Bell-like inequality. J. Opt. Soc. Am. 2010, 27, A7–A10. [Google Scholar] [CrossRef] [Green Version]
  11. Borges, C.V.S.; Hor-Meyll, M.; Huguenin, J.A.O.; Khoury, A.Z. Bell-like inequality for the spin-orbit separability of a laser beam. Phys. Rev. A 2010, 82, 033833. [Google Scholar] [CrossRef] [Green Version]
  12. Karimi, E.; Leach, J.; Slussarenko, S.; Piccirillo, B.; Marrucci, L.; Chen, L.; She, W.; Franke-Arnold, S.; Padgett, M.J.; Santamato, E. Spin-orbit hybrid entanglement of photons and quantum contextuality. Phys. Rev. A 2010, 82, 022115. [Google Scholar] [CrossRef] [Green Version]
  13. Vallés, A.; D’Ambrosio, V.; Hendrych, M.; Mičuda, M.; Marrucci, L.; Sciarrino, F.; Torres, J.P. Generation of tunable entanglement and violation of a Bell-like inequality between different degrees of freedom of a single photon. Phys. Rev. A 2014, 90, 052326. [Google Scholar] [CrossRef] [Green Version]
  14. Qian, X.-F.; Little, B.; Howell, J.C.; Eberly, J.H. Shifting the quantum-classical boundary: Theory and experiment for statistically classical optical fields. Optica 2015, 2, 611–615. [Google Scholar] [CrossRef]
  15. Michler, M.; Weinfurter, H.; Żukowski, M. Experiments towards Falsification of Noncontextual Hidden Variable Theories. Phys. Rev. Lett. 2000, 84, 5457–5461. [Google Scholar] [CrossRef] [PubMed] [Green Version]
  16. Gadway, B.R.; Galvez, E.J.; Zela, F.D. Bell-inequality violations with single photons entangled in momentum and polarization. J. Phys. B At. Mol. Opt. Phys. 2008, 42, 015503. [Google Scholar] [CrossRef]
  17. Hashemi Rafsanjani, S.M.; Mirhosseini, M.; Magaña-Loaiza, O.S.; Boyd, R.W. State transfer based on classical nonseparability. Phys. Rev. A 2015, 92, 023827. [Google Scholar] [CrossRef] [Green Version]
  18. Deymier, P.; Runge, K. Sound Topology, Duality, Coherence and Wave-Mixing: An Introduction to the Emerging New Science of Sound; Springer Series in Solid-State Sciences; Springer: Berlin, Germany, 2017; ISBN 978-3-319-62379-5. [Google Scholar]
  19. Zhang, Z.; Wei, Q.; Cheng, Y.; Zhang, T.; Wu, D.; Liu, X. Topological Creation of Acoustic Pseudospin Multipoles in a Flow-Free Symmetry-Broken Metamaterial Lattice. Phys. Rev. Lett. 2017, 118, 084303. [Google Scholar] [CrossRef]
  20. Zhang, Z.; Tian, Y.; Cheng, Y.; Liu, X.; Christensen, J. Experimental verification of acoustic pseudospin multipoles in a symmetry-broken snowflakelike topological insulator. Phys. Rev. B 2017, 96, 241306. [Google Scholar] [CrossRef] [Green Version]
  21. Yu, S.-Y.; He, C.; Wang, Z.; Liu, F.-K.; Sun, X.-C.; Li, Z.; Lu, H.-Z.; Lu, M.-H.; Liu, X.-P.; Chen, Y.-F. Elastic pseudospin transport for integratable topological phononic circuits. Nat. Commun. 2018, 9, 3072. [Google Scholar] [CrossRef] [PubMed]
  22. Long, Y.; Ren, J.; Chen, H. Intrinsic spin of elastic waves. PNAS 2018, 115, 9951–9955. [Google Scholar] [CrossRef] [PubMed] [Green Version]
  23. Deymier, P.A.; Runge, K.; Swinteck, N.; Muralidharan, K. Torsional topology and fermion-like behavior of elastic waves in phononic structures. Comptes Rendus Mécanique 2015, 343, 700–711. [Google Scholar] [CrossRef]
  24. Deymier, P.A.; Runge, K.; Swinteck, N.; Muralidharan, K. Rotational modes in a phononic crystal with fermion-like behavior. J. Appl. Phys. 2014, 115, 163510. [Google Scholar] [CrossRef]
  25. Deymier, P.; Runge, K. One-Dimensional Mass-Spring Chains Supporting Elastic Waves with Non-Conventional Topology. Crystals 2016, 6, 44. [Google Scholar] [CrossRef] [Green Version]
  26. Calderin, L.; Hasan, M.A.; Jenkins, N.G.; Lata, T.; Lucas, P.; Runge, K.; Deymier, P.A. Experimental demonstration of coherent superpositions in an ultrasonic pseudospin. Sci. Rep. 2019, 9, 1–10. [Google Scholar] [CrossRef]
  27. Jia, D.; Sun, H.; Xia, J.; Yuan, S.; Liu, X.; Zhang, C. Acoustic topological insulator by honeycomb sonic crystals with direct and indirect band gaps. New J. Phys. 2018, 20, 093027. [Google Scholar] [CrossRef] [Green Version]
  28. Englert, B.-G.; Lee, K.L.; Mann, A.; Revzen, M. Periodic and discrete Zak bases. J. Phys. A Math. Gen. 2006, 39, 1669–1682. [Google Scholar] [CrossRef] [Green Version]
  29. Wang, L.; Zhang, R.-Y.; Xiao, M.; Han, D.; Chan, C.T.; Wen, W. The existence of topological edge states in honeycomb plasmonic lattices. New J. Phys. 2016, 18, 103029. [Google Scholar] [CrossRef] [Green Version]
  30. Pal, R.K.; Ruzzene, M. Edge waves in plates with resonators: An elastic analogue of the quantum valley Hall effect. New J. Phys. 2017, 19, 025001. [Google Scholar] [CrossRef]
  31. Hasan, M.A.; Calderin, L.; Lucas, P.; Runge, K.; Deymier, P.A. Geometric phase invariance in spatiotemporal modulated elastic system. J. Sound Vib. 2019, 459, 114843. [Google Scholar] [CrossRef]
  32. Hasan, M.A.; Calderin, L.; Lucas, P.; Runge, K.; Deymier, P.A. Spectral analysis of amplitudes and phases of elastic waves: Application to topological elasticity. J. Acoust. Soc. Am. 2019, 146, 748–766. [Google Scholar] [CrossRef] [PubMed] [Green Version]
  33. Wang, H.-X.; Guo, G.-Y.; Jiang, J.-H. Band topology in classical waves: Wilson-loop approach to topological numbers and fragile topology. New J. Phys. 2019, 21, 093029. [Google Scholar] [CrossRef]
  34. Zhang, D.; Ren, J.; Zhou, T.; Li, B. Dark state, zero-index and topology in phononic metamaterials with negative mass and negative coupling. New J. Phys. 2019, 21, 093033. [Google Scholar] [CrossRef]
  35. Meng, Y.; Wu, X.; Zhang, R.-Y.; Li, X.; Hu, P.; Ge, L.; Huang, Y.; Xiang, H.; Han, D.; Wang, S.; et al. Designing topological interface states in phononic crystals based on the full phase diagrams. New J. Phys. 2018, 20, 073032. [Google Scholar] [CrossRef]
  36. Vila, J.; Pal, R.K.; Ruzzene, M.; Trainiti, G. A Bloch-based procedure for dispersion analysis of lattices with periodic time-varying properties. J. Sound Vib. 2017, 406, 363–377. [Google Scholar] [CrossRef] [Green Version]
  37. Heisenberg, W. Über den Bau der Atomkerne. I. Z. Phys. 1932, 77, 1–11. [Google Scholar] [CrossRef]
  38. Hasan, M.Z.; Kane, C.L. Colloquium: Topological insulators. Rev. Mod. Phys. 2010, 82, 3045–3067. [Google Scholar] [CrossRef] [Green Version]
  39. Wu, L.-H.; Hu, X. Scheme for Achieving a Topological Photonic Crystal by Using Dielectric Material. Phys. Rev. Lett. 2015, 114, 223901. [Google Scholar] [CrossRef]
  40. Yves, S.; Fleury, R.; Berthelot, T.; Fink, M.; Lemoult, F.; Lerosey, G. Crystalline metamaterials for topological properties at subwavelength scales. Nat. Commun. 2017, 8, 16023. [Google Scholar] [CrossRef]
  41. Qiu, P.; Qiu, W.; Ren, J.; Lin, Z.; Wang, Z.; Wang, J.-X.; Kan, Q.; Pan, J.-Q. Pseudospin Dependent One-Way Transmission in Graphene-Based Topological Plasmonic Crystals. Nanoscale Res. Lett. 2018, 13, 113. [Google Scholar] [CrossRef] [Green Version]
  42. Deymier, P.A.; Runge, K.; Vasseur, J.O.; Hladky, A.-C.; Lucas, P. Elastic waves with correlated directional and orbital angular momentum degrees of freedom. J. Phys. B At. Mol. Opt. Phys. 2018, 51, 135301. [Google Scholar] [CrossRef] [Green Version]
  43. Deymier, P.A.; Vasseur, J.O.; Runge, K.; Lucas, P. Separability and Nonseparability of Elastic States in Arrays of One-Dimensional Elastic Waveguides. Phonons Low Dimens. Struct. 2018. [Google Scholar] [CrossRef] [Green Version]
  44. Hasan, M.A.; Calderin, L.; Lata, T.; Lucas, P.; Runge, K.; Deymier, P.A. The sound of Bell states. Commun. Phys. 2019, 2, 1–5. [Google Scholar] [CrossRef] [Green Version]
  45. Deymier, P.A.; Runge, K.; Hasan, M.A.; Calderin, L. Exponentially Complex “Classically Entangled” States in Arrays of One-Dimensional Nonlinear Elastic Waveguides. Materials 2019, 12, 3553. [Google Scholar] [CrossRef] [PubMed] [Green Version]
  46. Hasan, M.A.; Calderin, L.; Lata, T.; Lucas, P.; Runge, K.; Deymier, P.A. Experimental demonstration of elastic analogues of nonseparable qutrits. Appl. Phys. Lett. 2020. [Google Scholar] [CrossRef]
  47. Gabriel, C.; Aiello, A.; Zhong, W.; Euser, T.G.; Joly, N.Y.; Banzer, P.; Förtsch, M.; Elser, D.; Andersen, U.L.; Marquardt, C.; et al. Entangling Different Degrees of Freedom by Quadrature Squeezing Cylindrically Polarized Modes. Phys. Rev. Lett. 2011, 106, 060502. [Google Scholar] [CrossRef]
  48. Simon, B.N.; Simon, S.; Gori, F.; Santarsiero, M.; Borghi, R.; Mukunda, N.; Simon, R. Nonquantum Entanglement Resolves a Basic Issue in Polarization Optics. Phys. Rev. Lett. 2010, 104, 023901. [Google Scholar] [CrossRef]
  49. Chen, Q.; Elbanna, A. Emergent wave phenomena in coupled elastic bars: From extreme attenuation to realization of elastodynamic switches. Sci. Rep. 2017, 7, 1–11. [Google Scholar] [CrossRef] [Green Version]
  50. Starosvetsky, Y.; Jayaprakash, K.R.; Hasan, M.A.; Vakakis, A.F. Topics on the Nonlinear Dynamics and Acoustics of Ordered Granular Media; World Scientific: Singapore, 2017; ISBN 978-981-322-193-2. [Google Scholar]
  51. Hikihara, T.; Okamoto, Y.; Ueda, Y. An experimental spatio-temporal state transition of coupled magneto-elastic system. Chaos 1997, 7, 810–816. [Google Scholar] [CrossRef]
Figure 1. Schematic of the two- and three-rods experimental systems. The rods are composed of aluminum and are elastically coupled with epoxy.
Applsci 10 03202 g001
Figure 2. Experimental setup for the nearly free-standing array of coupled waveguides is suspended by threads to two supporting stands. To drive the coupled waveguides three transducers are used at one end, and to detect at the other end three more transducers are used. A constant pressure is maintained on the transducers with the use of rubber bands. Honey is used as coupling between the rods and the transducers.
Applsci 10 03202 g002
Figure 3. (a) Transmission spectrum of the single rod waveguide ( N = 1 ) . The inset in (a) identifies the first two resonances at frequency <10 kHz. The transmission amplitude is in arbitrary units. (b) Band structure determined and calculated from (a). The asterisks in (b) are obtained from the resonances of (a) and the solid line associated with the asterisks is a fit to resonances with frequency less than 60 kHz.
Applsci 10 03202 g003
Figure 4. (a) Transmission spectrum of the two coupled rod system ( N = 2 ) for the two spatial eigen modes, namely the symmetric (1 1) mode and anti-symmetric (1 −1) mode. The inset in (a) identifies the first two resonances of the symmetric mode and negligible transmission of the anti-symmetric mode at frequency <10 kHz, identifying the first two resonances. The transmission amplitude is in arbitrary units. (b) Band structure determined and calculated from (a). The asterisks in (b) are obtained from the resonances of mode: 1 1 of (a) and the solid line associated with the asterisks is a fit to the low frequency resonances. The open circles in (b) correspond to resonant modes associated with the anti-symmetric spatial eigen mode and the solid line is a fit to these identifiable resonances using the dispersion relation with a cutoff frequency of 20.24   kHz .
Applsci 10 03202 g004
Figure 5. (a) Transmission spectrum of the coupled three-rod waveguides ( N = 3 ) for the three spatial eigen modes of (1 1 1), (1 0 −1), and (1 −2 1). The transmission amplitude is in arbitrary units. (b) Band structure determined and calculated from (a). The asterisks in (b) are obtained from the resonances of (a), and the solid line associated with the asterisks is a fit to the low frequency resonances. The open and solid circles in (b) correspond to resonant modes associated with the e 2 and e 3 spatial eigen modes. The solid lines are a fit to the identifiable resonances using the dispersion relations with cutoff frequencies 14.23   kHz for e 2 and 24.27   kHz for e 3 . The inset on (a) and the dashed line in the inset of (b) focus on a frequency interval showing nearly overlapping (1 0 −1) and (1 −2 1) resonances and a trough between two resonances in the (1 1 1) transmission around 33.25 kHz.
Applsci 10 03202 g005
Figure 6. Variations of the: (a) transmission amplitudes of each rod and (b) phase differences, ϕ i j ;   i , j = 1 , 2 , 3   and   i j , between rods of the coupled three waveguides as a function r = | F 1 / F 2 | ( F 1 , F 2 : excitation amplitudes of rod 1 and 2). Driving frequency ω = 33.25 kHz.
Applsci 10 03202 g006
Figure 7. (a) Power spectral density of the of the displacement of the N m mass showing the eigen frequencies of the single chain mass-spring waveguides. (b,c) Spatial waveforms of the displacements of all masses for driving frequency of 3884   kHz and 7767   kHz . Two snapshots of the spatial waveforms are shown for time t 1 and t 2 . (d) Band structure determined and calculated from (ac). System parameters: N m = 48 ,   η = 6.08   Ns / m ,   F 0 u = 1   N ,   ω i ( 0 , 60   kHz ] .
Applsci 10 03202 g007
Figure 8. (a) Power spectral density of the displacement of N m mass in the coupled two-chain mass-spring waveguides showing the eigen frequency for mode: 1 1 and mode: 1 −1. (b) Band structure determined and calculated from (a). The asterisks in (b) are obtained from the resonances of mode: 1 1 of (a) and the solid line associated with the asterisks is a fit to the low frequency resonances. The open circles in (b) correspond to anti-symmetric resonant modes and the solid line is a fit to these identifiable resonances using the dispersion relation ω k 2 = ( β k ) 2 + 2 ( α ) 2 with cutoff frequency 2 α = 19.91   kHz . System parameters: N m = 48 ,   η = 6.08   Ns / m ,   ω i ( 0 , 60   kHz ] and ( F 0 u , F 0 v , ϕ 0 v ) = ( 1   N , 1   N , 0 ) for mode: 1 1 excitation and ( F 0 u , F 0 v , ϕ 0 v ) = ( 1   N , 1   N , π ) for mode: 1 −1 excitation.
Applsci 10 03202 g008
Figure 9. (a) Power spectral density of the displacement of the N m mass in the coupled three-chain mass-spring waveguides showing the eigen frequency for mode: 1 1 1, mode: 1 0 −1, and mode: 1 −2 1. (b) Band structure determined and calculated from (a). The asterisks in (b) are obtained from the resonances of mode: 1 1 1 of (a), and the solid line associated with the asterisks is a fit to the low frequency resonances. The open and closed circles in (b) correspond to resonant modes associated with the e 2 . and e 3 spatial eigen modes and the solid lines are a fit to these identifiable resonances using dispersion relations with cutoff frequencies 14.08   kHz and 24.43   kHz . The dashed line in the inset of (b) identifies a frequency (equal to 33.78   kHz ) at which the (1 0 −1) and (1 −2 1) resonances nearly overlap and that lies between two resonances of (1 1 1) eigen mode. System parameters: N m = 48 ,   η = 6.08   Ns / m ,   ω i ( 0 , 60   kHz ] , and ( F 0 u , F 0 v , F 0 w , ϕ 0 v , ϕ 0 w ) = ( 1   N , 1   N , 1   N , 0 , 0 ) for mode: 1 1 1 excitation, ( F 0 u , F 0 v , F 0 w , ϕ 0 v , ϕ 0 w ) = ( 1   N , 0 , 1   N , 0 , π ) for mode: 1 0 −1 excitation, and ( F 0 u , F 0 v , F 0 w , ϕ 0 v , ϕ 0 w ) = ( 1   N , 2   N , 1   N , π , 0 ) for mode: 1 −2 1 excitation.
Applsci 10 03202 g009
Figure 10. Variations of the (a) maximum amplitudes of the last mass ( N m ) of each chain and (b) the corresponding phase differences ( ϕ ) between pairs of chains of the coupled mass-spring waveguides as a function of r = | F 0 u / F 0 v | ; F 0 u , F 0 v excitation amplitudes of chain 1 and 2. The third chain is not excited. System parameters: N m = 48 ,   η = 18.24   Ns / m , and ( F 0 u , F 0 v , F 0 w , ϕ 0 v , ϕ 0 w ) = ( r   N , 1   N , 0   N , π , 0 ) . The driving frequency is 33.78 kHz.
Applsci 10 03202 g010