1. Introduction
The purpose of optimal design of asphalt pavement structure is to determine a structural form with durable structure and good road performance by combining the parameter rationally of the structural layer materials. For this reason, the rational parameter combination of structural layer materials of the asphalt pavement is crucial for the road performance and structure durability. However, in the process of structural optimization design of asphalt pavement, in the absence of a rational evaluation index, the optimum coordination among the designed structural material parameters cannot be guaranteed, resulting in the low use efficiency of structural materials and a pavement service life far less than the design life; the direction of optimization is not clear, which easily leads to the uniformity and homogeneity of the pavement structure.
This paper is intended to improve the existing structural design methods through coordinated evaluation research of the asphalt pavement structural layer material setting, and to obtain the pavement structural form with a reasonable material combination, durable structure, and good road performance through the optimal combination of each structural layer materials.
Existing studies have focused on the structural design method, prediction model of fatigue life, structural type, material parameters, and other aspects of durable asphalt pavement. “AASHTO 2008” [
1], “AI Law” [
2], and “SHELL Law” [
3] set the tensile strain of the bottom of the asphalt layer and the compressive strain of the top surface of the soil foundation as the design index, while the “Specifications for Design of Highway Asphalt Pavement (JTG D50-2006)” [
4] set the deflection of the road surface and the tensile stress of key layers as the design index and also established the relationship between the design index under the load effect and the cumulative number of standard loads. The relation established by the above method only considered the load effect. Islam [
5] developed a closed-form equation for calculating the temperature-induced fatigue damage. Using two types of rutting performance tests, i.e., CWTT (Cooper wheel tracking tests), and APA (asphalt pavement analyzer) tests, Hussan developed laboratory rutting prediction models; significant independent variables involved in the model are temperature, number of passes in the case of CWTT or number of cycles in the case of APA tests, bitumen penetration value, and Flakiness index of coarse aggregate fractions [
6]. Bakhshi used FEM to simulate asphalt pavement rutting developed by the Hamburg wheel rut tester, then developed rutting prediction models to model the viscoelastic behavior of asphalt mixtures [
7]. Kim employed the viscoelastic continuum damage (VECD) model to develop the C1-S1 curve, which is known as a single-characteristic curve of an asphalt mixture and is independent of loading types [
8]. Al-Khateeb and Ghuzlan used an indirect tensile test and observed that increasing loading frequency and decreasing stress level increases fatigue life of asphalt mixtures [
9]. Mansourkhaki studied the effects of loading waveforms, load duration, rest period, and stress level on the fatigue life of hot mix asphalt (HMA) specimens using the indirect tensile test [
10]. Zhu looked into the fatigue property of aged asphalt mixtures as well as the comparison of the fatigue property conducted by both ageing methods, and concluded that the actual life-span of pavement is often shorter than the designed one [
11]. Pais presented a study to evaluate the number of tests to assess the fatigue resistance of asphalt mixtures, and through the four-point bending technique evaluated the fatigue resistance dispersion to identify the number of tests to define a fatigue law [
12]. Montazeri examined the influence of mix proportions, specifically asphalt and air void contents, on fatigue behavior of asphalt beam specimens in the laboratory tested with a four-point bending method of loading [
13]. Yizhuang evaluated RAP mixtures at both the material level and the structural level using mechanistic models and observed that the performance of RAP mixtures depended on the mixture design and pavement structure [
14].
Specifications for Design of Highway Asphalt Pavement (JTG D50-2006) [
4] stipulate that the modulus ratio between the base course and the asphalt surface course of semi-rigid base asphalt pavement should be between 1.5 and 3, the modulus ratio between the base course and the sub-base should not be greater than 3.0, and the modulus ratio between the sub-base and the soil base should be between 2.5 and 12.5. Zhang measured the modulus ratio of key layers by falling weight deflectometer (FWD) through mechanical analysis and practical project tracking observation, and suggested that the modulus ratio of flexible base and semi-rigid base to surface layer should be 8–10 and 1.5–3, respectively [
15,
16]. Zhen established a fatigue equation of asphalt mixtures through a fatigue test, which was characterized by the true stress ratio, and proposed a new idea of asphalt pavement structure design that would increase design life from top to bottom and a new idea of durable asphalt pavement structure design, and suggested that the design life of the middle and upper layer, the lower layer, and the base layer should be 10–15 years, 20–30 years, and 40–60 years, respectively [
17].
According to the design index of California, the bending strain of asphalt mixture layers is less than 700 and the compressive strain of the top surface of soil foundation is less than 200 when the uniaxial load is 80 kN [
18]. The design of Illinois transportation department requires that the flexural strain of the asphalt mixture base should be less than 600 με [
19]. Cui suggested control indexes suitable for the structural design of durable pavement in China; the tensile strain of the bottom layer of asphalt was not more than 120 × 10
−6, and the compressive strain of the top surface of soil foundation was not more than 280 × 10
−6 [
20].
Meng proposed a reasonable combination form of asphalt pavement structure, and systematically studied the structural design method of asphalt pavement, design parameters of graded gravel material, and construction technology and construction quality detection methods of graded gravel [
21]. In view of the defects of the current fatigue design method of asphalt pavement in China, Liu found that semi-rigid base asphalt pavement can meet the requirements of durable pavement through the reasonable matching of the service life of each structural layer, and through the optimization of methods such as replacing materials, changing thickness, and changing layers [
22]. Lv proposed a pavement structure design method such that the deflection of the asphalt pavement structure layer matches the fatigue life of the tensile stress index of the bottom layer [
23]. Zhuang proposed a design process and steps of the flexible base asphalt pavement, and recommended the appropriate thickness of the structural layer of the granular base asphalt pavement under heavy load traffic [
24].
Although scholars worldwide have done a lot of studies, there are still the following problems: (1) Through theoretical analysis or laboratory tests, the relationship model between different design indexes and the cumulative number of standard loads has been established, but the designed indexes mostly consider the failure behavior of each layer of materials separately, and do not evaluate the coordinated relationship between layers of a pavement structure. (2) The key steps of the existing structural design process are to calculate the cumulative number of standard loads by design indexes, and repeatedly adjust the material parameters until the cumulative standard loads meet the design requirements. However, the coordination between the material parameters of the designed structure cannot be guaranteed, so the design result is only an optimal solution for a part of but not for an overall situation. (3) The recommended range of the modulus ratio between structural layers is too large, the structure arrangement and combination forms are too numerous and difficult to operate, and the results of the rational combination of structures can be used only for the specified structural form; no general indicators or methods are proposed. Therefore, existing research lacks an answer to the question of how to design the material parameters of each structural layer of asphalt pavement structure by considering each layer as a component of a pavement structure.
This paper proposes the design of an asphalt pavement structure by considering each structural layer as a component of the pavement structure and by analyzing the coordination between the layers. The major findings of this article are summarized as follows: (1) Indexes are proposed for the sensitivity and equivalent envelope area to qualitatively and quantitatively evaluate the coordination of the structural layers. The evaluation process is visualized by using stress transfer path and transfer path envelope diagrams. (2) Based on the equivalent envelope area, software is developed for the structural optimization design. (3) Based on the equivalent envelope area index, an existing design process is improved by adding steps of structural scheme comparison and structural optimization. (4) The feasibility and validity of the equivalent envelope area index are verified by fatigue life calculation and road tests.
2. Calculation Details
2.1. Computational Model
The theory of the elastic layered continuous system was adopted. The commercial software BISAR 3.0 was used for simulation calculation. The material of each layer was assumed to be an isotropic linear elastomer that was continuous in the horizontal direction, the interface between layers was assumed as completely continuous, and the soil foundation was assumed to be a semi-infinite foundation or a uniform horizontal layer on a half-space.
Two forms of uniform load were adopted, i.e., double circle and single circle. The uniform load radius of single circle was 15 cm, and the load pressure was 0.707 MPa. The uniform load radius of double circles was 10.65 cm, the distance between centers of load circles was 31.95 cm, and the load pressure was 0.707 MPa. The simplified pavement models under two load forms are shown in
Figure 1.
2.2. Calculation Parameter
In order to study the coordination of the pavement structure, three different structures of asphalt pavement were paved on the Yunluo Expressway in Guangdong Province in 2012, namely, reinforced cement stabilized base asphalt pavement structure, roller compacted concrete base asphalt pavement structure, and inverted base asphalt pavement structure. The three structures are hereinafter referred to as structure I, structure II, and structure III, respectively. The structural types are shown in
Table 1, and the corresponding material parameters are shown in
Table 2.
As seen
Table 1, the design strength (7-day unconfined compressive strength) of cement stabilized macadam in structure II and III was 3–5 MPa, so the modulus, as seen in
Table 2, was taken as 3600 MPa. However, for structure I, the strength of cement stabilized macadam of the upper and lower base was greater than 6 MPa, and hence, the modulus was taken as 6000 MPa. In addition, Poisson’s ratio was taken as 0.35, 0.25, 0.25, 0.4, and 0.4, respectively, for the asphalt mixture, cement stabilized macadam, roller compacted concrete, graded aggregate, and subgrade. The material parameters shown in
Table 2 were adopted from [
25,
26].
For consistency, the thickness of the lower surface layer, base layer, and sub-base layer under structure I were taken as 0.13 m, 0.51 m, and 0.89 m, respectively. Respective thicknesses for structure II were taken as 0.13 m, 0.37 m, and 0.75 m. Similarly, for structure III, respective thicknesses were taken as 0.18 m, 0.58 m, and 0.98 m. Among them, the graded aggregate layer in structure II was a functional layer and was not treated as a structural layer.
2.3. Stress Calculation Points
The directions X, Y, and Z were considered as driving direction, cross section direction, and depth direction, respectively. According to the most unfavorable stress principle, under the uniform load of double circles, the section along the cross-section through the wheel gap center (hereinafter referred to as YZ section) was selected for research, and 30 points were selected in this plane for stress calculations.
The Y-value of the calculation points of the pavement structure are shown in
Table 3. The range of Y-value for the first 19 points was 0–0.4793 m, and the value interval was 0.0266 m. The range of values for the last 11 points was 0.6–3.6 m, and the value interval was 0.3 m. Due to the limitation of space, only 1–19 points are shown in
Figure 1.
For the double circle uniform load, point 7 lay directly below the center of the double circle load, and point 11 was the outermost point of the circle under the double circle load. For the uniform load of single circle, point 1 lay directly below the center of single circle load.
3. Analysis of Mechanical Response Index
3.1. Deflection Response Analysis
The deflection values of the road surface were taken at 30 points for the three structures. The deflection of the road surface for the three structures is shown in
Figure 2. The deflection values for the three structures were compared and analyzed to derive the deflection sensitivity distribution laws of the three structures, as shown in
Figure 2.
It can be seen from
Figure 2 that under the double circle load, the maximum deflection values of structure I, structure II, and structure III were, respectively, 20.3 (0.01 mm), 20.1 (0.01 mm), and 25.8 (0.01 mm), and the order of deflection was structure II < structure I < structure III. The maximum deflection value appeared at point 7, which was directly below the center of the double circle load. Under the single circle load, the maximum deflection values of structure I, structure II, and structure III were, respectively, 20.8 (0.01 mm), 20.9 (0.01 mm), and 27.1 (0.01 mm), and the order of deflection was structure I < structure II < structure III. The maximum deflection value appeared at point 1, which was directly below the center of the single circle load.
Under the double circle load, the distance was 0.6 m when structures 1 and 2 had the largest difference in deflection values. The deflection values of structure I and structure II were 16.23 (0.01 mm) and 16.59 (0.01 mm), respectively, with a difference of 100% × (16.59 − 16.23)/16.59 = 2.2%. Under the single circle load, the distance was 0.479 m when structures 1 and 2 had the largest difference in deflection values. The deflection values of structure I and structure II were 16.5 (0.01 mm) and 17.3 (0.01 mm), respectively, with a difference of 100% × (17.3 − 16.5)/17.3 = 4.4%. From the evaluation of pavement surface deflection, the rigidity of structure I and structure II was close, but was better compared to structure III.
3.2. Stress Response Analysis
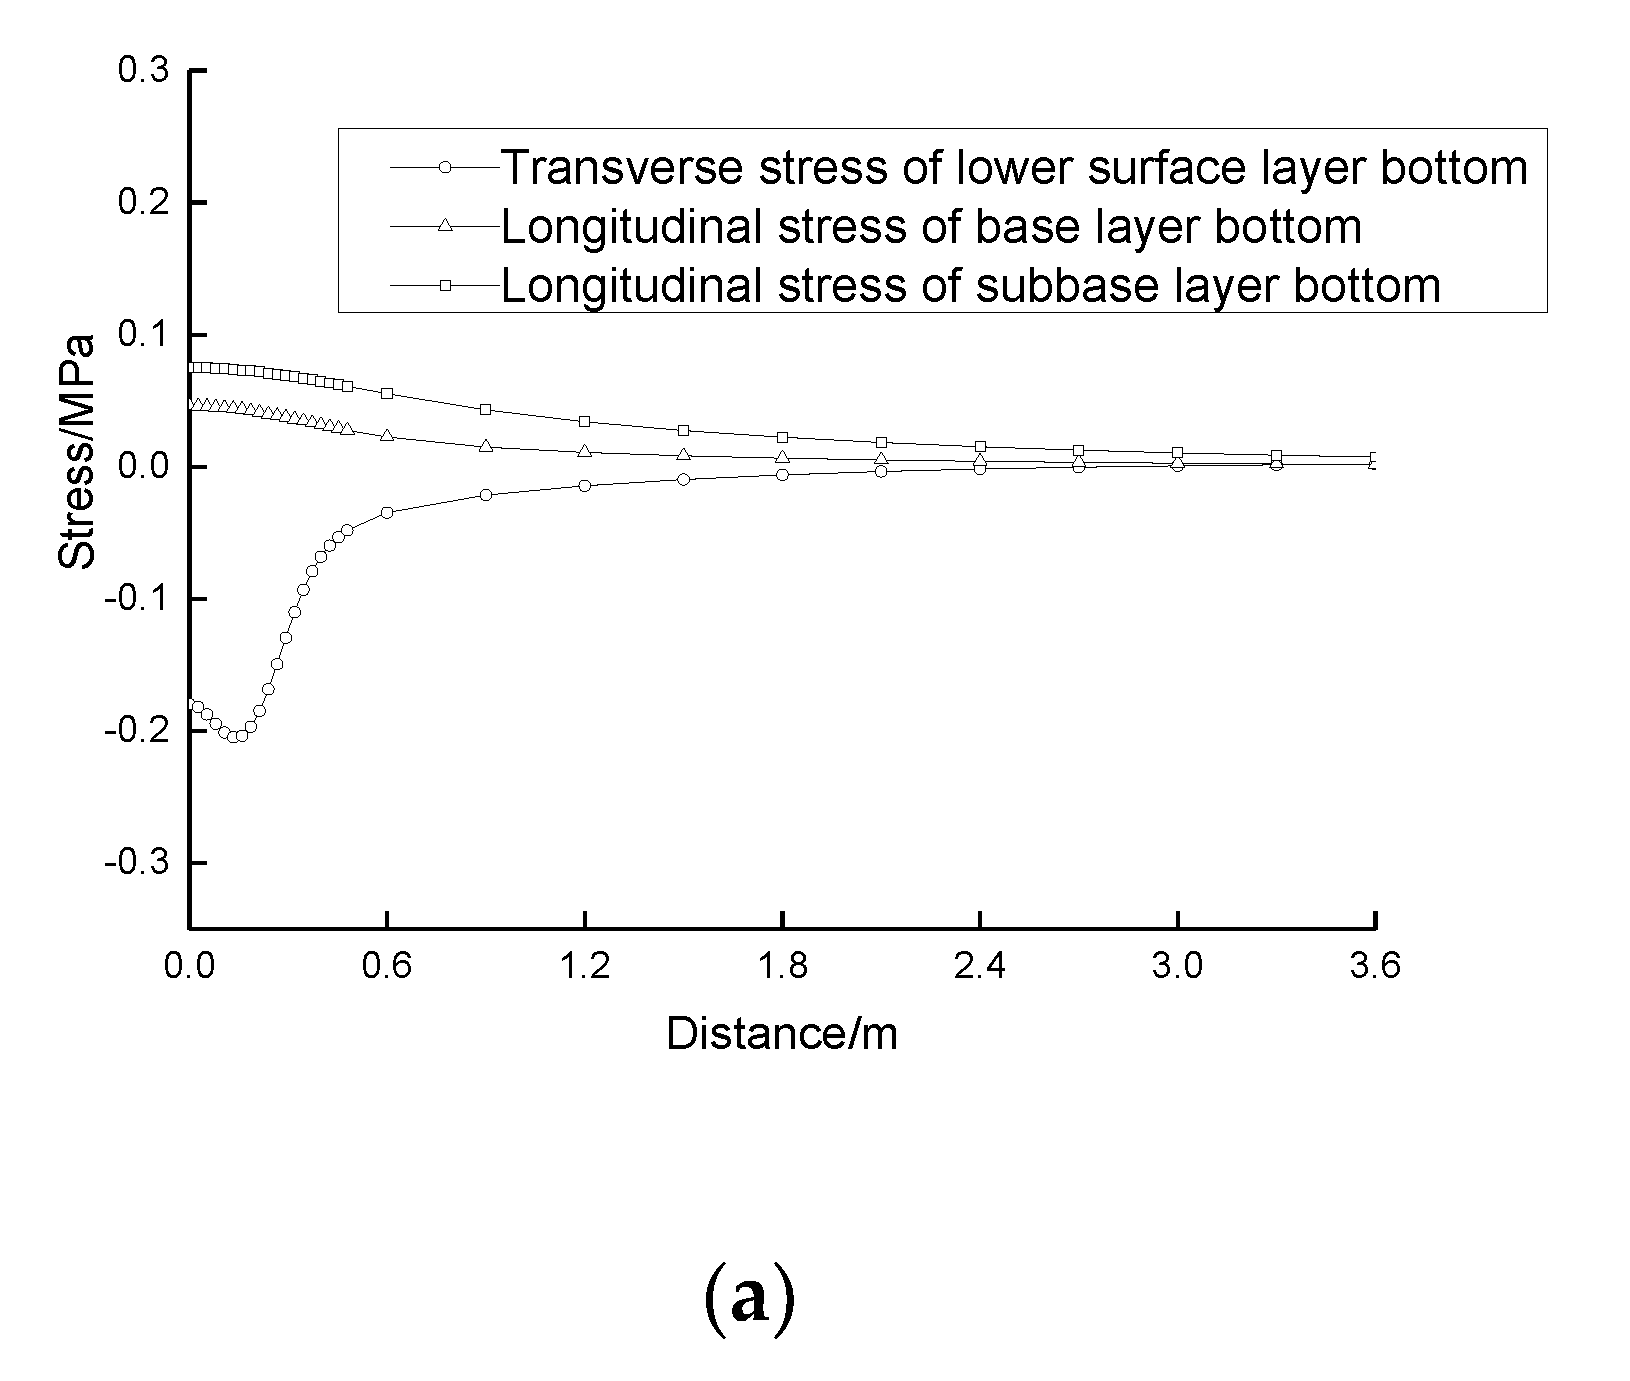
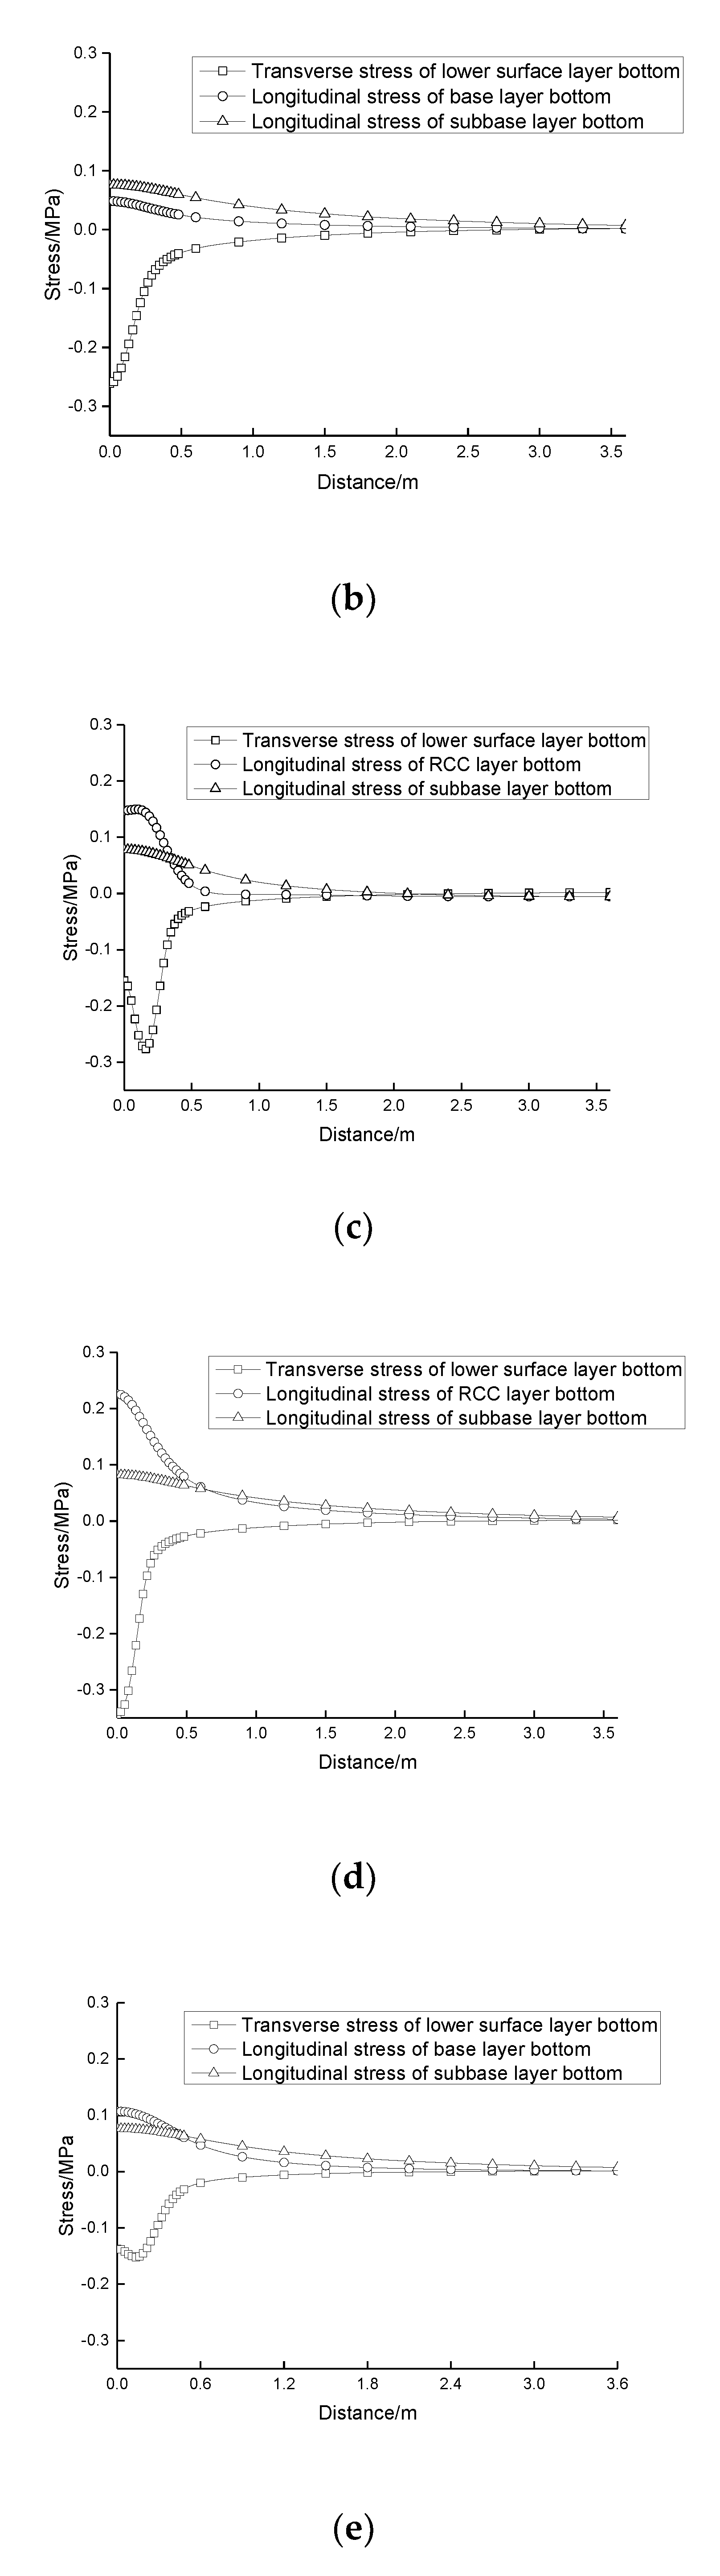
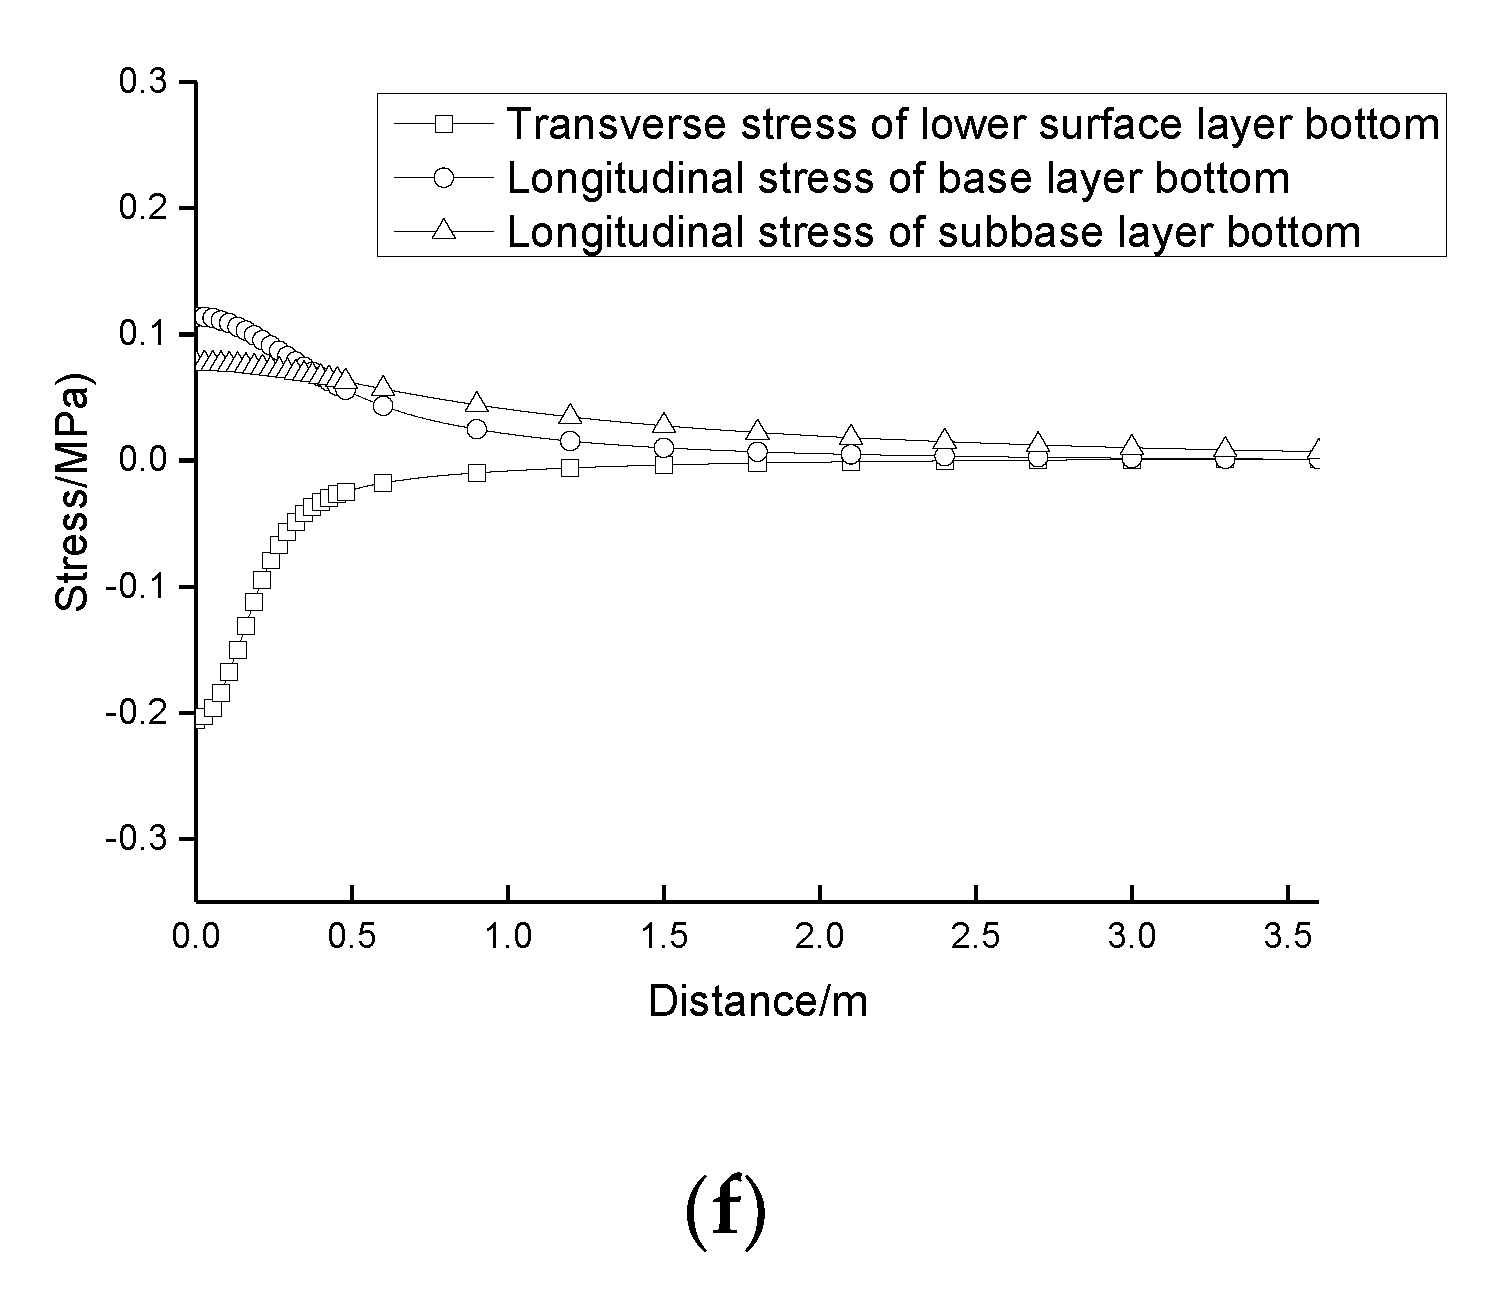
The stress values at 30 points of key layers were extracted, and the distribution of the stress of the key layers of three structures were compared and analyzed, as shown in
Figure 3. The maximum tensile stress of key layers under the uniform load of double circles and single circles is shown in
Table 4 and
Table 5.
Under the uniform load of the double circle, the maximum compressive stress of the lower surface layer of structure I, II, and III was 0.2048 MPa, 0.2766 MPa, and 0.1524 MPa, respectively, with the order of structure II > structure I > structure III. The maximum tensile stress of the base layer was 0.0459 MPa, 0.1987 MPa, and 0.1072 MPa, respectively, with the order of structure II > structure III > structure I. The maximum tensile stress of the sub-base layer was 0.07510 MPa, 0.08095 MPa, and 0.07640 MPa, respectively, and the order was structure II > structure III > structure I.
Under the uniform load of the single circle, the maximum compressive stress of the lower surface layer of structure I, II, and III was 0.261 MPa, 0.3436 MPa, and 0.2057 MPa, respectively, with the order of structure II > structure I > structure III. The maximum tensile stress of the base layer was 0.04860 MPa, 0.22610 MPa, and 0.11430 MPa, respectively, with the order of structure II > structure III > structure I. The maximum tensile stress of the sub-base layer was 0.07634 MPa, 0.08221 MPa, and 0.07710 MPa, respectively, with the order of structure II > structure III > structure I.
Under the uniform load of single circle and double circles, the stress sequence of each key layer was the same. The lower surface layer was always subjected to compressive stress. Nevertheless, in the Specifications for Design of Highway Asphalt Pavement (JTG D50-2006), the fatigue cracking of the lower surface layer is controlled by tensile stress.
Under the uniform load of the double circle and single circle, with an increase in distance, the stress of different layers was almost identical, indicating that the stress value at a distance could not serve as an evaluation index, and hence, the stress value after 2 m could be ignored.
4. Evaluation of the Coordination of Three Types of Asphalt Pavement Structures
4.1. Definition
The sensitivity is the ratio of the mechanical response value (including stress and defection) of a point in the Y direction of the YZ section to the maximum mechanical response value in the Y direction of the section, and is calculated as in Equation (1). This study mainly analyzes stress sensitivity and deflection sensitivity.
In Equation (1), is the mechanical index sensitivity of point i at depth h; is dimensionless; h is the depth along the Z direction and the unit is m; is the mechanical response value of point i at depth h; and is the maximum mechanical response value of all points at depth h.
Example 1. Calculation of the deflection sensitivity of point 20 in the road surface (Z = 0 m).
Given data:
(deflection, 0.01 mm),
(deflection, 0.01 mm)
Therefore, the deflection sensitivity of point 20 in the road surface is .
Example 2. Calculation of the transverse stress sensitivity of point 15 in the bottom of the lower surface layer (Z = 0.13 m).
Given data: (stress, MPa), (stress, MPa).
Therefore, the transverse stress sensitivity of point 15 in the bottom of the lower surface layer is 11.5%.
According to the definition: (1) at point imax of the maximum mechanical response value, = 100%, and at point i at infinity, = 0; (2) for different types of pavement structure, the greater the sensitivity of deflection, the stronger is the rigidity of pavement structure; and (3) the greater the stress sensitivity, the more uniform is the stress distribution, and the higher is the material utilization efficiency.
4.2. Software Development and Use
In order to quantify the coordination of structural layers of an asphalt pavement, Intelligent Analysis Software V1.0 for mechanical properties of asphalt pavement (hereinafter referred to as the analysis software) was developed. The software was used to quantitatively evaluate the coordination of three asphalt pavement structural designs.
The analysis software is based on Net framework, Bisar3.0, Excel, and AutoCAD. Through parameter inputs, the mechanical response of different points in the target layer could be extracted. Based on the sensitivity threshold, the software generated the envelope area and the graph of the stress transfer path as outputs.
The main steps of calculation by using the software were as follows:
- (1)
Input the load, pavement structure thickness, and material parameters; input the points (locations) of the mechanical index to be extracted from the target layer, and complete the calculation;
- (2)
Input the mechanical calculation results into Excel, and calculate the sensitivity of mechanical indexes;
- (3)
Determine the point coordinates of the asphalt layer, base layer, and sub-base layer according to the sensitivity threshold. In AutoCAD, an envelope diagram of the transfer path was drawn according to the thickness of the structural layer and the point coordinates. The envelope areas of the asphalt layer, base layer, and sub-base layer were generated as the output of the software.
The boundary point of the road surface (z = 0) was the intersection of the outermost side of the double circle load and the road surface, and the scale of the AutoCAD output drawing was 1:1. The drawing obtained by connecting the boundary point, the position of points at the bottom of each key layer, and the boundary line between the layers was defined as the transfer path envelope diagram. Two sides of the envelope were defined as the stress transfer path.
The mechanics of the transfer path envelope diagram were interpreted such that under the wheel load, the effective workspace of the pavement structural layer was determined based on the sensitivity threshold. The stress transfer path was the path of the envelope diagram along the thickness direction of the structural layer. The path characterized the stress distribution of the structural layer under the wheel load. The stress transfer path visualized the stress transfer behavior and clearly presented the route of stress transfer and the state of stress distribution in the pavement structure.
4.3. The Rules Analysis of Sensitivity
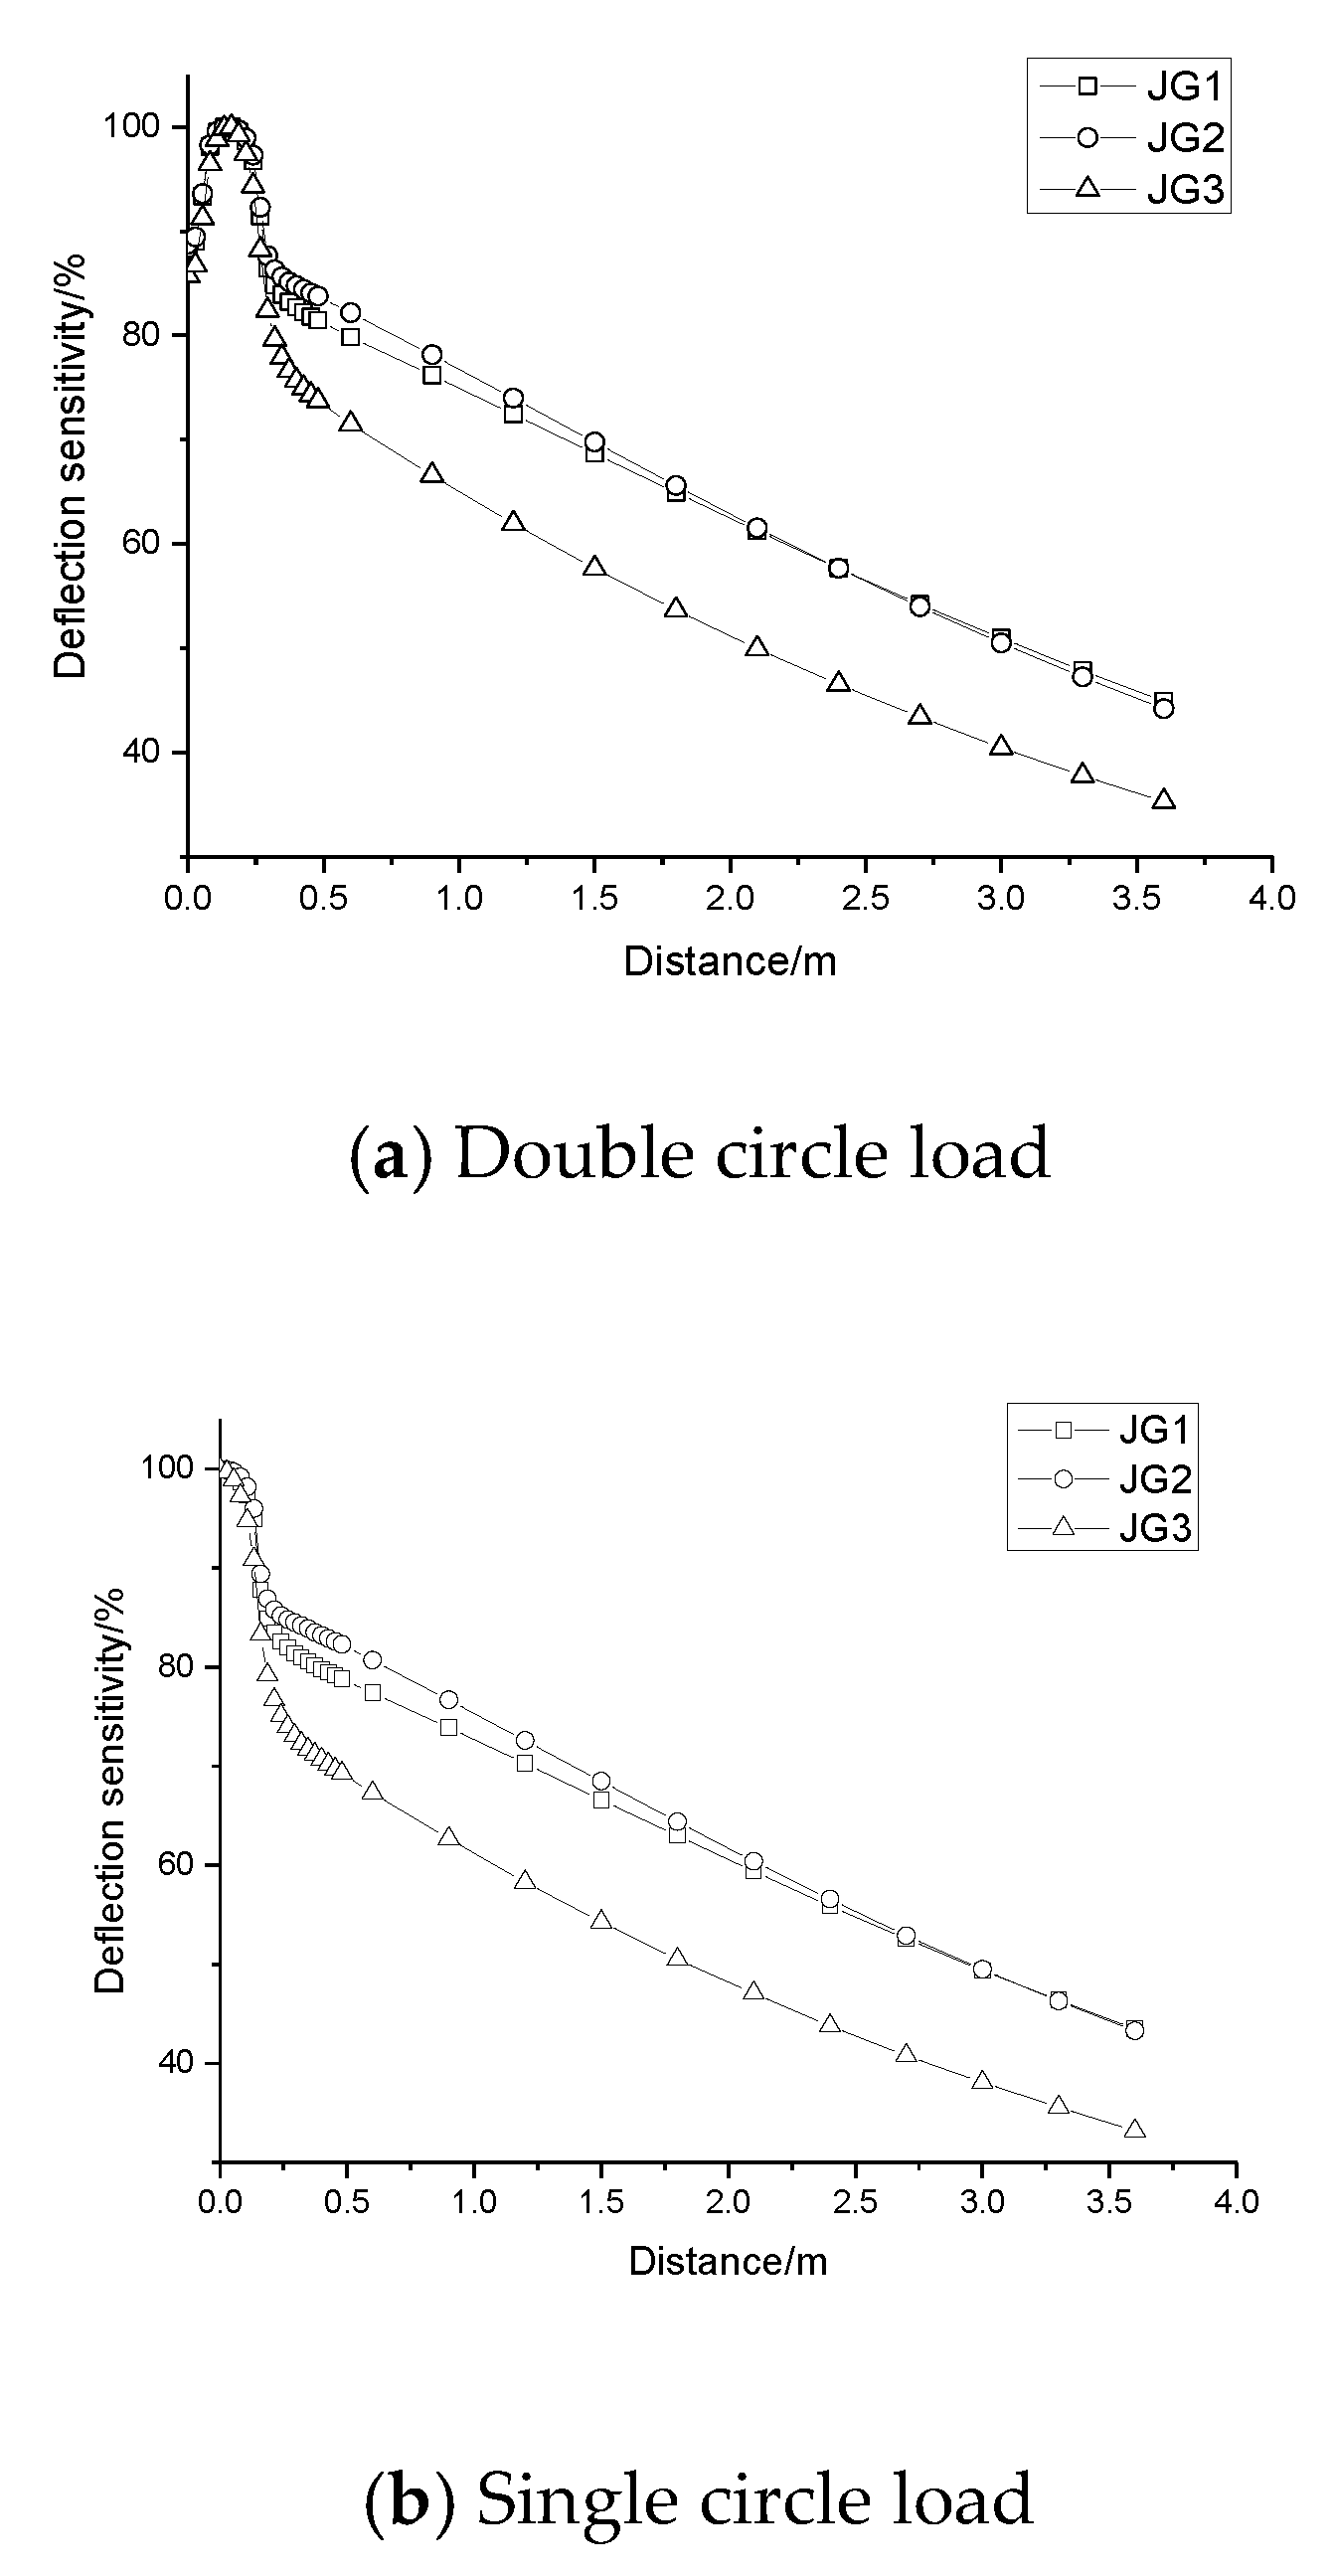
4.3.1. The Rules of Deflection Sensitivity
By conducting the steps (1) and (2) of the analysis software, the deflection sensitivity within the range of 0–3.6m under the single and double circular loads was calculated, respectively, as shown in
Figure 4.
Comparative analysis of deflection sensitivity of three structures according to
Figure 4 revealed the following points: (1) Under the double circle load, the order of deflection sensitivity was structure II > structure I > structure III for points 1–26 (i.e., transverse distance 0–2.4 m), and structure II > structure III for points 27–30 (i.e., transverse distance 2.7–3.6 m). (2) Under the single circle load, the order of deflection sensitivity was structure II > structure I > structure III for point 1–28 (i.e., transverse distance 0–3 m), and structure I > structure II > structure III for point 29–30 (i.e., transverse distance 3–3.6 m).
The three structures were also compared for the deflection and deflection sensitivity curves. The comparison revealed the following points: (1) Near the load, the deflection values were quite different, but the deflection sensitivity values were slightly different. (2) With an increase in distance, the deflection curves of different pavement structures came closer and almost overlapped, which indicated that the deflection value at a point far away from the load was less sensitive to the type of pavement structure. Therefore, the deflection and deflection sensitivity far away from the load were not considered in this study, and hence, it was concluded that the order of deflection sensitivity of three pavement structures was structure II > structure I > structure III. According to the meaning of deflection sensitivity as in Equation (1), the ranking results of the structural rigidity of the three structures were the same as that of the deflection under the uniform load of double circles, but not the same as that under the uniform load of single circle. (3) With an increase in distance, the sensitivity curves of structure I and structure II were almost identical (
Figure 4), but were different from the sensitivity curve of structure III, which showed that the rigidity of structure I and structure II was relatively close and significantly larger than that of structure III. This observation is consistent with the conclusion of the previous analysis of deflection.
This analysis showed that the deflection value cannot serve as an evaluation index because different conclusions could be drawn with different loading forms. For example, for structure I and structure II in this paper, the order of the maximum deflection value under the uniform load of double circle and single circle was just the opposite. However, the sensitivity of deflection was not affected by the load form, and the conclusion of uniform load form of the single circle and double circle was consistent with that of the uniform load form of the double circle required by the specifications. Furthermore, since the deflection value further from the load was similar for different structures, the deflection value evaluation, which was based on the maximum deflection value of a single point, would present limited information. However, the deflection sensitivity was based on a number of sensitivity values on a line in the Y direction of YZ section, and the curve formed by the sensitivity could distinguish the rigidity of different structural types.
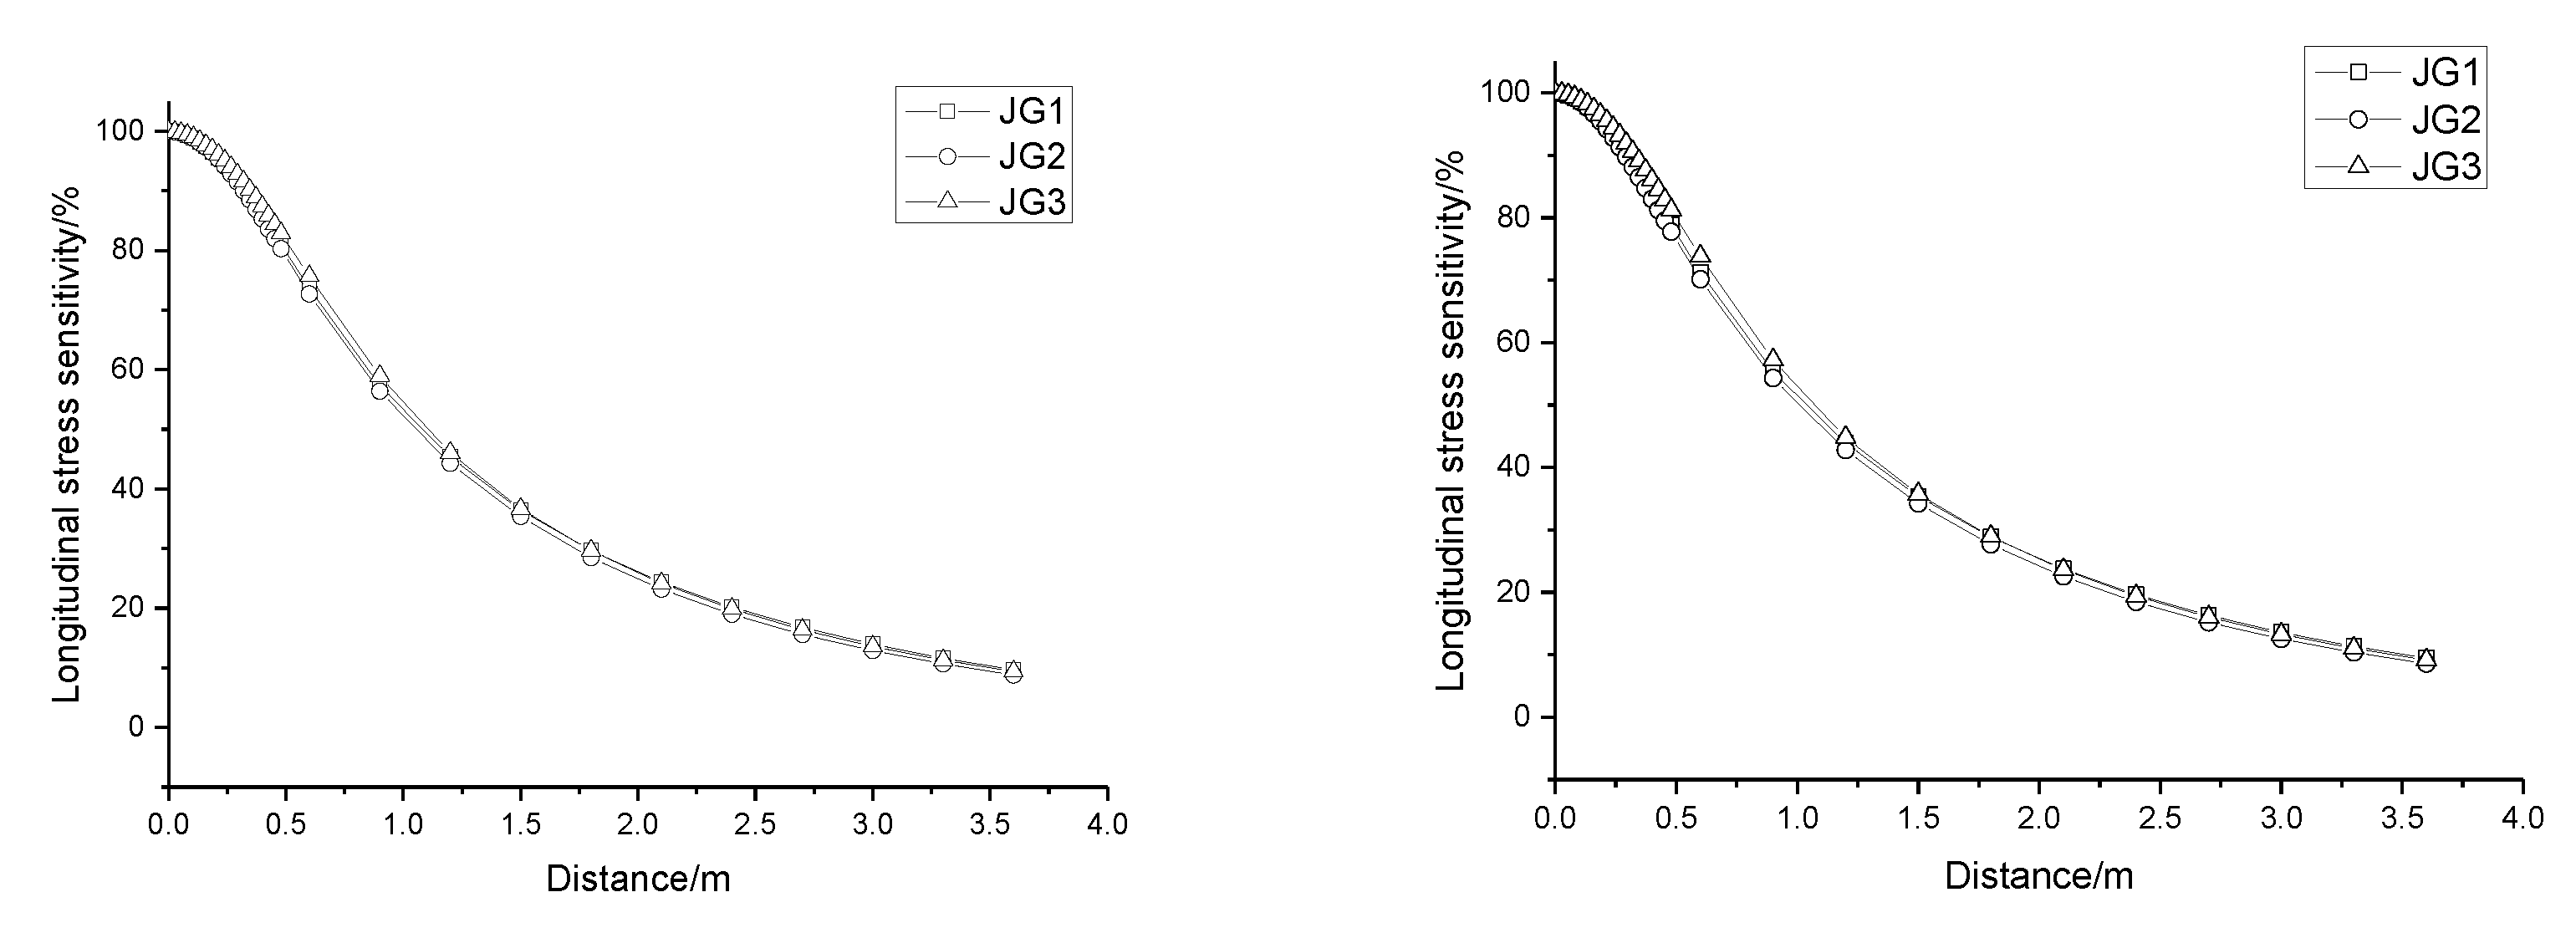
4.3.2. The Rules of Stress Sensitivity
Conducting steps (1) and (2) of the analysis software, the stress sensitivity of the lower surface layer bottom, the lower base layer bottom, and the sub-base layer bottom under three structures within the range of 0–3.6 m under the single and double circular loads was calculated, respectively, as shown in
Figure 5,
Figure 6 and
Figure 7.
According to the definition of stress sensitivity and the rules of deflection sensitivity in
Section 4.3, the range of stress sensitivity under the uniform load of double circles and single circle was 0.1864–2 m and 0–2 m, respectively.
In the selected range, under the double circle and single circle loads, sensitivity of the transverse stress at the lower surface layer was ranked as structure I > structure III > structure II, the longitudinal stress at the base layer was ranked as structure I > structure III > structure II, and the longitudinal stress at the sub-base layer was ranked as structure III > structure I > structure II.
Large differences were observed in the ranking results of stress and stress sensitivity of each layer. This was attributed to the fact that the maximum stress of a single point at the bottom of the structural layer represented the most unfavorable mechanical state of the structural layer under the load, and the starting point focused on the structure. On the other hand, the stress sensitivity at the bottom of the layer represented the feedback mechanism of the material of each structural layer after the structure was stressed, and focused on the material.
As shown in
Figure 5,
Figure 6 and
Figure 7, comparing the sensitivity of the three road structures at the same distance as the distance increased, the difference in sensitivity of the three road structures increased first and then decreased. Under the double circle load, the maximum difference in the transverse stress of the lower surface layer, the longitudinal stress of the base layer and the longitudinal stress sensitivity of the sub-base layer was 20.8%, 15.0%, and 3.0%, respectively, and the corresponding distance was 0.3195 m, 0.6 m, and 0.6 m, respectively. Under the single circle load, the maximum difference in the transverse stress of the lower surface layer, the longitudinal stress of the base layer, and the longitudinal stress sensitivity of the sub-base layer was 19.2%, 17.9%, and 3.7%, respectively, and the corresponding distance was 0.213 m, 0.426 m, and 0.6 m, respectively. The difference in stress sensitivity was mainly observed in the surface layer and base layer. This observation is consistent with the understanding that semi-rigid base acts as the main bearing layer. Therefore, the stress sensitivity index was observed as a suitable index for evaluating the mechanical performance of a pavement structure.
The stress sensitivity of structure I was greater than that of structure II, which indicated that the utilization efficiency of the asphalt layer and semi-rigid sub-base material of structure I was better than that of structure II due to the difference in construction method, namely, setting of reinforced semi-rigid base material and roller compacted concrete base material. The semi-rigid sub-base materials of structure I and structure III were approximately identical, with thicknesses of 19 cm and 20 cm, respectively. The stress sensitivity of structure III was greater than that of structure I, which was contrary to the conclusion based on stress sensitivity of the lower layer and the base layer. This contrast might have been related to the thickness.
Comparison of deflection sensitivity and stress sensitivity indicates that the deflection sensitivity can evaluate the rigidity of the entire structure, and the stress sensitivity can evaluate the stress distribution uniformity and material utilization efficiency of each layer. However, the sensitivity index can only be qualitatively analyzed, and the degree to which the results of each layer are inconsistent may be related to the thickness, which is further analyzed in the following section.
4.4. Analysis of Evaluation Results
Considering the influence of different sensitivity threshold values on the evaluation results, five different thresholds of 50%, 40%, 30%, 20%, and 10% were selected for the stress sensitivity of the key layers. The coordinates of the bottom of each key layer under different thresholds of three pavement structures were extracted by using the analysis software, as shown in
Table 6. The transfer path envelope diagram of each structural layer was obtained and its area was calculated by the analysis software. The envelope diagram is shown in
Figure 8 and the envelope area is shown in
Table 7.
Therefore, the envelope area of each layer was divided by the thickness to get the equivalent envelope area. The equivalent envelope area could characterize the ability of the material to bear and transfer stress per unit thickness in the whole pavement structure. The larger the value, the higher the material utilization efficiency, the more uniform the stress distribution, and the more reasonable the pavement structure. The equivalent envelope area is shown in
Table 8.
As seen in
Table 8, the following conclusions were made:
- (1)
The order of equivalent envelope area of the asphalt layer, base layer, sub-base layer, and pavement structure under the five threshold levels was structure I > structure III > structure II, and the order was not affected by the threshold level.
- (2)
The material and thickness of the asphalt layer of structure I and structure II were identical, but the equivalent envelope area for structure I was greater than that for structure II. This indicated that the utilization efficiency of structure I asphalt layer was better when compared to structure II. The semi-rigid sub-base materials of the three structures were identical, and the equivalent envelope area followed the order structure I > structure III > structure II. This showed that the utilization efficiency of the semi-rigid sub-base materials followed the order structure I > structure III > structure II. By combining the ranking results of the equivalent envelope area of each structural layer, it can be concluded that the design of structure layer material is the most reasonable for structure I, is slightly worse for structure III, and is the worst for structure II. The rigidity of structure II is the best, but the material utilization efficiency is the lowest. It is not wise to ignore the reasonable allocation of materials in each structural layer in order to pursue the rigidity of the structure; thus, structure II is not an optimum design.


