Article

Characterization of Antimicrobial Effects of Plasma-Treated Water (PTW) Produced by Microwave-Induced Plasma (MidiPLexc) on Pseudomonas fluorescens Biofilms

1
Leibniz Institute for Plasma Science and Technology (INP), Felix-Hausdorff-Str. 2, 17489 Greifswald, Germany
2
Institute of Microbiology, University of Greifswald Felix-Hausdorff-Str. 8, 17489 Greifswald, Germany
3
School of Food Science and Environmental Health, College of Sciences and Health, Technological University, Dublin, Cathal Brugha Street, D01 HV58 Dublin, Ireland
*
Author to whom correspondence should be addressed.
Appl. Sci. 2020, 10(9), 3118; https://doi.org/10.3390/app10093118
Submission received: 7 April 2020 / Revised: 21 April 2020 / Accepted: 28 April 2020 / Published: 29 April 2020
(This article belongs to the Special Issue Application of Plasma Technology in Bioscience and Biomedicine)

Abstract

:
For the decontamination of surfaces in the food production industry, plasma-generated compounds such as plasma-treated water or plasma-processed air offer many promising possibilities for future applications. Therefore, the antimicrobial effect of water treated with microwave-induced plasma (MidiPLexc) on Pseudomonas fluorescens biofilms was investigated. A total of 10 mL deionized water was treated with the MidiPLexc plasma source for 100, 300 and 900 s (pretreatment time) and the bacterial biofilms were exposed to the plasma-treated water for 1, 3 and 5 min (post-treatment time). To investigate the influence of plasma-treated water on P. fluorescens biofilms, microbiological assays (colony-forming units, fluorescence and XTT assay) and imaging techniques (fluorescence microscopy, confocal laser scanning microscopy, and atomic force microscopy) were used. The colony-forming units showed a maximum reduction of 6 log10 by using 300 s pretreated plasma water for 5 min. Additionally, a maximum reduction of 81% for the viability of the cells and a 92% reduction in the metabolic activity of the cells were achieved by using 900 s pretreated plasma water for 5 min. The microscopic images showed evident microbial inactivation within the biofilm even at the shortest pretreatment (100 s) and post-treatment (1 min) times. Moreover, reduction of the biofilm thickness and increased cluster formation within the biofilm was detected. Morphologically, the fusion of cell walls into a uniform dense cell mass was detectable. The findings correlated with a decrease in the pH value of the plasma-treated water, which forms the basis for the chemically active components of plasma-treated water and its antimicrobial effects. These results provide valuable insights into the mechanisms of inactivation of biofilms by plasma-generated compounds such as plasma-treated water and thus allow for further parameter adjustment for applications in food industry.

1. Introduction

Investigations on the antimicrobial activity of plasma is a continually growing field of research. Although antimicrobial effects have been demonstrated for a range of plasma sources and treatment conditions, the majority of the underlying mechanisms remain unknown. Additionally, the production of further plasma-generated compounds (PGCs) such as plasma-processed air (PPA) and plasma-treated water (PTW) embraces a conglomeration of chemical reactions in different surroundings (water, air), which make the whole process extremely complex [1,2]. Therefore, it is not only important to know the composition of the plasma gas, but also the chemical interactions with the ambient air and the treated water. PPA and PTW, which are mixtures of compounds originating from these complex chemical pathways, possess antimicrobial effects. The PTW produced by the MidiPLexc was not affected by any significant temperature changes during the treatment and reached pH values of 2.59, 1.93 and 1.22 at pretreatment times of 100, 300 and 900 s. The most important molecular components of the PTW were hydrogen peroxide (H2O2), nitrate (NO3), nitrite (NO2) and a third component which could not be clearly identified so far but was most likely peroxynitrite (ONOO). At 100 s pretreatment time, the following concentrations could be measured—H2O2: 77 mg/L, NO3:3.4 mg/L, NO2: 241.32 mg/L, ONOO: 9.968 mg/L. At 300 s pretreatment—H2O2: 297 mg/L, NO3: 27.06 mg/L, NO2: 893.54 mg/L, ONOO: 65.23 mg/L and at 900 s pretreatment—H2O2: 717.3 mg/L, NO3: 72.29 mg/L, NO2: 1600.71 mg/L and ONOO: 224.57 mg/L [3]. Despite this fact, the mechanism of action of these substances on bacterial biofilms is still unknown.
The antimicrobial effects have been demonstrated for various products such as vegetables, fruits, and meat, as well as dairy products and further processed food products [4,5,6,7,8,9,10,11]. Nonetheless, it is of crucial importance to achieve an antimicrobial effect on pathogens without damaging the product itself [12]. Thus, challenges of plasma treatment are comparable with demands of the treatment of medical devices, where the pathogens must be destroyed without harming the patients or their tissues [13]. Despite these challenging factors, especially PPA and PTW have gained interest in the food industry.
Pseudomonas fluorescens, a Gram-negative, oxidase-positive, rod-shaped bacterium, is frequently found as a spoilage microbe in the food industry [14,15] and as a commensal in the digestive tract of humans [16]. At the same time, some P. fluorescens strains naturally occur as a plant-growth-promoting rhizobacterium [17]. P. fluorescens is a common contaminant in the dairy industry, where it releases blue nondiffusible pigments on cheese during its production [18]. Furthermore, it frequently contaminates refrigerated products like meat or milk and fish products such as cod or haddock [15,19,20,21].
P. fluorescens forms biofilms composed of an extracellular matrix (ECM) [22]. When cells adhere unspecifically to surfaces, cellular and physiological changes occur, which enhance ECM formation [23,24]. Several environmental factors, such as the osmolarity or nutrient availability, affect the ability of P. fluorescens to attach to abiotic surfaces. However, iron has been proven to be the most crucial factor for biofilm adhesion [25]. A wide range of genes, e.g., flagella or Clp protease synthesis, appear to be crucial for tight surface attachment [26]. Generally, a decisive factor for a long-term survival strategy of the bacterial cells is the detachment from the mature biofilm, subsequently followed by colonization of new regions via an undirected diffusion [27]. Besides, the access to essential compounds like oxygen, or the release of specific lyase enzymes seem to be crucial triggers for the detachment of biofilms [28]. As a consequence, these factors lead to a disintegration of the ECM and a release of cells into the surrounding medium.
Concerning rinsing processes in industrial applications, the dispersion of the organism into other areas only plays a minor role. The main priority is the complete detachment of the biofilm from the overgrown surface to remove it from the system during the flushing processes. Initial studies have already shown a unique effect of plasma gas on the adhering surface of the biofilm [29,30]. The present study aimed to investigate whether PTW also has such special effects on the biofilm.

2. Materials and Methods

2.1. Plasma Source

The MidiPLexc [3] is a microwave-driven plasma source and an extension of the MiniMIP [29,30]. This plasma source is, in contrast to common plasma sources, able to work with compressed air instead of inert gases like argon or helium. Additionally, this plasma source is able to treat water with the plasma gas through the built-in adapter. This leads to the generation of PTW, which can be used for antimicrobial applications. The MidiPLexc was operated with compressed air as the working gas (drew point 3 °C) with a gas flow of 1 slm and a forward power of 80 W and reverse power of 20 W. Before the start of the experiments, the plasma source was running for 30 min without treatment of the target to ensure a stable effluent.

2.2. Generation of PTW by the Microwave Plasma

A 1 l glass bottle was filled with 10 mL deionized water (DW) and was integrated into the special bottle device of the MidiPLexc for the production of the PTW [3]. For the biological investigations, three different pretreatment times (100, 300, 900 s) and three different post-treatment times (1, 3, 5 min) for each pretreatment time were used. Each post-treatment time for the biofilms was performed in threefold repetition per experimental day. Each test was performed on four different experimental days. This yielded n = 12 for each post-treatment time. The time points were chosen based on already published work in order to represent the dynamic range of the effects [3].

2.3. Bacterial Strains and Growth Conditions

P. fluorescens ATCC 13525 (ATCC, American Type Culture Collection) was used for biofilm cultivation. In the beginning, 1 l Brain Heart Infusion broth (BHI) (Carl Roth, Karlsruhe, Germany) was prepared, autoclaved and the pH value of the solution was adjusted to pH 6. This was adapted according to the results of a previous study [30]. Additionally, the BHI medium was pumped through a sterile filter system (VWR (avant), Darmstadt, Germany) using a vacuum pump. A colony was removed from the Columbia agar plate (medium for long-term cultivation) with the inoculation loop, resuspended in 50 mL BHI, and incubated for 24 h at 30 °C without shaking under aerobic conditions. On the next day, 1 mL of the suspension was diluted with BHI media and adjusted to an optical density (OD) of 0.050 at 600 nm. This suspension was used for biofilm cultivation. Specifically, 300 µL was pipetted per well in a 96-well plate prior to incubation for 24 h at 30 °C in the dark without shaking to ensure cell adhesion under aerobic conditions. Afterward, the medium was removed to discard the nonadhered cells, and 300 µL of fresh medium was added under aerobic conditions. After further incubation for 24 h at 30 °C in the dark without shaking, the PTW treatment was started.

2.4. PTW Treatment of P. fluorescens Biofilms

After carefully removing the medium, the biofilm was topped with 300 µL of the PTW for the different post-treatment times of 1, 3, and 5 min. Each post-treatment time was investigated separately to avoid any drying effects on the biofilms. Afterward, the PTW was removed, and the biofilm was mechanically detached from the plate surface and dissolved in 300 µL of phosphate-buffered saline (PBS, pH 6.4, according to Sörensen) by resuspension. To ensure the transfer of the entire biofilm, this step was repeated once again which resulted in a final suspension volume of 600 µL of the specimen. This suspension was used for colony-forming unit (CFU) analyses (2.5), fluorescence assays (2.6), and XTT assays (2.7). The mechanical detachment of the biofilms was omitted for fluorescence microscopy (2.8), confocal laser scanning microscopy (CLSM) (2.9) and atomic force microscopy (AFM) (2.10).

2.5. Performance of the Colony-Forming Units (CFU) Assay of PTW-Treated Biofilms

At the beginning, 100 µL was taken from the 600 µL sample suspension (2.4) to perform a serial dilution. This was done by diluting the sample suspension after plasma treatment 1:10 with maximum recovery diluent (MRD; 0.85% NaCl, 1% tryptone). The controls were finally diluted 1:1,000,000 and the samples 1:1000. Each dilution step was plated on BHI agar by pipetting 10 µL per dilution onto the plate and spread out by using the tilting technique. The plates were incubated at 30 °C for 24 h under aerobic conditions. The colonies of the respective dilution levels were counted manually, and the CFU/mL were calculated as described before [30].
The propagation of error was calculated for each treatment group. This finally resulted in 4 different error propagations for each treatment time from which the weighted error was calculated and used as error bars in the illustration (Figure 1) [31]. The experiment was performed in four independent experiments with three technical replicates each.

2.6. Fluorescence LIVE/DEAD Assay

The LIVE/DEAD BacLight™ Bacterial Viability Kit (Thermo Scientific, Waltham, USA) was prepared according to product instructions.
First, 0.9 µL of the Propidium Iodide (PI) and SYTO9 mixture was added to 300 µL sample and was incubated at room temperature (20–25 °C) for 20 min. A 96-well plate was used to determine the fluorescence signal for each sample with a fluorescence microplate reader (Varioskan-Flash, Thermo Scientific, Waltham, USA) with an excitation wavelength of 470 nm and an emission wavelength of 530 nm for the green (G) fluorescence and 630 nm for the red (R) fluorescence, respectively. Subsequently, a ratio G/R was calculated by dividing the intensity value of red fluorescence from the value of green fluorescence. The ratio G/R values of the controls and samples were expressed as a percentage in relation to each other and were graphically displayed.

2.7. XTT Assay

A colorimetric assay was used to determine the cell viability after plasma treatment (XTT Cell Proliferation Assay Kit, Applichem, St. Louis, USA). Therefore, it represents cell vitality as a function of redox potential, originating from a transplasma membrane electron transport [32]. N-methyl dibenzopyrazine methyl sulfate (PMS) was used as an intermediate electron carrier, which serves as an activator of the intended reaction. The 2,3-Bis-(2-methoxy-4-nitro-5-sulfophenyl)-2H-tetrazolium-5-carboxanilid–sodium salt (XTT) solution was mixed 1:50 with the activator solution before being diluted 1:3 with the samples in a 96-well plate. After an incubation time of 20–24 h at 37 °C on a rotary shaker (80 rpm), the samples were scanned in a 96-well plate using a wavelength of 470 nm with the microplate reader. The measured values were blank-corrected using the scanned value at a wavelength of 670 nm of the XTT and activation solution mixture without the bacterial suspension. The experiment was performed in four independent experiments with six technical replicates each. The measured values of the samples and controls were set in relation to each other and visualized as a percentage and graphically displayed as metabolic activity.

2.8. Fluorescence Microscopy

For fluorescence microscopy, transparent 96-well plates (Eppendorf, Hamburg, Germany) were used to grow biofilms. The LIVE/DEAD BacLight Bacterial Viability Kit (containing SYTO9 to stain all microorganisms, and propidium iodide (PI) to stain dead cells) was used according to the manufacturer’s protocol. Widefield fluorescence images were acquired using an Operetta CLS high-content imaging device (PerkinElmer, Hamburg, Germany). For whole-well imaging, four fields of view were stitched digitally. A 5x objective (air, NA = 0.16, Zeiss, Oberkochen, Germany) was used. The dye SYTO9 was excited by a 475 nm (110 mW) LED, and the fluorescence was collected through a 525 ± 25 nm bandpass filter. The PI was excited by a 550 nm (170 mW) LED, and the emission light was collected through a 610 ± 40 nm bandpass filter. The laser autofocus (785 nm) provided exact focusing across all fields of view. For display, three stacks were merged into a maximum intensity projection to account for topographical particularities in the z-plane (focus ± 25 µm). For 3D images of biofilms, 30 z-planes (stacks) with 1.5 µm between each plane were measured using a 40x air objective (NA = 0.6). Three-dimensional reconstruction, image stitching, and quantification were done using Harmony 4.8 software (PerkinElmer, Hamburg, Germany).

2.9. Confocal Laser Scanning Microscopy (CLSM)

The biofilms were cultivated, plasma-treated and LIVE/DEAD™ stained as described above (2.2; 2.3; 2.4; 2.8). After the staining and washing procedure, the supernatants were removed, and the biofilms were analyzed using a Zeiss LSM 510 microscope (Carl Zeiss, Jena, Germany) equipped with a 63x objective (water, NA = 0.1) and filter and detector settings for monitoring SYTO9 and PI fluorescence (excitation at 488 nm using an argon laser, emission light of SYTO9 selected with a 505–530 nm bandpass filter, emission light of PI selected with a 650 nm long-pass filter). Three-dimensional images were acquired using the ZEN 2009 software (Carl Zeiss, Jena, Germany) with an area of 100 × 100 µm and z-stack sections of 0.45 µm.

2.10. Atomic-Force Microscopy (AFM)

A portable surface for the biofilms was required for the AFM, since 96-well plates could not be inserted into the device. Therefore, 13 mm coverslips (Sarstedt, Nümbrecht, Germany) were used for biofilm growth with the coverslips being added to the wells of the 12-well plate. For better adhesion of the coverslips to the surface of the well plates and to avoid the growth of the pathogen at the bottom of the coverslips, 50 mL Gelrite™ (Duchefa, Haarlem, Netherlands) was autoclaved and used immediately to avoid thermal curing processes. A volume of 1 mL liquid Gelrite™ was pipetted to each well of a 12-well plate. The coverslips were placed at the surface of the liquid Gelrite™ and were thermally cured. The biofilms were cultivated as described above and 1 mL of the BHI was pipetted to each well until the coverslips were topped with the medium. After 24 h, a medium change was carried out. The medium had to be removed and added very carefully to avoid damaging the biofilms. After a second incubation period of 24 h at 30 °C under aerobic conditions, the medium was removed and the biofilms were treated with the PTW as described (2.4). However, 1 mL PTW was used to enclose the coverslips entirely. Dehydration of the biofilms before AFM analysis was avoided by using a humidity chamber. The AFM measurements were carried out on a DI CP II SPM (Veeco, Plainview, USA), which was mounted on a vibration-free object table (TS 150, TableStable, Zwillikon, Switzerland). The setup was standing on an optical bench encased by additional acoustic protection. The AFM was equipped with a linearized piezo scanner, on which the coverslips were mounted on a metal sample holder with leading tabs. Image acquisition was performed at a scanning speed of 0.4 Hz, with an area of 20 µm2, and the set point being 8 N/m. The images were edited with Gwyddion (Czech Metrology Institute, Brno, Czech Republic).

3. Results

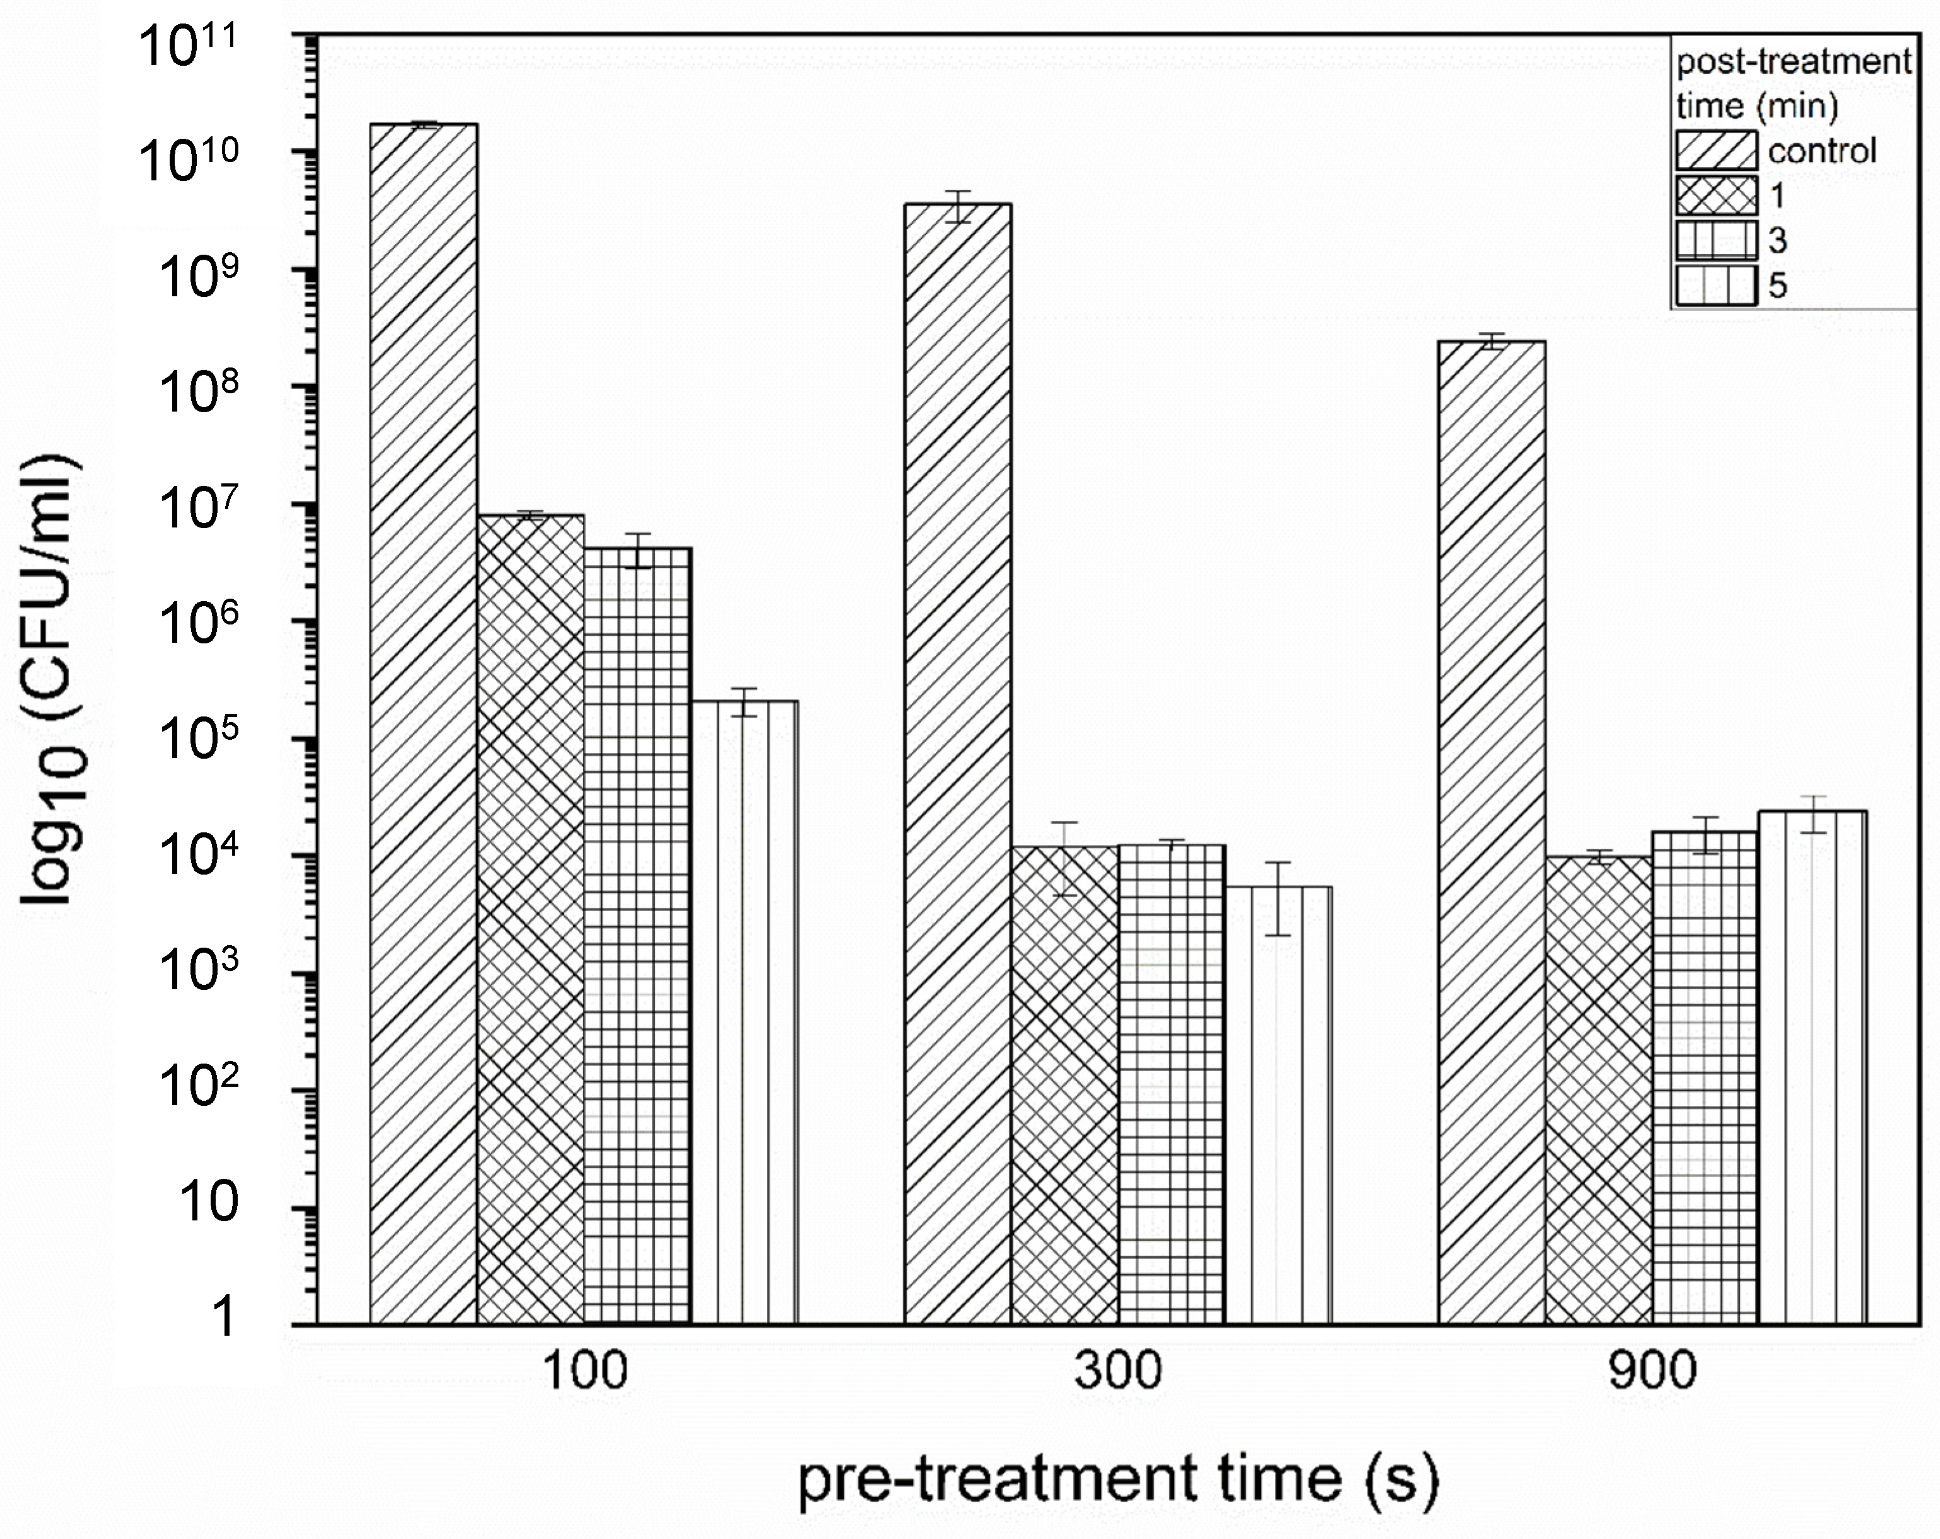
3.1. Impact of the PTW Treatment on the Proliferation Ability of the Cells (CFU)

The number of CFUs reflects the ability of cells to divide and multiply themselves. Thus, CFU counting has been used to quantify the effect of PTW treatment on cell proliferation. P. fluorescens already shows a substantial reduction of approximately 3 log10 in the proliferation ability after 1 min post-treatment with 100 s pretreated PTW. The effect increases continuously with higher treatment times of the biofilm (Figure 1, left). By using 300 s pretreated PTW, an even stronger reduction of approximately 6 log10 was detected. Again, a slightly stronger reduction occurs with increasing post-treatment time of the biofilm (Figure 1, center). After the treatment with 900 s pretreated PTW, there was no significantly stronger reduction compared to the treatment with 300 s pretreated PTW. Furthermore, the effects at increasing treatment times of the biofilms showed a constant reduction, if the error values are taken into account (Figure 1, right).

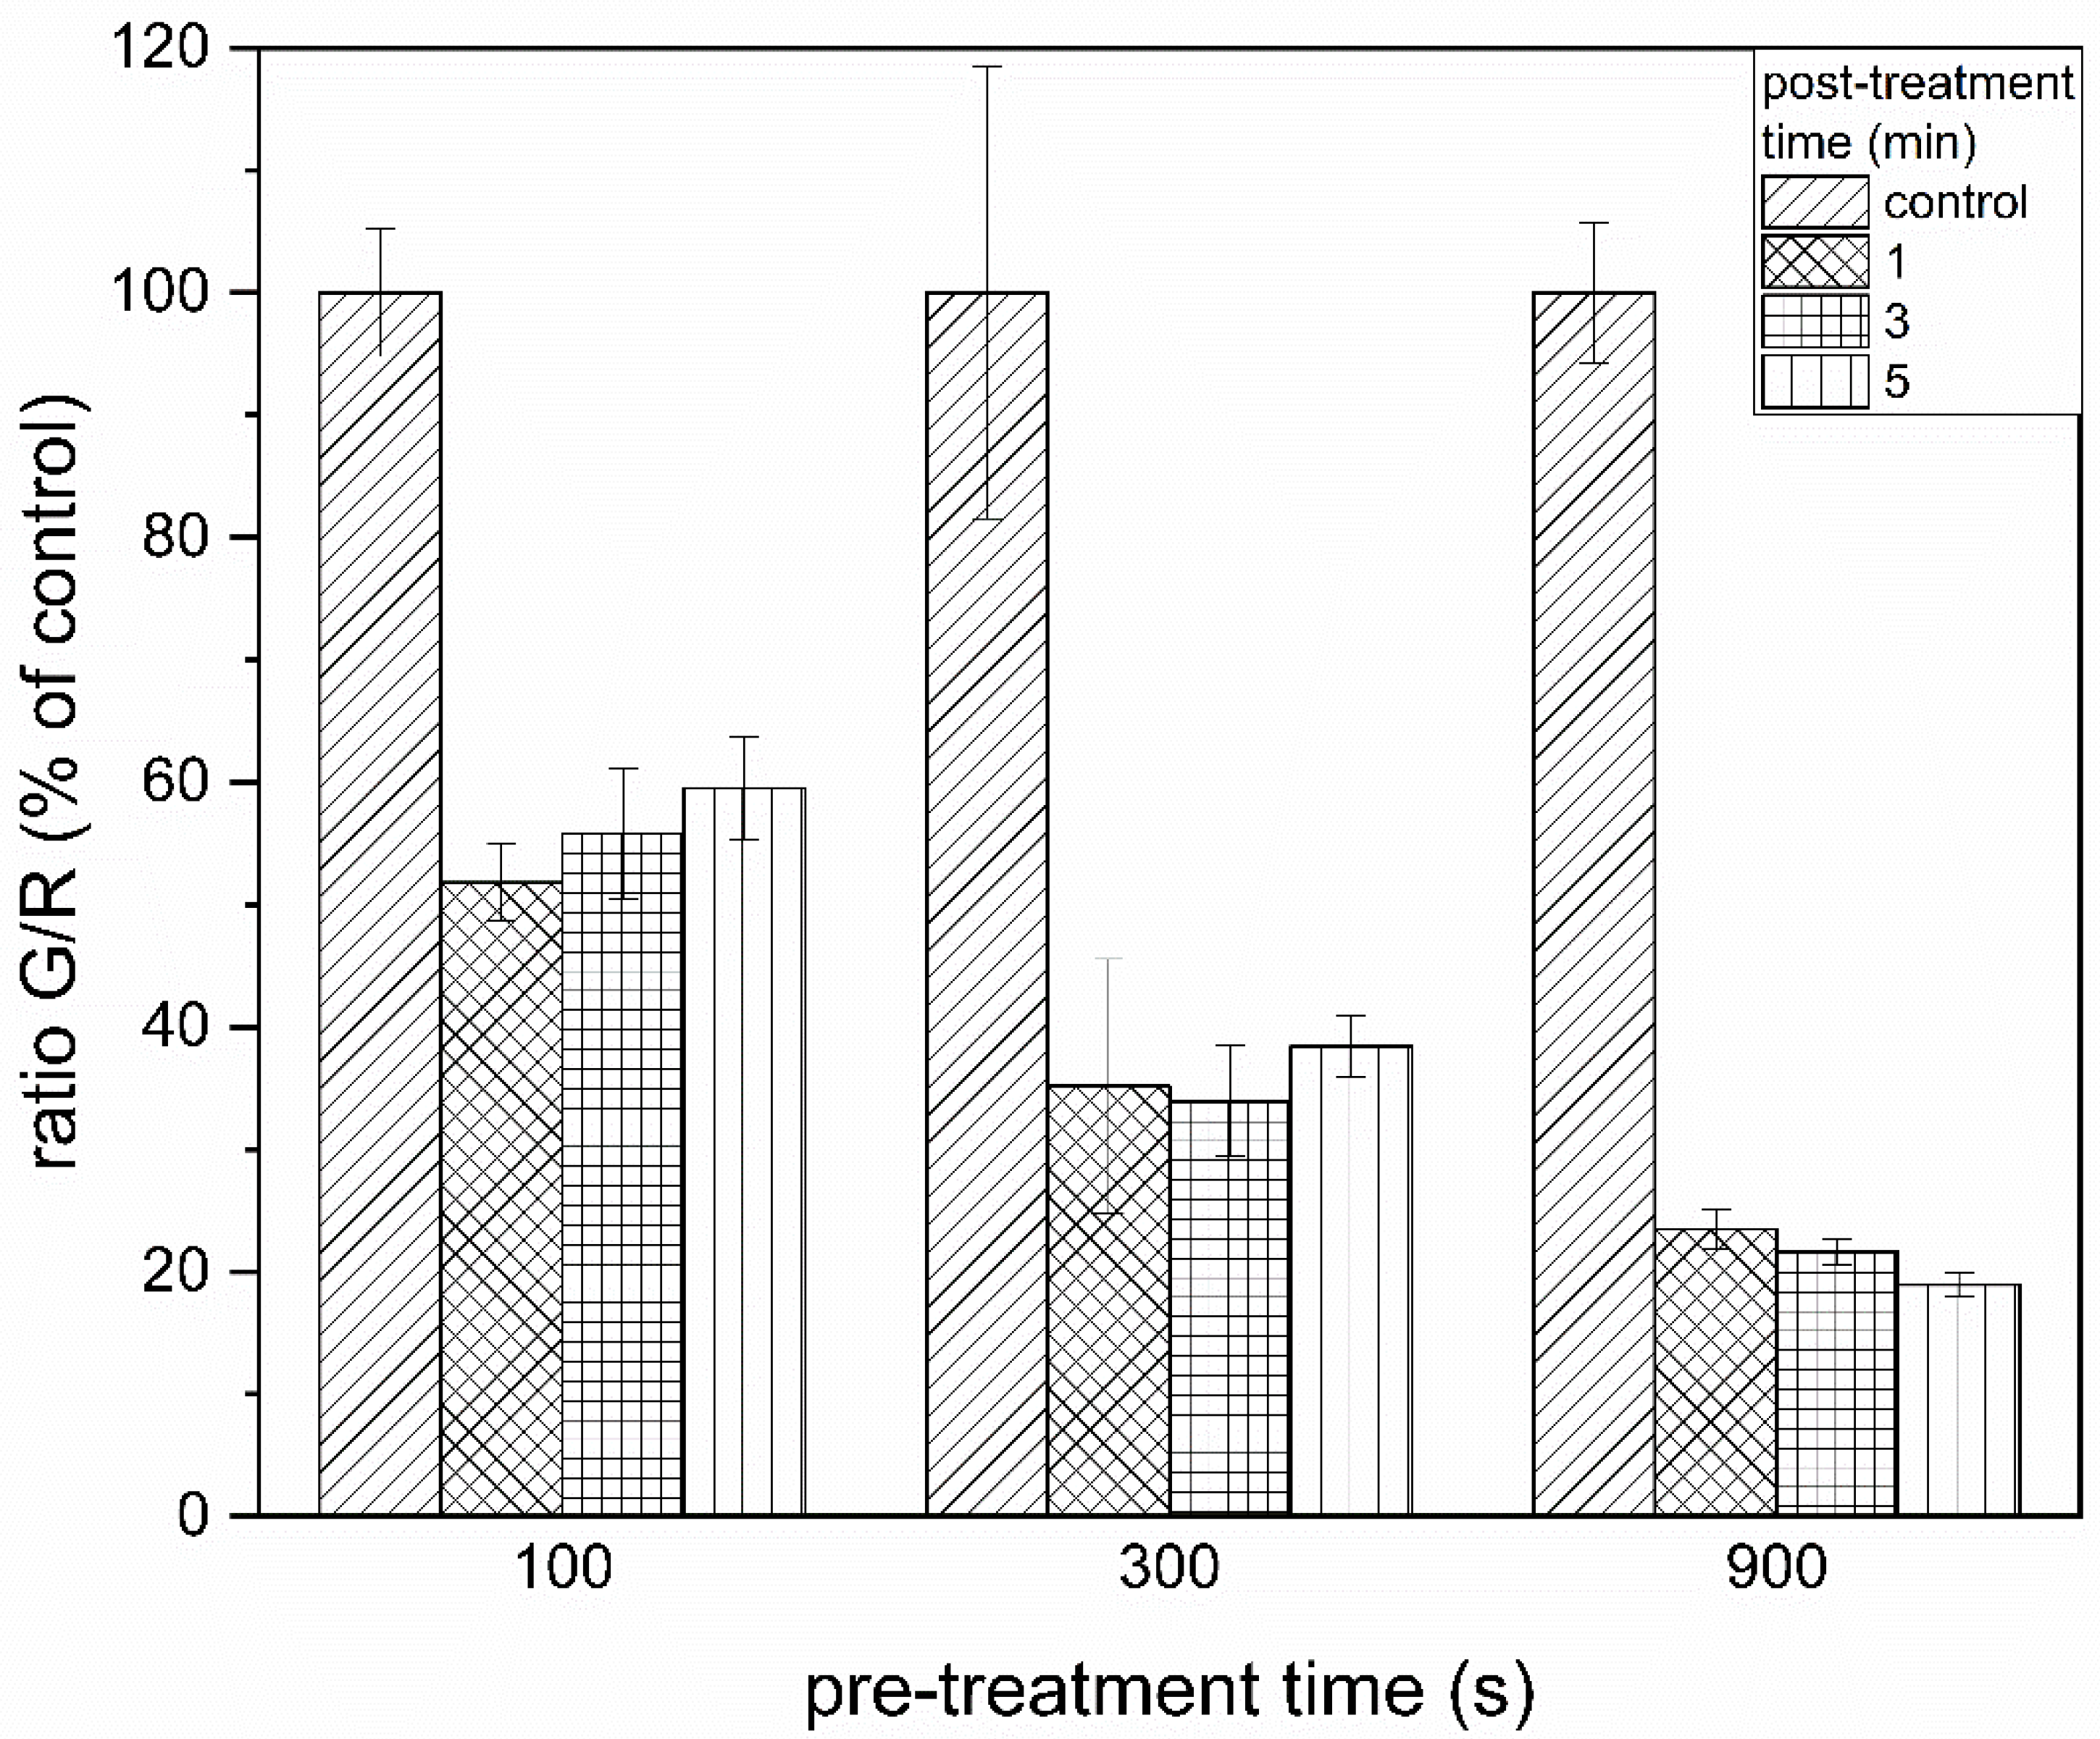
3.2. PTW Treatment of Biofilms Leads to Membrane Damage in Cells

The LIVE/DEAD fluorescence assay identifies membrane damages of cells in the biofilm after PTW treatment. The percentual ratio G/R of the treated biofilms compared to the untreated controls is shown in Figure 2. After the treatment of the biofilms with 100 s pretreated PTW, a considerable damage of the membrane could already be seen after 1 min treatment time. The ratio G/R was reduced by 50%. With an increasing treatment time of the biofilms, there was a slight decrease in the percentage of membrane damage compared to the untreated controls (Figure 2, left). The effect increases after the reaction of the biofilms with longer pretreated PTW. After 1 min post-treatment of the biofilms with 300 s pretreated PTW, the ratio G/R was already reduced by 63%. Once more, there were no significant changes after increasing the post-treatment time of the biofilms with the PTW (Figure 2, center). The highest effect in membrane damage of cells was detected after the treatment of biofilms with 900 s pretreated PTW. Here, after 1 min post-treatment time of the biofilms, a reduction of the ratio G/R of 79% could be demonstrated. Also, there was a slight increase in the effect of increasing post-treatment time of the biofilms (Figure 2, right).

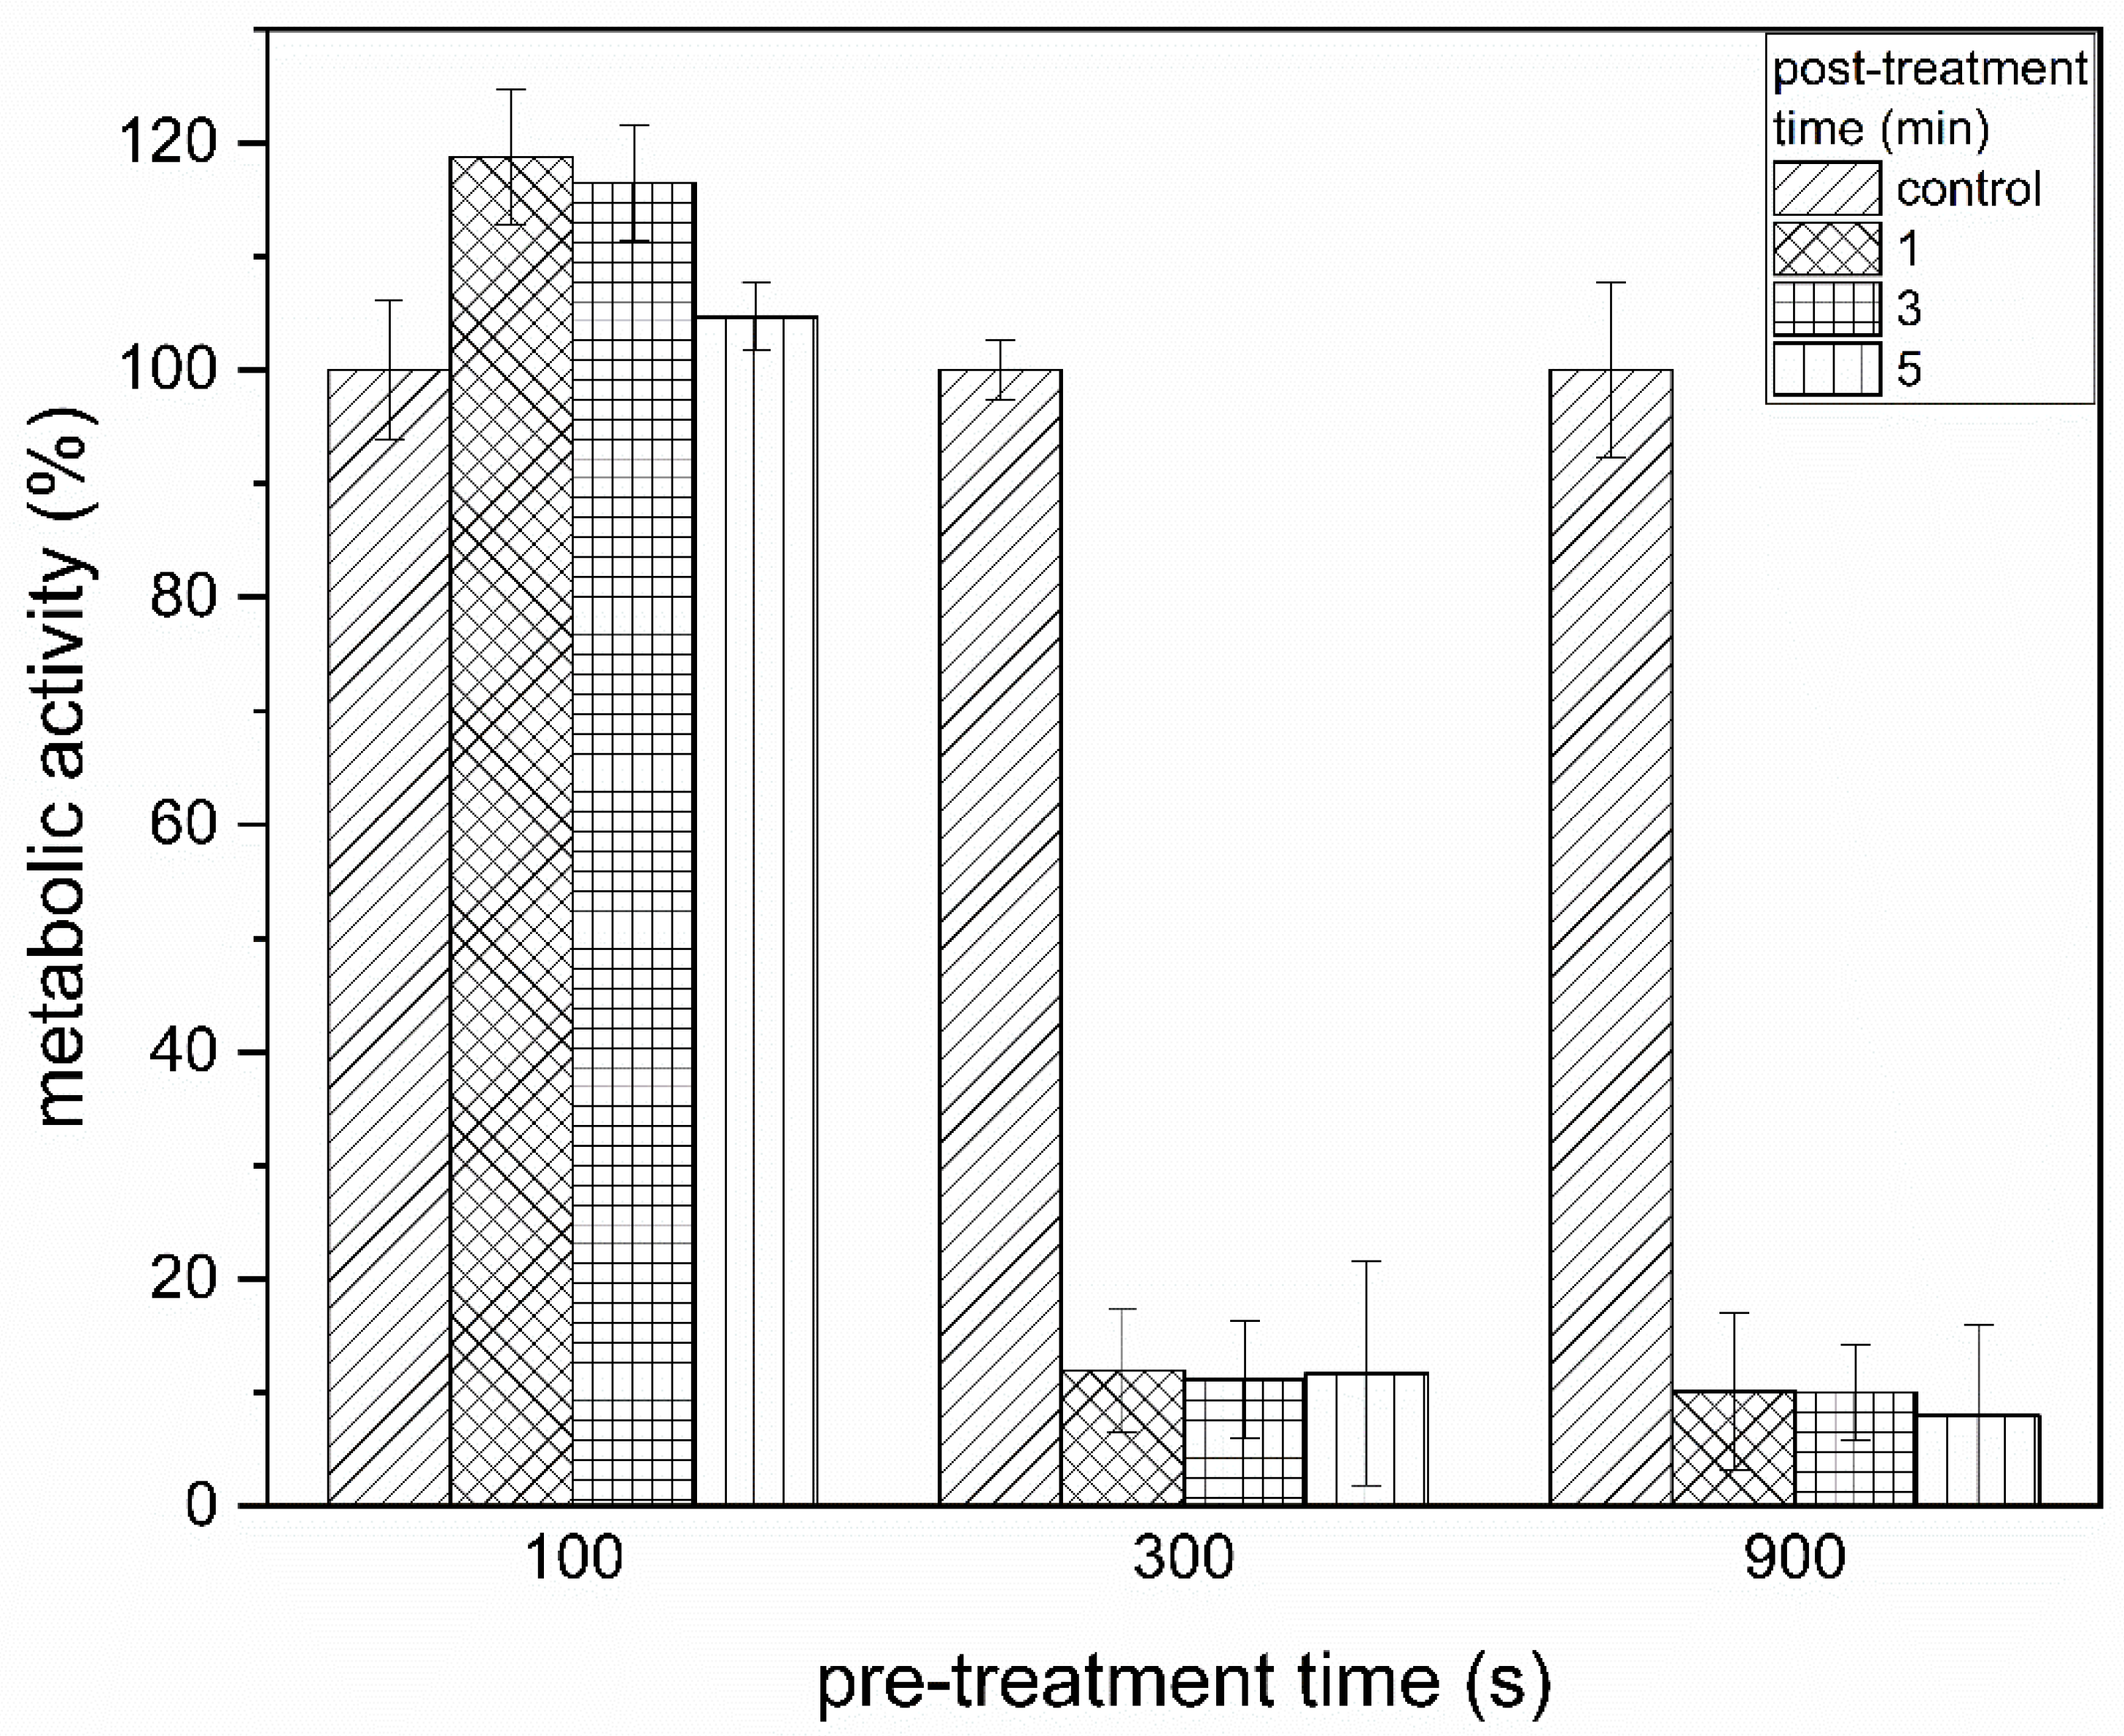
3.3. XTT Assay Revealed a Reduction in the Metabolic Activity of the Cells after PTW Treatment

The XTT assay (Figure 3), which is an indicator of the metabolic activity of the cells after the plasma treatment, showed no reduction if 100 s pretreatment PTW was used for three different post-treatment times. An increase in metabolic activity of up to 118% after 1 min post-treatment time could even be demonstrated in this setup (Figure 3, left). This effect weakened with increasing post-treatment time. However, strong reductions of up to 88% after 5 min of post-treatment time could be demonstrated after 300 s pretreatment (Figure 3, center). There was no significant difference detectable between the different post-treatment times in the reduction of metabolic activity. If 900 s pretreated PTW was used, a reduction compared to 300 s pretreatment could be demonstrated (Figure 3, right). The post-treatment times of 900 s did not significantly differ from each other as well as compared to the post-treatment times at 300 s.

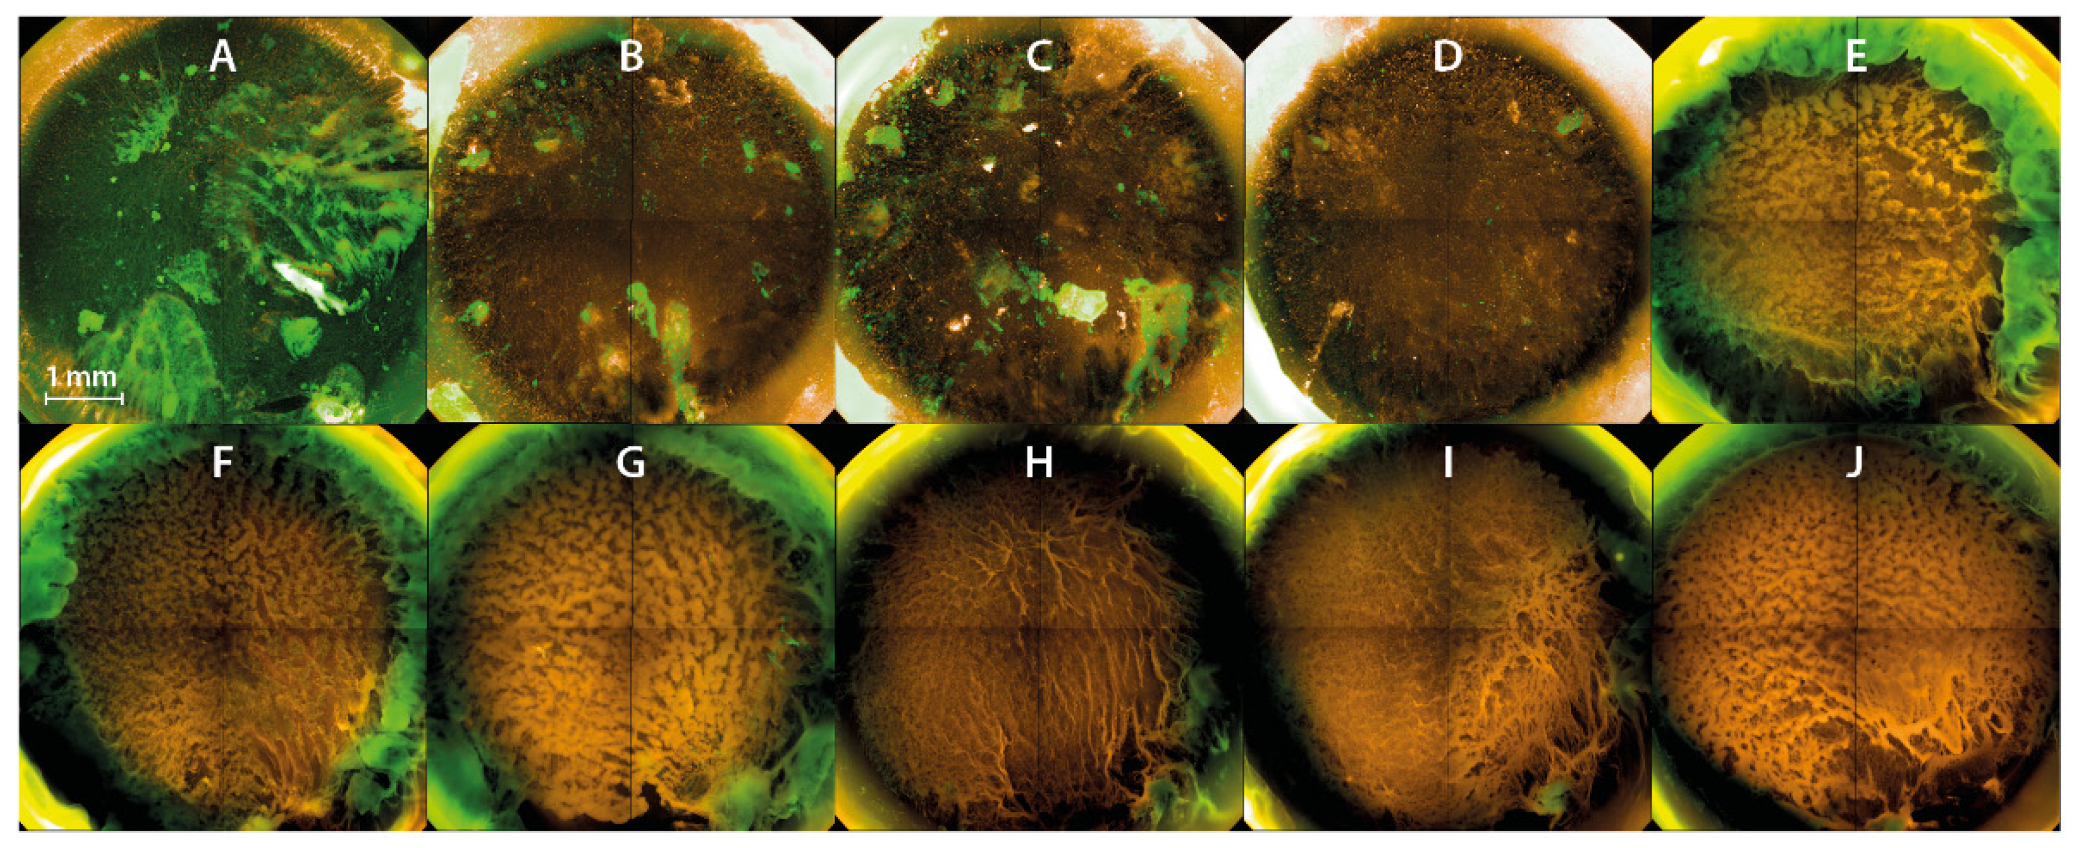
3.4. PTW Treatment of the Biofilms Leads to Inactivation of the Biofilm Layers from the Top in the Fluorescence Microscopy

Fluorescence microscopic images show the bottom biofilm layers, which grew into the abiotic surface. The control biofilm (Figure 4A) and the biofilms treated with 100 s pretreatment PTW show detachment of individual areas within the biofilm. (Figure 4B–D). This happened due to treatments with the fluorescence staining and the PTW (or PBS for the controls). After the treatment of the biofilms with the 100 s pretreatment PTW, there were isolated hot spots of living cells detectable within the biofilm. However, most of the cells were already affected and appeared to be dead. With longer pretreated PTW, the biofilm was a homogeneous mass, where isolated height differences were clearly visible (Figure 4E). There were no cell detachments recognizable, but a uniformly connected matrix. This continues with increasing pretreatment times of the PTW and the biofilms (Figure 4F–J). The 3D images of the control biofilm showed a height of up to 40 µm. There were large cell clusters on the top of the biofilm, which appeared like cell clouds in the 3D image. The compact cell matrix, however, reached a height of about 25 µm (Supplementary: control .wmv). After 1 min of treatment time with the 100 s pretreated PTW, a clear change in the morphology of the biofilm could be observed. A much more relaxed structure could be seen in comparison to the control biofilm as well as a reduced height of approximately 15 µm (Supplementary: 100 s 1 min .wmv). After 1 min of treatment time with the 900 s pretreated PTW, the respective biofilms strongly differed from the control biofilms and a flat, homogeneous structure of dead cells became visible. The biofilm had a height of only 1 µm and had prominent sites with gaps within its structure. The effects of the treatment with PTW were clearly visible (Supplementary: 900 s 1 min .wmv).

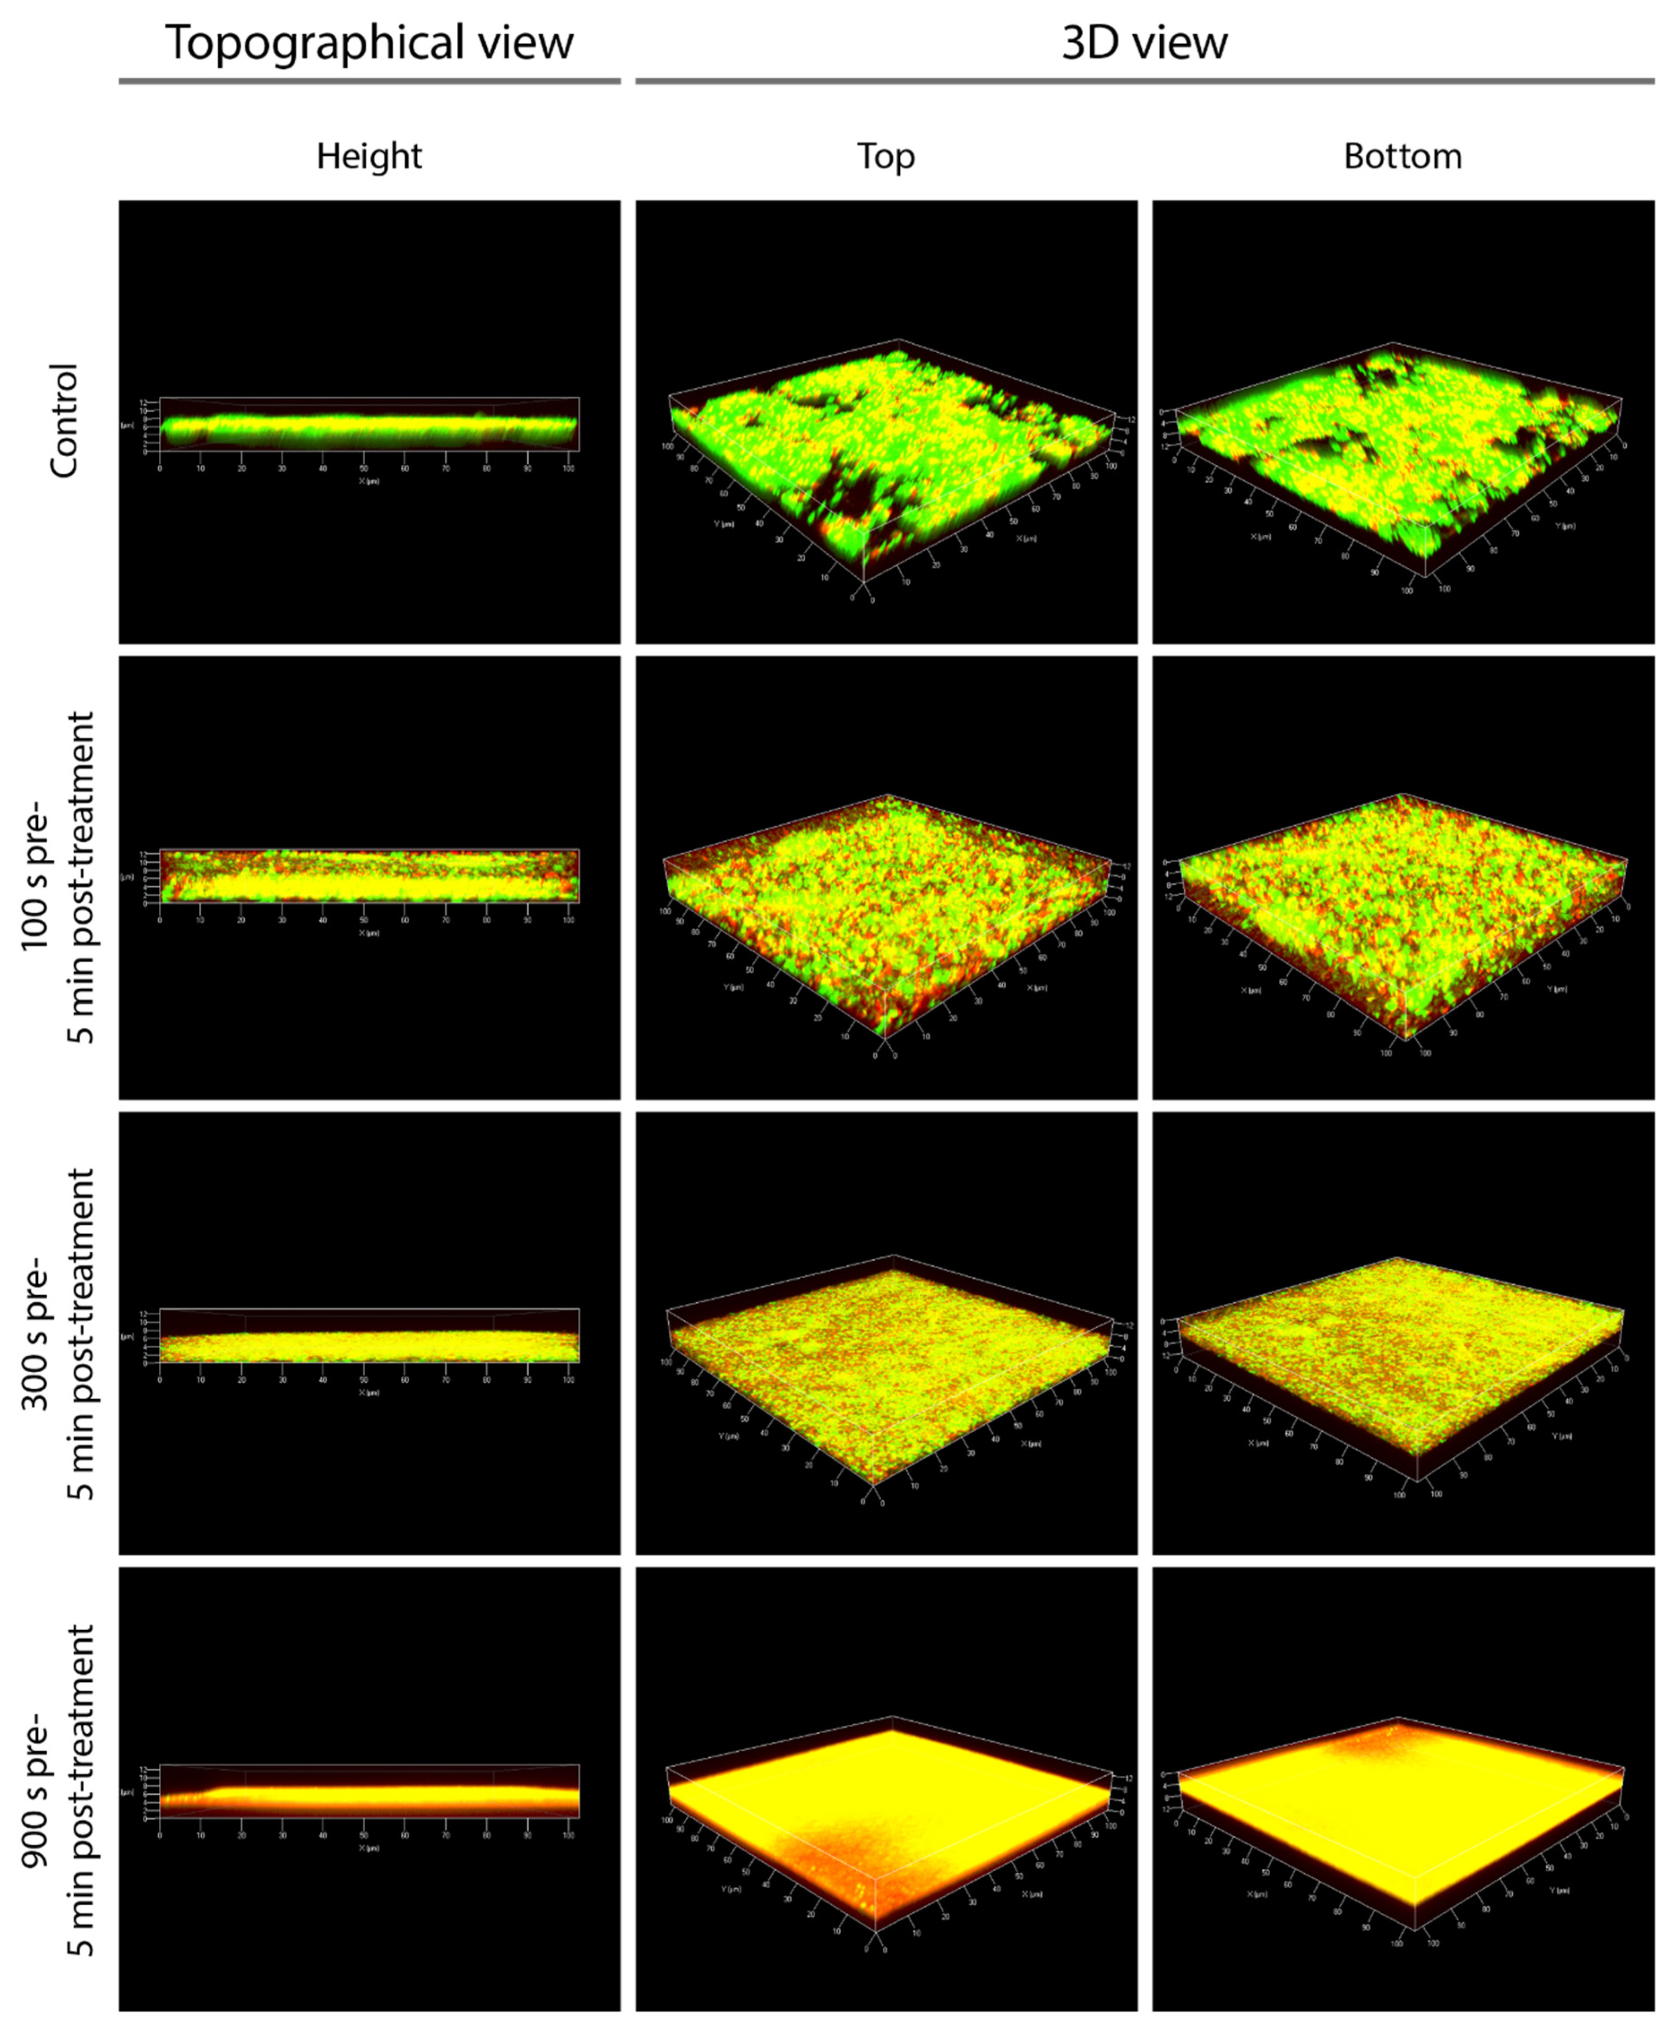
3.5. CLSM Confirms the Detachment of Cell Layers from the Surface of Biofilms

The control biofilms showed a fragmentary structure with a height of approximately 8 µm (Figure 5). They were composed of several visible cell layers, dominated by living (green) cells and only a few dead (red) cells were detectable. In contrast, 100 s/5 min plasma treatment showed a clear change in the living/death ratio. Much more dead cells and partially damaged (yellow) cells were visible. The homogenous biofilm had an approximate height of 12 µm (Figure 5). After 300 s/5 min, a clear change in height was noticeable. The cells appeared planar and heterogeneous (Figure 5). The number of partially damaged cells (yellow) increased significantly compared to the 100 s/5 min treatment. After 900 s/5 min, no living cells were detected. The surface of the biofilm was almost completely covered by partially damaged cells. Dead cells were increasingly visible on the edges as well as in the deeper layers. The biofilm had a planar shape and a height of approximately 5 µm during these treatment times (Figure 5).

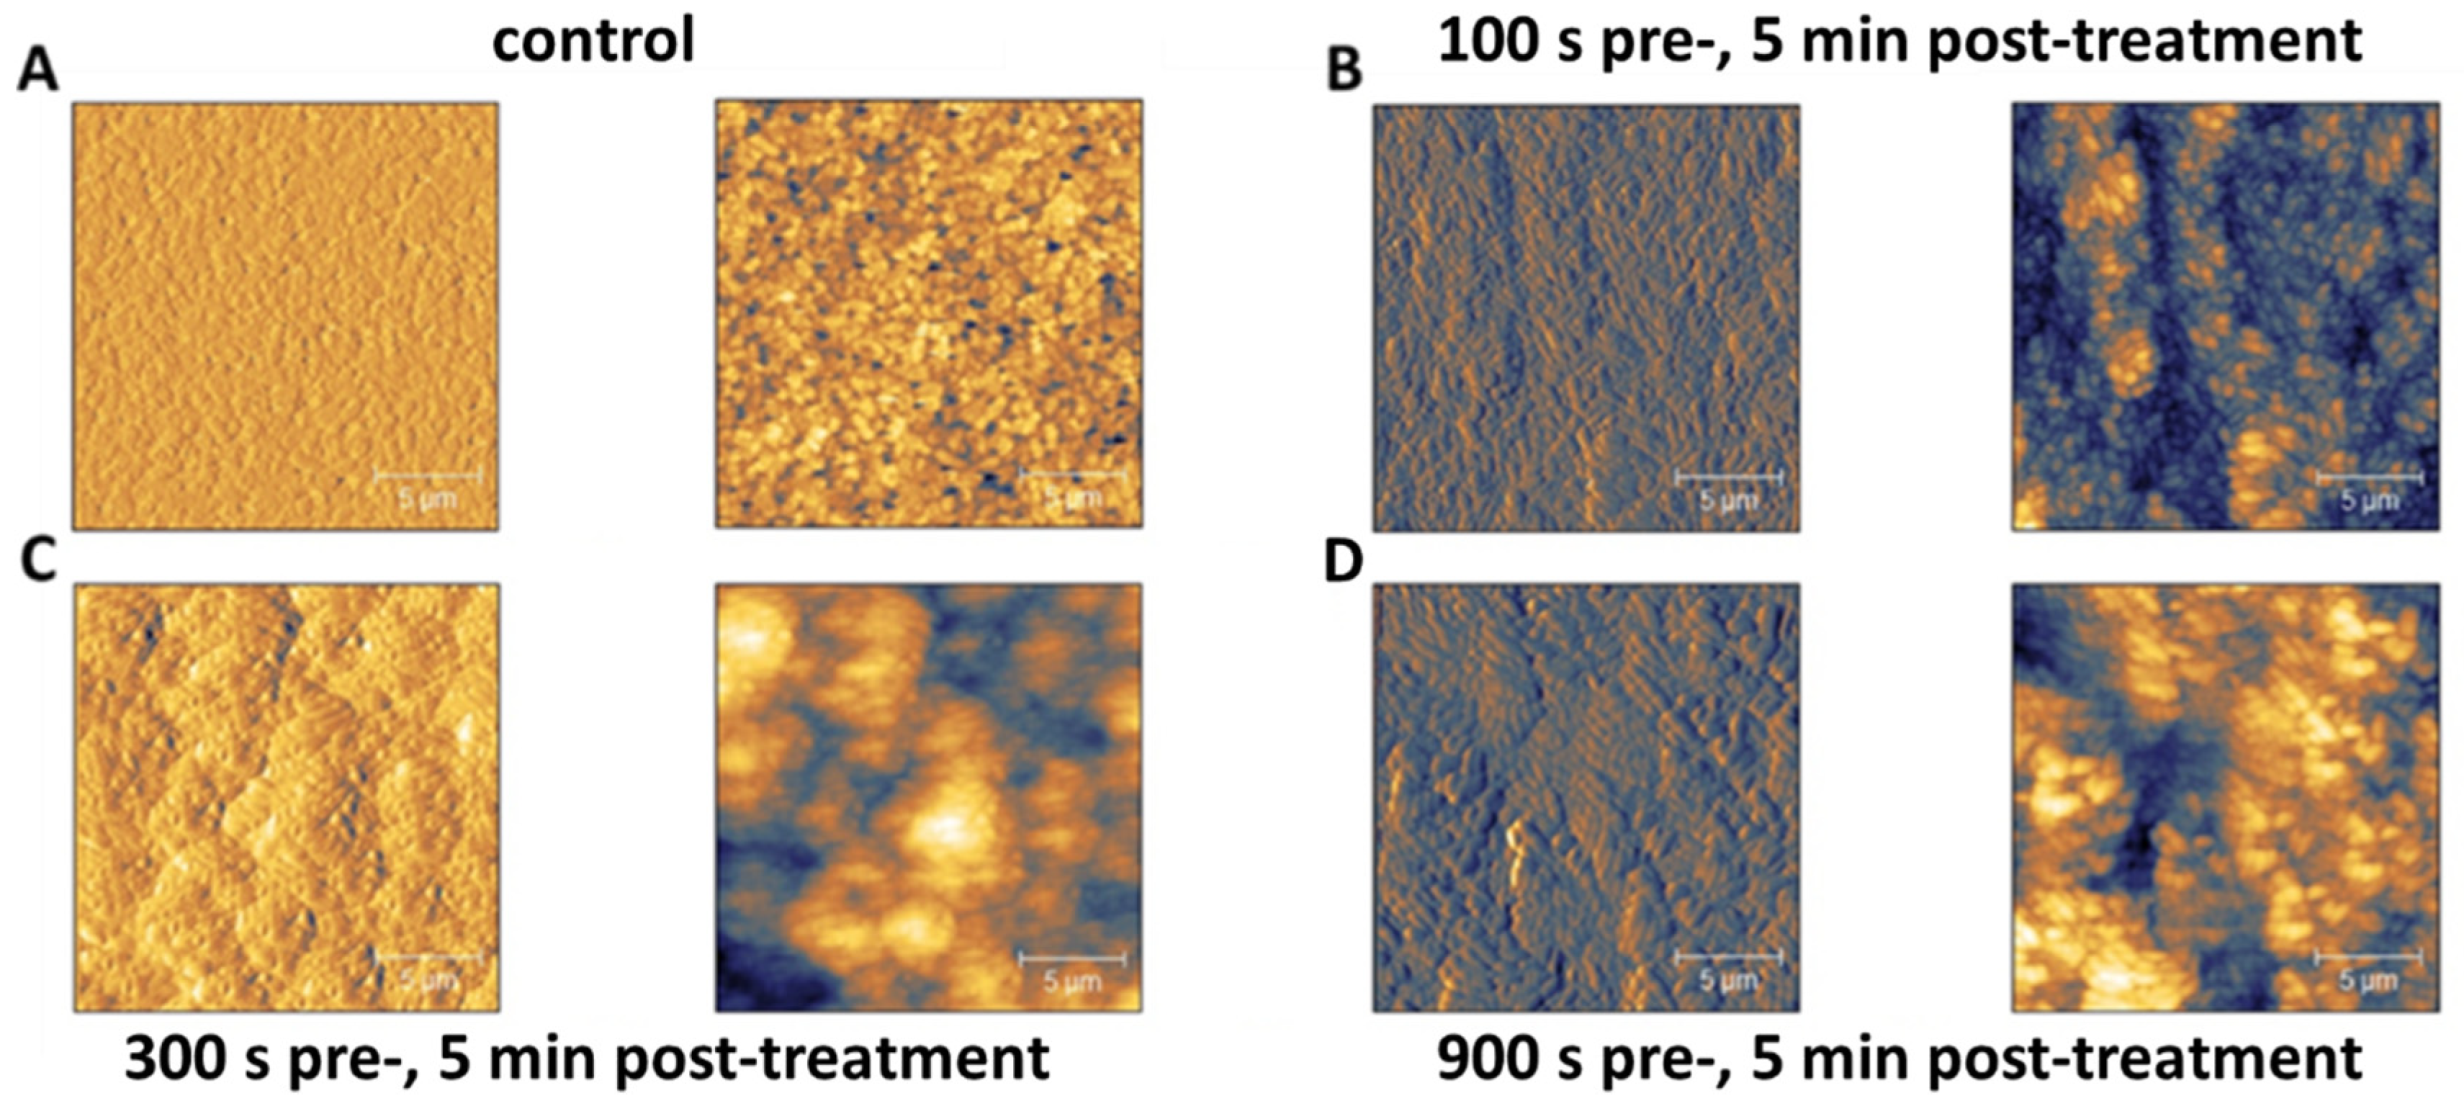
3.6. Enhanced Clustering of Cells and Modification of Physical-Mechanical Properties after PTW Treatment Visible in AFM

At first glance, barely any significant morphological changes in the cells of the biofilm after PTW treatment were detected (Figure 6). Nevertheless, the error images showed an increasing tendency of the cells to form clusters with increasing treatment time (Figure 6B–D). Local hot spots of cell accumulations occur, which increase the topographic gaps within the biofilm. In addition, the control biofilms were much more difficult to measure than the treated biofilms. The deflection values of the cantilever showed a stronger deflection when measuring the control biofilms, indicating changes in the plasticity of the biofilm during the treatment. There are no obvious morphological changes in the cells visible (Figure 6A).

4. Discussion

Application of plasma in food industry is becoming increasingly important. Due to the promising application possibilities of PGCs, several studies are currently in progress, which can be summarized under the collective term “Plasma for Food” [33,34,35]. This term covers a broad spectrum from pre- and postharvest, up to the treatment of food with plasma or the packaging materials, in which the food is transported and stored, as well as the treatment of different surfaces which are important in the food production environment [36,37,38,39]. There are two particularly important aspects to get this new innovative method into practical use in the food industry. The first one is that the mechanisms leading to the inactivation of spoilage organisms by plasma treatment are clarified [40,41,42]. On the other hand, the plasma technology has to be further upscaled to huge product turnovers and consumption of industrial goods like water in order to meet the requirements of the food industry [43]. Therefore, it is important to identify the mechanisms of PGCs on microorganisms such as P. fluorescens that cause significant problems in the food industry.
P. fluorescens is able to form biofilms on surfaces relevant in the food industry like stainless steel, Polyethylene terephthalate (PET) or Teflon [8,44] as well as on the food products itself [5]. It produces fibrillary structures as a matrix for the biofilm. This matrix seems to be 2–3 times smaller than the actual bacteria packed in unknown extracellular structures [45]. These fibrillary structures were also macroscopically recognizable in comparison to biofilms of other species and seem to contribute to the physical properties of the biofilm. Due to these structures, the biofilms of P. fluorescens tend to be mechanically washed away during treatment with PTW. Because of the flow properties of PTW, larger cell masses were washed away during pipetting on the biofilm by these connected fibrillary structures. This, in turn, explains the large gaps in control biofilms in CLSM and fluorescence microcopy (Figure 4A and Figure 5A). The AFM images of the control biofilms also showed an extremely soft surface, resulting in the cantilever of the AFM hardly being able to generate images of the control biofilms and creating long stretched artifacts on the surface (Figure 6A). In comparison, the treated biofilms could be measured much more easily, which suggests a change in the plasticity of the cells may be due to the loss of fluidity. Macroscopically, the treated biofilms appeared whitish and dry, which is why they have changed their physical properties into a solid cell layer. As a result, as soon as enough force was applied to release the biofilm, the entire biofilm was detached as a uniform layer, whereas in control biofilms only biofilm segments were detached and the coarse cell mass remained. This behavior of the control biofilms is naturally favored, since the detached cell mass is transported from the site of infection to other areas, e.g., during manifestation in a living organism like humans, in order to recolonize the new areas [46,47,48,49]. This happens in the same way in industrial plants. As an equivalent to the blood flow in living organisms, the wash water in the production plant is used, which removes biofilm mass and transports the biofilm particles to other areas of the facility, where it leads to new biofilm colonization [50,51].
This study showed a clear effect of PTW on the P. fluorescens biofilms. While at 100 s pretreatment even a positive effect on the metabolism of the cells was visible, after 300 s, clearly negative effects were visible in the CFU, fluorescence and XTT assay. Since reactive oxygen and nitrogen species (RONS) in low concentrations are also needed for cell signaling, this could be an explanation for the positive effect of the 100 s PTW [52,53,54]. This again illustrates how important it is to know the optimal process window, in which biofilms have to be treated with PTW. Fluorescence microscopy also shows a rather fluffy control biofilm where individual areas are already detached by the shear forces of the buffer. This is an effect of the rapid growth rate of P. fluorescens biofilms, which leads to a detachment of smaller areas of the biofilm and a rather soft biofilm surface [55]. Already after 100 s, a clear influence on the cells of the biofilm was evident. However, no clear change in the plasticity of the biofilm caused by PTW treatment seems to be evident. After 300 s pretreatment of the PTW, however, the formation of a coherent layer of the biofilm was visible, which consists mainly of dead cells on the surface of this layer. Finally, 900 s pretreatment with 5 min post-treatment showed a thick coherent biofilm mass consisting of dead cells on the surface of the layer. This clearly illustrates the influence of PTW on the physical properties of the biofilm. The AFM images also showed the increased clustering of the cells compared to the control biofilm. These clusters or hot spots could be understood as a resistance mechanism, in which cells wrap other biofilm cells to protect them from external stress influences. Regarding the application of PTW in industrial applications, the results shown in this publication are very promising, as sufficient killing on several microbiological scales has been demonstrated, as well as new and promising mechanisms of biofilm removal from the overgrown surface. Further experiments to investigate the nature of plasma-treated biofilms and possible reduced resistance to fluid shear forces or reduced adhesion to overgrown surfaces could be the decisive evidence to favor plasma treatments in the food industry over conventional decontamination processes.

5. Conclusions

The mechanisms of action by PTW are still largely unknown. This work provides crucial new insights and approaches into the mechanisms of decontamination, inactivation, and killing of bacterial contamination. The effect of different treatment parameters and the possible influence on decontamination processes in the food industry was examined. The PTW treatment of P. fluorescens biofilms led to the extensive killing of the biofilm cells. Mechanistically, the cells fuse into a uniform layer, which prevents the detachment of individual biofilm fragments and thus further contamination of industrial facilities. Further experiments should focus on the detachment processes of the dead cell mass in order to establish standardized parameters to significantly remove biofilms by upscaling the fluid shear forces of the PTW during the flushing processes of the facilities.

Supplementary Materials

The following are available online at https://www.mdpi.com/2076-3417/10/9/3118/s1, Video S1: 100 s 1 min .wmv; Video S2: 900 s 1 min .wmv; Video S3: control .wmv.

Author Contributions

Conceptualization, O.H., U.S., K.R. and J.E.; methodology, O.H., K.R. and J.E.; validation, O.H., K.R. and J.E.; formal analysis, O.H., E.F. and S.B.; investigation, O.H., V.I.P., E.F., S.B. and T.W.; resources, K.R., J.E. and S.B.; data curation, O.H.; writing—original draft preparation, O.H.; writing—review and editing, V.I.P., U.S., E.F., T.W., S.B., K.R. and J.E.; visualization, O.H., V.I.P., E.F., T.W. and S.B.; supervision, U.S.; project administration, K.R. and J.E.; funding acquisition, S.B. and K.R. All authors have read and agreed to the published version of the manuscript.

Funding

This research was funded by the DFG “Deutsche Forschungsgemeinschaft”, grant number CRC-TRR34; subproject A3 (Katharina Riedel, Viktoria Isabella Pauker). This research was also funded by the BMBF “German Federal Ministry of Education and Research, grant number 03Z22DN11 (Sander Bekeschus, Eric Freund). The APC was funded equally by the Leibniz Institute for Plasma Science and Technology (INP), and the Institute for Microbial Physiology and Molecular Biology (University of Greifswald).

Acknowledgments

We thank Katja Fricke from the Institute of Plasma Science and Technology (INP) for providing the AFM for the experiments.

Conflicts of Interest

The authors declare no conflict of interest.

References

  1. Mir, S.A.; Shah, M.A.; Mir, M.M. Understanding the Role of Plasma Technology in Food Industry. Food Bioprocess Technol. 2016, 9, 734–750. [Google Scholar] [CrossRef]
  2. Schnabel, U.; Handorf, O.; Yarova, K.; Zessin, B.; Zechlin, S.; Sydow, D.; Zellmer, E.; Stachowiak, J.; Andrasch, M.; Below, H.; et al. Plasma-Treated Air and Water-Assessment of Synergistic Antimicrobial Effects for Sanitation of Food Processing Surfaces and Environment. Foods 2019, 8, 55. [Google Scholar] [CrossRef] [PubMed] [Green Version]
  3. Handorf, O.; Below, H.; Schnabel, U.; Riedel, K.; Ehlbeck, J. Investigation of the chemical composition of plasma treated water by MidiPLexc and its antimicrobial effect on Listeria monocytogenes and Pseudomonas fluorescens monospecies suspension cultures. J. Phys. D Appl. Phys. 2020. [Google Scholar] [CrossRef]
  4. Schokker, E.P.; van Boekel, M.A.J.S. Kinetics of thermal inactivation of the extracellular proteinase from Pseudomonas fluorescens 22F: Influence of pH, calcium, and protein. J. Agric. Food Chem. 1999, 47, 1681–1686. [Google Scholar] [CrossRef] [PubMed]
  5. Schnabel, U.; Sydow, D.; Schlüter, O.; Andrasch, M.; Ehlbeck, J. Decontamination of Fresh-Cut Iceberg Lettuce and Fresh Mung Bean Sprouts by Non-Thermal Atmospheric Pressure Plasma Processed Water (PPW). Mod. Agric. Sci. Technol. 2015, 1, 23–39. [Google Scholar]
  6. Ma, R.N.; Yu, S.; Tian, Y.; Wang, K.L.; Sun, C.D.; Li, X.; Zhang, J.; Chen, K.S.; Fang, J. Effect of Non-Thermal Plasma-Activated Water on Fruit Decay and Quality in Postharvest Chinese Bayberries. Food Bioprocess Technol. 2016, 9, 1825–1834. [Google Scholar] [CrossRef]
  7. Schnabel, U.; Niquet, R.; Andrasch, M.; Jakobs, M.; Schlüter, O.; Katroschan, K.U.; Weltmann, K.D.; Ehlbeck, J. Broccoli: Antimicrobial efficacy and influences to sensory and storage properties by microwave plasma processed air (PPA) treatment. Plasma Med. 2017, 6, 375–388. [Google Scholar] [CrossRef]
  8. Schnabel, U.; Schmidt, C.; Stachowiak, J.; Bösel, A.; Andrasch, M.; Ehlbeck, J. Plasma processed air for biological decontamination of PET and fresh plant tissue. Plasma Process. Polym. 2018, 15, 1600057. [Google Scholar] [CrossRef]
  9. Yong, H.I.; Park, J.; Kim, H.J.; Jung, S.; Park, S.; Lee, H.J.; Choe, W.; Jo, C. An innovative curing process with plasma-treated water for production of loin ham and for its quality and safety. Plasma Process. Polym. 2018, 15, 1700050. [Google Scholar] [CrossRef]
  10. Schnabel, U.; Andrasch, M.; Stachowiak, J.; Weit, C.; Weihe, T.; Schmidt, C.; Muranyi, P.; Schlüter, O.; Ehlbeck, J. Sanitation of fresh-cut endive lettuce by plasma processed tap water (PPtW)–Up-scaling to industrial level. Innov. Food Sci. Emerg. Technol. 2019, 53, 45–55. [Google Scholar] [CrossRef]
  11. Xiang, Q.S.; Liu, X.F.; Liu, S.N.; Ma, Y.F.; Xu, C.Q.; Bai, Y.H. Effect of plasma-activated water on microbial quality and physicochemical characteristics of mung bean sprouts. Innov. Food Sci. Emerg. Technol. 2019, 52, 49–56. [Google Scholar] [CrossRef]
  12. Kramer, A.; Bekeschus, S.; Matthes, R.; Bender, C.; Stope, M.B.; Napp, M.; Lademann, O.; Lademann, J.; Weltmann, K.D.; Schauer, F. Cold Physical Plasmas in the Field of Hygiene-Relevance, Significance, and Future Applications. Plasma Process. Polym. 2015, 12, 1410–1422. [Google Scholar] [CrossRef]
  13. Bekeschus, S.; Schmidt, A.; Weltmann, K.D.; Woedtke, T. The plasma jet kINPen—A powerful tool for wound healing. Clin. Plasma Med. 2016, 4, 19–28. [Google Scholar] [CrossRef]
  14. Rhodes, M.E. The Characterization of Pseudomonas-Fluorescens. J. Gen. Microbiol. 1959, 21, 221–263. [Google Scholar] [CrossRef] [Green Version]
  15. Rajmohan, S.; Dodd, C.E.R.; Waites, W.M. Enzymes from isolates of Pseudomonas fluorescens involved in food spoilage. J. Appl. Microbiol. 2002, 93, 205–213. [Google Scholar] [CrossRef] [PubMed]
  16. Wei, B.; Huang, T.; Dalwadi, H.; Sutton, C.L.; Bruckner, D.; Braun, J. Pseudomonas fluorescens encodes the Crohn’s disease-associated I2 sequence and T-cell superantigen. Infect. Immun. 2002, 70, 6567–6575. [Google Scholar] [CrossRef] [Green Version]
  17. Alsohim, A.S.; Taylor, T.B.; Barrett, G.A.; Gallie, J.; Zhang, X.X.; Altamirano-Junqueira, A.E.; Johnson, L.J.; Rainey, P.B.; Jackson, R.W. The biosurfactant viscosin produced by Pseudomonas fluorescens SBW25 aids spreading motility and plant growth promotion. Environ. Microbiol. 2014, 16, 2267–2281. [Google Scholar] [CrossRef]
  18. Martin, N.H.; Murphy, S.C.; Ralyea, R.D.; Wiedmann, M.; Boor, K.J. When cheese gets the blues: Pseudomonas fluorescens as the causative agent of cheese spoilage. J. Dairy Sci. 2011, 94, 3176–3183. [Google Scholar] [CrossRef]
  19. Miller, A.; Scanlan, R.A.; Lee, J.S.; Libbey, L.M. Volatile Compounds Produced in Sterile Fish Muscle (Sebastes-Melanops) by Pseudomonas-Putrefaciens, Pseudomonas-Fluorescens, and an Achromobacter Species. Appl. Microbiol. 1973, 26, 18–21. [Google Scholar] [CrossRef] [Green Version]
  20. Ternstrom, A.; Lindberg, A.M.; Molin, G. Classification of the Spoilage Flora of Raw and Pasteurized Bovine-Milk, with Special Reference to Pseudomonas and Bacillus. J. Appl. Bacteriol. 1993, 75, 25–34. [Google Scholar] [CrossRef]
  21. Ouattara, B.; Simard, R.E.; Holley, R.A.; Piette, G.J.P.; Begin, A. Antibacterial activity of selected fatty acids and essential oils against six meat spoilage organisms. Int. J. Food Microbiol. 1997, 37, 155–162. [Google Scholar] [CrossRef]
  22. Costerton, J.W.; Cheng, K.J.; Geesey, G.G.; Ladd, T.I.; Nickel, J.C.; Dasgupta, M.; Marrie, T.J. Bacterial Biofilms in Nature and Disease. Annu. Rev. Microbiol. 1987, 41, 435–464. [Google Scholar] [CrossRef] [PubMed]
  23. Allison, D.G.; Sutherland, I.W. The role of exopolysaccharides in adhesion of freshwater. Microbiology 1987, 133, 1319–1327. [Google Scholar] [CrossRef] [Green Version]
  24. Flemming, H.C.; Neu, T.R.; Wozniak, D.J. The EPS matrix: The “House of Biofilm cells”. J. Bacteriol. 2007, 189, 7945–7947. [Google Scholar] [CrossRef] [Green Version]
  25. Sun, Y.Y.; Chi, H.; Sun, L. Pseudomonas fluorescens Filamentous Hemagglutinin, an Iron-Regulated Protein, Is an Important Virulence Factor that Modulates Bacterial Pathogenicity. Front. Microbiol. 2016, 7, 1320. [Google Scholar] [CrossRef] [Green Version]
  26. O’Toole, G.A.; Kolter, R. Initiation of biofilm formation in Pseudomonas fluorescens WCS365 proceeds via multiple, convergent signalling pathways: A genetic analysis. Mol. Microbiol. 1998, 28, 449–461. [Google Scholar] [CrossRef]
  27. Allison, D.G.; Ruiz, B.; SanJose, C.; Jaspe, A.; Gilbert, P. Extracellular products as mediators of the formation and detachment of Pseudomonas fluorescens biofilms. Fems Microbiol. Lett. 1998, 167, 179–184. [Google Scholar] [CrossRef]
  28. Willcock, L.; Holah, J.; Allison, D.G.; Gilbert, P. Steady-state biofilm and dispersal. Biofilms Community Interact. Control 1997, 23–31. [Google Scholar]
  29. Handorf, O.; Weihe, T.; Bekeschus, S.; Graf, A.C.; Schnabel, U.; Riedel, K.; Ehlbeck, J. Non-thermal plasma jet treatment negatively affects viability and structure of C. albicans SC5314 biofilms. Appl. Environ. Microbiol. 2018, 84, e01163-18. [Google Scholar] [CrossRef] [Green Version]
  30. Handorf, O.; Schnabel, U.; Bösel, A.; Weihe, T.; Bekeschus, S.; Graf, A.C.; Riedel, K.; Ehlbeck, J. Antimicrobial effects of microwave-induced plasma torch (MiniMIP) treatment on Candida albicans biofilms. Microb. Biotechnol. 2019, 12, 1034–1048. [Google Scholar] [CrossRef] [Green Version]
  31. Gränicher, W.H.H. Messung Beendet-Was Nun? Hochschulverlag AG der ETH Zürich: Zurich, Switzerland, 1994; Volume 6, pp. 6–9. [Google Scholar]
  32. Scudiero, D.A.; Shoemaker, R.H.; Paull, K.D.; Monks, A.; Tierney, S.; Nofziger, T.H.; Currens, M.J.; Seniff, D.; Boyd, M.R. Evaluation of a Soluble Tetrazolium Formazan Assay for Cell-Growth and Drug Sensitivity in Culture Using Human and Other Tumor-Cell Lines. Cancer Res. 1988, 48, 4827–4833. [Google Scholar]
  33. Schlüter, O.; Ehlbeck, J.; Hertel, C.; Habermeyer, M.; Roth, A.; Engel, K.H.; Holzhauser, T.; Knorr, D.; Eisenbrand, G. Opinion on the use of plasma processes for treatment of foods. Mol. Nutr. Food Res. 2013, 57, 920–927. [Google Scholar] [CrossRef] [PubMed]
  34. Bourke, P.; Ziuzina, D.; Boehm, D.; Cullen, P.J.; Keener, K. The Potential of Cold Plasma for Safe and Sustainable Food Production. Trends Biotechnol. 2018, 36, 615–626. [Google Scholar] [CrossRef] [PubMed] [Green Version]
  35. Schnabel, U.; Niquet, R.; Krohmann, U.; Winter, J.; Schlüter, O.; Weltmann, K.D.; Ehlbeck, J. Decontamination of Microbiologically Contaminated Specimen by Direct and Indirect Plasma Treatment. Plasma Process. Polym. 2012, 9, 569–575. [Google Scholar] [CrossRef]
  36. Pankaj, S.K.; Bueno-Ferrer, C.; Misra, N.N.; Milosavljevic, V.; O’Donnell, C.P.; Bourke, P.; Keener, K.M.; Cullen, P.J. Applications of cold plasma technology in food packaging. Trends Food Sci. Technol. 2014, 35, 5–17. [Google Scholar] [CrossRef]
  37. Ziuzina, D.; Petil, S.; Cullen, P.J.; Keener, K.M.; Bourke, P. Atmospheric cold plasma inactivation of Escherichia coli, Salmonella enterica serovar Typhimurium and Listeria monocytogenes inoculated on fresh produce. Food Microbiol. 2014, 42, 109–116. [Google Scholar] [CrossRef] [Green Version]
  38. Misra, N.N.; Patil, S.; Moiseev, T.; Bourke, P.; Mosnier, J.P.; Keener, K.M.; Cullen, P.J. In-package atmospheric pressure cold plasma treatment of strawberries (vol 125, pg 131, 2014). J. Food Eng. 2015, 161, 95. [Google Scholar] [CrossRef]
  39. Oehmigen, K.; Winter, J.; Hähnel, M.; Wilke, C.; Brandenburg, R.; Weltmann, K.D.; von Woedtke, T. Estimation of Possible Mechanisms of Escherichia coli Inactivation by Plasma Treated Sodium Chloride Solution. Plasma Process. Polym. 2011, 8, 904–913. [Google Scholar] [CrossRef]
  40. Van Gils, C.A.J.; Hofmann, S.; Boekema, B.K.H.L.; Brandenburg, R.; Bruggeman, P.J. Mechanisms of bacterial inactivation in the liquid phase induced by a remote RF cold atmospheric pressure plasma jet. J. Phys. D Appl. Phys. 2013, 46, 175203. [Google Scholar] [CrossRef]
  41. Dolezalova, E.; Lukes, P. Membrane damage and active but nonculturable state in liquid cultures of Escherichia coli treated with an atmospheric pressure plasma jet. Bioelectrochemistry 2015, 103, 7–14. [Google Scholar] [CrossRef] [PubMed]
  42. Andrasch, M.; Stachowiak, J.; Schlüter, O.; Schnabel, U.; Ehlbeck, J. Scale-up to pilot plant dimensions of plasma processed water generation for fresh-cut lettuce treatment. Food Packag. Shelf Life 2017, 14, 40–45. [Google Scholar] [CrossRef]
  43. Van Houdt, R.; Michiels, C. Biofilm formation and the food industry, a focus on the bacterial outer surface. J. Appl. Microbiol. 2010, 109, 1117–1131. [Google Scholar] [CrossRef] [PubMed] [Green Version]
  44. Baum, M.M.; Kainovic, A.; O’Keeffe, T.; Pandita, R.; McDonald, K.; Wu, S.; Webster, P. Characterization of structures in biofilms formed by a Pseudomonas fluorescens isolated from soil. BMC Microbiol. 2009, 9, 103. [Google Scholar] [CrossRef] [PubMed] [Green Version]
  45. Donlan, R.M. Biofilms: Microbial life on surfaces. Emerg. Infect. Dis. 2002, 8, 881–890. [Google Scholar] [CrossRef]
  46. Choi, Y.C.; Morgenroth, E. Monitoring biofilm detachment under dynamic changes in shear stress using laser-based particle size analysis and mass fractionation. Water Sci. Technol. 2003, 47, 69–76. [Google Scholar] [CrossRef]
  47. Hall-Stoodley, L.; Costerton, J.W.; Stoodley, P. Bacterial biofilms: From the natural environment to infectious diseases. Nat. Rev. Microbiol. 2004, 2, 95–108. [Google Scholar] [CrossRef]
  48. Kaplan, J.B. Biofilm Dispersal: Mechanisms, Clinical Implications, and Potential Therapeutic Uses. J. Dent. Res. 2010, 89, 205–218. [Google Scholar] [CrossRef] [Green Version]
  49. Gibson, H.; Taylor, J.H.; Hall, K.E.; Holah, J.T. Effectiveness of cleaning techniques used in the food industry in terms of the removal of bacterial biofilms. J. Appl. Microbiol. 1999, 87, 41–48. [Google Scholar] [CrossRef]
  50. Chmielewski, R.A.N.; Frank, J.F. Biofilm Formation and Control in Food Processing Facilities. Compr. Rev. Food Sci. Food Saf. 2003, 2, 22–32. [Google Scholar] [CrossRef]
  51. Myszka, K.; Czaczyk, K. Bacterial Biofilms on Food Contact Surfaces—A Review. Polish J. Food Nutr. Sci. 2011, 61, 173–180. [Google Scholar] [CrossRef] [Green Version]
  52. Magder, S. Reactive oxygen species: Toxic molecules or spark of life? Crit. Care 2006, 10, 208. [Google Scholar] [CrossRef] [PubMed] [Green Version]
  53. Kumar, A.; Wu, H.; Collier-Hyams, L.S.; Hansen, J.M.; Li, T.; Yamoah, K.; Pan, Z.Q.; Jones, D.P.; Neish, A.S. Commensal bacteria modulate cullin-dependent signaling via generation of reactive oxygen species. EMBO J. 2007, 26, 4457–4466. [Google Scholar] [CrossRef] [PubMed] [Green Version]
  54. Weidinger, A.; Kozlov, A.V. Biological Activities of Reactive Oxygen and Nitrogen Species: Oxidative Stress versus Signal Transduction. Biomolecules 2015, 5, 472–484. [Google Scholar] [CrossRef] [Green Version]
  55. Picioreanu, C.; van Loosdrecht, M.C.M.; Heijnen, J.J. Two-dimensional model of biofilm detachment caused by internal stress from liquid flow. Biotechnol. Bioeng. 2001, 72, 205–218. [Google Scholar] [CrossRef]
Figure 1. The graph show the reduction in the colony-forming units (CFUs) after plasma treatment of the biofilms. The grouped bar chart show at the x-axis the water treatment time with the Midiplexc (pretreatment time) and the different bars show the biofilm treatment time with the plasma-treated water (PTW) (post-treatment time). The experiment was performed in four independent experiments with three technical replicates each.
Applsci 10 03118 g001
Figure 2. The graph shows the reduction in the ratio G/R after treatment of the biofilms with the PTW. The grouped bar chart show at the x-axis the water treatment time with the Midiplexc (pretreatment time) and the different bars show the biofilm treatment time with the PTW (post-treatment time). The experiment was performed in four independent experiments with three technical replicates each.
Applsci 10 03118 g002
Figure 3. The graph shows the reduction in the metabolic activity of the biofilm cells after treatment of the biofilms with the PTW. The grouped bar chart show at the x-axis the water treatment time with the Midiplexc (pretreatment time) and the different bars show the biofilm treatment time with the PTW (post-treatment time). The experiment is performed in four independent experiments with three technical replicates each.
Applsci 10 03118 g003
Figure 4. The images show inverse footage of the biofilms. The pretreatment time defines the time period in which the water came into contact with the plasma gas. The post-treatment time represents the period of time where the PTW came into contact with the biofilm. The biofilms are stained with SYTO9 (green) for living cells and propidium iodide (red) for dead cells. (A) Control biofilm (B) 100 s pretreatment, 1 min post-treatment (C) 100 s pretreatment time, 3 min post-treatment time (D) 100 s pretreatment, 5 min post-treatment (E) 300 s pretreatment, 1 min post-treatment (F) 300 s pretreatment, 3 min post-treatment (G) 300 s pretreatment, 5 min post-treatment (H) 900 s pretreatment, 1 min post-treatment (I) 900 s pretreatment, 3 min post-treatment (J) 900 s pretreatment, 5 min post-treatment.
Applsci 10 03118 g004
Figure 5. The images show P. fluorescens biofilms with and without treatment with plasma-treated water (PTW). Left panels show a topographical view of the biofilm layer (height view of the biofilms in µm). Central and right panels show 3D images with a top and a bottom view of the biofilms, respectively. The pretreatment time is the treatment time of the water by the plasma source (MidiPLexc) and the post-treatment time is the contact time of the PTW with the biofilm. For each biofilm, an area of 100 × 100 µm is visualized.
Applsci 10 03118 g005
Figure 6. Atomic force microscopy (AFM) images of P. fluorescens biofilms. Left) topographical images right) error images. The pretreatment time defines the time period in which the water came into contact with the plasma gas. The post-treatment time represents the period of time, where the PTW came into contact with the biofilm. (A) Control biofilm (B) 100 s pretreatment, 5 min post-treatment (C) 300 s pretreatment, 5 min post-treatment (D) 900 s pretreatment, 5 min post-treatment.
Applsci 10 03118 g006

