Abstract
Inkjet printing technology is widely used in the manufacture of conformal structures, such as load-bearing antennas or frequency-selective surface radomes. It is particularly promising for preparing conductive patterns on non-developable surfaces. Existing printing technologies employ a single nozzle and a five-axis linkage technique for printing, which is time-consuming. In this study, a conformal plane printing technology based on the arrayed nozzle was developed to prepare conductive patterns on a non-developable surface. The technique actualizes fast printing of passive circuits on a conformal surface, such as a microstrip antenna. Compared to printing techniques employing a single nozzle, the proposed method greatly improves the printing efficiency on conformal surfaces. Specifically, we first developed a model for the driver waveforms and the printing injection parameters via simulation. Subsequently, the accuracy of the computational fluid dynamic simulation results was validated by comparing them with the experimental measurements of droplet trajectory captured using a camera. Next, a droplet spreading model was established, considering energy conservation principles. Finally, a conformal surface printing technology using arrayed nozzles was developed based on the injection parameter and droplet spreading models. The effectiveness and feasibility of the proposed printing method were further validated via simulation and experimental tests of return loss.
1. Introduction
Conformal array technology is important in the development of antennas [1]. Conformal antenna arrays comprise a collection of antenna units that conform to the shape of the carrier’s surface [2]. These array antennas not only increase the receiver’s surface area and reduce the aerodynamic drag of the antenna system, but also provide a series of other advantages that planar arrays lack, such as reduction of size as well as physical components required to tether conventional planar array antennas [3,4].
Conventional antenna structures, which have satisfactory electrical performance, can be fabricated via simple conventional manufacturing approaches. However, fabricating conformal antennas require more complex manufacturing methods [5,6]. Some researchers [7,8] have successfully fabricated microstrip antennas on spherical surfaces as well as arbitrary surfaces using photolithography. However, photolithography is expensive. In contrast, microdroplet inkjet [9] printing has become a promising solution [10], with lower cost and high efficiency [11]. This printing technology has been investigated and applied widely [12]. For example, some researchers [13] printed electric circuits on conformal 3D structure using liquid metal. Other researchers [14] were able to print RFID (Radio Frequency Identification) antenna on developable surfaces such as cylindrical surfaces. In other studies, researchers were able to print electric circuits on complex surfaces using the transfer [15] printing technology or flexible electronic [16,17,18,19] printing technology. Researchers at MIT [20] developed a method to print a frequency-selective conformal surface on spherical surfaces. The 3D printing company Neotech AMT GmbH (http://www.neotech-amt.com/), Germany, developed an inkjet printer with a single nozzle installed on a five-axis motion system. By controlling the motion of the nozzle and the workpiece with the five-axis linkage technique, their printer was able to print RFID or microstrip antenna on an arbitrary surface.
However, all the aforementioned methods for fabricating conformal antennas exhibit several drawbacks [21], including high cost, low efficiency, and stringent printing conditions [22,23]. When using a single piezoelectric nozzle [24,25], a complex spatial motion algorithm is required to print antennas on a conformal surface [26]. Arrayed nozzles have already been widely used in planographic printing. The company Nano Dimension (https://www.nano-di.com/) has developed a device, DragonFly LDM, to print 3D integrated circuits using arrayed nozzles. However, the printing mode is still based on planographic printing. Currently, there is no efficient and economical conformal surface printing technology based on an array of nozzles.
A piezoelectric nozzle array can allow hundreds of integrated nozzles to operate simultaneously. Thus, it only takes a few seconds to print a planar conductive pattern. Compared with the printer using a single piezoelectric nozzle, the proposed method can achieve the same level of accuracy but with ~100× higher efficiency when performing planographic printing.
In ideal conditions, one can ensure the jetting trajectory from a single nozzle to approach normally to the surface plane at the droplet contact point. However, when using the arrayed nozzle, only the contact points of the droplets on the surface will fall on the jet trajectory, while the collision direction of the droplet may not be vertical to the substrate. Therefore, there exists a systematic error when performing planographic printing on a curved surface using an arrayed nozzle.
Practically, when the arrayed nozzle is separated from the substrate by a certain distance, the landing point of the droplet will deviate from the preset inkjet coordinate owing to the air medium. Simultaneously, because the substrate has a conformal surface, the droplet will land from different heights from the nozzles. Therefore, gaps may form in the printing pattern, which severely affects the electric performance. Owing to these factors, printing an antenna on a conformal curved surface using an arrayed nozzle is still a great challenge.
In this study, we experimentally investigated the problems with the deposition of multiple microdroplets on a conformal surface and developed an arrayed nozzle-based conformal printing model to simulate the droplet deposition phenomenon on a conformal surface. These findings provide theoretical references to the selection of processing parameters in conformal surface printing using an arrayed nozzle. Furthermore, the printing parameters of the arrayed nozzle and their relationship with the line width on the conformal surface are derived considering energy conservation. Finally, a droplet spreading model was developed in this study for curved surfaces. These results provide theoretical references as well as directions to further improve the printing accuracy.
2. Experimental Method
2.1. Experimental Platform
Figure 1 shows the prototype five-axis microdroplet inkjet printing device that we developed independently in this study.
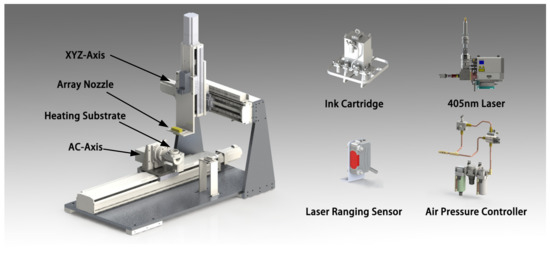
Figure 1.
Print prototype mechanism diagram.
The prototype device consisted of a five-axis motion system (including XYZAC axes, where the XYZ axes were installed using grating scales with an accuracy of ; the repetitive positioning accuracy was , and the AC axes were installed using a 2048 linear decoder with a repetitive positioning accuracy of ), two sets of nozzle arrays, a heating plate, a laser curing system, and a control system.
The remaining components included the following: Ink cartridge, which stored nanosilver ink and supplied it to the nozzle; 405 nm laser, which cured or sintered the nanosilver ink or the conductive silver pattern; laser ranging sensor, which measured the distance between the nozzle and the substrate; and pneumatic system, which provided a negative pressure to the nozzle that prevented the ink from flowing out of the nozzle by gravity.
2.2. Experimental Materials
The commercial conductive nanosilver ink CON-INK550 developed by BroadTeko company was used in the experiment. This ink had a silver content of 40%, silver powder average diameter in the range of 45–55 nm, a viscosity of = 8 cP, a sheet resistance of , an adhesion of level 0, a hardness of 2 h, surface tension of = , and a density of .
The commercial Ricoh GH2220 nozzle was used in our piezoelectric nozzle array. Each single nozzle had a printing resolution of 300 DPI, a diameter of , and a printing width of 23.3 mm. A total of 384 nozzles were used in the array with an internozzle spacing of 0.931 mm. The minimal droplet volume during printing was . The maximum driving cycle of the nozzle was 24 kHz.
Matte photo papers were used as the substrate in the experiment. These papers were attached on the 3D printing conformal surface via hot pressing. The conformal surface was made from 3D printing using transparent resin.
2.3. Experiment Process
The experiments were performed at an ambient temperature of °C, a relative humidity of 45%, and a PM10 (particles with a diameter between 2.5 and 10 micrometers ) of 1–3.
The first step was to move the arrayed nozzle to the desired printing location. Thus, the relative position between the workpiece and the nozzle was adjusted by controlling the AC axes. During the printing process, the distance between the nozzle and the surface of the workpiece was ensured to be less than the preset maximum value by coordinating the laser ranging sensor with the 5-axis linkage system.
During the inkjet process, droplets were first sprayed from the arrayed nozzle by a piezoelectric actuator. These droplets were then deposited on the conformal substrate by heating. The temperature of the substrate was controlled at °C during the experiment with a precision of °C, in order to evaporate the solvent in the droplet and thereby realize the curing process. Due to the high jetting speed, the volume shrinkage of the droplets due to evaporation by heat when traveling in air was neglected. In addition, the solvent of the conductive silver ink was isopropanol, which has a boiling point of °C. Therefore, to prevent the droplet morphology from being affected by boiling during the precuring stage, the precuring temperature needed to be lower than the boiling temperature of the solvent. Simultaneously, the precuring temperature had a substantial impact on the boundary resolution of the printing ink. Considering all these factors, a series of trial tests were performed prior to the experiment, and the final experimental temperature was selected to be °C.
Subsequently, the location of the arrayed nozzle was adjusted in the XYZ axes until the printing area covered the entire surface of the workpiece. The traveling speed of the nozzle could be adjusted in the range of . The printing process is shown in Figure 2.
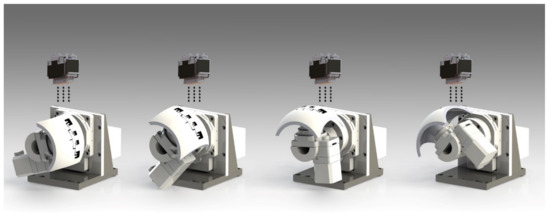
Figure 2.
Process for printing the conformal antenna based on arrayed nozzle.
Finally, the complete conductive pattern was formed by curing the nanosilver ink via laser scanning at a wavelength of 405 nm and a power of 1 W.
3. Results and Discussion
In this study, a theoretical model was developed first, followed by a CFD (Computational Fluid Dynamics) simulation to calculate the radius of the droplet after exiting the nozzle. The results were validated by comparing the simulation values with experimental measurements obtained using a camera. Furthermore, the maximum spreading radius of the droplet was calculated by considering energy conservation and validated from experimental observation under a microscope. Finally, the spreading radii of the droplets required on different conformal surfaces with different curvatures were calculated through the geometric model and validated from experimental measurements. The variables used in the model are shown in Table 1.

Table 1.
Parametric models and symbols.
The adjustable parameters in the experiment included the driving waveform of the piezoelectric nozzle, the printing traveling speed of the machine tool, the traveling distance of the droplet, the wettability of the substrate, and the contact angle. By changing these parameters, we were able to adjust the exiting diameter of the droplet , the droplet volume , the traveling speed of the droplet , the collision direction during falling , and the contact angle . All the parameters associated with the nanosilver ink were set to constant values and were maintained during the experiment.
3.1. Spread Radius Model
For the spread radius, we first built a model between the trapezoidal wave and droplet volume via numerical simulation. Subsequently, the model was validated by experimental observation through the camera. In the CFD simulation, the collision speed of the droplet and the droplet radius were adjusted by changing the driving signal of the piezoelectric actuator. In this study, the two-phase flow model of inkjet from the arrayed nozzle was developed based on the theoretical model of two-phase flow. When setting up the model, mass and momentum conservation are described by the Navier-Stokes equations. Because the fluid velocity is smaller than the speed of sound, both the ink and air are considered as incompressible.
The driving waveform of the piezoelectric nozzle is trapezoidal, as shown in Figure 3 below. This control signal was used to eject the ink. In the same period, as the duty cycle of the rising edge becomes smaller, the amount of the ejected ink increases.
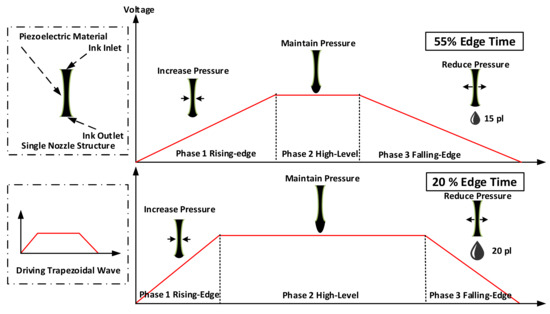
Figure 3.
Effects of the nozzle structure based on simulations and on the different trapezoidal waves on the extruded droplets.
The simulation software used in this article was COMSOL5.4. The simulation results are explained below.
Fluid was considered as a rigid body in the simulation. To form the droplet, the fluid must overcome surface tension. With a high-flow speed, a droplet with the required volume will be able to form at the nozzle earlier. In addition, a larger momentum makes it easier to overcome the surface tension and therefore form a larger droplet. Conversely, with lower flow speeds, only a part of the fluid that is already outside the nozzle will be able to accumulate into a droplet. Therefore, the fluid will keep accumulating while overcoming the surface tension, therefore showing two different types of flow behaviors. In particular, only the fluid that has already reached the exit of the nozzle will be able to overcome the surface tension and form a droplet. The rest of the fluid will keep oscillating under the pressure wave and the surface tension until the kinetic energy is converted to the internal energy completely. As a consequence, the Figure 4 is obtained as the simulation result.
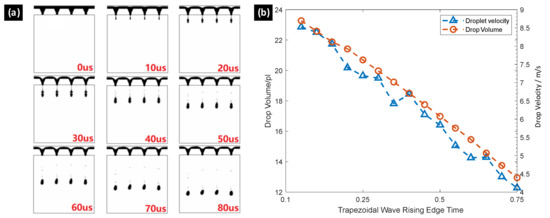
Figure 4.
(a) Flow behavior during the simulation process; (b) Simulation results show the impact of trapezoidal wave rising-edge duty cycle on the velocity and volume of the droplet.
In this study, by varying the rising-edge duty cycle of the trapezoidal wave, the droplet volume and initial velocity in the simulation were adjusted to be within 8–24 pL and within 4.75–8.21 m/s, respectively. With decreasing rising-edge duty cycle, more fluid volume is accumulated at the nozzle during the same amount of time, which yields a larger kinetic energy and a greater gravity effect. Therefore, it becomes easier for the fluid to overcome the surface tension and form the droplet. Thus, an increasing rising-edge duty cycle results in a slower velocity. The simulation results are validated by experimental measurements in this study. Specifically, the effectiveness of the simulation model is verified via observation through the camera during the experiment.
After confirming the effectiveness of the CFD model established in this study by experiment, we can then calculate in advance the initial velocity and diameter of the droplet as it leaves the nozzle. These values provide data support to calculating the maximum spreading radius of the droplet by considering energy conservation.
3.2. Droplet Spread Model on Conformal Surface
The ink properties used in this article can be maintained in a stable state on substrates at different angles, as shown in Figure 5 below. The experimental conditions were the following: the diameter of the droplet was between 50 and 160 μm, and the curvature of the curved substrate was 200 mm. We are not very concerned about the spreading process of the droplets but on the final spreading diameter of the droplets on the curved surface and the distances between the droplets. Following the experimental work, we inferred that the conformal surface spreading outcomes for the droplets were similar to the planar spreading outcomes because the diameter of the droplet was much smaller than the radius of the conformal surface and because the droplet’s diameter was sufficiently small.

Figure 5.
States of droplets on substrates after spreading are the same at different contact angles.
The spreading process on the conformal surface can be replaced by the spreading process on the planar surface. Therefore, we have temporarily ignored the influence of the conformal surface on the spreading of the droplets.
This section demonstrates the problem of changing the distance between droplets on a slanted plate. As shown in Figure 6 below, the separation distances of the droplets on substrates with different slopes have changed considerably. Thus, this study only discusses the spread radius of the droplets falling on the conformal substrate and the distance between the droplets.

Figure 6.
The separation distance between the droplets is expanded by 0.287 mm given that the substrate is tilted by 30°.
In our printing process, we needed to apply precuring every time we finished a layer. We heated the conformal curved surface to evaporate the solvent (isopropyl alcohol) in the droplet. Thus, after this process, only the solid residue remained that contained the silver nanoparticles. The thickness of this nanosilver layer was only 0.3–0.5 μm, and the hydrophobicity was similar to the substrate. Thus, this layer had only minor effects on subsequent printing.
In this section, we explore the maximum spreading diameter of the droplet after it collides on the conformal hydrophobic surface. Energy conservation consideration will be adopted to perform the analysis. The detailed calculation process of the maximum spreading radius based on energy conservation [27] is described below. The kinetic energy of the droplet before it hits the substrate is calculated by,
The surface energy of the droplet before it hits the substrate is given by the following:
The fluid is at rest when the droplet spreads to its maximum diameter. Therefore, the kinetic energy of the droplet when it reaches the maximum spreading diameter after hitting the substrate is approximately zero. Thus,
When approaching the maximum spreading diameter, the shape of the droplet can be approximated to be a cylinder. During the spreading process, the liquid and the surface of the solid structure maintain a complex wetting state. The surface energy of the droplet as it spreads to the maximum diameter is given by,
During the spreading process, the change in the surface energy before and after the droplet hits the substrate is given by,
The viscous dissipation of the droplet can be approximately obtained by the following equations,
According to volume conservation, we have,
The relationship between the static contact angle of the droplet resting on a solid surface and the surface tensions between the liquid, solid, and air can be described by Young’s equation as follows:
Considering energy conservation before and after the droplet hits the substrate, we have,
Integrating the above equations yields,
Here, . When , the approximate solution of the equation is given by,
Therefore, the maximum spreading diameter of the droplet can be calculated based on and . The comparison between the theoretical calculation and the experimental measurements of the spreading diameter is shown in Figure 7c.
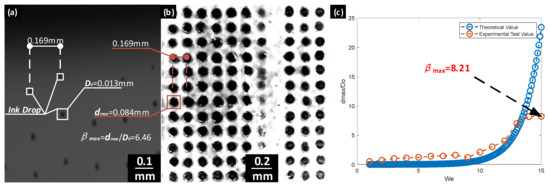
Figure 7.
(a) The printing process from the arrayed nozzle recorded by the camera; (b) droplets deposited on the substrate; and (c) theoretical calculation and actual measurement results.
The measured value of was found to be almost constant during the later stage of the experiment. It is believed that when the volume of the fluid is reduced to a certain extent, the surface energy is far greater than other types of energies and dominates the total energy. Therefore, the variation of other energies will not change the spreading condition of the droplet. According to the experiment measurements, can reach a maximum value of 8.21. This value satisfies the requirement of our model.
3.3. Arrayed Nozzle Print Model
As discussed in Section 3.1, the diameter and velocity of the droplet leaving the nozzle can be controlled in the experiment. Based on the results in Section 3.2, the spreading radius of the droplet can be calculated based on the controlled size of the droplet. In the following subsection, we will be able to calculate the droplet size required by an arbitrary jetting process based on the geometric model.
As shown in Figure 8a,b, gaps will form between the neighboring droplets if all the injected droplets have the same sizes. In this case, the droplets will not be able to connect with each other. Figure 8c below shows the printing model calculated based on a simple geometric model. As shown in the figure, as the distance between the nozzle and the substrate increases, the larger the droplet size is required to ensure that all the droplets are connected to each other must increase.
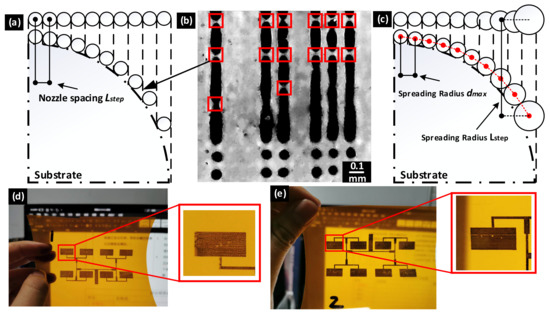
Figure 8.
Simplified model for printing on the conformal surface using the arrayed nozzle: (a) formation of gaps between neighboring droplets during the printing process from the arrayed nozzle when all droplets share the same size; (b) droplet size calculated based on the geometric model; and (c) the printing model proposed in this study. (d) Actual effect of direct printing on the surface; and (e) actual effects of printing with the method proposed in this article.
To quantify this defect, we used profilometer measurements to demonstrate the existence of the problem. As shown in Figure 9a below, owing to the large distance between the droplets, when the droplets are not fully fused, the heating of the substrate will lead to the evaporation of the solvent of the ink. Thus, only the solid silver nanoparticle residue will remain. Therefore, this will cause the antenna resistance to become higher (or will lead to a lower conductivity) that will ultimately affect the performance of the antenna. Figure 9b shows the outcomes in the case at which the droplets are completely fused.

Figure 9.
Difference between the defect phenomenon measured by the profilometer and uniform printing. (a) Drawback measured by the step instrument. (b) Results generated in the case in which the droplets are uniformly fused.
Using a nozzle number of and a spacing of in the arrayed nozzle, the printing condition on a quarter of a circle can be calculated theoretically, as shown in the figure below. Based on experimental measurements, the droplets will be affected by the airflow and the air drift when the fall height becomes greater than 3.5 mm. Based on the experiment, when the jetting distance is greater than 3.5 mm, the droplets will not float to the predetermined substrate position owing to airflow, as shown in Figure 10b below. The smaller the kinetic energy, the more significant will be the effects of the external airflow.
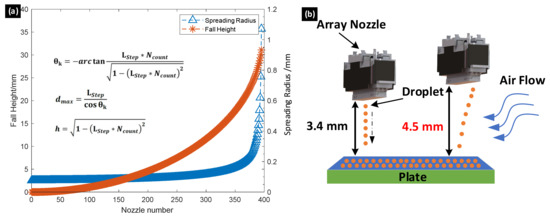
Figure 10.
(a) Theoretical calculation model on a quarter of a circle with a radius of .(b) When the ejection distance is greater than 3.4 mm, it will be disturbed by the airflow, which will cause the droplets to fall on the substrate incorrectly. Ncount, nozzle number; LStep, spacing.
The theoretical model shown in Figure 10a was obtained. In this theoretical model, the maximum droplet radius required was 1.15 mm. This radius cannot be achieved by the spreading of a single droplet. Based on the previous model, the maximum spreading radius was calculated to be 80. In this case, the minimum fall height is 3.4 mm. Therefore, the maximum boundary conditions are calculated to be the maximum spreading radius of 80 and the maximum fall height of 3.4 mm.
4. Manufacturing Experiment
4.1. Manufacturing Sheet Resistivity Resistor Types
Conductivity (or resistance) is an important parameter for antennas. To improve the performance of the antenna, we need to increase the conductivity (reduce the resistance) as much as possible. Increased resistivity will cause increased attenuation of the transmitted signal, thus resulting in reduced antenna performance. The resistor manufactured below is a sheet resistivity resistor type. The characteristic feature of the sheet resistivity sample is that the resistances of the squares of any size are the same from side to side, regardless of whether the side length is 1 m or 0.1 m. Sheet resistivity is only related to the thickness of the conductive film. Therefore, the sheet resistivity is typically used to test the difference between the two printing methods. Figure 11 shows the size specifications and manufactured sheet resistivity resistor.

Figure 11.
(a) Drawings of sheet resistivity sample. (b) Sheet resistivity printed directly on conformal surfaces with conventional methodology, and (c) with the scheme proposed in this article.
It is difficult to assess the differences between the two types of sheet resistivity based on macroscopic observations. Correspondingly, we measured them with profilometry, as shown in Figure 12 below. As shown, when the sheet resistivity product is manufactured with conventional methodologies, its surface is uneven and the surface dimensional tolerance is large. Because the conductivity of the sheet resistivity product is determined by its thinnest area, the resistance value of the sheet resistivity product manufactured with conventional methods is significantly greater than that produced with the scheme proposed in this study. The measured results of the four-probe resistivity tester also confirmed this.

Figure 12.
(a) Measured outcomes generated with direct printing with the conventional method, wherein the test area is the edge of the sheet resistivity sample. The lowest area on the left is the substrate, and the elevated area on the right denotes the solid nanosilver particle residue that remains after the ink is dried. The cumulative thickness of the ten-layer nanosilver ink is approximately . (b) Generated results with the use of this scheme have better surface flatness as those in Figure 12a.
To verify the differences between the two sheet resistivity samples, we conducted microscopic observations. Figure 13a below is a micrograph printed with the conventional method, and Figure 13b below is an enlarged side view of Figure 13a, while Figure 13c is a micrograph printed with the method proposed in this study. In the figure, the black part is ink, and the white part is the substrate. It can be clearly observed that there are numerous pores in each line of ink dots. The printing outcome is not conductive. By controlling the size of the droplet to compensate for this drawback, we obtained Figure 13c wherein the ink deposition was very dense. Figure 13b is a better illustration of this problem. Figure 13a is acquired from the side. It can be clearly observed that the droplets are not fused. The results show that the sheet resistivity sample manufactured by the conventional method generates a rough surface, and the electrical conductivity is not as good as the sheet resistivity sample manufactured by the scheme proposed in this study.

Figure 13.
Comparison of two methods used to print the micrograph of the square resistance. (a) Printing scheme outcome without Figure 8b,c. (b) Enlarged view of the noted drawback. (c) Printing scheme outcome with the method proposed in this study.
Finally, the scheme shown in Figure 8a was used and test layer samples were printed. Thus, to check the conductivity, we printed 10 layers of nanosilver solution to test the comparison. The appearances of the two sheet resistivities were similar, but after the four-probe resistivity tester test, the value of the conventionally printed sheet resistivity product was , and that printed using the model in this article was . The validity of the conformal array head print model proposed in this study was verified. The formula for the calculation of conductivity is
In the formula, R is the square resistance measured by the four-probe measuring instrument, is the conductivity, and d is the average thickness. According to the measured results, the average thickness was . The calculated results are listed in the Table 2 below.

Table 2.
Sample conductivity test results.
The sheet resistivity sample produced on the curved surface with the method introduced in this study has a conductivity value equal to one-sixth of the conductivity of the silver block. The conductivity of the sample printed directly on the curved surface is almost 100 times different from that of the sheet resistivity product manufactured by the method proposed in this study. These findings prove the effectiveness of the proposed scheme.
4.2. Manufacturing Microstrip Antenna
A conformal microstrip antenna array containing four units was designed in this study, as shown in Figure 14. The dielectric constant and dielectric loss tangent of the substrate are 4.4 and 0.02, respectively. A microstrip line was used to feed the microstrip antenna unit. The antenna unit in the array has a dimension of 12.4 × 10 mm. Figure 14 shows the antenna manufactured by arrayed nozzle printing.

Figure 14.
Design and manufactured product of the antenna.
The microstrip arrayed antenna was tested using a vector network analyzer (R&S ZNC). The frequency responses obtained from the simulation and experimental measurements are shown in Figure 15. The return loss of the antenna array at 6 GHz was measured to be -15.6 dB. The return loss in the bandwidth from 5.85 to 6.1 GHz was measured to be -10 dB. This value satisfies the performance requirements. As shown in the simulation and experimental results, the working frequency of the antenna is almost consistent with the original design. This feature indicates a highly accurate dimension of the antenna units during the printing process. The reduction in the return loss may be attributed to insufficient precision when printing extremely thin microstrip lines. This deficiency results in a small loss in the feed network. The difference between the simulation and the measurement results may be caused by the non-uniform thickness of the conductive pattern induced by the flow of the printing liquid.
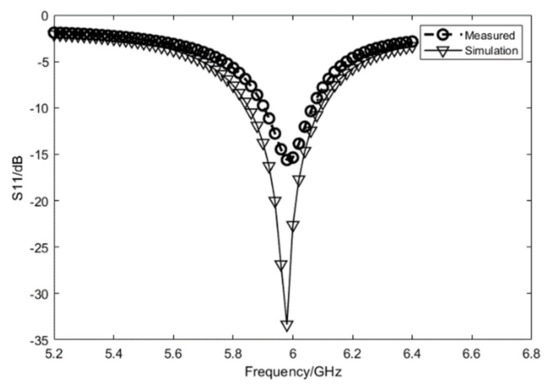
Figure 15.
Return loss of the antenna manufactured in this study.
5. Conclusions
In this study, an antenna pattern was printed on a conformal surface using an arrayed nozzle. The drawbacks associated with printing on a conformal surface using arrayed nozzles were also analyzed. The maximum spreading radii of the droplets generated with different parameters were calculated based on energy conservation. A model was developed for printing on a conformal surface using the arrayed nozzle. Finally, the printing model was applied to the manufacturing of a 6 GHz microstrip antenna array, in which a curved substrate was used as the dielectric board. The results show that the return loss of the antenna at 6 GHz was -15.6 dB. Such consistency validates the effectiveness of the printing method proposed in this study. Furthermore, the total printing time for a 100 × 100 mm2 area is less than 5 s. Therefore, in addition to satisfying the printing requirements, the proposed printing method can save substantial time and greatly improve the printing efficiency.
Author Contributions
Investigation, Z.L. and S.Y.; writing—original draft preparation, Z.L. and J.Z.; writing—review and editing, Y.Y.; visualization, Z.L. and P.Y.; project administration, J.H. and J.Z.; All authors have read and agreed to the published version of the manuscript.
Funding
This research was funded by the National Natural Science Foundation of China, grant number 51575419. Shaanxi Innovation Team Project 2018TD-012, Shaanxi Key Industry Chain Project 2020ZDLGY14-08.
Conflicts of Interest
The authors declare no conflicts of interest.
References
- Josefsson, L.; Persson, P. Conformal Array Antennas; Springer: Singapore, 2016. [Google Scholar]
- Lockyer, A.J.; Alt, K.H.; Kinslow, R.W.; Kan, H.-P.; Goetz, A.C. Development of a structurally integrated conformal load-bearing multifunction antenna: Overview of the Air Force Smart Skin Structures Technology Demonstration Program. In Proceedings of the SPIE—The International Society for Optical Engineering, San Diego, California, USA, May 1996. [Google Scholar]
- Liu, Y.; Yang, H.; Jin, Z.; Zhao, F.; Zhu, J. A Multibeam Cylindrically Conformal Slot Array Antenna Based on a Modified Rotman Lens. IEEE Trans. Antennas Propag. 2018, 66, 3441–3452. [Google Scholar] [CrossRef]
- Budhu, J.; Rahmat-Samii, Y.; Hodges, R.; Hofmann, U.C.; Ruffatto, D.F.; Carpenter, K. Three-Dimensionally Printed, Shaped, Engineered Material Inhomogeneous Lens Antennas for Next-Generation Spaceborne Weather Radar Systems. IEEE Antennas Wirel. Propag. Lett. 2018, 17, 2080–2084. [Google Scholar] [CrossRef]
- Ramadan, M.; Dahle, R. Characterization of 3-D Printed Flexible Heterogeneous Substrate Designs for Wearable Antennas. IEEE Trans. Antennas Propag. 2019, 67, 2896–2903. [Google Scholar] [CrossRef]
- Braaten, B.D.; Roy, S.; Nariyal, S.; Al Aziz, M.; Chamberlain, N.F.; Irfanullah, I.; Reich, M.T.; Anagnostou, D.E. A Self-Adapting Flexible (SELFLEX) Antenna Array for Changing Conformal Surface Applications. IEEE Trans. Antennas Propag. 2012, 61, 655–665. [Google Scholar] [CrossRef]
- Maiden, A.; McWilliam, R.; Purvis, A.; Johnson, S.; Williams, G.L.; Seed, N.L.; Ivey, P.A. Nonplanar photolithography with computer generated holograms. Opt. Lett. 2005, 30, 1300–1302. [Google Scholar] [CrossRef][Green Version]
- Toriz-Garcia, J.J.; Cowling, J.J.; Williams, G.L.; Bai, Q.; Seed, N.L.; Tennant, A.; McWilliam, R.; Purvis, A.; Soulard, F.B.; Ivey, P.A. Fabrication of a 3D electrically small antenna using holographic photolithography. J. Micromech. Microeng. 2013, 23, 55010. [Google Scholar] [CrossRef]
- Fukuda, K.; Someya, T. Recent Progress in the Development of Printed Thin-Film Transistors and Circuits with High-Resolution Printing Technology. Adv. Mater. 2016, 29, 1602736. [Google Scholar] [CrossRef]
- Driessen, T.; Jeurissen, R. Drop Formation in Inkjet Printing; Wiley-VCH Verlag GmbH & Co. KGaA: Weinheim, Germany, 2015. [Google Scholar]
- Huang, Y.A.; Wu, H.; Xiao, L.; Duan, Y.Q.; Zhu, H.; Bian, J.; Ye, D.; Yin, Z.P. Assembly and applications of 3D conformal electronics on curvilinear surfaces. Mater. Horizons 2019, 6, 642–683. [Google Scholar] [CrossRef]
- Zhu, D.B.; Wu, M.Q. Highly Conductive Nano-Silver Circuits by Inkjet Printing. J. Electron. Mater. 2018, 47, 5133–5147. [Google Scholar] [CrossRef]
- Zhang, S.; Wang, B.; Jiang, J.J.; Wu, K.; Guo, C.F.; Wu, Z.G. High-Fidelity Conformal Printing of 3D Liquid Alloy Circuits for Soft Electronics. Acs Appl. Mater. Inter. 2019, 11, 7148–7156. [Google Scholar] [CrossRef]
- Yang, L.; Zhang, R.W.; Staiculescu, D.; Wong, C.P.; Tentzeris, M.M. A Novel Conformal RFID-Enabled Module Utilizing Inkjet-Printed Antennas and Carbon Nanotubes for Gas-Detection Applications. IEEE Antennas Wirel. Propag. Lett. 2009, 8, 653–656. [Google Scholar] [CrossRef]
- Saada, G.; Layani, M.; Chernevousky, A.; Magdassi, S. Hydroprinting Conductive Patterns onto 3D Structures. Adv. Mater. Technol.-Us 2017, 2, 1600289. [Google Scholar] [CrossRef]
- Abutarboush, H.F.; Shamim, A. Paper-Based Inkjet-Printed Tri-Band U-Slot Monopole Antenna for Wireless Applications. IEEE Antennas Wirel. Propag. Lett. 2012, 11, 1234–1237. [Google Scholar] [CrossRef]
- Adams, J.J.; Duoss, E.B.; Malkowski, T.F.; Motala, M.J.; Ahn, B.Y.; Nuzzo, R.G.; Bernhard, J.T.; Lewis, J.A. Conformal Printing of Electrically Small Antennas on Three-Dimensional Surfaces. Adv. Mater. 2011, 23, 1335–1340. [Google Scholar] [CrossRef]
- Juntunen, T.; Jussila, H.; Ruoho, M.; Liu, S.H.; Hu, G.H.; Albrow-Owen, T.; Ng, L.W.T.; Howe, R.C.T.; Hasan, T.; Sun, Z.P.; et al. Inkjet Printed Large-Area Flexible Few-Layer Graphene Thermoelectrics. Adv. Funct. Mater. 2018, 28, 1800480. [Google Scholar] [CrossRef]
- Saeidi-Javash, M.; Kuang, W.; Dun, C.C.; Zhang, Y.L. 3D Conformal Printing and Photonic Sintering of High-Performance Flexible Thermoelectric Films Using 2D Nanoplates. Adv. Funct. Mater. 2019, 29, 1901930. [Google Scholar] [CrossRef]
- Ehrenberg, I.M.; Sarma, S.E.; Wu, B.I. Fully Conformal FSS via Rapid 3D Prototyping. In Proceedings of the 2012 IEEE International Symposium on Antennas and Propagation, Chicago, IL, USA, 8–14 July 2012. [Google Scholar]
- Li, R.; Ashgriz, N.; Chandra, S.; Andrews, J.R.; Williams, J. Drawback during deposition of overlapping molten wax droplets. J. Manuf. Sci. E-T Asme. 2008, 130, 041011. [Google Scholar] [CrossRef]
- Soltman, D.; Subramanian, V. Inkjet-printed line morphologies and temperature control of the coffee ring effect. Langmuir 2008, 24, 2224–2231. [Google Scholar] [CrossRef]
- Ng, L.W.T.; Zhu, X.X.; Hu, G.H.; Macadam, N.; Um, D.; Wu, T.C.; Le Moal, F.; Jones, C.; Hasan, T. Conformal Printing of Graphene for Single- and Multilayered Devices onto Arbitrarily Shaped 3D Surfaces. Adv. Funct. Mater. 2019, 29, 1807933. [Google Scholar] [CrossRef]
- Gandhiraman, R.P.; Jayan, V.; Han, J.W.; Chen, B.; Koehne, J.E.; Meyyappan, M. Plasma Jet Printing of Electronic Materials on Flexible and Nonconformal Objects. Acs Appl. Mater. Inter. 2014, 6, 20860–20867. [Google Scholar] [CrossRef]
- Paulsen, J.A.; Renn, M.J.; Christenson, K. High Resolution Conformal Printing with Aerosol Jet (R). In Proceedings of the Digital Fabrication 2011/ Nip27- 27th International Conference on Digital Printing Technologies: Technical Programs and Proceedings, Minneapolis, MN, USA, October 2011; pp. 512–515. [Google Scholar]
- Zhang, H.Y.; Huang, J.; Wang, J.J.; Zhao, J.Y.; Liu, D.C. Development of a path planning algorithm for reduced dimension patch printing conductive pattern on surfaces. Int. J. Adv. Manuf. Tech. 2018, 95, 1645–1654. [Google Scholar] [CrossRef]
- Chandra, S.; Avedisian, C.T. On the Collision of a droplet with a solid surface. Proc. Math. Phys. Sci. 1991, 432, 13–41. [Google Scholar] [CrossRef]
© 2020 by the authors. Licensee MDPI, Basel, Switzerland. This article is an open access article distributed under the terms and conditions of the Creative Commons Attribution (CC BY) license (http://creativecommons.org/licenses/by/4.0/).