Article

Mental Workload Classification Method Based on EEG Independent Component Features

1
School of Information Science and Technology, North China University of Technology, Beijing 100144, China
2
School of Aeronautic Science and Engineering, Beihang University, Beijing 100191, China
*
Authors to whom correspondence should be addressed.
Appl. Sci. 2020, 10(9), 3036; https://doi.org/10.3390/app10093036
Submission received: 19 March 2020 / Revised: 9 April 2020 / Accepted: 20 April 2020 / Published: 27 April 2020

Abstract

:
Excessive mental workload will reduce work efficiency, but low mental workload will cause a waste of human resources. It is very significant to study the mental workload status of operators. The existing mental workload classification method is based on electroencephalogram (EEG) features, and its classification accuracy is often low because the channel signals recorded by the EEG electrodes are a group of mixed brain signals, which are similar to multi-source mixed speech signals. It is not wise to directly analyze the mixed signals in order to distinguish the feature of EEG signals. In this study, we propose a mental workload classification method based on EEG independent components (ICs) features, which borrows from the blind source separation (BSS) idea of mixed speech signals. This presented method uses independent component analysis (ICA) to obtain pure signals, i.e., ICs. The energy features of ICs are directly extracted for classifying the mental workload, since this method directly uses ICs energy features for feature extraction. Compared with the existing solution, the proposed method can obtain better classification results. The presented method might provide a way to realize a fast, accurate, and automatic mental workload classification.

1. Introduction

Mental workload, also called psychological load, can be understood as the amount of brain activity in a unit of time, the occupation rate of brain resources, the psychological pressure, or information processing ability of a person at work [1]. Studies have shown that excessive mental workload can cause rapid fatigue, reduced flexibility, increased mistakes, and frustrated emotions, and results in errors in information acquisition analysis and decision errors [2]; and too low mental workload can cause waste of human resources and lead to a decline in job performance. Mental workload is a key factor in analyzing and realizing human–machine collaboration tasks. Therefore, it is of great significance to improve the accuracy of mental workload classification.
Some studies have found that EEG signals were highly correlated with real-time mental workload status of operator processing information jobs as neurophysiological signals directly reflect brain activity [3]. A brain–computer interface (BCI) is a direct communication channel between the brain and external devices [4], which provides great help for the study of EEG signals. Naseer et al. did research on BCI [5,6,7] and found the feasibility of functional near-infrared spectroscopy (fNIRS) for a BCI by asking subjects to do mental tasks [8]. With the development of technology, some studies have shown the effects of delta, theta, alpha, and gamma bands on the mental workload. Beta band is sensitive to changes in mental workload [9]. It is generally believed that psychological stress, active thinking, and attention cause EEG activity to move to higher frequency bands and suppress alpha wave activity [10]. The power spectrum energy of alpha and theta wave has a negative correlation with task difficulty and mental workload [11,12,13]. Gamma band correlates with cognitive task execution [14].
In order to seek an effective assessment of the mental workload status, researchers have made many beneficial attempts. The methods of evaluating mental workload include the subjective scale method represented by National Aeronautics and Space Administration-Task Load Index (NASA-TLX) scale [15]. Analysis of variance by SPSS-repeated measurements showed that the brain load factors were the main factor affecting the NASA-TLX scores [16].
In recent years, machine learning has developed rapidly. More and more researchers have focused their attention on the use of machine learning algorithms [17] to explore the correspondence between EEG and mental workload levels and establish mental workload classifiers. Cinaz Burcu et al. [18] designed an experiment to obtain the physiological signal data of the subjects. They directly extracted the features of the physiological signals and classified the mental workload by using linear discriminant analysis (LDA), k-nearest neighbor (KNN) algorithm, and a support vector machine (SVM). Liu Weiping [19] analyzed the EEG signal to establish the EEG signal feature space and constructed the mental workload status recognition model for occupant information processing tasks based on the particle swarm optimization (PSO) algorithm and SVM. Zhao et al. [20] extracted the frequency domain features of the collected signals and normalized them. Then they used an SVM to evaluate the cross-task brain load level in the abnormal detection process.
The existing mental workload classification methods are based on the mixed EEG signals. These types of methods can achieve an assessment of the mental workload state to a certain extent, but they also have limitations. Because the channel signals, which recorded by the EEG electrodes, are a group of mixed brain signals, they are similar to multi-source mixed speech signals. It is not wise to directly analyze the mixed signals in order to distinguish the feature of EEG signals. In this study, borrowing from the BSS idea of mixed speech signals [21], we propose a mental workload classification method based on the EEG ICs features for vision and operational tasks. This method can directly extract the ICs features to realize the classification of mental workload.

2. Materials and Methods

2.1. Experiments and Data Preprocess
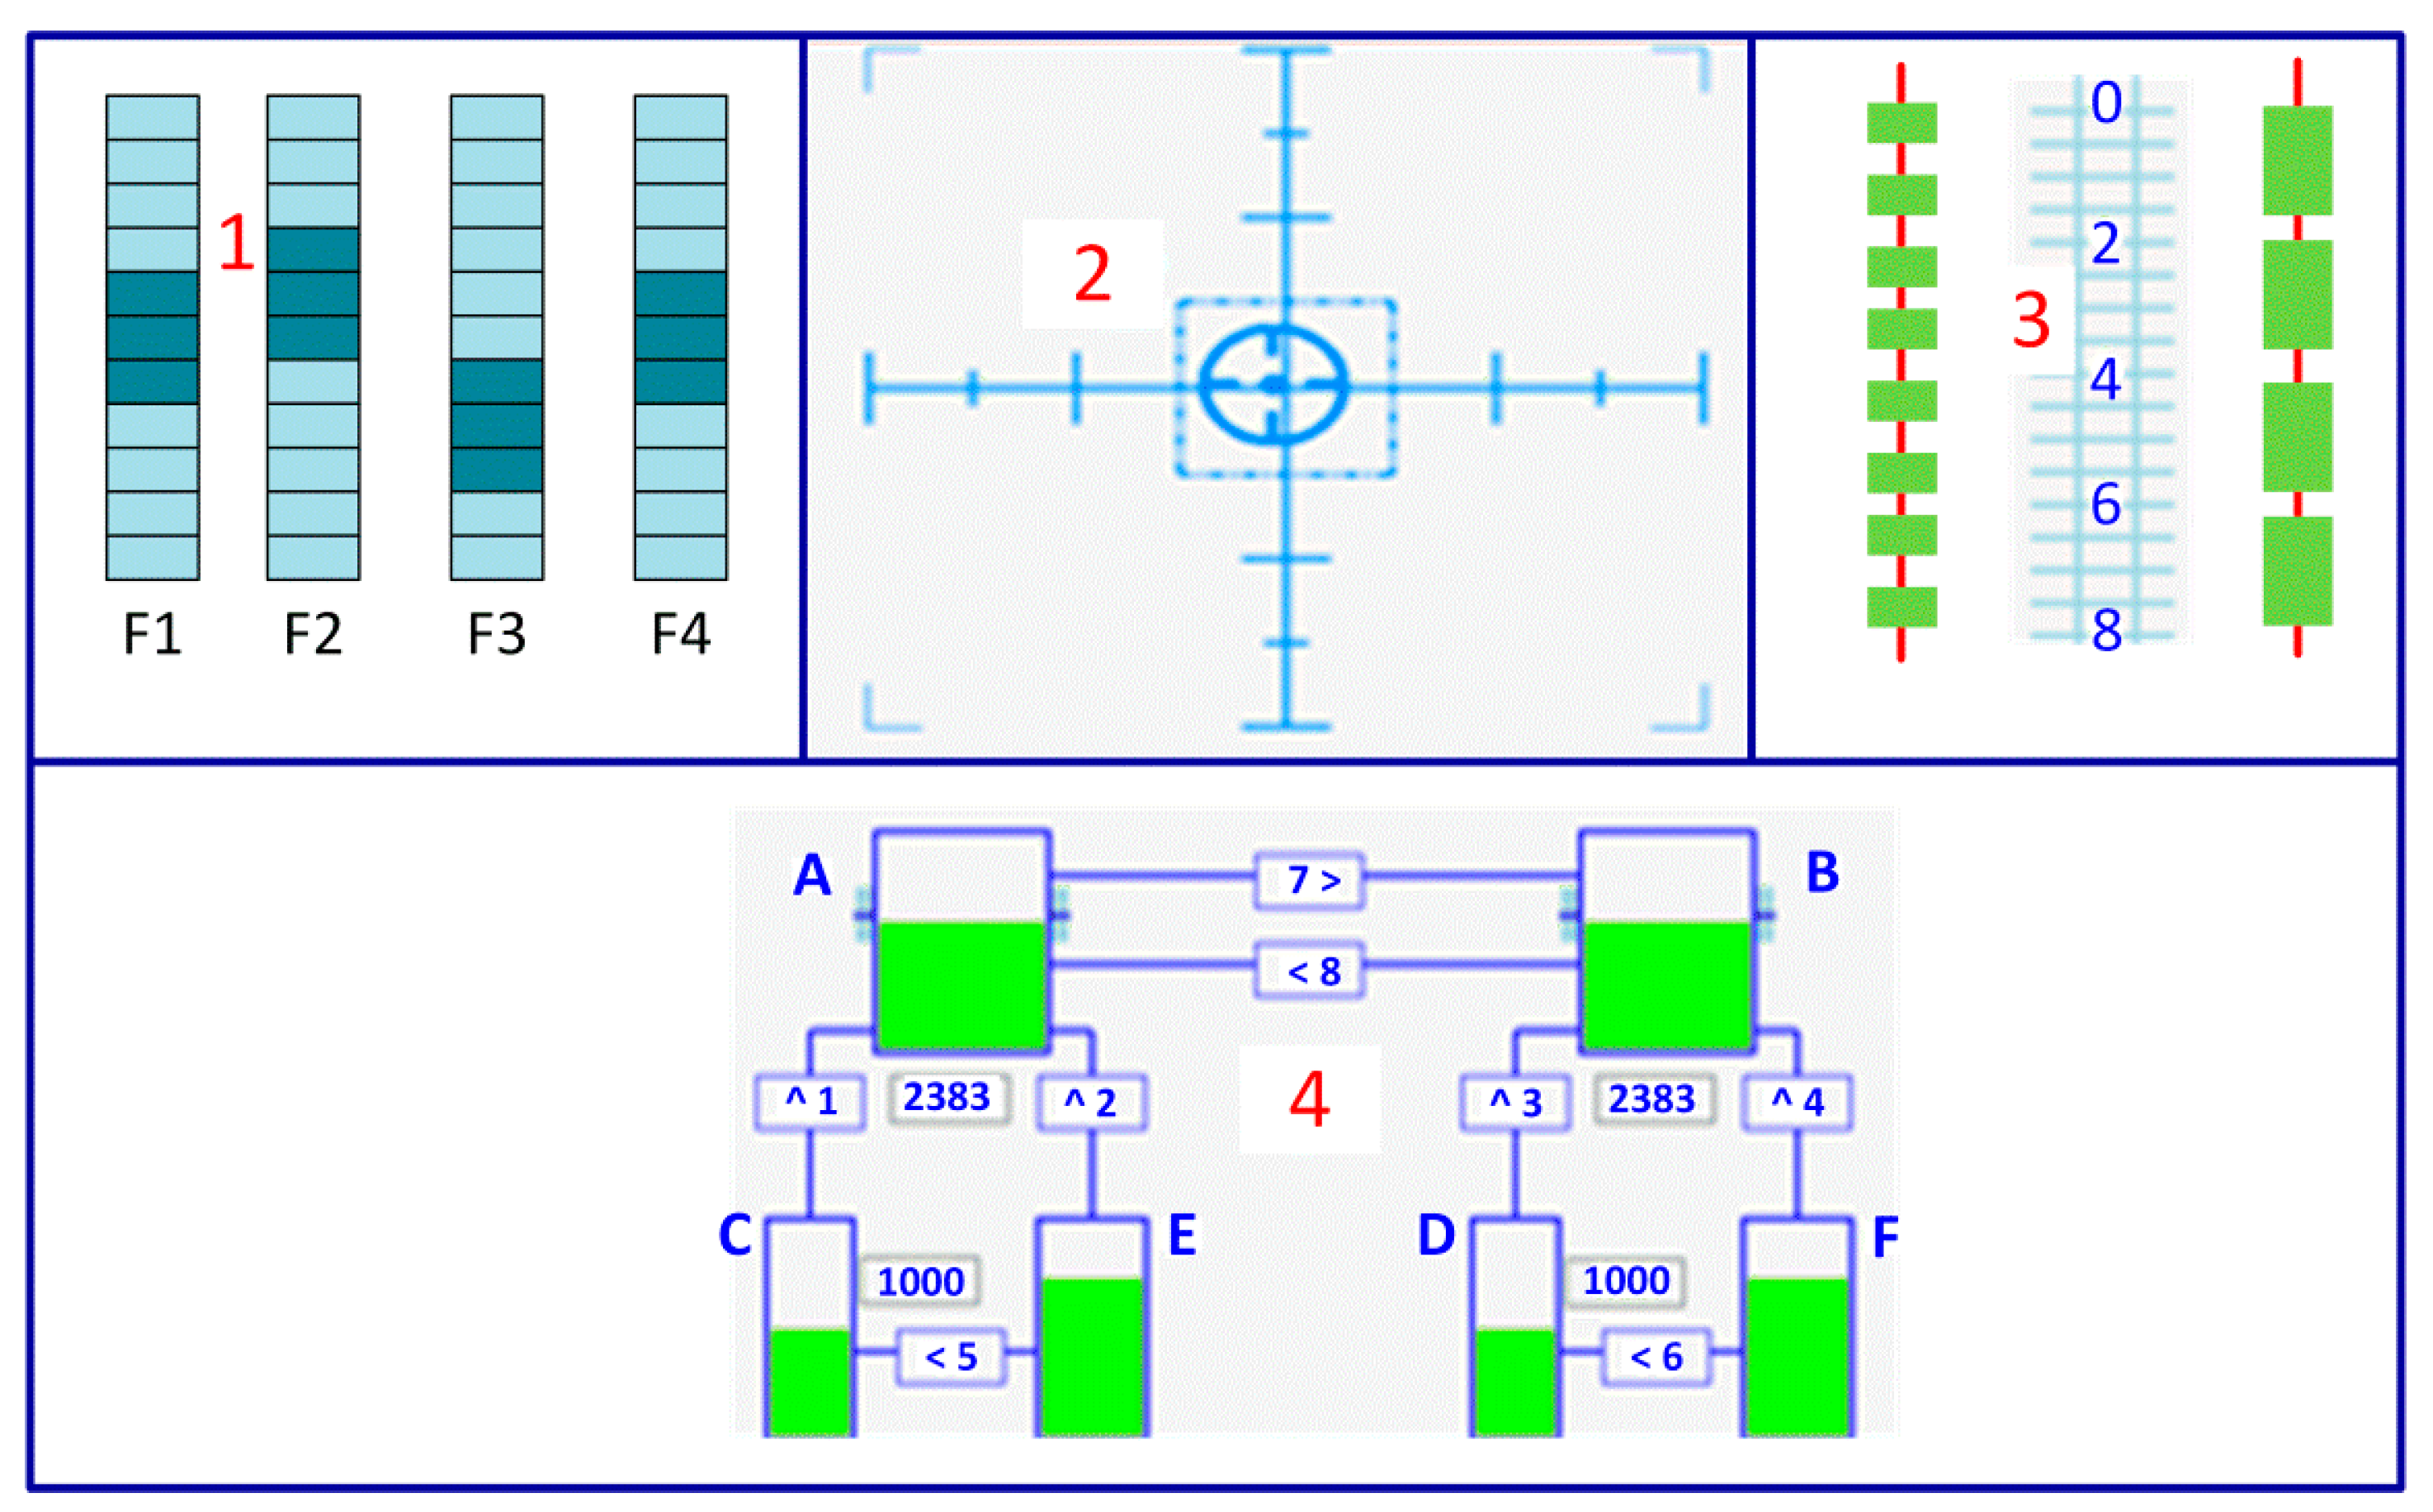
2.1.1. Experiments

All EEG signals were recorded by a 32-channel Neuroscan Neuamps (Synamps2, Scan4.3, EI Paso, USA) system, and its channel locations are shown in Figure 1. The system uses a common reference, A1 and A2, which are located respectively behind the left and right ears. The data were digitized at 1000 samples per second. Band-pass filter settings were 0.1–200 Hz.
The EEG signals were collected from 13 participants with engineering knowledge background in Beihang University (aged between 22 and 25 years, with two females and 11 males). The platform of experiment was multi-attribute task battery (MATB-II, National Aeronautics and Space Administration (NASA), USA) [22]. Its task interface is shown in Figure 2. Some vision and operational flight missions were placed in four areas, respectively. During the experiment, three levels of mental workload were set, and they are low mental workload (LMW), mid mental workload (MMW), and high mental workload (HMW).
The participants needed to complete the four sub-tasks under different mental loads in MATB-II. The difficulty degree of the experimental tasks was defined by the occurrence frequency of the four sub-tasks. The details of the four sub-tasks are shown in Table 1 [23].

2.1.2. Data Processing

The reference of data processing was reset as the average value of A1 and A2. The 30-channel EEG signals were filtered with 1 Hz high-pass filter and 30 Hz low-pass filter, respectively. FIR filter was used, and the filter order was 3300.
In order to ensure the validity of the data analysis, the EEG signals of 10 participants (sub 1~sub 10, aged between 22 and 25 years, with two females and eight males) were selected to analyze according to the selection criterion of “high performance” and “less artifacts”. The criterion of high performance meant that the accuracy rate of operating performance should be greater than 0.90. The accuracy rates of operating performance of two participants were less than 70, which did not achieve the standard of high performance, so their data were not analyzed. The criterion of less artifacts meant that the artifacts cannot exceed 5 min in the original EEG data. One participant had too many artifacts, which was not conducive to signal analysis, so this paper analyzed EEG signals of 10 participants.
The above data processing was applied to preprocess all the EEG signals. The middle 600 s EEG data in each mental workload were chosen and divided into 300 data segments, namely, the length of the segment was 2 s. Firstly, the NASA-TLX scale was used to evaluate the experimental parameter rationality of MATB-II. Then the segments were labeled according to different mental load state of MATB-II. There were 900 data segments in three mental workloads. The training set and the testing set were divided into 7:3, that is, 630 training segments and 270 testing segments.

2.2. Mental Workload Classification Method Based on EEG ICs Features

2.2.1. BSS of EEG Signals

The EEG signals are usually collected by non-invasive measurement technology, and its electrode sensors are placed on the head surface. In a human thought process, as shown in Figure 3a [24], many neuron sources are activated and separately generate brain activity signals, (S1,S2,…,Sn) [25]. But the electrode sensors actually measure their mixed signals. The measured mixed signals (S1,S2,…,Sm) are not suitable to distinguish the EEG features and should be separated into their independent pure signals. This mixed effect depends on the distances from neuron sources to electrode sensors, aij, (i = 1,2,…,m; j = 1,2,…,n) [26]. There will be a fixed mix feature for the same person wearing the same EEG cap. The problem in separating mixed EEG signals is similar to the BSS of mixed speech signals, as shown in Figure 3b. Both separate their mixed signals in order to obtain independent pure signals for further analysis.
The independent component analysis (ICA) [27] is often used to separate the mixed speech signals in order to obtain their ICs. Therefore, this paper borrows the idea of BSS to realize the mental workload classification for vision and operational tasks. The method includes four steps: filtering the measured EEG signals; obtaining EEG ICs with ICA; extracting the energy features of ICs; and classifying them.
This method firstly obtains the pure signals of EEG, and then classifies the mental workload by analyzing the ICs features of EEG directly. The BSS process of EEG signals is as follows:
In Figure 3a, m-dimensional observation vector, x1, x2,…,xm, is a linear combination of n-dimensional ICs, s1, s2,…,sn, and can be expressed as:
x j = a j 1 s 1 + a j 2 s 2 + + a j n s n , j = 1 , 2 , 3... , m
It can be formulated as:
X = A S
where S = [s1, s2,…,sn]T is a n-dimensional vector of statistically independent sources, in this paper S is a set of ICs; X = [x1, x2,…,xm]T is m-dimensional vector of observed data; A is a mixing matrix.
These independent sources are mixed through the m × n mixing matrix, A. A represents the mixed situation of signals. In our study, the source, S, and the mixing matrix, A, are unknown. Here, ICA used the observed random vector data, X, to estimate S using optimization and iterative methods [28,29,30]. This paper selected FastICA [31] to estimate S.
Each EEG IC is equivalent to a signal generated by a neuron source or several nearby neurons. It is a great advantage to analyze the EEG ICs rather than the mixed EEG signals because the features of mixed EEG are vague. EEG signals can actually be analogized to multi-dimensional speech signals. It is generally known that it is easy to identify the content of the speech signals for a single sound source. But for mixed sound sources, multiple speech signals are aliased, which makes the semantics ambiguous. It is very difficult to identify them unless using the BSS of speech signals. Borrowing the idea of BSS, this paper presents a mental workload classification method based on EEG ICs features.
For the presented method, the number of selected ICs was 30 in this paper, and is the same as the number of EEG signal channels considering the following reasons: (1) The dimension of the ICA output variable, S, cannot exceed the dimension of the ICA input variable X [30]; and (2) by comparing the impact of different dimensions of S on its classification accuracy, we find that the classification accuracy is highest when the dimension of S is 30, which will be shown in Section 3.4.

2.2.2. Feature Extraction Methods

The power spectral density (PSD) at different frequencies is often used to extract the features of EEG signals in the frequency domain. In this paper, the energy features of EEG ICs were specially extracted for further mental load classification.
Fourier transform in Equation (3) was performed on each data segment to obtain Fs(n).
F s ( n ) = n = 0 N 1 S e 2 π j N n
where S is a set of EEG ICs; Fs(n) is Fourier transform of S. N is the number of signal samples. n is from 0 to N−1.
The corresponding PSD of EEG ICs was calculated with Equation (4).
p s ( n ) = F s ( n ) F s ( n ) N
where ps(n) is PSD of EEG ICs; Fs*(n) is the conjugate of Fs(n). N is the length of signal.
Many studies have shown that human mental state is related to four rhythms [32,33,34]. According to the EEG signal frequency band distribution, it can be divided into four frequency bands: δ (1–4 Hz), θ (4–8 Hz), α (8–14 Hz) and β (14–30 Hz). The energy features of each frequency band are defined as:
E s , δ = f r e q = 1 4 p s , f r e q E s , θ = f r e q = 4 8 p s , f r e q E s , α = f r e q = 8 14 p s , f r e q E s , β = f r e q = 14 30 p s , f r e q
where ps, freq refers to the power spectral density at a certain frequency; Es,δ, Es,θ, Es,α and Es,β are the four energy features of EEG ICs.
The absolute power spectrum is normalized to obtain the relative power spectrum.
E s , δ = E s , δ E a l l , E s , θ = E s , θ E a l l , E s , α = E s , α E a l l , E s , β = E s , β E a l l , E a l l = f r e q = 1 30 p s , f r e q
where, Eall refers to the power spectral density at 1–30 Hz; Es,δ*, Es,θ*, Es,α* and Es,β* are the four relative energy features of EEG ICs.

2.2.3. Classification

In this paper, different classifiers separately using LDA [35], back propagation (BP) neural network (BPNN) [36], KNN [37], and SVM [38] algorithms will be discussed and compared in Section 4. The SVM classifier was finally selected as the classification method for different EEG processing methods. The extracted four energy features of EEG ICs of the three loads were used as the input of SVM to classify the mental workload. The grid search method was selected for different subjects to obtain the optimal model parameters. The search space of the kernel function was [linear, rbf, sigmoid]. C was the penalty coefficient, which indicates the tolerance of the error, and the search space was [0.001, 0.01, 1, 10, 30]. Gamma was the parameter required to select rbf as the kernel function, which indicates the number of support vectors, and its search space was [0.001, 0.01, 0.1, 1]. Cross-validation was performed in the classification algorithm to ensure the robustness of the model and reduce overfitting.

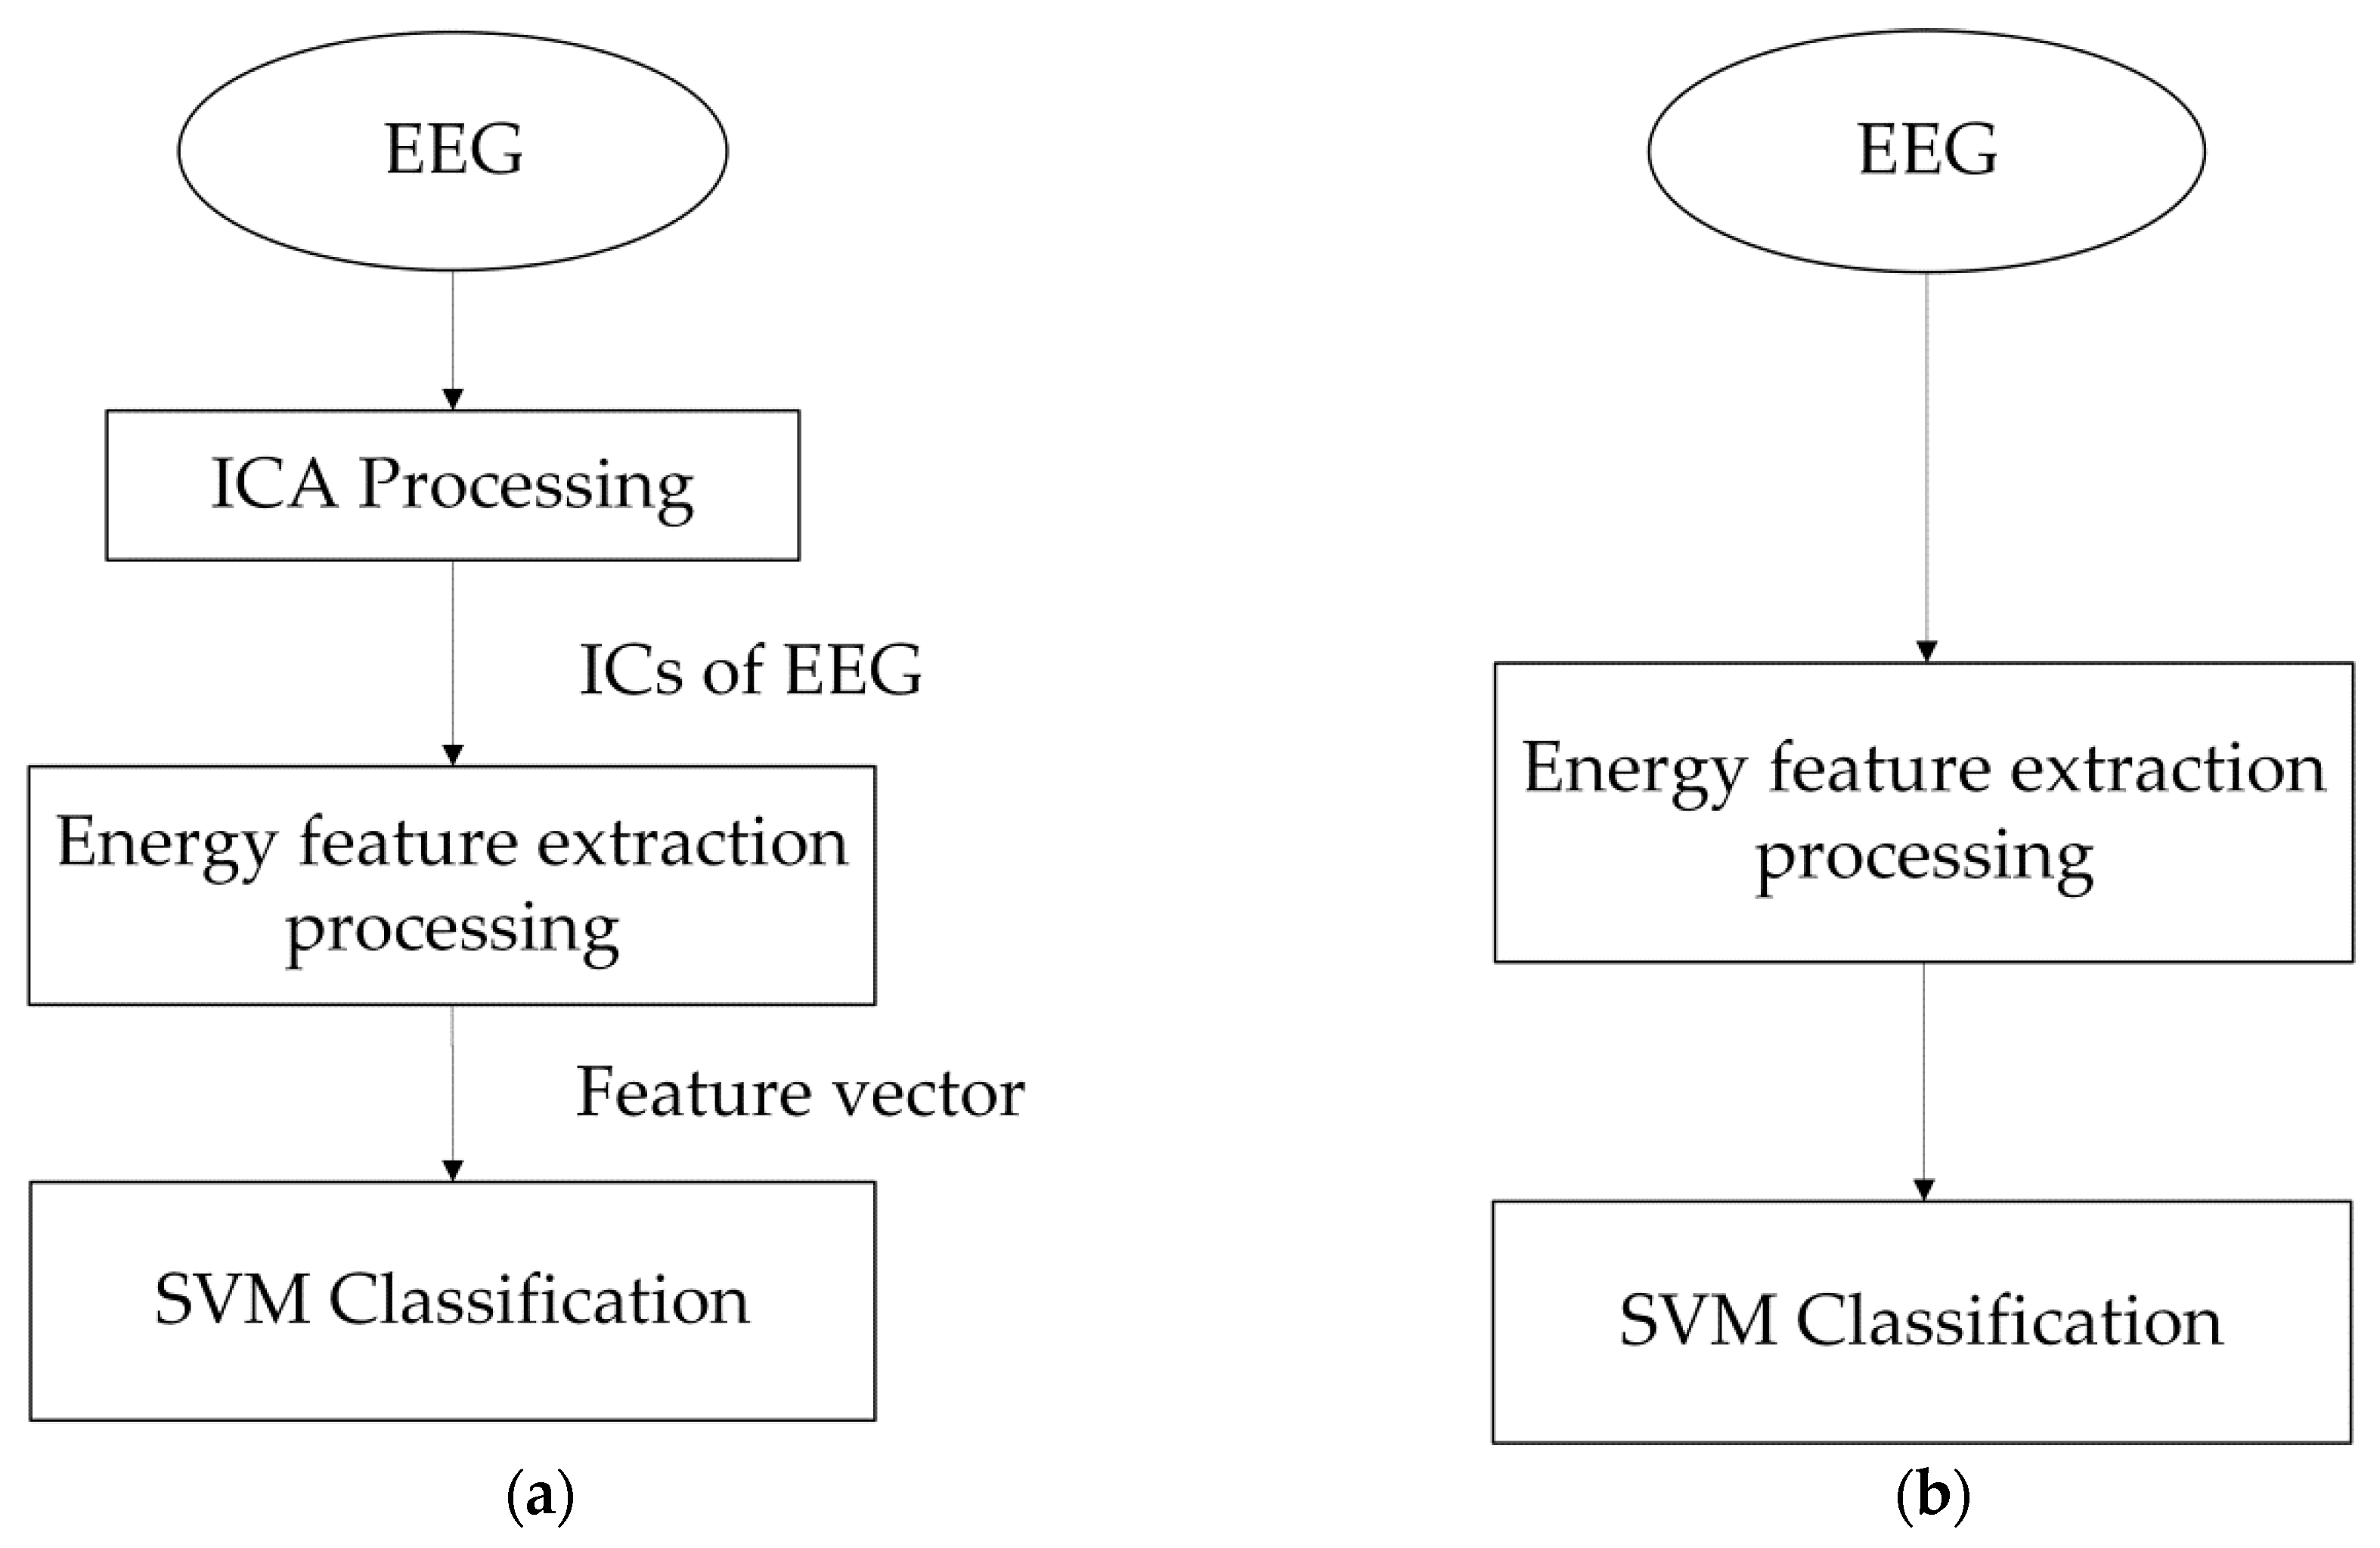
2.2.4. Principle of Mental Workload Classification Method Based on EEG ICs Features

The mental workload classification based on EEG ICs is mainly composed of four steps: EEG signal filtering; ICs separation of EEG with ICA; feature extraction of ICs; and mental workload classification. The presented method is shown in Figure 4.
The above steps are as follows:
  • The 30-channel mixed EEG signals were filtered with 1 Hz high-pass filter and 30 Hz low-pass filter, respectively. The filtered EEG signals were X, m indicates the number of channels, and here m was 30.
  • The filtered EEG signals were separated by the ICA with EEGLAB in order to obtain the EEG ICs [39]. The input, (X1, X2,…, Xm), represents 30-channel filtered EEG signals. The optimal EEG ICs, (S1, S2,…,Sn), were found by matrix decomposition and optimization. Here n represents the number of ICs and n = 30. aij (I = 1,2,…,m; j = 1,2,…,n) represents the mixing parameters. The dimension of mixing matrix was 30×30. Because the relationship between the measured electrode points and the independent EEG signal source is fixed, each participant had a fixed mixing matrix, A.
  • From the data preprocessing in Section 2.1.2, there were 300 EEG segments for each mental workload. The number of EEG segments became 900 for three mental workloads. Each segment had 30 EEG ICs, and each EEG IC can extract four types of power spectra energy, so 120-dimensinal energy features were finally obtained.
  • All the energy features of EEG ICs can be obtained for three mental workloads of each participant. The number of segments for each participant was 900 and the dimension of each segment was 120. This was used as the input of the SVM classifier. The optimal parameters of the classifier were found through grid searching method. The cross-validation was performed to realize the three mental workload classifications.

3. Results of Classification Method Comparison

3.1. Comparison of Mental Workload Classification Using EEG and its ICs Features

This section will compare the classification accuracy by using the energy features of EEG ICs and just EEG. The former presented in this paper is named as Method 1, and the latter is named as Method 2. The implementation of the two methods is shown in Figure 5.
Method 1: It is proposed in this paper and realizes the mental workload classification by using the energy features of EEG ICs. This method uses the energy features of ICA to separate the EEG signals and obtains its 30 ICs. The four energy features are then extracted from the EEG ICs. The calculation method is shown in Equations (5) and (6). There is a total of 900 segments for three mental workloads, and 120-dimensional energy features for each segment.
Method 2: It realizes a mental workload classification by only using the energy features of EEG signals. This method directly extracts the energy features of the filtered EEG signals without using ICA to obtain the EEG ICs. The four energy features are extracted directly from each EEG segment.
The classification accuracy of two methods is compared and shown in Figure 6.
For the same data signals, the classification accuracy of the proposed method, Method 1, is in the range of 61% to 96%, and its average classification accuracy is 79.8%. The classification accuracy of Method 2 is between 54% and 64%, and its average classification accuracy is 55.9%. Compared with Method 2, the classification accuracy of Method 1 is higher by 13% to 37%, and the average classification accuracy is higher by 23.9%.

3.2. Comparison of Mental Workload Classification Using EEG and its ICs Features without Ocular artifacts(OAs)

This section introduces the mental workload classification based on EEG and its ICs without OAs. In order to remove the OAs from the raw EEG signals and EEG ICs, Method 3 and Method 4 were exclusively built, as shown in Figure 7.
In Method 3, as shown in Figure 7a, the OAs are removed from ICs of EEG using the ADJUST algorithm after the ICA process [40]. The ADJUST is a completely automatic algorithm that can identify artifact-related independent components by combining the artifact-specific spatial and temporal features. The ICs without OAs are directly extracted energy features, and then they are the input vectors for the SVM classifier.
In Method 4, as shown in Figure 7b, the OAs are removed from ICs of EEG using the ADJUST algorithm after the ICA process. The ICs without artifacts are reconstructed to EEG without OAs using the independent component reverse reconstruction processing. The energy features are extracted from EEG signals without OAs, and then they are the input vectors for the SVM classifier.
The accuracy comparison results of the above two methods are shown in Figure 8.
Method 3 and Method 4 both use the energy features without OAs to classify the mental workloads. The difference between the two methods is that Method 3 uses the energy features of the EEG ICs, and Method 4 uses the energy features of the EEG. From Figure 8, we can observe that the classification accuracy of Method 3 is between 60% and 97%, and its average classification accuracy is 76.9%. The classification accuracy of Method 4 is between 50% and 64%, and its average classification accuracy is 54.7%. The classification accuracy of Method 3 is much higher than that of Method 4. The difference of their average accuracies is 22.2%.

3.3. Performance Evaluation of Different Methods

The statistical hypothesis test provides an important basis for the learning performance comparison of methods in this paper. Based on the results of the hypothesis test, we can infer which one has better performance based on the same test set. The “hypothesis” in the hypothesis test is generally set to compare the performance of the two learning methods with the same significance.
In order to evaluate the performance of four different methods, Method 1 to Method 4, this paper chose the cross-validation paired t-tests for verification. The cross-validation requires independent sampling with a test error rate of generalized error rate. But due to the limited number of segments, the training sets of different rounds will overlap to a certain extent. In order to overcome this problem, this paper used five iterations of 2-fold cross-validation [41] (pp. 24–44).
We performed five replications of 2-fold cross-validation. In order to prevent the data division in five cross-validations from being repeated, the data was randomly shuffled before each 2-fold cross-validation. In each replication, the first fold cross-validation test error rates, e11 and e12, and second fold cross-validation test error rates, e21 and e22, were obtained. Their differences were calculated using Equation (6):
Δ 1 = | e 11 e 21 | Δ 2 = | e 22 e 12 |
The average of the two differences was calculated to ensure the non-independence of the test error rate.
μ i = 0.5 ( Δ i 1 + Δ i 2 )
where i ranges from 1 to 5; Δi1 and Δi2 is the differences of the first- and second-fold cross-validations in ith replication, respectively; μi is the average of the two differences.
The variance of the results of each 2-fold experiment was calculated as follows:
σ i 2 = ( Δ i 1 Δ i 1 + Δ i 2 2 ) 2 + ( Δ i 2 Δ i 1 + Δ i 2 2 ) 2
Finally, τ representing significance was obtained.
τ = μ 1 0.2 i = 1 5 σ i 2
where τ obeys the t distribution with 5 degrees of freedom, and its critical value is 2.5706 when degree of significance is 0.05, namely α. μ1 can be obtained by Equation (8), when I = 1.
The significance of the difference for the method performances can be judged by the value of τ. When τ > 2.5706, the hypothesis can be rejected, so the performance of the compared method has significant difference.
In this paper, the following hypotheses are established.
  • Hypothesis 1: The performance of Method 1 and Method 2 has the same significance, and α = 0.05. The true performance significance of Method 1 and Method 2 is represented as τ1.
  • Hypothesis 2: The performance of Method 1 and Method 3 has the same significance, and α = 0.05. The true performance significance of Method 1 and Method 3 is represented as τ2.
  • Hypothesis 3: The performance of Method 1 and Method 4 has the same significance, and α = 0.05. The true performance significance of Method 1 and Method 4 is represented as τ3.
  • Hypothesis 4: The performance of Method 2 and Method 3 has the same significance, and α = 0.05. The true performance significance of Method 2 and Method 3 is represented as τ4.
  • Hypothesis 5: The performance of Method 2 and Method 4 has the same significance, and α = 0.05. The true performance significance of Method 2 and Method 4 is represented as τ5.
  • Hypothesis 6: The performance of Method 3 and Method 4 has the same significance, and α = 0.05. The true performance significance of Method 3 and Method 4 is represented as τ6.
The values of τ16 are shown Table 2.
From Table 2, we can observe that:
(1) The range of τ1 is between 4.103 and 9.678. Each value is greater than the critical value, 2.5706, so Hypothesis 1 can be rejected, that is, the performance of Method 1 and Method 2 is significantly different. At the same time, it can be known from the classification accuracy that the error rate of Method 1 is lower than that of Method 2, so the Method 1 performs well. τ3, τ4 and τ6 can be analyzed in the same way.
(2) The range of τ2 is between 0.763 and 2.279. Each value is lower than the critical value, 2.5706, so Hypothesis 2 can be accepted, that is, the performance of Method 1 and Method 3 is not significantly different. At the same time, it can be known from the classification accuracy that the error rate of Method 3 is similar to Method 4, so there is no significant difference in the performance comparison of Method 1 and Method 3. τ5 can be analyzed in the same way.
It can be concluded from the above analysis that the method proposed in this paper has better classification performance than other methods, regardless of whether the artifact is removed or not.
However, the accuracies of Method 2 and Method 4 are relatively low. They realize the classification based on features of EEG signals. EEG signals are more difficult to analyze than EEG independent components because EEG signals are mixed signals. Just liking mixed speech signals, it is generally known that it is easy to identify the content of the speech signals for a single sound source. But for mixed sound sources, multiple speech signals are aliased, which makes the semantics ambiguous. So, the accuracy of Method 2 and Method 4 is relatively low.

3.4. Effect of The Number of ICs on Mental Workload Classification Based on EEG ICs Features

For the presented Method 1, the effect of the number of ICs on mental workload classification will be discussed in this section. The number of ICs is separately chosen as 5, 10, 15, 20, 25, and 30 in order to analyze its effect on the classification performance of mental workloads. The mental workload classification accuracies of six cases are shown in Table 3.
From Table 3, we can observe that the classification performance of Method 1 has improved gradually with the increase of the number of ICs. Among the 10 participants, nine participants have the highest classification accuracy when the number of ICs is 30, and one participant has the highest classification accuracy when the number of ICs is 20. However, the average accuracy of the 10 participants indicates that the classification accuracy is highest when the number of ICs is 30. Therefore, it is reasonable that the number of ICs in Method 1 is determined as 30 in this paper.

4. Discussion about Classifiers
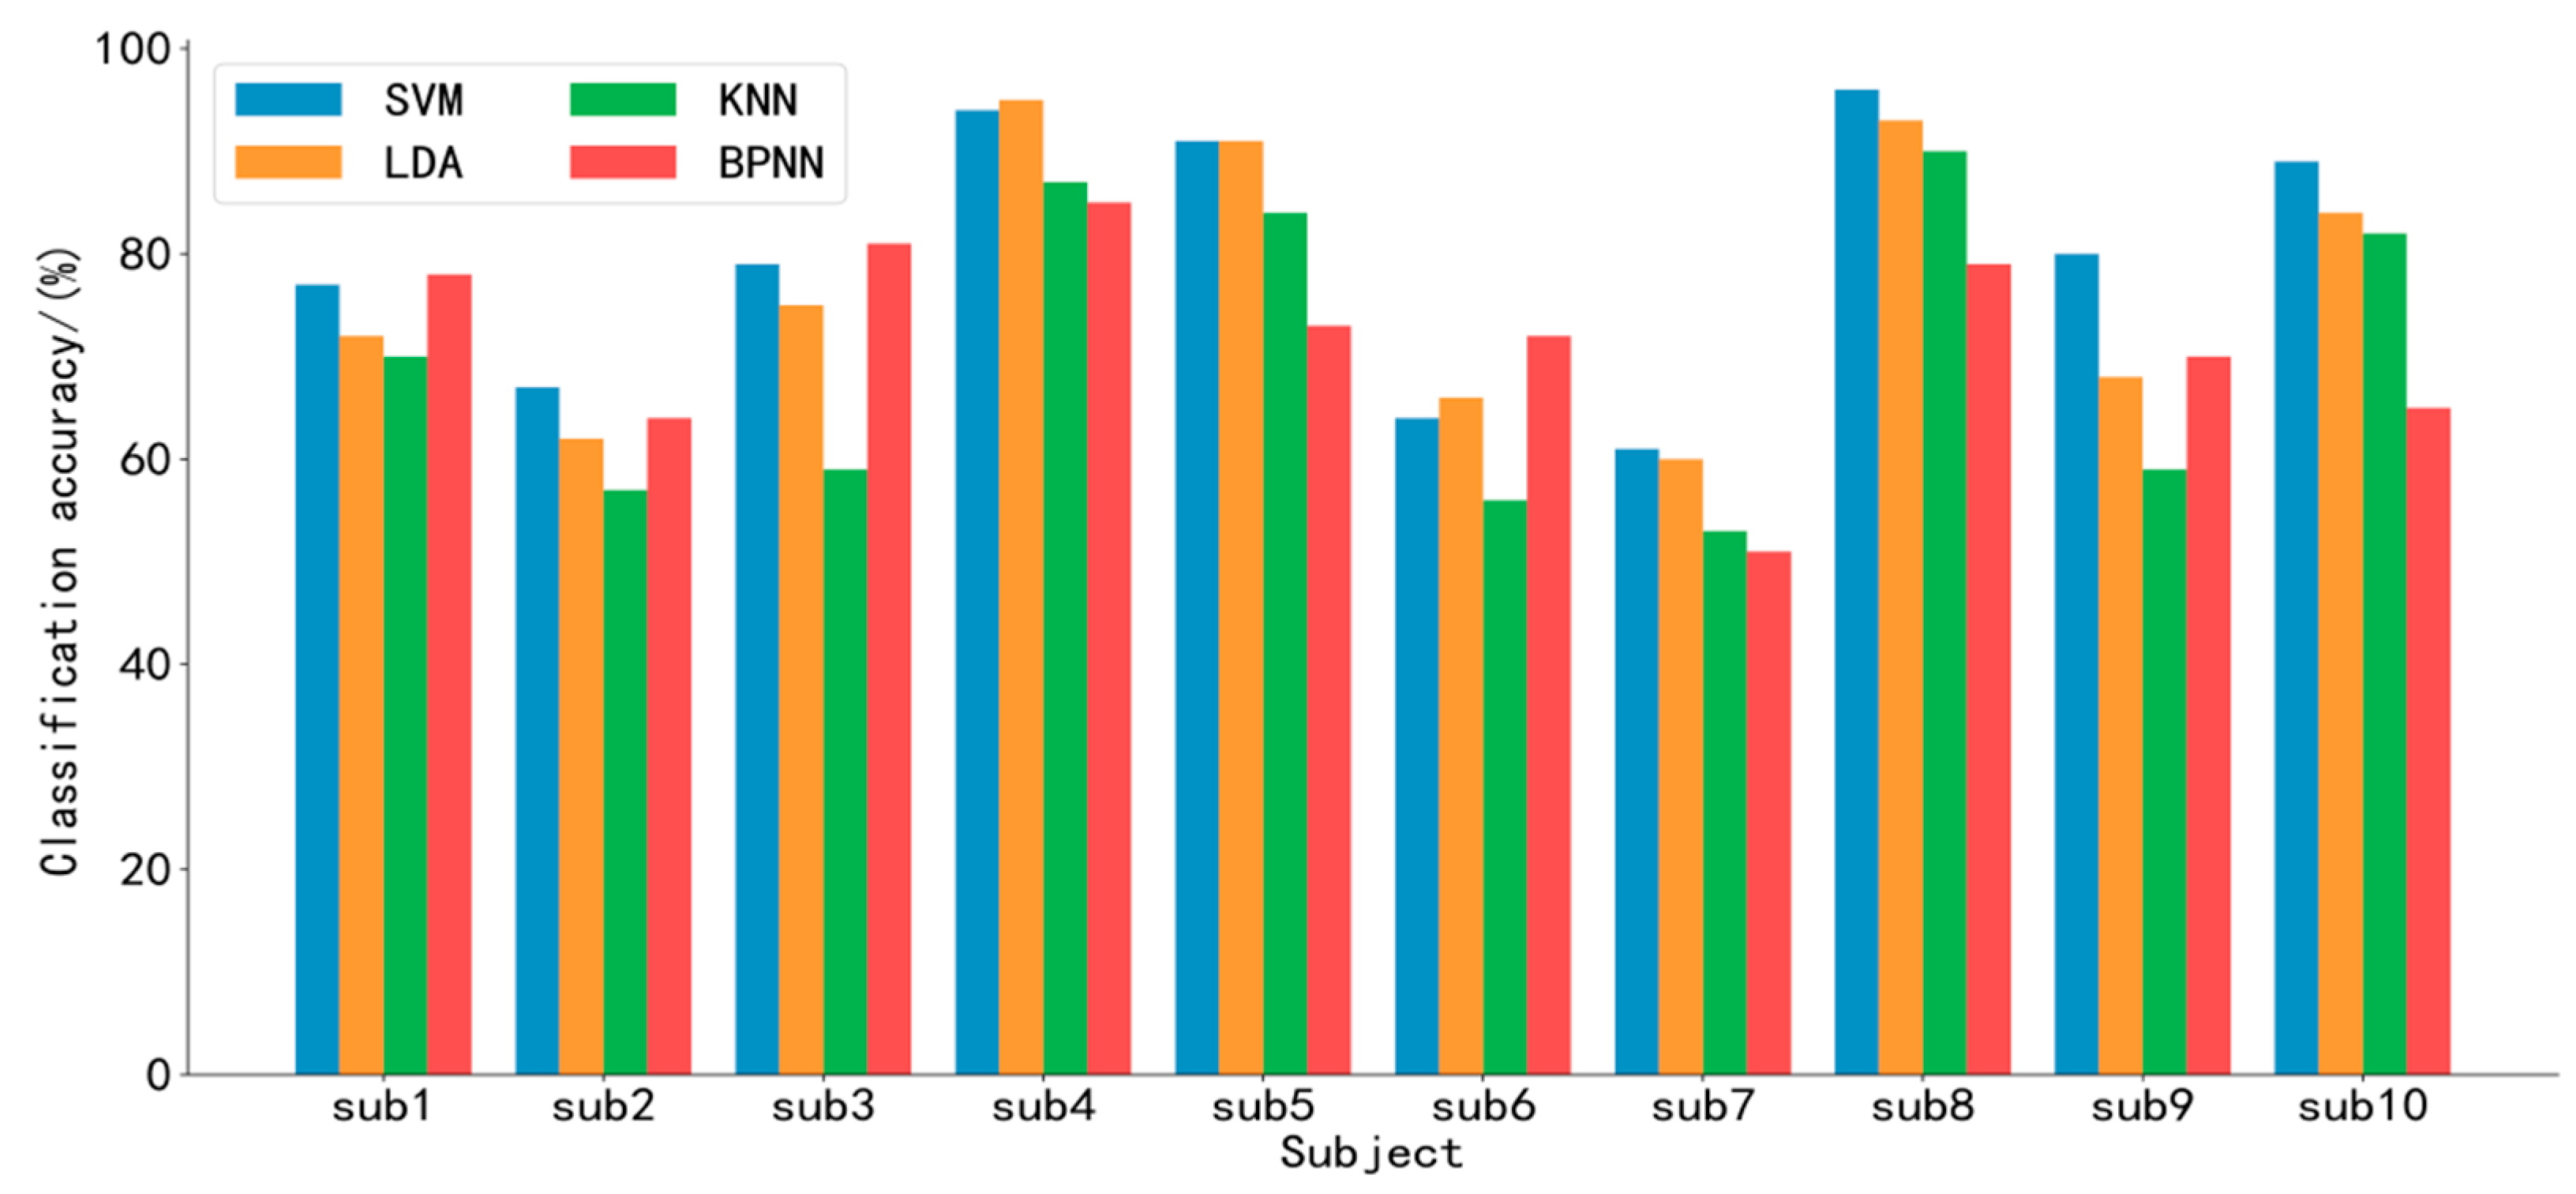
Method 1 presented in this paper uses the SVM classifier algorithm. In this section, we further discussion the influence of different classifier algorithms on the classification accuracy. The LDA, BPNN, and KNN classifiers are used in Method 1, separately, in order to compare with the SVM classifier. The classification accuracies of LDA, BPNN, KNN, and SVM are shown in Figure 9.
From Figure 9, we can observe that:
(1)
The accuracy range of SVM is between 61% and 94%, and its average accuracy is 79.8%;
(2)
The accuracy range of LDA is between 66% and 93%, and average accuracy is 76.6%;
(3)
The accuracy range of BPNN is between 51% and 85%, and average accuracy is 71.8%;
(4)
The accuracy range of KNN is between 53% and 90%, and average accuracy is 69.7%.
The ranges of classification accuracies of SVM and LDA are very close, but the average accuracy of SVM is higher than that of LDA. So, we select SVM as the classification method for different EEG processing methods. On the other hand, the classification accuracy of the SVM classifier is the highest.
It is normal that the classification accuracy of different subjects is different, but the accuracies of sub2, sub6 and sub7 are generally low. Through our research, we find that the low classification accuracy of individual subjects is related to their own mental states. Some people have no significant change in mental state during the three load tasks, so that their mental workloads are not clearly distinguished. We will focus on this issue in future studies.

5. Conclusions

In this study, we propose a mental workload classification method based on EEG IC features for vision and operation tasks. This method, named Method 1, contains four steps: filtering the measured EEG signals; using ICA to obtain EEG ICs; extracting their energy features; and classifying them. The energy features of EEG ICs are implemented to overcome the problem of low accuracy. The proposed method can realize fast, accurate, and automatic mental workload classification. Based on the comparison results of four classification methods, some conclusions can be drawn as follows:
  • Compared with Method 2 based on EEG signal features, the classification accuracy of our presented method is improved from 55.9% to 79.8%. The classification accuracies of Method 3 and Method 4 are compared, and their average difference is 22.2%. Therefore, the classification method based on EEG ICs features proposed in this paper is superior to the classification method based on EEG signal features.
  • The different numbers of ICs are adopted to extract the energy features and classify the mental workloads. The results reveal that the classification accuracy can be improved with the increase of the numbers of ICs.

Author Contributions

Conceptualization: H.Q.; methodology: Y.S.; software: Y.L.; validation: Y.L., Y.S., and H.Q.; formal analysis: H.Q.; investigation: Z.F.; resources: L.P. and J.Z.; data curation: Y.S.; writing—original draft preparation: Y.S.; writing—review and editing: Y.S. and L.P.; visualization: Y.L.; supervision: X.W.; project administration: H.Q.; funding acquisition: L.P. All authors have read and agreed to the published version of the manuscript.

Funding

The research is supported by Liao Ning Revitalization Talents Program (XLYC1802092), and the jointly program of National Natural Science Foundation of China and Civil Aviation Administration of China (No.U1733118).

Acknowledgments

The authors are grateful to the anonymous reviewers for their critical and constructive review of the manuscript. Their comments helped to increase the quality and readability of the manuscript. We also want to thank the subjects for their contributions to the experiment and would like to thank Meihan Wang and Liang Guo for conducting the experiments in the laboratory.

Conflicts of Interest

The authors declare no conflicts of interest.

References

  1. Hao, G.; Zhong, Y. Mental Workload Assessment Based on EEG and A Hybrid Ensemble Classifier. Softw. Guide 2019, 18, 1–4. [Google Scholar]
  2. Salomao, T.; Alberto, L. Operator Functional State Modelling and Adaptive Control of Automation in Human-Machine Systems. Ph.D. Thesis, University of Sheffield, Sheffield, UK, 2016. [Google Scholar]
  3. Van, E.J.B.F.; Brouwer, A.M.; Zander, T.O. Editorial: Using neurophysiological signals that reflect cognitive or affective state. Front. Neurosci. 2015, 9. [Google Scholar] [CrossRef] [Green Version]
  4. Schalk, G.; McFarland, D.J.; Hinterberger, T.; Birbaumer, N.; Wolpaw, J.R. BCI2000: A General-Purpose Brain-Computer Interface (BCI) System. IEEE Trans. Biomed. Eng. 2004, 51, 1034–1043. [Google Scholar] [CrossRef] [PubMed]
  5. Naseer, N.; Hong, K.S. Classification of functional near-infrared spectroscopy signals corresponding to the right- and left-wrist motor imagery for development of a brain–computer interface. Neurosci. Lett. 2013, 553, 84–89. [Google Scholar] [CrossRef] [PubMed]
  6. Hong, K.S.; Naseer, N.; Kim, Y.-H. Classification of prefrontal and motor cortex signals for three-class fNIRS–BCI. Neurosci. Lett. 2015, 587, 87–92. [Google Scholar] [CrossRef] [PubMed]
  7. Naseer, N.; Hong, K.S. fNIRS-based brain-computer interfaces: A review. Front. Hum. Neurosci. 2015. [Google Scholar] [CrossRef] [Green Version]
  8. Naseer, N.; Hong, M.J.; Hong, K.S. Online binary decision decoding using functional near-infrared spectroscopy for the development of brain–computer interface. Exp. Brain Res. 2014, 232, 555–564. [Google Scholar] [CrossRef]
  9. Fitzgibbon, S.P.; Pope, K.J.; Mackenzie, L.; Clark, C.R.; Willoughby, J.O. Cognitive tasks augment gamma EEG power. Clin. Neurophysiol. 2004, 115, 1802–1809. [Google Scholar] [CrossRef]
  10. Li, Z.; Dong, Y.; Guo, X. Hybrid brain-computer interface system based on α wave and motor imagery. J. Electron. Meas. Instrum. 2014, 28, 625–629. [Google Scholar] [CrossRef]
  11. Haslegrave, C. Psychophysiology and the electronic workplace: Antony Gale and Bruce Christie. Appl. Ergon. 1989, 20, 59. [Google Scholar] [CrossRef]
  12. Fu, Q. Analysis of Driving Fatigue Detection Based on EEG Identification Combined with Vehicle Manipulation Features. Electron. Test. 2016. [Google Scholar] [CrossRef]
  13. Wangfu, W.; Hong, W. EEG characteristic analysis of coach bus drivers in fatigue state. Chin. J. Sci. Instrum. 2013, 34, 1146–1152. [Google Scholar]
  14. Kristeva-Feige, R.; Fritsch, C.; Timmer, J.; Lücking, C.H. Effects of attention and precision of exerted force on beta range EEG-EMG synchronization during a maintained motor contraction task. Clin. Neurophysiol. 2002, 113, 124–131. [Google Scholar] [CrossRef]
  15. Sandra, G.H. Nasa-Task Load Index (NASA-TLX); 20 Years Later. Proc. Human Factors Ergon. Soc. Annu. Meet. 2006, 50, 904–908. [Google Scholar] [CrossRef] [Green Version]
  16. Hart, S.G.; Staveland, L.E. Development of NASA-TLX (Task Load Index): Results of empirical nd theoretical research. Hum. Ment. Workload 1988, 1, 139–183. [Google Scholar]
  17. Lemm, S.; Benjamin, B.; Thorsten, D.; Klaus-Robert, M. Introduction to machine learning for brain imaging. NeuroImage 2011, 56, 387–399. [Google Scholar] [CrossRef]
  18. Burcu, C.; Bert, A.; Roberto, L.; Marca, G.T. Monitoring of mental workload levels during an everyday life office-work scenario. Pers. Ubiquitous Comput. 2013, 17, 229–239. [Google Scholar]
  19. Liu, W.P.; Nie, J.F.; Jin, Y.; Xie, F. Recognition Method of Information Processing Mental Workload Based on Electroencephalogram. Sci. Technol. Eng. 2017, 17, 35–41. [Google Scholar]
  20. Zhao, G.; Liu, Y.J.; Shi, Y.; Liu, Y.J. Real-Time Assessment of the Cross-Task Mental Workload Using Physiological Measures during Anomaly Detection. IEEE Trans. Hum. Mach. Syst. 2018, 48, 149–160. [Google Scholar] [CrossRef]
  21. Li, H.Y.; Ren, G.L. Blind Separation of Noisy Mixed Speech Signals Based Independent Component Analysis. In Proceedings of the International Conference on Pervasive Computing Signal Processing & Applications, Harbin, China, 17–19 September 2010; IEEE Computer Society: Washington, DC, USA, 2010. [Google Scholar] [CrossRef]
  22. John, P. Lynch, Price Code A, and Price Code A National Aeronautics and Space Administration (NASA); Springer: Berlin/Heidelberg, Germany, 2011. [Google Scholar] [CrossRef]
  23. Feng, C.; Wan, X.; Liu, S. Influence of different attention allocation strategies under workloads on situation awareness. Acta Aeronaut. Astronaut. Sin. 2020, 31, 123307. [Google Scholar] [CrossRef]
  24. Do We Really Use Only 10 Percent of our Brain? Available online: https://www.britannica.com/story/do-we-really-use-only-10-percent-of-our-brain (accessed on 13 January 2020).
  25. Rasheed, T.; Lee, Y.K. Constrained Blind Source Separation of Human Brain Signals. Available online: http://uclab.khu.ac.kr/resources/thesis/PhD_Thesis_Tahir.pdf (accessed on 19 March 2020).
  26. Bell, A.J.; Sejnowski, T.J. Blind Separation and Blind Deconvolution: An Information-Theoretic Approach. Neural Comput. 1995, 7, 1000–1034. [Google Scholar] [CrossRef] [PubMed]
  27. Comon, P. Independent component analysis, a new concept? Signal Process. 1994, 36, 287–314. [Google Scholar] [CrossRef]
  28. Azad, H.; Hatam, M. Maximum likelihood independent component analysis using GA and PSO. In Proceedings of the 2016 24th IRANIAN Conference on Electrical Engineering, Shiraz, Iran, 10–12 May 2016. [Google Scholar]
  29. Li, M. Blind source separation based on improved particle swarm optimization. In Proceedings of the 2009 International Conference on Artificial Intelligence and Computational Intelligence, Shanghai, China, 7–8 November 2009. [Google Scholar]
  30. Krusienski, D.; Jenkins, W. Nonparametric density estimation based independent component analysis via particle swarm optimization. In Proceedings of the (ICASSP′05). IEEE International Conference on Acoustics, Speech, and Signal Processing, Philadelphia, PA, USA, 23–23 March 2015. [Google Scholar]
  31. Hyvärinen, A.; Oja, E. A fast fixed-point algorithm for independent component analysis. Neural Comput. 1997, 9, 1483–1492. [Google Scholar] [CrossRef]
  32. Venables, L.; Fairclough, S.H. The influence of performance feedback on goal-setting and mental effort regulation. Motiv. Emot. 2009, 33, 63–74. [Google Scholar] [CrossRef]
  33. Murata, A. An attempt to evaluate mental workload using wavelet transform of EEG. Hum. Factors J. Hum. Factors Ergon. Soc. 2005, 47, 498–508. [Google Scholar] [CrossRef]
  34. Borghini, G.; Astolfi, L.; Vecchiato, G.; Mattia, D.; Babiloni, F. Measuring neurophysiological signals in aircraft pilots and car drivers for the assessment of mental workload, fatigue and drowsiness. Neurosci. Biobehav. Rev. 2014, 44, 58–75. [Google Scholar] [CrossRef]
  35. Riffenburgh, R.H.; Clunies-Ross, C.W. Linear Discriminant Analysis. Pac. Sci. 1960, 14, 27–33. [Google Scholar] [CrossRef]
  36. Lin, D.; Duan, F.; Li, W.; Shen, J.; Luo, X. Optimizing the Individual Differences of EEG Signals through BP Neural Network Algorithm for a BCI Dialing System. In Lecture Notes in Computer Science, Proceedings of the International Conference on Brain and Health Informatics, Maebashi, Japan, 29–31 October 2013; Springer: Cham, Switzerland, 2013. [Google Scholar] [CrossRef]
  37. Guo, G.; Hui, W.; Bell, D.A.; Bi, Y.; Greer, K. KNN Model-Based Approach in Classification. In Proceedings of the Move to Meaningful Internet Systems 2003: CoopIS, DOA, and ODBASE—OTM Confederated International Conferences, CoopIS, DOA, and ODBASE 2003, Catania, Sicily, Italy, 3–7 November 2003. [Google Scholar] [CrossRef]
  38. Sun, Z.; Qiao, Y.; Lelieveldt, B.P.F.; Staring, M. For the Alzheimer’s Disease NeuroImaging Initiative. Integrating spatial-anatomical regularization and structure sparsity into SVM: Improving interpretation of Alzheimer’s disease classification. NeuroImage 2018, 178, 445–460. [Google Scholar] [CrossRef]
  39. Brunner, C.; Delorme, A.; Makeig, S. Eeglab—An Open Source Matlab Toolbox for Electrophysiological Research. Biomed. Tech./Biomed. Eng. 2013, 58. [Google Scholar] [CrossRef] [Green Version]
  40. Mognon, A.; Jovicich, J.; Bruzzone, L.; Buiatti, M. ADJUST: An automatic EEG artifact detector based on the joint use of spatial and temporal features. Psychophysiology 2011, 48, 229–240. [Google Scholar] [CrossRef]
  41. Zhihua, Z. Machine Learning; Tsinghua University Press: Beijing, China, 2016; pp. 24–44. [Google Scholar]
Figure 1. Channel location.
Applsci 10 03036 g001
Figure 2. Task interface of MATB-II.
Applsci 10 03036 g002
Figure 3. Similarity analysis of signal mixing process of electroencephalogram (EEG) and speech. (a) Signal mixing process of EEG; (b) Signal mixing process of speech.
Applsci 10 03036 g003
Figure 4. Mental workload classification method based on features of EEC independent components (ICs).
Applsci 10 03036 g004
Figure 5. Implementation of Method 1 (a) and Method 2 (b).
Applsci 10 03036 g005
Figure 6. Classification accuracy comparison of Method 1 and Method 2.
Applsci 10 03036 g006
Figure 7. Implementation of Method 3 (a) and Method 4 (b).
Applsci 10 03036 g007
Figure 8. Classification accuracy comparison of Method 3 and Method 4.
Applsci 10 03036 g008
Figure 9. Classification accuracy comparison of different classifiers.
Applsci 10 03036 g009
Table 1. Occurrence frequency of four tasks.
Task TitleTask ContentLMW
MMW
HMW
System MonitoringMonitor the scales of F1-F4 in Area 1 and response with mouse when the scales are not around the center.11224
TrackingIn Area 2, keep the target at the grid center by joystick in MANUAL mode and no action is required in AUTO mode.11224
SchedulingMonitor scheduling bar in Area 3 and response to the activated communication with keyboard immediately.11224
Resource ManagementMonitor oil volume in tanks and pump status in Area 4. Click the corresponding oil pump with mouse when failure occurs.11224
Table 2. Comparison of τ.
Subjectτ1τ2τ3τ4τ5τ6
sub 19.6782.1259.2763.4931.5674.130
sub 28.1951.86714.9694.2321.8505.019
sub 39.3510.76310.6763.2822.1604.378
sub 46.8411.4597.2343.1311.6863.424
sub 54.6052.0579.5104.9921.8984.092
sub 65.5412.21811.7685.9471.4155.656
sub 75.3921.85614.5153.2081.6403.968
sub 86.8911.7208.9106.4101.9575.615
sub 95.4051.9349.6383.1372.2227.165
sub 104.1032.2798.2043.9242.3824.352
Table 3. Mental workload classification accuracy (%) with different numbers of ICs in Method 1.
Subject51015202530
sub 151%61%67%69%64%63%
sub 251%52%52%54%52%55%
sub 340%42%58%56%63%66%
sub 457%58%64%75%83%86%
sub 556%64%72%76%77%79%
sub 641%49%52%56%54%58%
sub 750%54%48%53%52%57%
sub 850%60%70%77%77%77%
sub 953%52%56%60%59%61%
sub 1062%68%71%68%75%75%

