Article

Optimal Scheduling of Large-Scale Wind-Hydro-Thermal Systems with Fixed-Head Short-Term Model

1
Power System Optimization Research Group, Faculty of Electrical and Electronics Engineering, Ton Duc Thang University, Ho Chi Minh City 700000, Vietnam
2
Electrical and Computer Engineering (ECE) Department, University of Windsor, Windsor, ON N9B 1K3, Canada
3
Faculty of Electrical and Electronics Engineering, Ho Chi Minh City University of Technology and Education, Ho Chi Minh City 700000, Vietnam
*
Author to whom correspondence should be addressed.
Appl. Sci. 2020, 10(8), 2964; https://doi.org/10.3390/app10082964
Submission received: 27 March 2020 / Revised: 18 April 2020 / Accepted: 21 April 2020 / Published: 24 April 2020
(This article belongs to the Special Issue Integration of High Voltage AC/DC Grids into Modern Power Systems)

Abstract

:
In this paper, a Modified Adaptive Selection Cuckoo Search Algorithm (MASCSA) is proposed for solving the Optimal Scheduling of Wind-Hydro-Thermal (OSWHT) systems problem. The main objective of the problem is to minimize the total fuel cost for generating the electricity of thermal power plants, where energy from hydropower plants and wind turbines is exploited absolutely. The fixed-head short-term model is taken into account, by supposing that the water head is constant during the operation time, while reservoir volume and water balance are constrained over the scheduled time period. The proposed MASCSA is compared to other implemented cuckoo search algorithms, such as the conventional Cuckoo Search Algorithm (CSA) and Snap-Drift Cuckoo Search Algorithm (SDCSA). Two large systems are used as study cases to test the real improvement of the proposed MASCSA over CSA and SDCSA. Among the two test systems, the wind-hydro-thermal system is a more complicated one, with two wind farms and four thermal power plants considering valve effects, and four hydropower plants scheduled in twenty-four one-hour intervals. The proposed MASCSA is more effective than CSA and SDCSA, since it can reach a higher success rate, better optimal solutions, and a faster convergence. The obtained results show that the proposed MASCSA is a very effective method for the hydrothermal system and wind-hydro-thermal systems.

1. Introduction

Short-term hydrothermal scheduling considers optimization horizon from one day to one week, involving the hour-by-hour generation planning of all generating units in the hydrothermal system, so that the total generation fuel cost of thermal units is minimized, while satisfying all constraints from hydropower plants, including hydroelectric power plant constraints, such as water discharge limits, volume reservoir limits, continuity water, generation limits, and thermal power plant constraints, including prohibited operating zone and generation limits. There is a fact that the load demand changes cyclically over one day or one week, and varies corresponding to the short-term scheduling horizon, which is in a range from one day to one week. A set of beginning conditions, consisting of initial and final reservoir volumes for the scheduling horizon, inflow into the reservoir, and the water amount to be used for the scheduling horizon, is assumed to be known. During the scheduling generation process, it is necessary to consider the capacity of the reservoir and inflow once they have significant impacts on the water head variations, and lead to being represented by different hydro models. In this paper, a fixed-head short-term hydrothermal scheduling with reservoir volume constraints is considered. The reservoir water head is supposed to be fixed during the scheduling horizon [1]. Therefore, the water discharge is still the second-order function of hydro generation and given coefficients. The total amount of water is not required to be calculated and constrained. However, the initial and final values of the Reservoir Volume Should Be met with the optimal operation of the hydrothermal system. The capacity of the reservoir to contain water during the operation must be observed and followed by the constrained values, such as minimum volume corresponding to the deadhead and maximum volume corresponding to the highest head. Moreover, the continuity of water is always constrained at each subinterval over the scheduling horizon. Other issues related to power transmission lines, such as power balance and power losses, are also taken into account for most test systems.
The problem has been studied so far and obtained many intentions from researchers. Several algorithms, such as Gradient Search Algorithm (GSA) [2], Newton–Raphson Method (NRM) [3], Hopfield Neural Networks (HNN) [4], Simulated Annealing Algorithm (SAA) [5], Evolutionary Programming Algorithm (EPA) [6,7,8], Genetic Algorithm (GA) [9], modified EPA (MEPA) [10], Fast Evolutionary Programming Algorithm (FEPA) [10], Improved FEPA (IFEPA) [10], Hybrid EPA (HEPA) [11], Particle Swarm Optimization (PSO) [12], Improved Bacterial Foraging Algorithm (IBFA) [13], Self-Organization Particle Swarm Optimization (SOPSO) [14], Running IFEPA (RIFEPA) [15], Improved Particle Swarm Optimization (IPSO) [16,17], Clonal Selection Optimization Algorithm (CSOA) [18], Full Information Particle Swarm Optimization (FIPSO) [19], One-Rank Cuckoo Search Algorithm with the applications of Cauchy (ORCSA-Cauchy) and Lévy distribution (ORCSA-Lévy) [20], Cuckoo Search Algorithm with the applications of Gaussian distribution (CSA-Gauss), Cauchy distribution (CSA-Cauchy), and Lévy distribution (CSA-Lévy) [21], Adaptive Cuckoo Search Algorithm (ACSA) [22], Improved Cuckoo Search Algorithm (ICSA) [23], Modified Cuckoo Search Algorithm (MCSA) [24], and Adaptive Selective Cuckoo Search Algorithm (ASCSA) [24] have been applied to solve the problem of hydrothermal scheduling. Almost all of the above-mentioned methods are mainly meta-heuristic algorithms, excluding GSA and NRM. Regarding the development history, GSA and NMR are the oldest methods, with the worst capabilities to deal with constraints and finding high-quality parameters of the problem, and they are applied for hydropower generation function with the piecewise linear form or polynomial approximation form. GSA cannot deal with the systems with complex constraints and also the systems with a large number of constraints and variables. NRM seems to be more effective than GSA when applied to systems where the approximation of the hydro generation cannot be performed. However, this method is fully dependent on the scale of the Jacobian matrix and the capability of taking the partial derivative of the Jacobian matrix with respect to each variable. On the contrary to GSA and NRM, population-based metaheuristic algorithms are successfully applied for solving the complicated problem. Among those methods, SAA and GA are the oldest methods and found low-quality solutions for hydropower plants and thermal power plants. Differently, PSO and EPA variants are more effective in reaching better solutions with faster speed. The improved versions of EPA are not verified, while they were claimed to be much better than conventional EPA. Only one-thermal and one-hydropower plant system and quadratic fuel cost function is employed as the case study for running those methods. In order to improve the conventional PSO successfully, weight factor [16] and constriction factor [17] are respectively used to update new velocity and new position. The improvement also leads to an optimal solution with shorter execution time, but the two research studies report an invalid optimal solution, since the water discharge violates the lower limit. In [19], the new version of the updated velocity of the FIPSO is proposed and tested on a system. However, the method reports an invalid solution violating the lower limit. IBFA [13] also shows an invalid optimal solution with more water than availability. CSOA is demonstrated to be stronger than GA, EP, and Differential Evolution (DE) for this problem. CSA variants [20,21,22,23,24] are developed for the problem and reached better results. Different distributions are tested to find the most appropriate one as compared to original distribution, which is Lévy distribution. Cauchy and Gaussian distributions also result in the same best solution for the system with four hydropower plants and one thermal power plant, but the two distributions cope with a low possibility of finding the best solution.
In recent years, wind energy has been considered as a power source, together with conventional power plants, to supply electricity to loads. The optimal scheduling of thermal power plants and wind turbines is successfully solved using the Artificial Bee Colony Algorithm (ABCA) [25] and Wait-And-See Algorithm (WASA) [26]. Then, the wind-thermal system is expanded by integrating one more conventional power source, which is a hydropower plant, leading to the wind-hydro-thermal system. The optimal scheduling of the wind-hydro-thermal system is performed using different metaheuristic algorithms, such as Nondominated Sorting Genetic Algorithm-III (NSGA-III) [27], Multi-Objective Bee Colony Optimization Algorithm (MOBCOA) [28], Distributionally Robust Hydro-Thermal-Wind Economic Dispatch (DR-HTW-ED) method [29], nonlinear and dynamic Optimal Power Flow (OPF) method [30], Modified Particle Swarm Optimization (MPSO) [31], Mixed Binary and Real Number Differential Evolution (MBRNDE) [32], Mixed-Integer Programming (MIP) [33], Two-Stage Stochastic Programming Model Method (TSSPM) [34], and Sine Cosine Algorithm (SCA) [35]. In general, almost all applied methods are meta-heuristic algorithms and the purpose of those studies is to demonstrate the highly successful constraint handling capability of the applied metaheuristic algorithms, rather than showing high-quality solution searching capability.
In this paper, wind farms, together with the hydrothermal system, are considered to supply electricity to loads, in which the fixed-head short-term hydrothermal system is investigated. The objective of the Optimal Scheduling of Wind-Hydro-Thermal System (OSWHTS) problem is to minimize total electricity generation fuel cost of thermal power plants in a day, subject to the wind farms, reservoirs, and thermal units’ constraints. In the fixed-head short-term model, water discharge is a second-order equation, with respect to the power output of the hydropower plant. In addition, hydraulic constraints are discharge limits, reservoir volume limits, initial reservoir volume, and end reservoir volume. In order to solve the OSWHTS problem successfully and effectively, a Modified Adaptive Selection Cuckoo Search Algorithm (MASCSA) is proposed by applying two new modifications on the Adaptive Selection Cuckoo Search Algorithm (ASCSA), which was first developed in [24]. In addition, other metaheuristic algorithms are implemented for comparisons. The implemented algorithms are CSA [36] and SDCSA [37]. CSA was first introduced by Yang and Deb in 2009 [36], and it has been widely applied for different optimization problems in electrical engineering. However, CSA is indicated to be less effective for large and complicated problems [24,37]. Hence, SDCSA and ASCSA are proposed. SDCSA is applied only for benchmark functions, while ASCSA is more widely applied for three complicated hydrothermal scheduling problems. ASCSA is superior to many existing meta-heuristic algorithms, such as GA, DE, and other CSA variants. ASCSA is an improved version of CSA, by implementing two more modifications, including a new selection technique and an adaptive mutation mechanism. ASCSA can reach high performance, but it suffers from long simulation time, due to the selection of mutation factor and threshold. Thus, in this paper, two new modifications, including setting the mutation factor to one and proposing a new condition for replacing the threshold, are applied.
The novelties of the paper are the integration of wind turbines and the fixed-head short-term hydrothermal system and a proposed CSA, called MASCSA. Thanks to the novelties, the main contributions of the study are the most appropriate selection of control variables for the optimal scheduling of the wind-hydro-thermal system, the effective constraint handling method, and the high performance proposed MASCSA method.
The rest of the paper is organized as follows. The formulation of the OSWHTS problem is given in Section 2. The details of the proposed method are described in Section 3. The search process of MASCSA for the OSWHTS problem is presented in Section 4. The comparison results of the two test systems are given in Section 5. Finally, the conclusions are summarized in Section 6.

2. Formulation of Optimal Scheduling of Wind-Hydro-Thermal System

In this section, the optimal scheduling problem of the wind-hydro-thermal system with the fixed-head short-term model of a hydropower plant is mathematically expressed considering the objective function and constraints. A typical wind-hydro-thermal system is shown in Figure 1. From the figure, Nh hydropower plants, Nt thermal power plants, and Nw turbines in a wind farm are generating and supplying electricity to loads via different buses. The purpose of the system is to minimize the total electricity generation cost of Nt thermal power plants, considering the available water in reservoirs and the intermittent nature of wind power. The cost of generated power by hydropower plants and the wind farm is neglected, but all constraints from the plants are supervised. The objective function and all constraints can be mathematically formulated as follows:

2.1. Total Electricity Generation Fuel Cost Reduction Objective

Total fuel cost for generating electricity from all thermal power plants is considered as a major part that needs to be minimized as much as possible. The objective is shown as follows:
T F C = j = 1 N s t p = 1 N t t i ( k t p + m t p P T t p , i + n t p , i ( P T t p , i ) 2 + | α t p × sin ( β t p × ( P T t p , m i n P T t p , i ) ) | )

2.2. Set of Constraints and Wind Model

2.2.1. Constraints from Hydropower Plants

Hydropower plants are constrained by limits of reservoirs, turbines, and generators. The detail is expressed as follows:
Water Balance Constraint: The reservoir volume at the ith considered subinterval is always related to the volume of previous subinterval, water inflow, and water discharge. All the parameters must be supervised so that the following equality is exactly met.
R V h p , i 1 R V h p , i + W I h p , i Q h p , i = 0 , i = 1 ,   2 , , N s
Note that RVhp,i−1 is equal to Vhp,0, if i = 1 , and RVhp,i is equal to RVhp,Ns, if i = N s .
Initial and Final Volumes Constraints: Vhp,0 and Vhp,Ns in constraint (2) should be equal to two given parameters, as shown in the model below.
R V h p , 0 = R V h p , s t a r t
R V h p , N s = V h p , e n d
For each operating day, initial volume, RVhp,start, and final volume, RVhp,end, of each reservoir are required to be always exactly met.
Reservoir Operation Limits: Water volume of reservoirs must be within the upper and lower limits in order to assure that the water head is always in operation limits. Therefore, the following inequality is an important constraint.
R V h p , m i n R V h p , i R V h p , m a x , { h p = 1 ,   2 , ,   N h i = 1 ,   2 , , N s
Limits of Discharge Through Turbines: Turbines of each hydropower plant is safe, if the water discharge through them does not exceed the limits. Both upper and lower limits have a huge meaning for the safety and stable operation of turbines. Thus, the following constraints are considered.
q h p , m i n q h p , i q h p , m a x , { h p = 1 ,   2 , ,   N h i = 1 ,   2 , , N s
where qhp,i is determined as follows:
q h p , i = x h p + y h p P H h p , i + z h p ( P H h p , i ) 2
In addition, the total discharge of each subinterval is determined as follows:
Q h p , i = t i q h p , i
Limits of Hydropower Plant Generators: The power generation of each hydropower plant must follow the inequality below, to assure the safe operation of generators all the time.
P H h p , m i n P H h p , i P H h p , m a x , { h p = 1 ,   2 , ,   N h i = 1 ,   2 , , N s

2.2.2. Constraint of Thermal Power Plant

It is supposed that thermal power plants have plentiful fossil fuel and their energy is not constrained. However, thermal power plant generators have to satisfy physical limits similar to generators of hydropower plants. Namely, the power generation is limited as follows:
P T t p , m i n P T t p , i P T t p , m a x , { t p = 1 ,   2 , ,   N t i = 1 ,   2 , , N s

2.2.3. Constraints of Power Systems

Power systems require the balance between the generated and consumed power for the stable voltage and frequency in power systems [38,39,40,41,42,43]. The power generation of all hydropower plants and thermal power plants, and power consumed by load and lines must follow the equality below:
t p = 1 N t P T t p , i h p = 1 N h P H h p , i + w = 1 N w P W w , i P L , i P T L , i = 0

2.2.4. Modeling of Wind Uncertainty

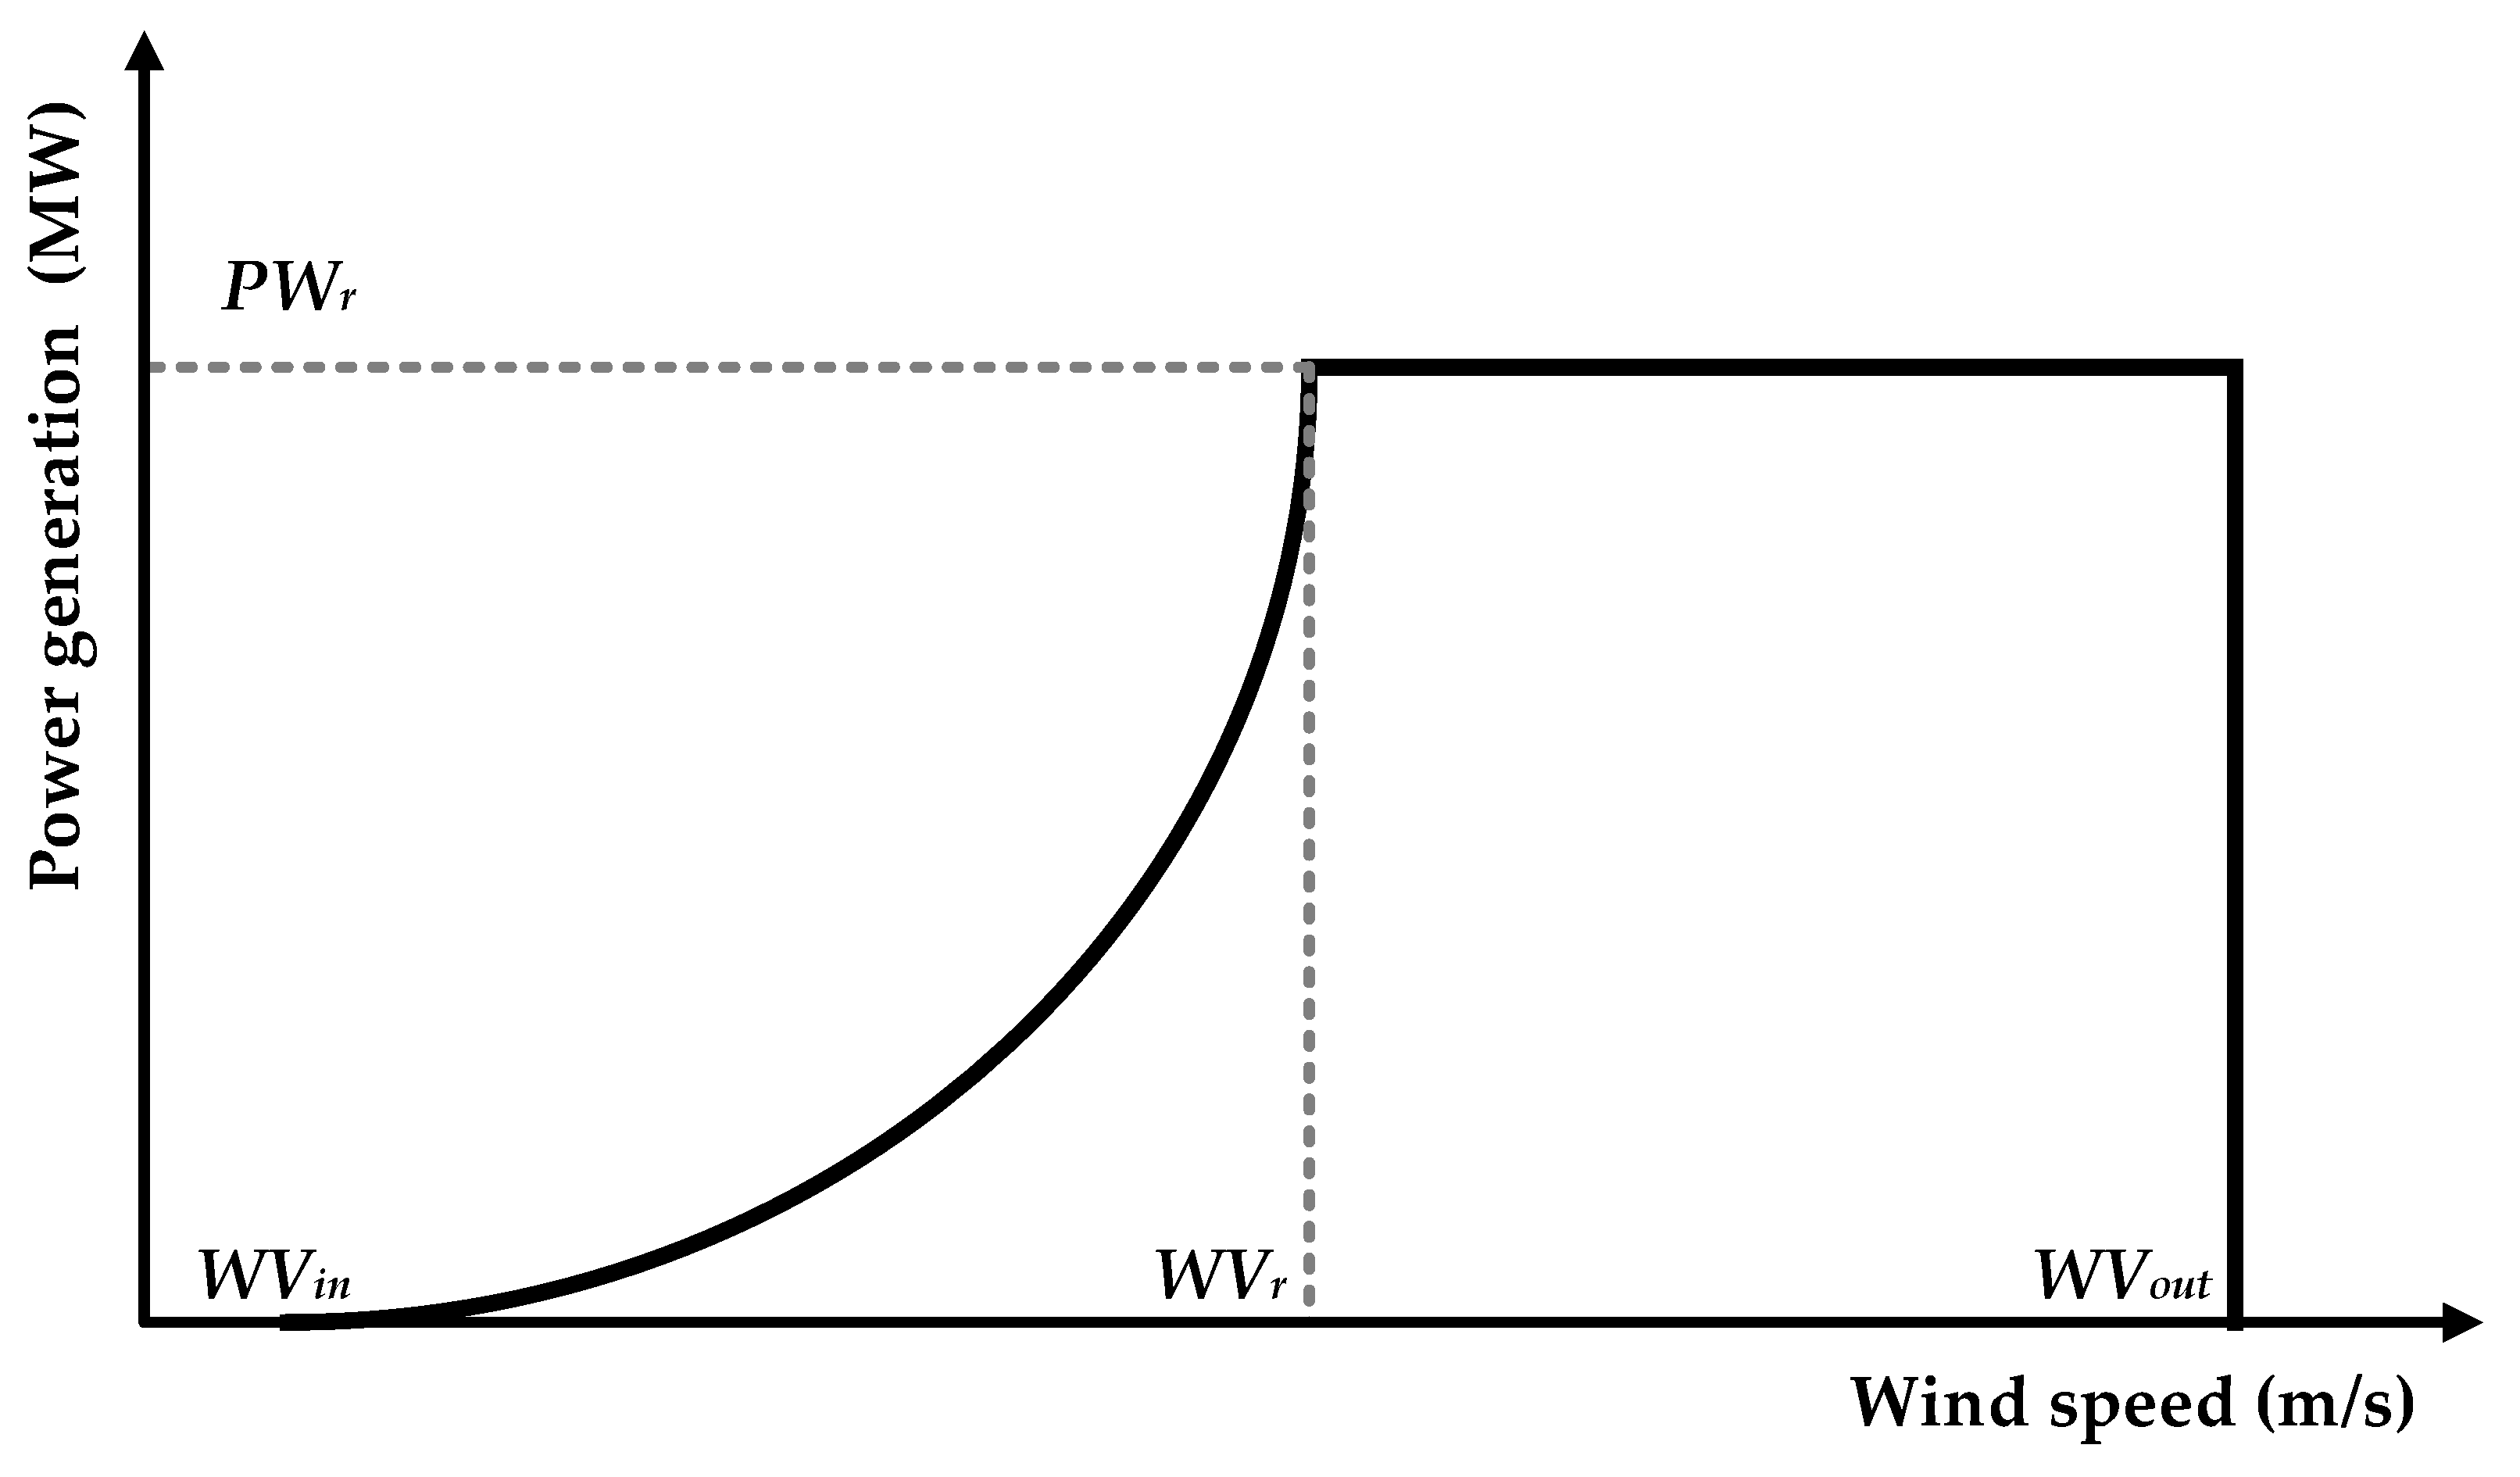
Basically, electricity power from wind turbines is highly dependent on wind speed. The operation characteristics of a typical wind turbine are shown in Figure 2. For the figure, wind turbines cannot generate electricity when the wind speed is lower than WVin and higher than WVout. The generated power by wind turbines, shown in Figure 2, can be also formulated as follows [43,44]:
P W w = { 0 , ( W V w < W V i n   a n d   W V w > W V o u t ) ( W V w W V i n ) ( W V r W V i n ) × P W w , r a t e , ( W V i n W V w W V r ) P W w , r , ( W V r W V w W V o u t )

3. The Proposed Method

3.1. Conventional Cuckoo Search Algorithm (CSA)

CSA is comprised of two techniques for updating new solutions. The first technique is based on Lévy flights to expand searching space considering very large step sizes. On the contrary, the second technique narrows searching space nearby current solutions, using a mutation operation similar to that in the DE algorithm. Due to different strategies, the first technique is called the exploration phase, whereas the second technique is known as the exploitation phase. The exploration phase is mathematically expressed as follows:
S o s n e w = S o s + α × ( S o s S o G b e s t ) L é vy ( β )
where α is the positive scale factor, which can be selected within the range of 0 and 1; Lévy(β) is the Lévy distribution function [21], and SoGbest is the best solution of the previous iteration.
The exploitation phase can be mathematically expressed as the following mutation technique:
S o s n e w = { S o s + δ × ( S o 1 S o 2 ) , r d s < M F S o s , o t h e r w i s e
where So1 and So2 are two randomly generated solutions from the current solutions, rds is a randomly generated number within zero and 1, and MF is the mutation factor, which is selected within the range of 0 and 1.
In the exploitation phase, there is a possibility that new solutions cannot be updated, i.e., new solutions and old solutions can be the same. This is particularly the case, given that the mutation factor, MF, is selected to be close to zero, and therefore the possibility that the phenomenon happens is very high. Additionally, it is obvious that new solutions are absolutely updated, if MF is selected to be close to 1.0. Consequently, the searching performance of CSA is highly dependent on the most appropriate value of MF.

3.2. Modified Adaptive Selective Cuckoo Search Algorithm (MASCSA)

The main shortcomings of CSA are indicated in [24], by presenting and analyzing the selection mechanism and mutation mechanism. The two main shortcomings are to miss promising solutions due to the selection mechanism and generate new solutions with low quality, due to the same updated step size of the mutation mechanism. As a result, two modifications are proposed to be the new selection mechanism and the adaptive mutation mechanism. The selection mechanism and the adaptive mutation mechanism are presented in detail as follows:

3.2.1. New Selection Mechanism (NSM)

The selection mechanism in [24] is proposed to retain better solutions in the old and new solution sets. Thus, before implementing the selection between new and old solutions, the old and new solution sets with twice the population are grouped into one. Then, the fitness function is used to sort solutions from the best one to the worst one. Finally, the first population is retained and another one is abandoned.

3.2.2. Adaptive Mutation Mechanism (AMM)

AMM in [24] is applied to use two different sizes of the updated step. In Equation (14), only the step with the deviation between two random solutions is applied. Consequently, the mechanism applies two different sizes for each considered solution, in which the small step size is established by using two solutions, and the large step size is calculated by using four different solutions. The small size and the large size support the formation of new solutions, as shown in the following equations:
S o s n e w = S o s + δ × ( S o 1 S o 2 )
S o s n e w = S o s + δ × ( S o 1 S o 2 ) + δ × ( S o 3 S o 4 )
However, ASCSA has still applied the condition of the comparison between rds and MF, shown in Equation (14). Thus, either Equation (15) or Equation (16) is not used if rds is higher than MF. Clearly, there is a high possibility that new solutions are not generated if MF is set to close to zero. In order to avoid this shortcoming, MF is set to one in the proposed MASCSA method.
Furthermore, in order to determine the use of either Equation (15) or Equation (16), ASCSA has applied a condition much dependent on a high number of selections. A ratio of fitness function of each considered solution to the fitness function of the best solution is calculated and then the ratio is compared to a threshold, which is suggested to be 10−5, 10−4, 10−3, 10−2, and 10−1. If the ratio is less than the threshold, Equation (15) is used. Otherwise, Equation (16) is selected. Clearly, the condition is time-consuming, due to the selection of five values for the threshold. Consequently, in order to tackle the main disadvantage of ASCSA, a modified adaptive mutation mechanism is proposed and shown in the next section.

3.2.3. The Modified Adaptive Mutation Mechanism (MAMM)

In the MAMM, the adaptive mutation mechanism in [24] is applied, together with a proposed condition for determining the use of small size or large size in Equations (15) and (16). The fitness function of each solution is determined and defined as FFs. The fitness function is used to calculate the effective index of each solution and the average effective index of the solutions. The effective index of the sth solution, EIs, and the average effective index of the whole population, EIa, are calculated as follows:
E I s = F F b e s t / F F s
E I a = F F b e s t / F F a
where FFbest and FFa are the fitness function of the best solution and the average fitness function of the whole population. In the case that the effective index of the sth solution is less than that of the whole population, the sth solution is still far from the so-far best solution and small size should be used for the sth solution. On the contrary, the sth solution may be close to the so-far best solution and the large size is preferred. In summary, the modified adaptive mutation mechanism can be implemented by the five following steps:
  • Step 1: Set mutation factor MF to one
  • Step 2: Calculate the fitness function of the sth solution, FFs and determine the lowest one, FFbest
  • Step 3: Calculate the mean fitness function of all current solutions, FFa
  • Step 4: Calculate EIs and EIa using Equations (17) and (18)
  • Step 5: Compare EIs and EIa
    • If EIs < EIa, apply Equation (15) for the sth solution.
      • Otherwise, apply Equation (16) for the sth solution.
Using the AMM [34], ASCSA can jump to promising search zones with appropriate step size, as shown in Equations (15) and (16). However, the condition for applying either Equation (15) or Equation (16) is time-consuming, due to the many values of threshold, including 10−5, 10−4, 10−3, 10−2, and 10−1. In addition, the mutation factor is also set to the range from 0.1 to 1.0 with ten values. Therefore, it should try (5×10) = 50 values for the ASCSA. This becomes a serious issue of ASCSA in finding the best solution. Therefore, the application of the new condition can enable MASCSA to reach high performance, but the shortcomings of the time-consuming manner can be solved easily.

4. The Application of the Proposed MASCSA Method for OSWHT Problem

4.1. Decision Variables Selection

Solution methods can be applied for an optimization problem with the first step of determining decision variables, which are included in each candidate solution. In the problem, the decision variables are selected to be as follows:
  • Reservoir volume of all hydropower plants at the first subinterval to the (Ns − 1)th subinterval: Vhp,i, where hp = 1, …, Nh and i = 1, …, Ns.
  • Power generation of the first (Nt − 1) thermal power plants for all subinterval: PTtp,i, where tp = 1, …, Nt − 1 and i = 1, …, Ns.

4.2. Handling Constraints of Hydropower Plants

From the constraint of water balance in Equation (2), the total discharge of each subinterval is obtained as follows:
Q h p , i = V h p , i 1 V h p , i + W I h p , i , i = 1 ,   2 , ,   N s
Then, the discharge of each hour is determined using Equation (8), as follows:
q h p , i = Q h p , i t i , { h p = 1 ,   2 , ,   N h i = 1 ,   2 , , N s
As a result, the power generation of hydropower plants can be found using Equation (7).

4.3. Handling Power Balance Constraint

From the power balance constraint shown in (11), the power generation of the Ntth thermal power plant is determined as follows:
P T N t , i = P L , i + P T L , i t p = 1 N t 1 P T t p , i h p = 1 N h P H h p , i w = 1 N w P W w , i

4.4. Fitness Function

The fitness function of each solution is determined to evaluate the quality of the solution. Therefore, the total electricity fuel cost of all thermal power plants and all constraints that have the possibility to be violated are the major terms of the fitness function. As shown in Section 4.1, reservoir volume and power generation of the first (Nt − 1) thermal power plants are the decision variables. Hence, they never violate the limits. However, the discharge of each hour and power generation of hydropower plants, and the last thermal power plant, have a high possibility of violating both the upper and lower limits. Derived from the meaning, the solution quality evaluation function is established as follows:
F F s = T F C + P F 1 × h p = 1 N h i = 1 N s Δ q h p , i 2 + P F 2 × h p = 1 N h i = 1 N s Δ P H h p , i 2 + P F 3 × i = 1 N S Δ P T N t , i 2
where PF1, PF2, and PF3 are the penalty factors corresponding to the violation of discharge, power generation of hydropower, and power generation of the last thermal power plant, respectively. ∆qhp,i, ∆PHhp,i, and ∆PTNt,i are the penalty terms of discharge, power generation of hydropower plants, and power generation of the last thermal power plants. The penalty terms in Equation (22) are determined as follows:
Δ q h p , i = { ( q h p , i q h p , m a x ) , q h p , i > q h p , m a x ( q h p , m i n q h p , i ) , q h p , i   < q h p , m i n 0 , o t h e r w i s e
Δ P H h p , i = { ( P H h p , i P H h p , m a x ) , P H h p , i > P H h p , m a x ( P H h p , m i n P H h p , i ) , P H h p , i < P H h p , m i n 0 , o t h e r w i s e
Δ P T N t , i = { ( P T N t , i P T N t , m a x ) , P T N t , i > P T N t , m a x ( P H N t , m i n P T N t , i ) , P T N t , i   < P T N t , m i n 0 , o t h e r w i s e

4.5. The Whole Application Procedure of MASCSA for OSWHT Problem

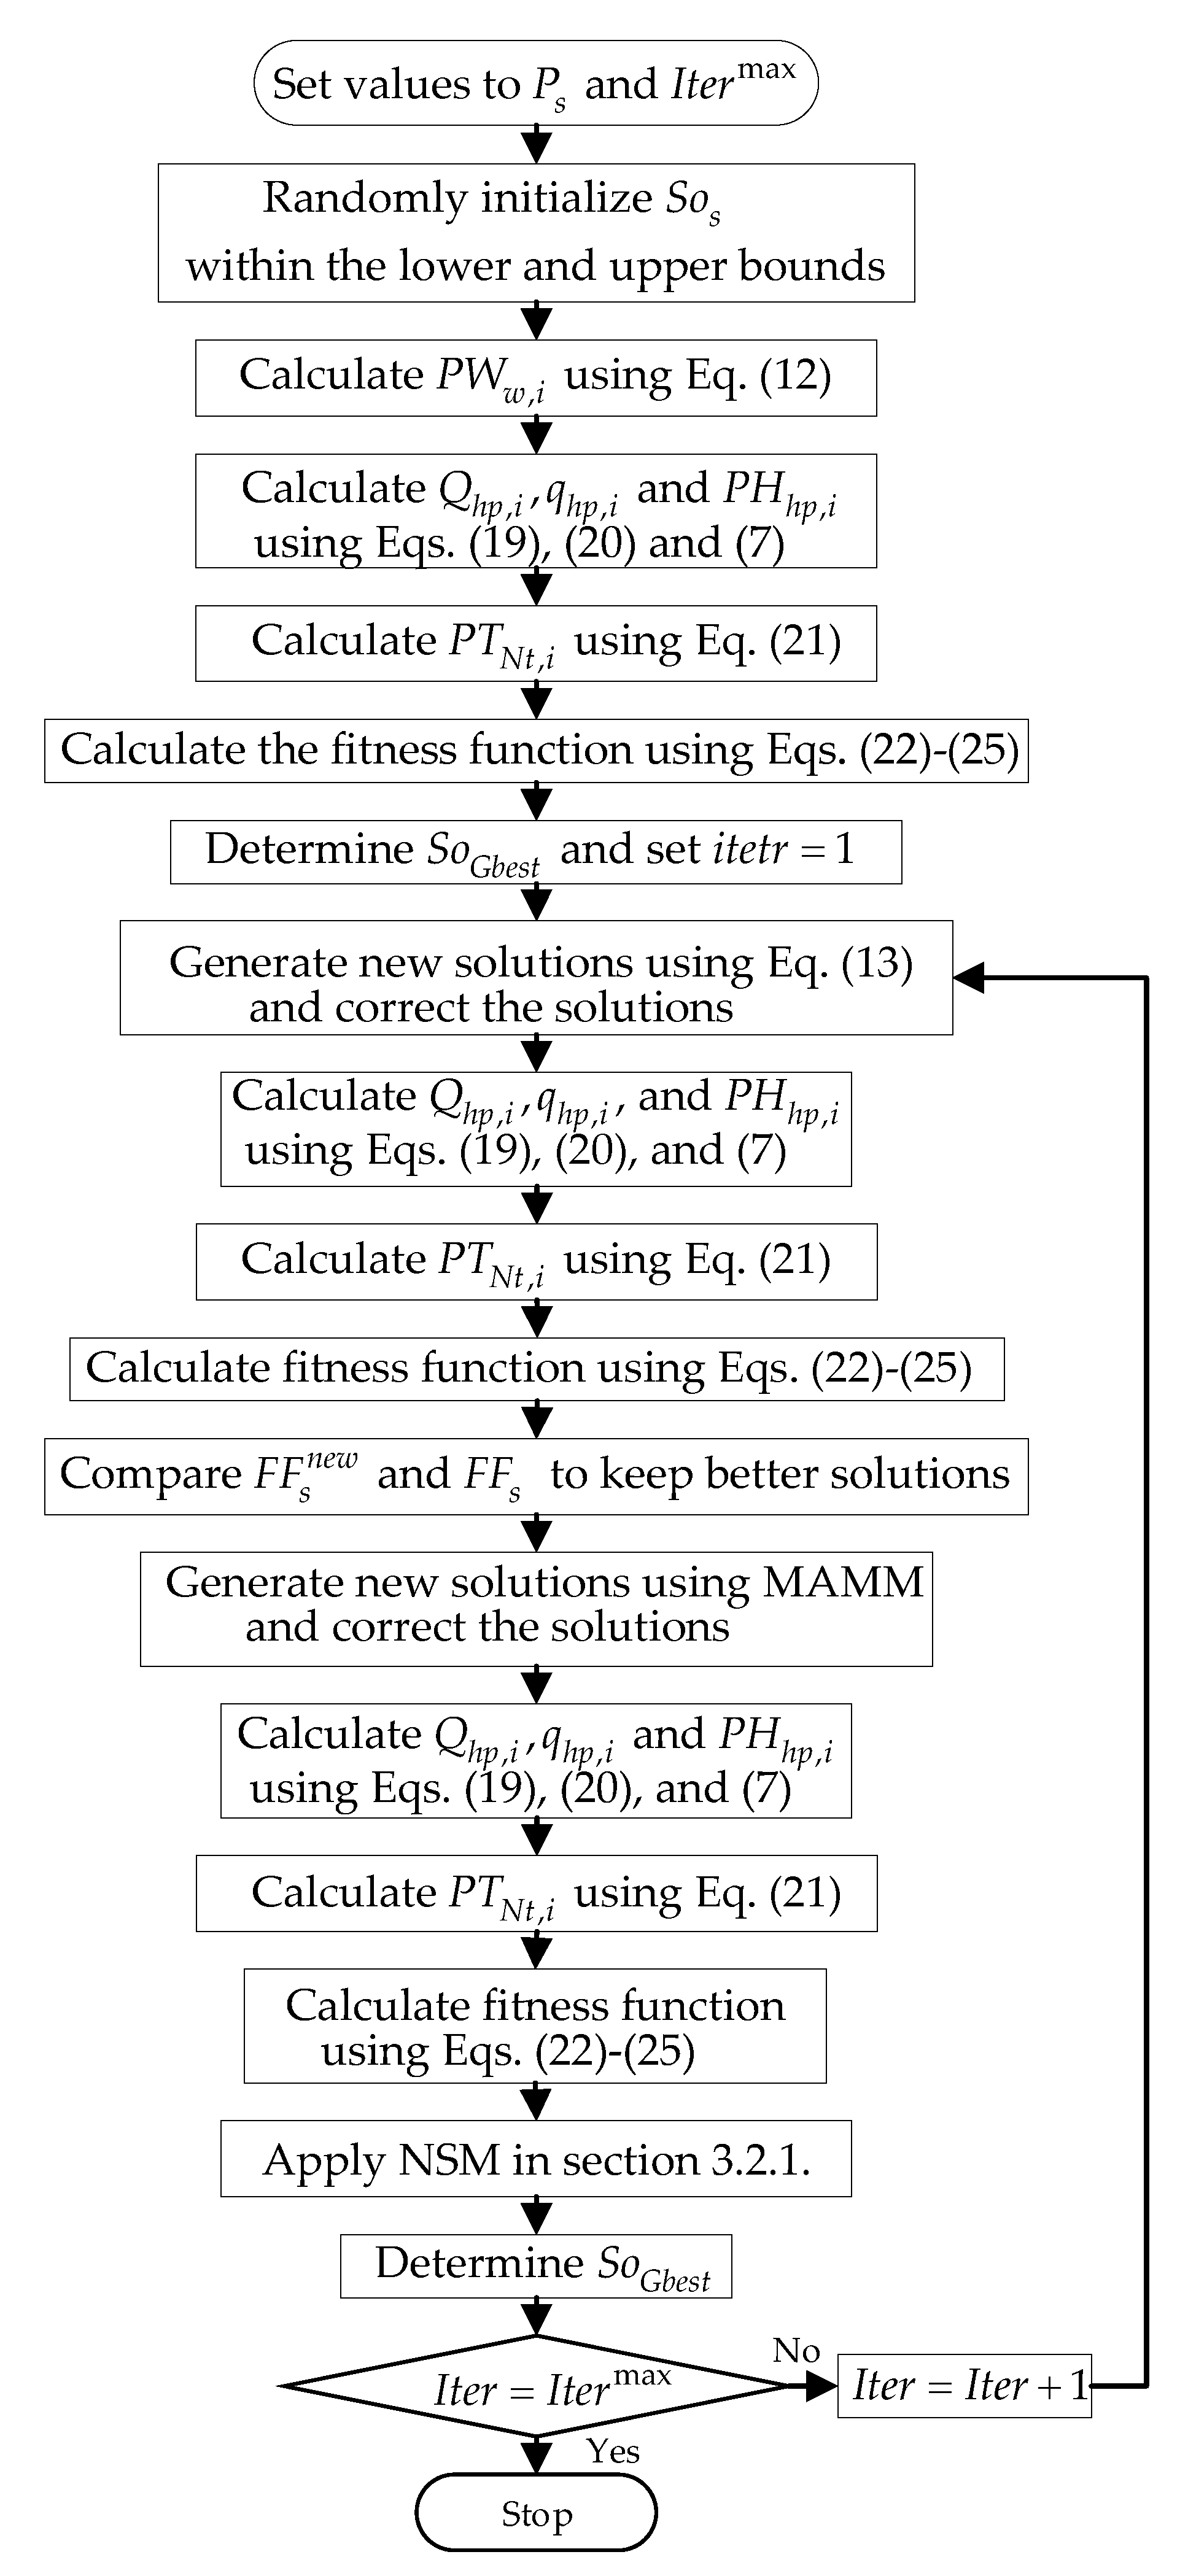
The whole solution process of the optimal scheduling of the wind-hydro-thermal system with the fixed-head short-term model is described in Figure 3, as follows:
  • Step 1: Set values to Ps and Itermax
  • Step 2: Randomly initialize Sos (s=1, …, Ps) within the lower and upper bounds
  • Step 3: Calculate PWw,i using Equation (12)
  • Step 4: Calculate Qhp,i, qhp,i and PHhp,i using Equations (19), (20), and (7).
  • Step 5: Calculate PTNt,i using Equation (21)
  • Step 6: Calculate the fitness function using Equations (22)–(25)
  • Step 7: Determine SoGbest and set current iteration to 1 (Iter=1)
  • Step 8: Generate new solutions using Equation (13) and correct the solutions
  • Step 9: Calculate Qhp,i, qhp,i, and PHhp,i using Equation (19), (20), and (7).
  • Step 10: Calculate PTNt,i using Equation (21)
  • Step 11: Calculate fitness function using Equations (22)–(25)
  • Step 12: Compare F F s n e w and F F s to keep better solutions
  • Step 13: Generate new solutions using MAMM and correct the solutions
  • Step 14: Calculate Qhp,i, qhp,i, and PHhp,i using Equations (19), (20), and (7).
  • Step 15: Calculate PTNt,i using Equation (21)
  • Step 16: Calculate fitness function using Equations (22)–(25)
  • Step 17: Apply NSM in Section 3.2.1.
  • Step 18: Determine SoGbest
  • Step 19: If Iter= Itermax, stop the solution searching algorithm. Otherwise, set Iter= Iter+1 and go back to Step 8

5. Numerical Results

In this section, the performance of the proposed MASCSA is investigated by comparing the results of the proposed method to those from other implemented methods, such as CSA and SDCSA. Two test systems are employed as follows:
  • Test System 1: Four hydropower plants and four thermal power plants with valve effects are optimally scheduled over one day with twenty-four one-hour subintervals. The data of the system are modified from Test System 1 in [7] and also reported in Table A1, Table A2 and Table A3 in the Appendix A.
  • Test System 2: Four hydropower plants, four thermal power plants, and two wind farms with the rated power of 120 MW and 80 MW are optimally scheduled over one day with twenty-four one-hour subintervals. The data of the hydrothermal system are taken from Test System 1 while wind data are taken from [45] and also reported in Table A3 in the Appendix A.
The implemented methods are coded on MATLAB and a personal computer with the CPU of Intel Core i7-2.4GHz, RAM 4GB for obtaining 50 successful runs. The optimal generations of two systems are reported in Table A4 and Table A5 in the Appendix A.

5.1. Comparison Results on Test System 1

In this section, the MASCSA is tested on a large hydrothermal system with four hydropower plants and four thermal power plants, considering valve effects scheduled in twenty-four one-hour subintervals. In order to investigate the effectiveness of the MASCSA, CSA and SDCSA are implemented to compare the results. In the first simulation, Ps and Itermax are set to 200 and 5000 for all methods, respectively, but CSA cannot reach successful runs for each of the 50 trial runs. Meanwhile, SDCSA reaches a very low success rate. Then, Itermax is increased to 10,000 with a change of 1000 iterations. SDCSA and MASCSA can reach 100% successful runs at Itermax = 10,000, but CSA only reaches 50 successful runs over 70 trial runs. Results obtained by the implemented methods are summarized in Table 1.
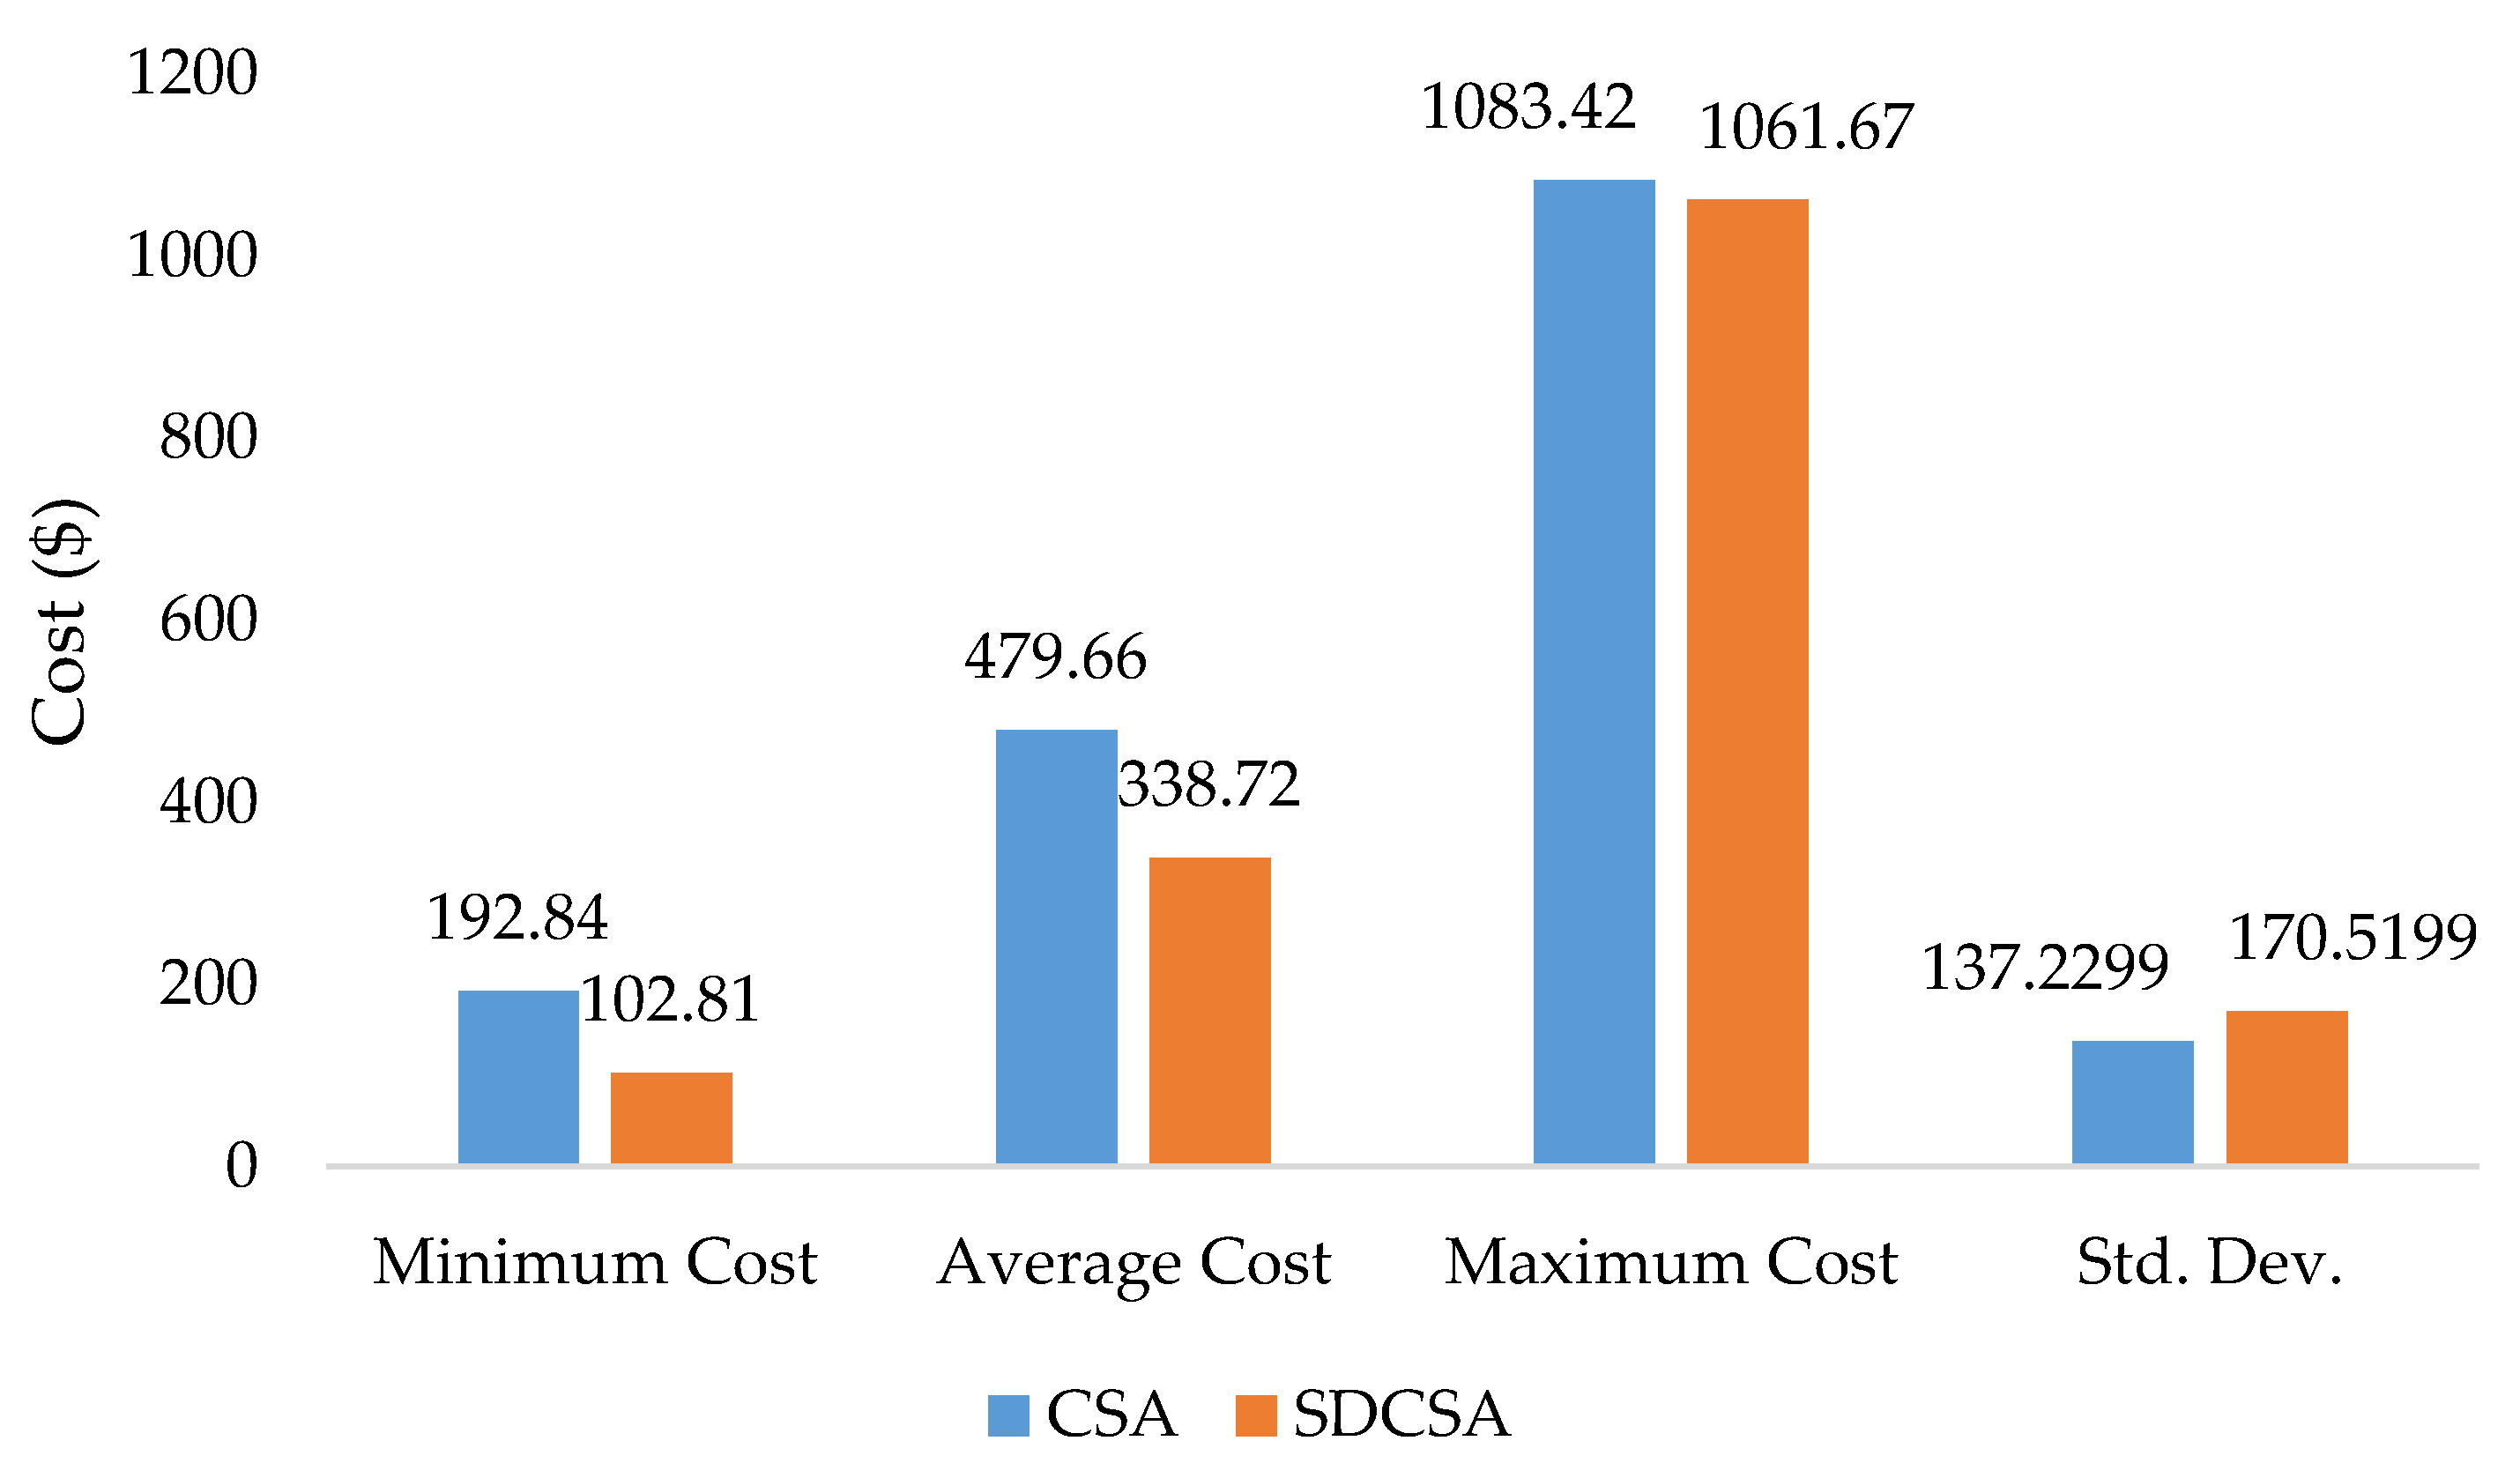
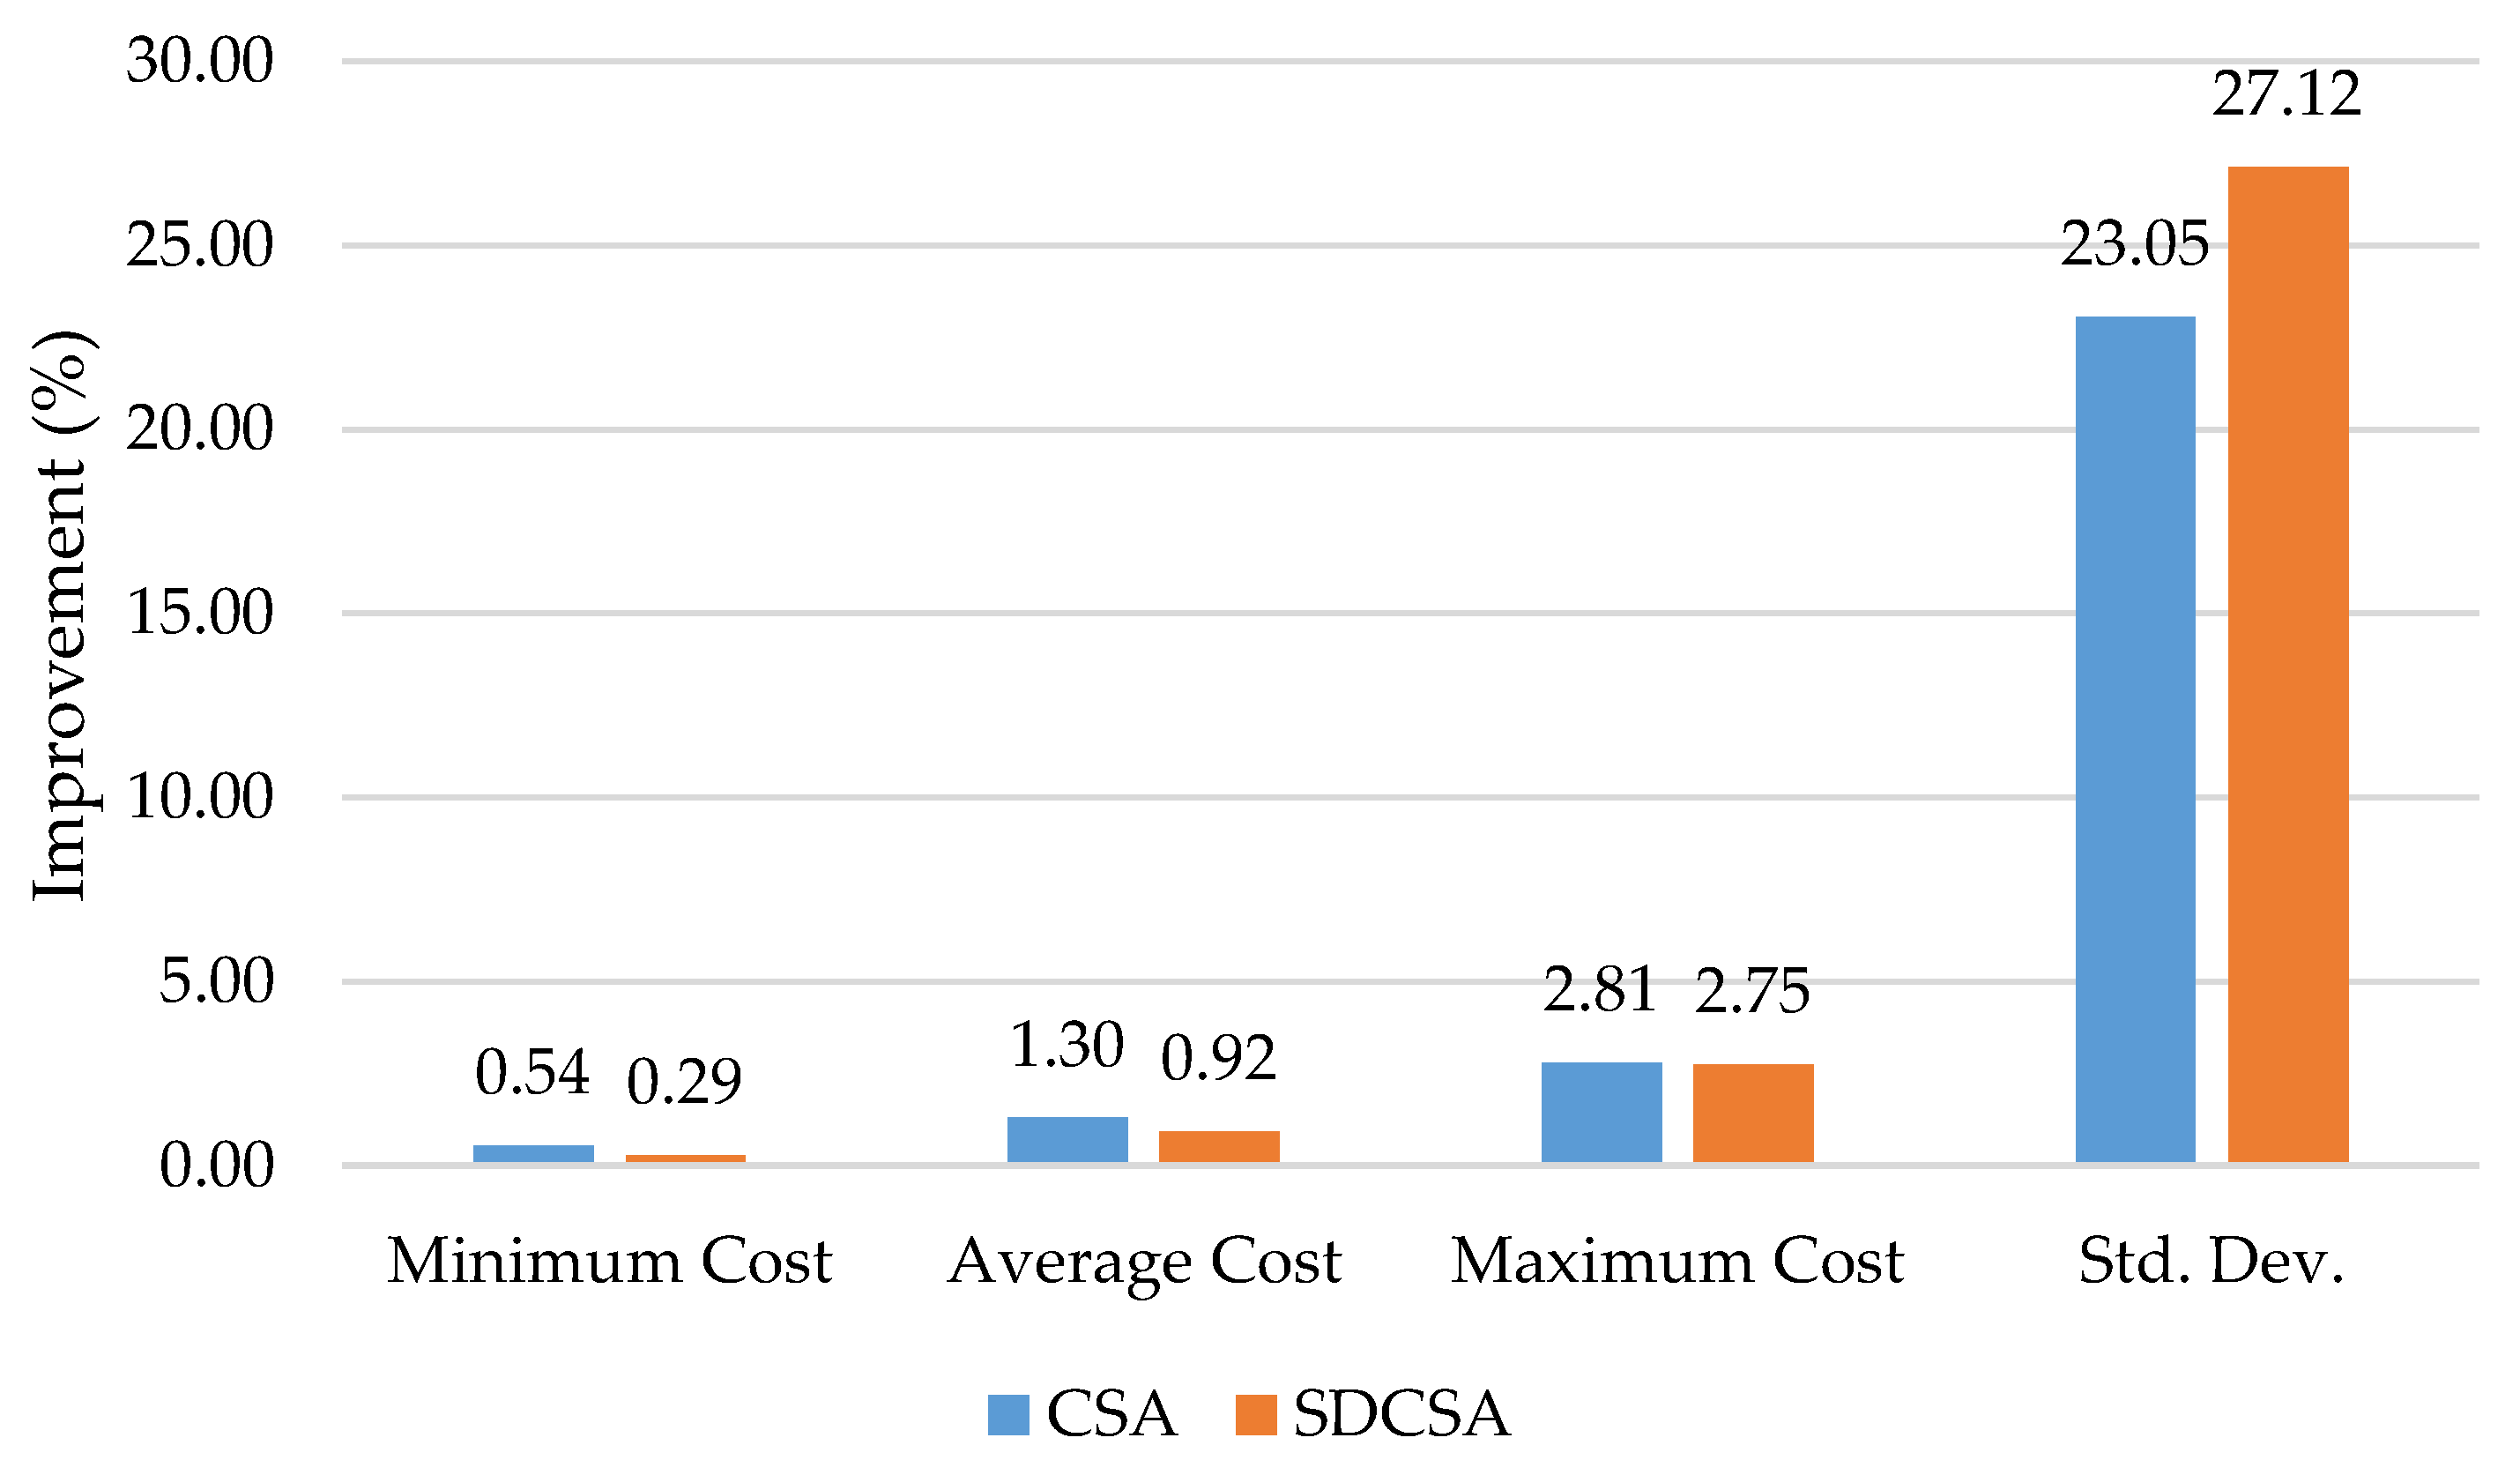
It is noted that the results from CSA, SDCSA, and MASCSA are obtained at Ps = 200 and Itermax = 10,000, with the aim of reaching a higher number of successful runs for CSA and SDCSA. In order to check the powerful searchability of MASCSA over CSA and SDCSA, Figure 4 and Figure 5 are plotted to present less cost and the corresponding level of improvement. Figure 4 indicates that the reduced cost that ASCSA can reach is significant and much increased for average cost and maximum cost. Accordingly, the level of improvement of the minimum cost, average cost, and maximum cost are respectively 0.54%, 1.3% and 2.81% as compared to CSA and 0.29%, 0.92% and 2.75% as compared to SDCSA. Similarly, the improvement of standard deviation is also high, corresponding to 23% and 27.12%, as compared to CSA and SDCSA. The indicated numbers lead to the conclusion that MASCSA is superior over CSA and SDCSA, in terms of finding the best solution and reaching a more stable search process.
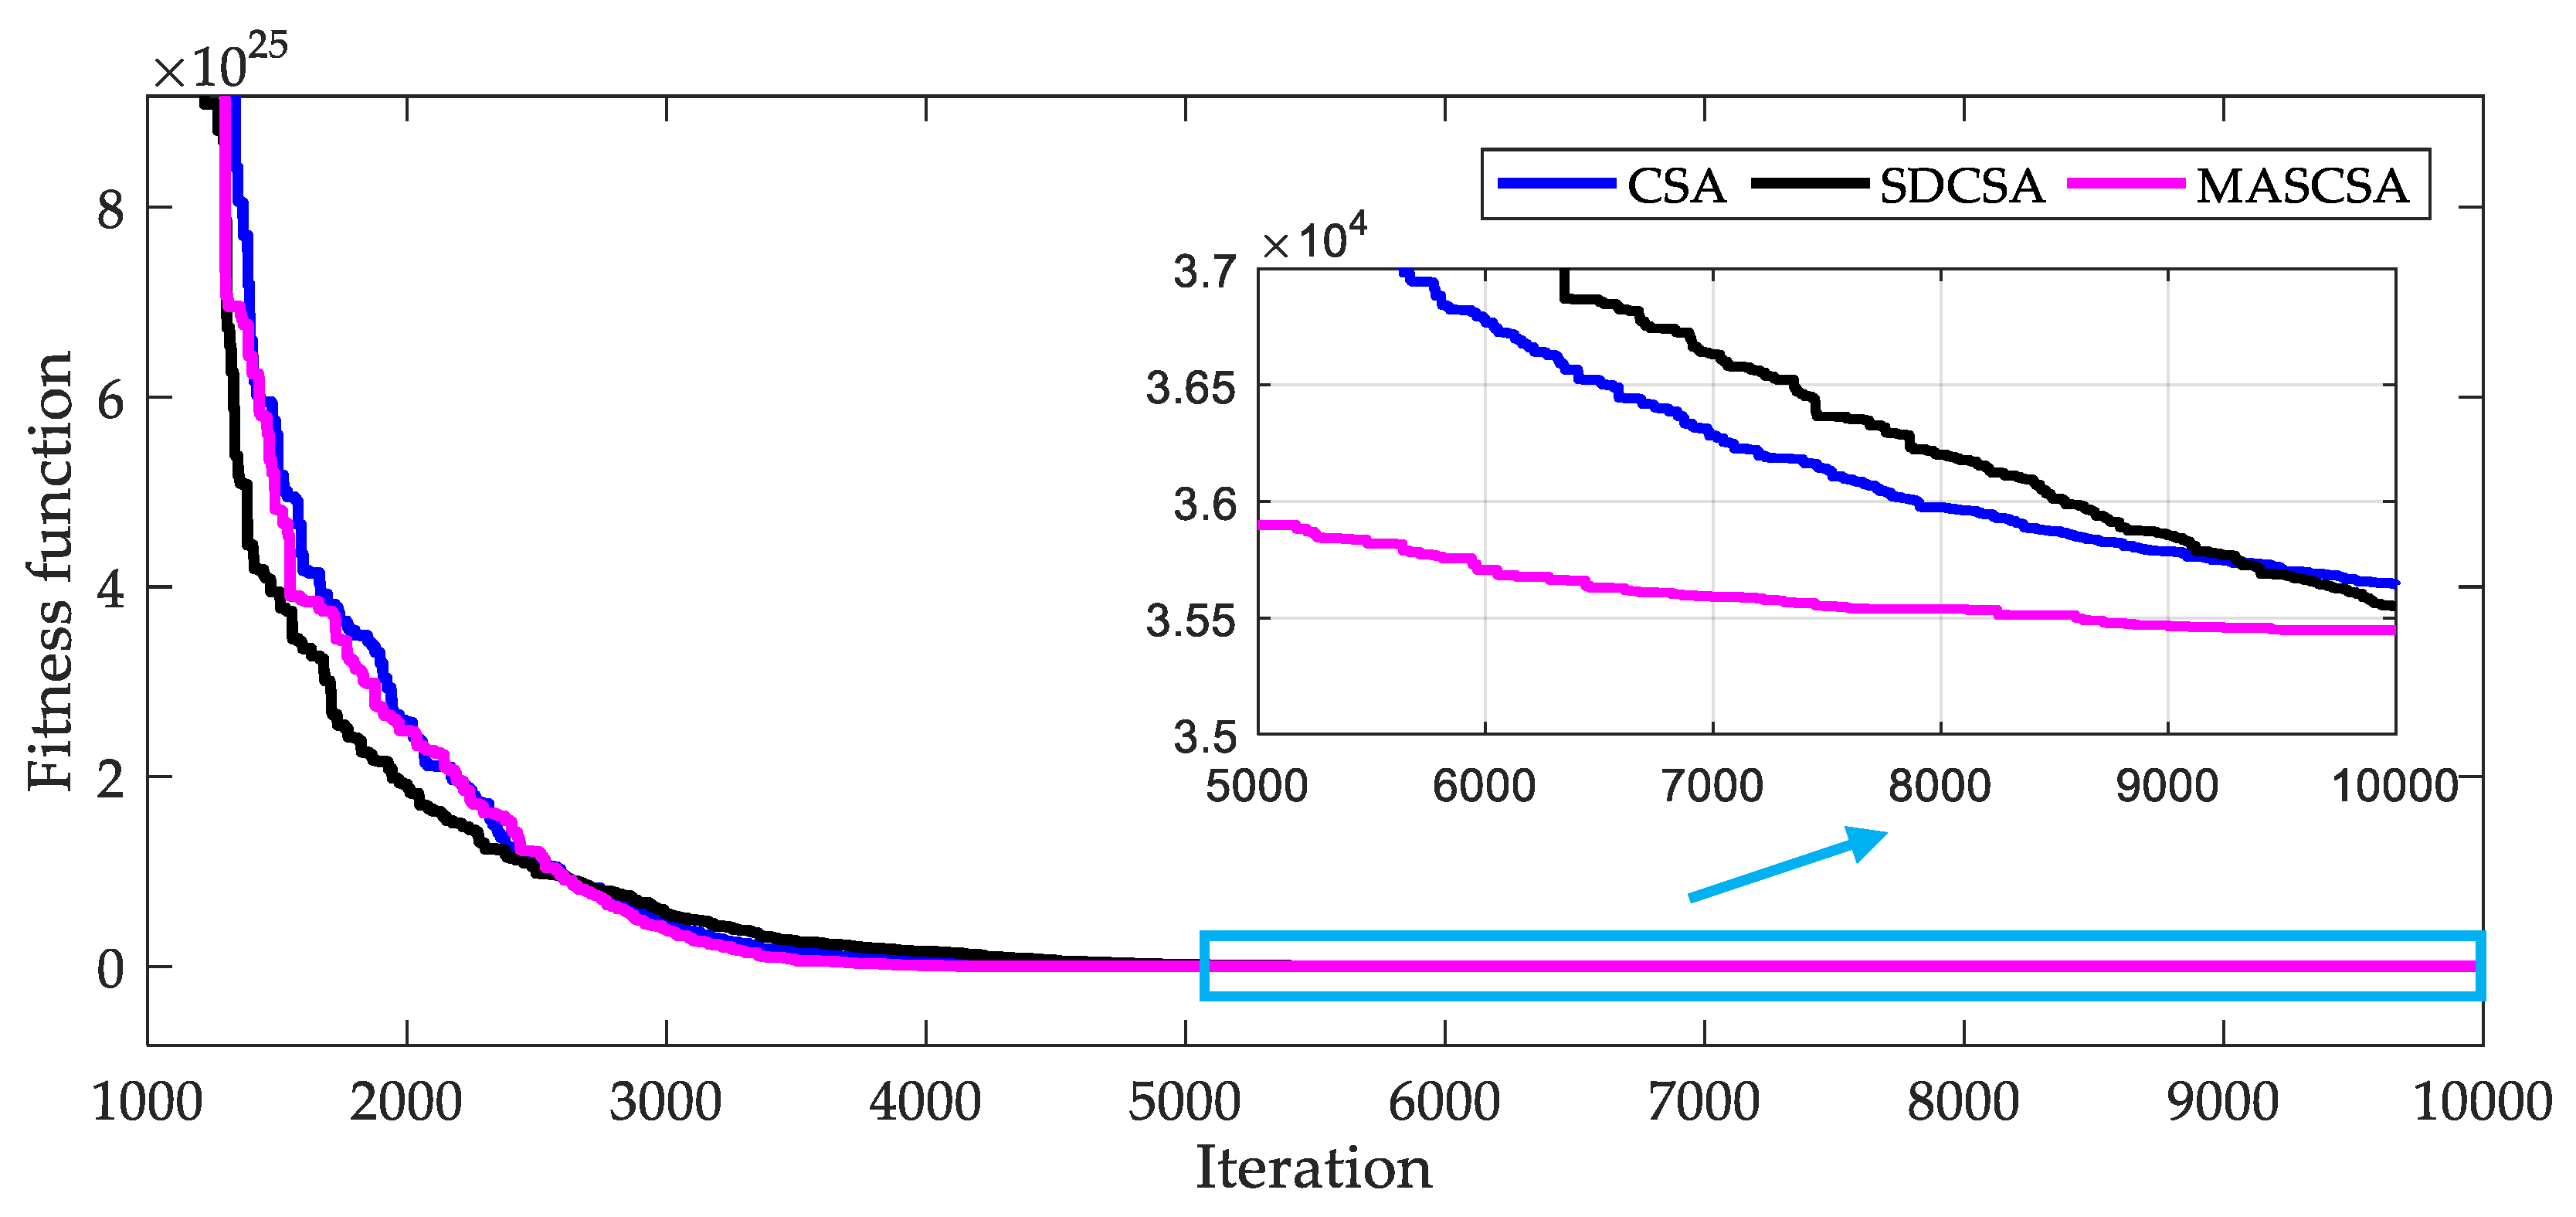
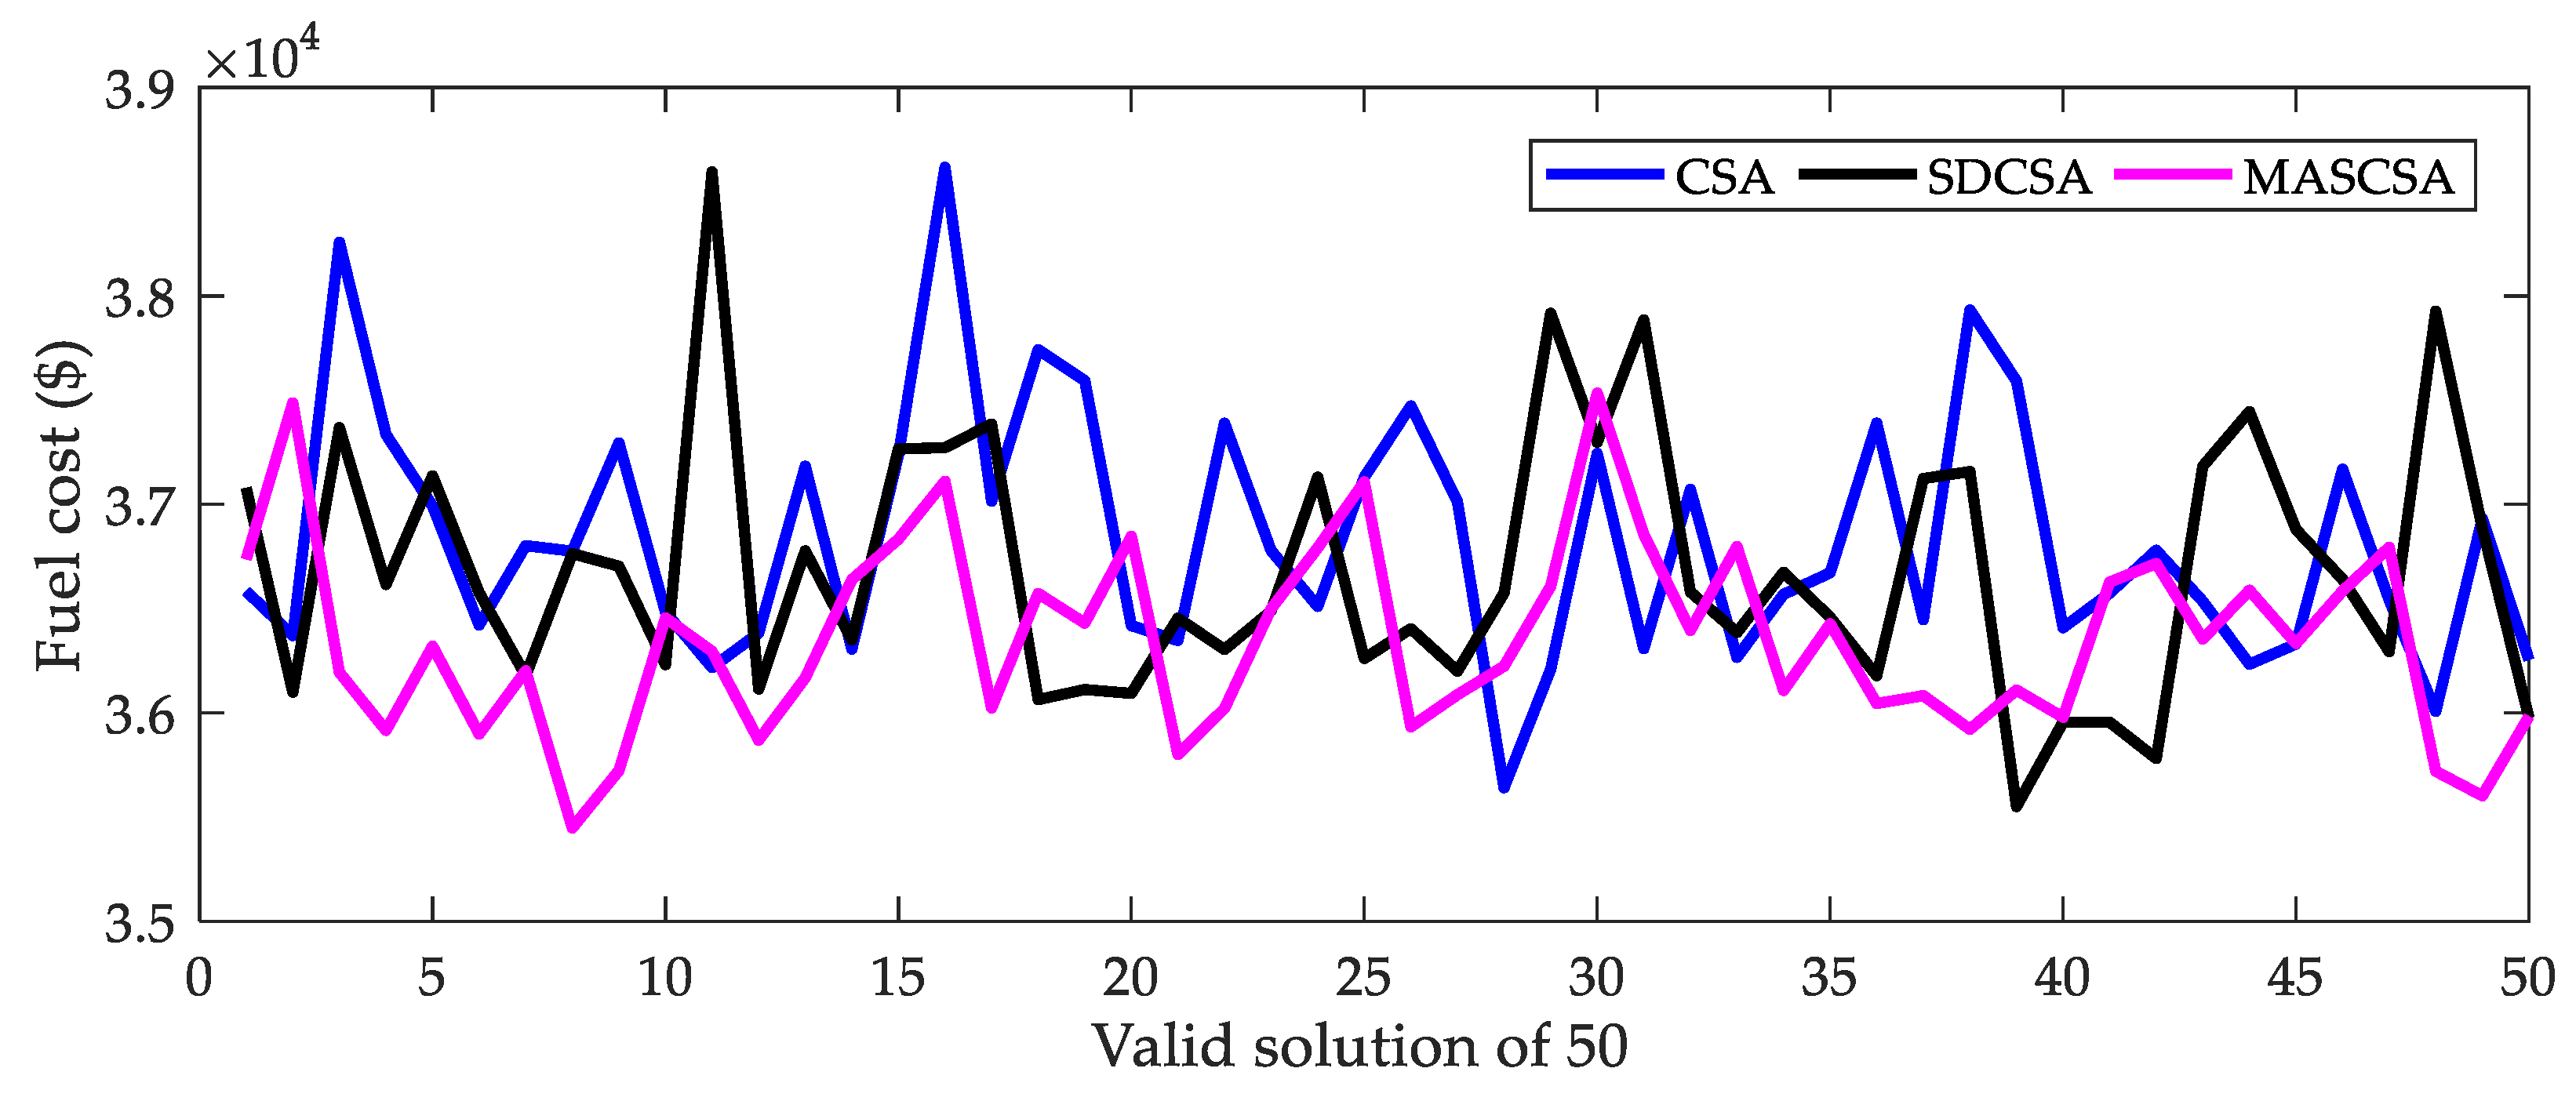
In addition, the best run and the average run of 50 successful runs are also plotted in Figure 6 and Figure 7 for search speed comparison. The two figures confirm that MASCSA is much faster than CSA and SDCSA for the best run and the average of all runs. In fact, in Figure 6, the best solution of MASCSA at the 5000th iteration is much better than CSA and SDCSA, and the best solution of MASCSA at the 7000th iteration is also better than that of CSA and SDCSA at the last iteration. This indicates that the speed of MASCSA can be nearly two times faster than CSA and SDCSA. In Figure 7, the average solution of 50 solutions found by MASCSA is also much more effective than that of CSA and SDCSA. The average solution of MASCSA at the 7000th iteration is also better than that of CSA and SDCSA at the last iteration. Clearly, the stability of MASCSA is also nearly twice as good as that of CSA and SDCSA. The whole view of the 50 solutions comparison can be seen by checking Figure 8. Many solutions of MASCSA have lower cost than that of CSA and SDCSA.
In summary, the proposed MASCSA is superior over CSA and SDCSA in finding optimal solutions and reaching a faster search speed for Test System 1. Hence, the proposed modifications of MASCSA are effective for large-scale power systems.

5.2. Comparison Results on Test System 2

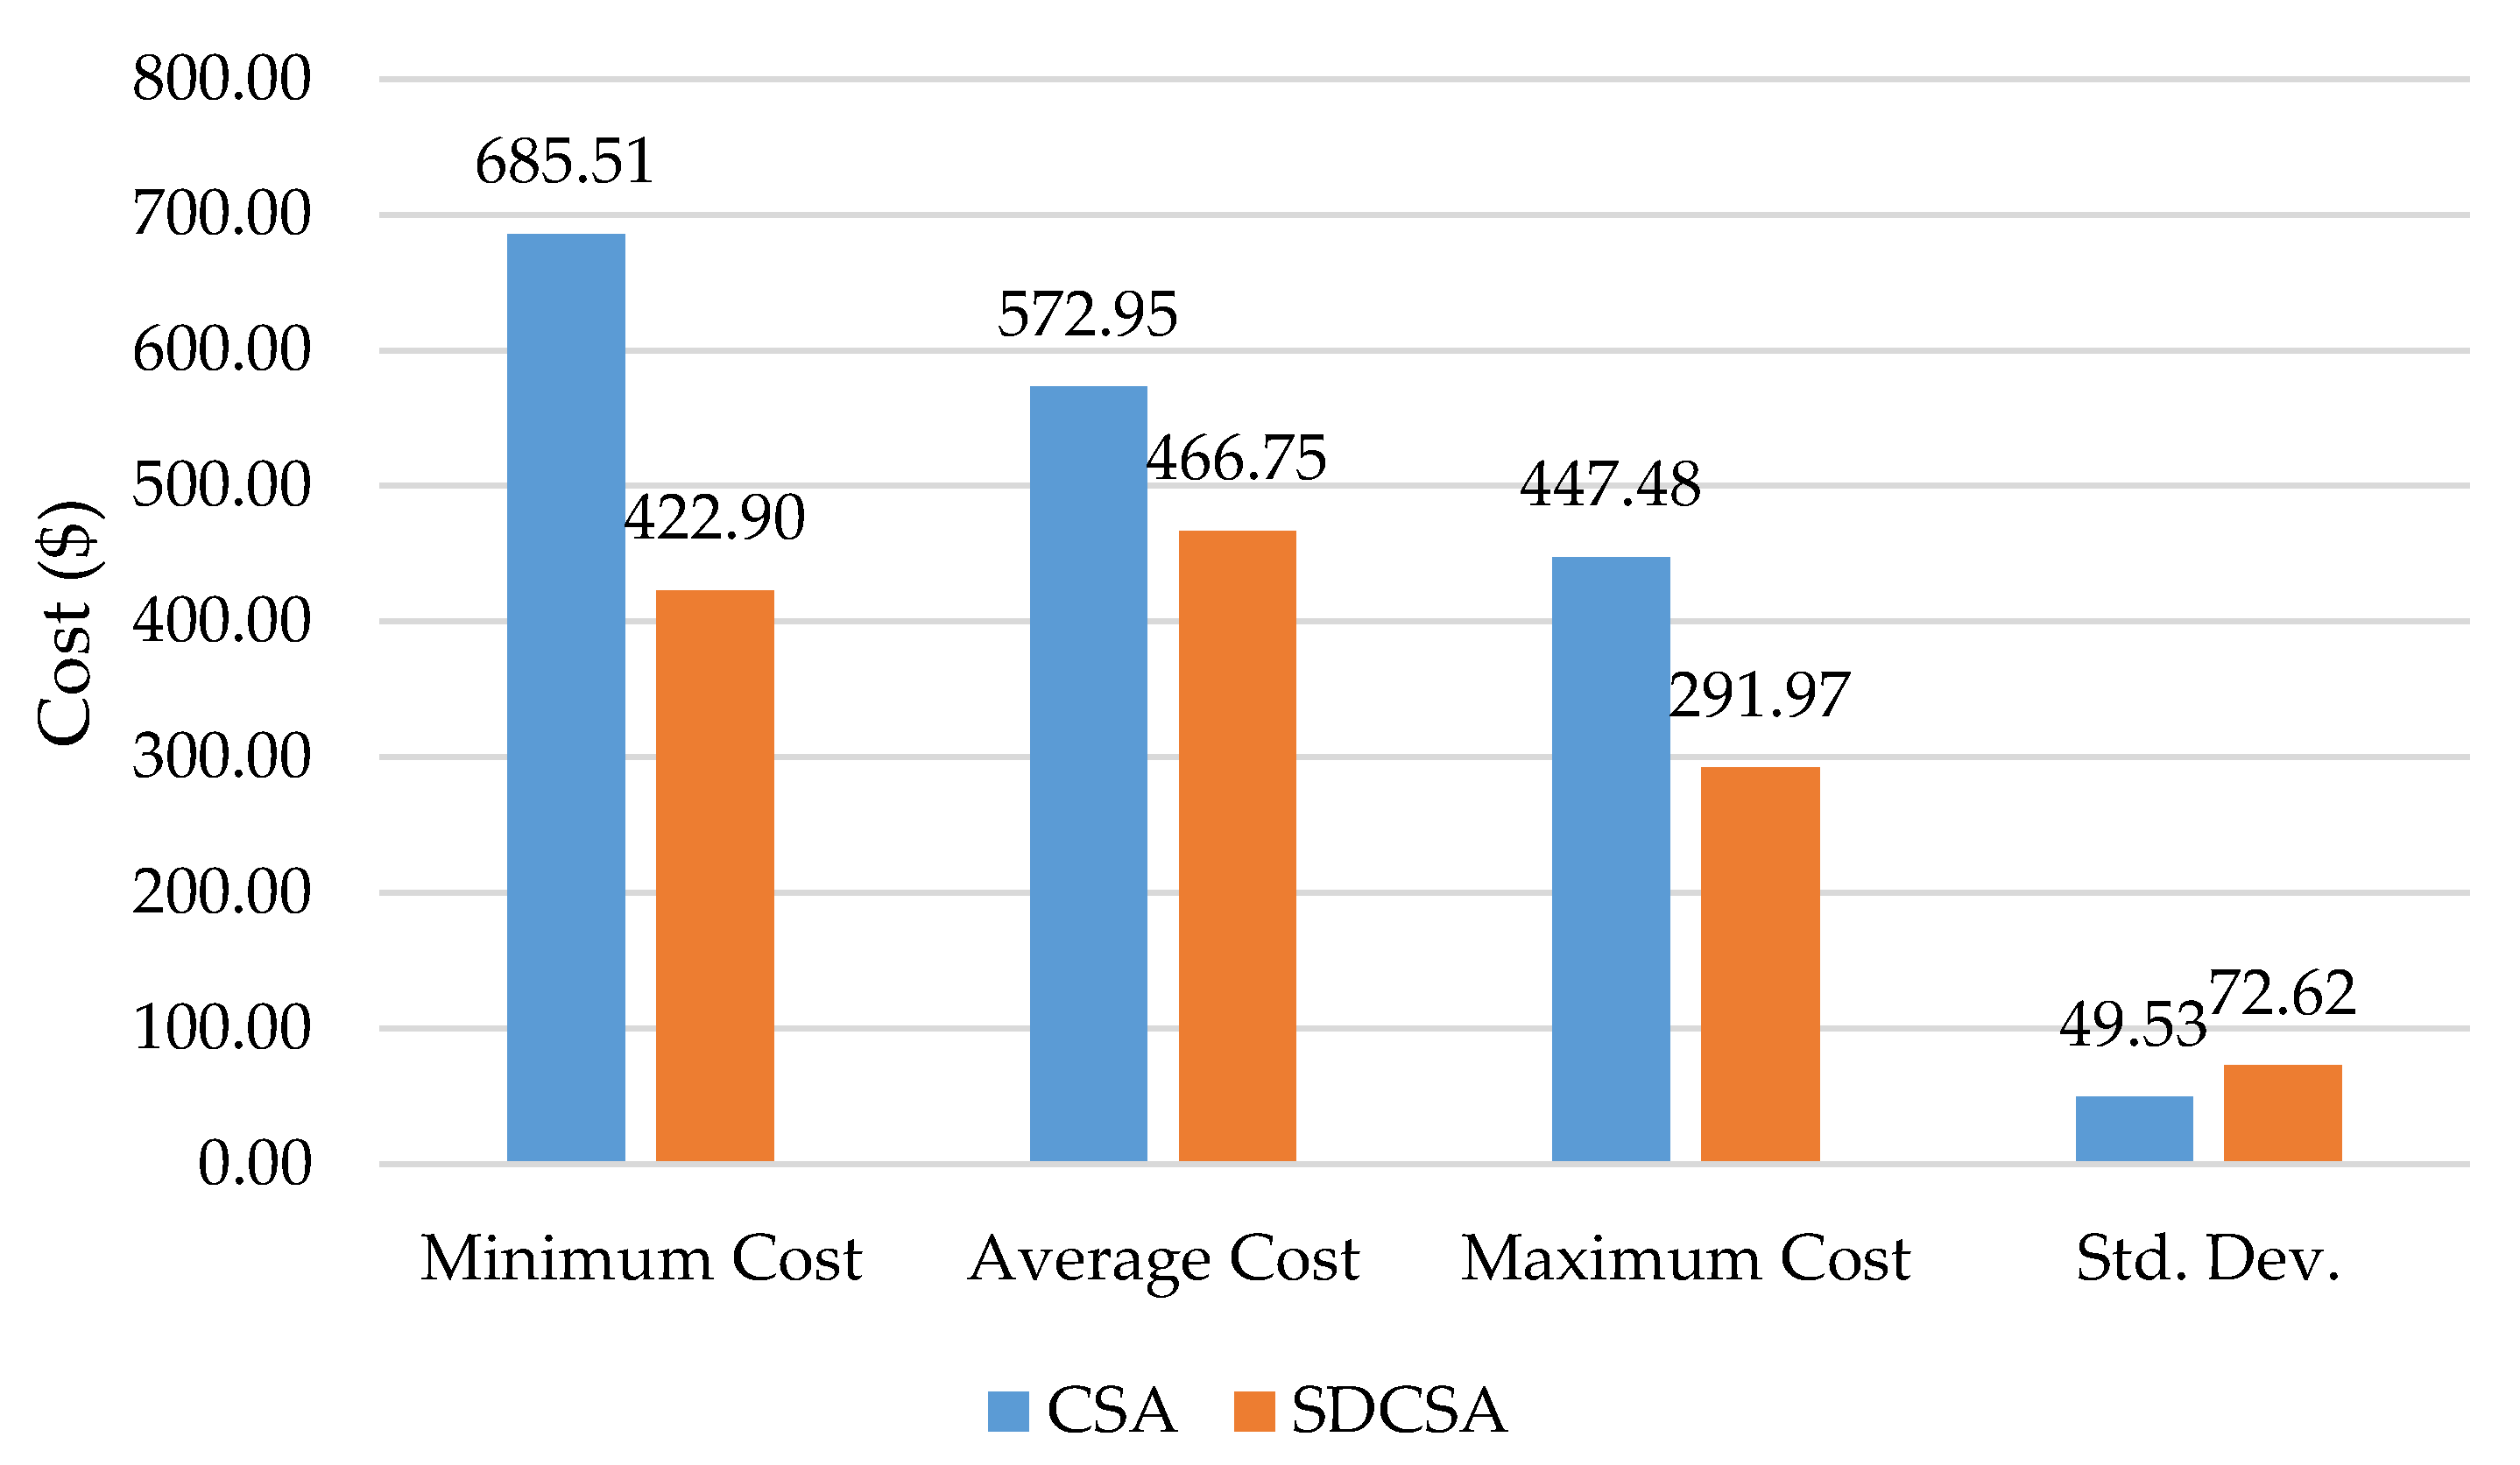
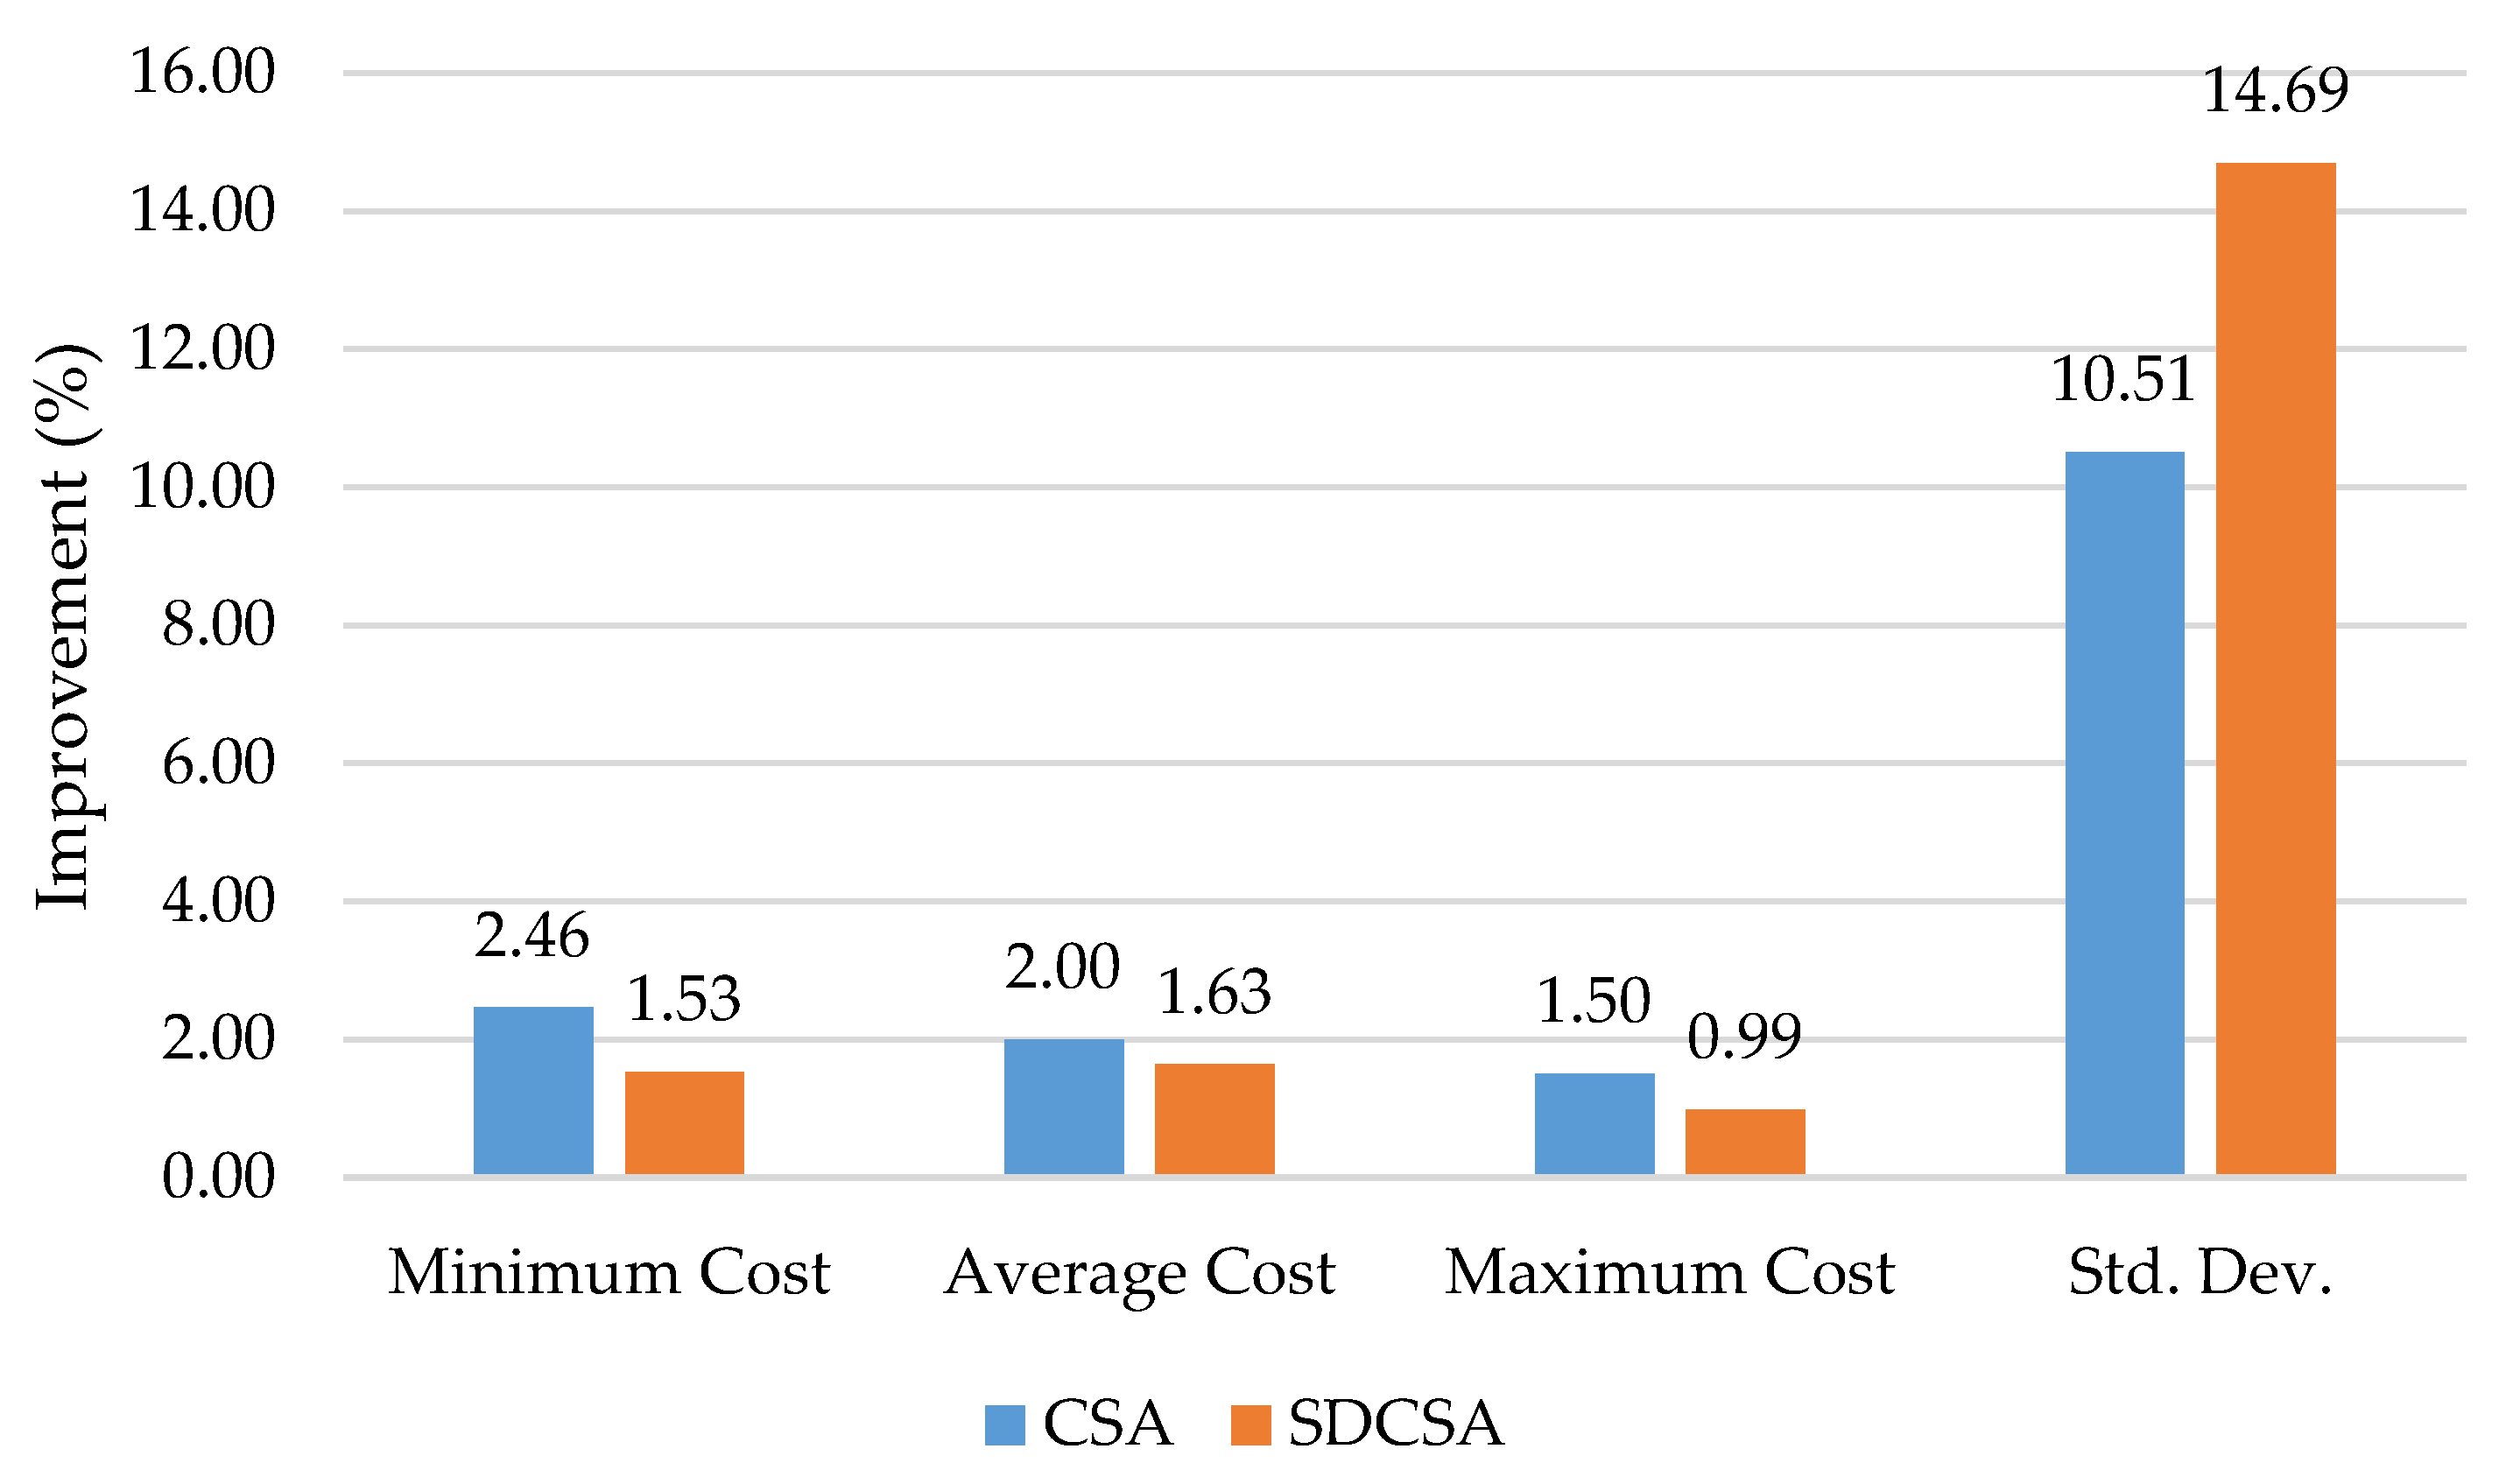
In this section, the implemented methods are tested on a wind-hydro-thermal system. The system is the combination of the hydrothermal system in Test System 1 and two wind farms. The system is optimally scheduled in twenty-four one-hour subintervals. Similar to Test System 1, three CSA methods, including CSA, SDCSA, and MASCSA, are successfully implemented considering all constraints of the system with the initial settings of Ps = 200 and Itermax = 10,000. Accordingly, Table 2 shows the obtained results by CSA, SDCSA, and MASCSA. The key information in this table is the success rate comparison. Meanwhile, the comparison of cost is shown in Figure 9 and Figure 10 for reporting less cost and the corresponding level of improvement of MASCSA over CSA and SDCSA, respectively. It should be emphasized that MASCSA can reach 50 successful runs over 50 trial runs, but the number of trial runs for CSA and SDCSA is much higher, which is 72 runs for CSA and 65 runs for SDCSA. Obviously, the constraint solving performance of MASCSA is much better than CSA and SDCSA. Figure 9 shows the significant cost reduction that MASCSA can reach as compared to CSA and SDCSA. The exact calculation, as compared to CSA and SDCSA, of MASCSA can reduce minimum cost by $685.51 and $422.90, mean cost by $572.95 and $466.75, maximum cost by $447.48 and $291.97, and standard deviation by 49.53 and 72.62. As can be observed from Figure 10, the level of improvement is also high and can be up to 2.46% for minimum cost and 14.69% for standard deviation.
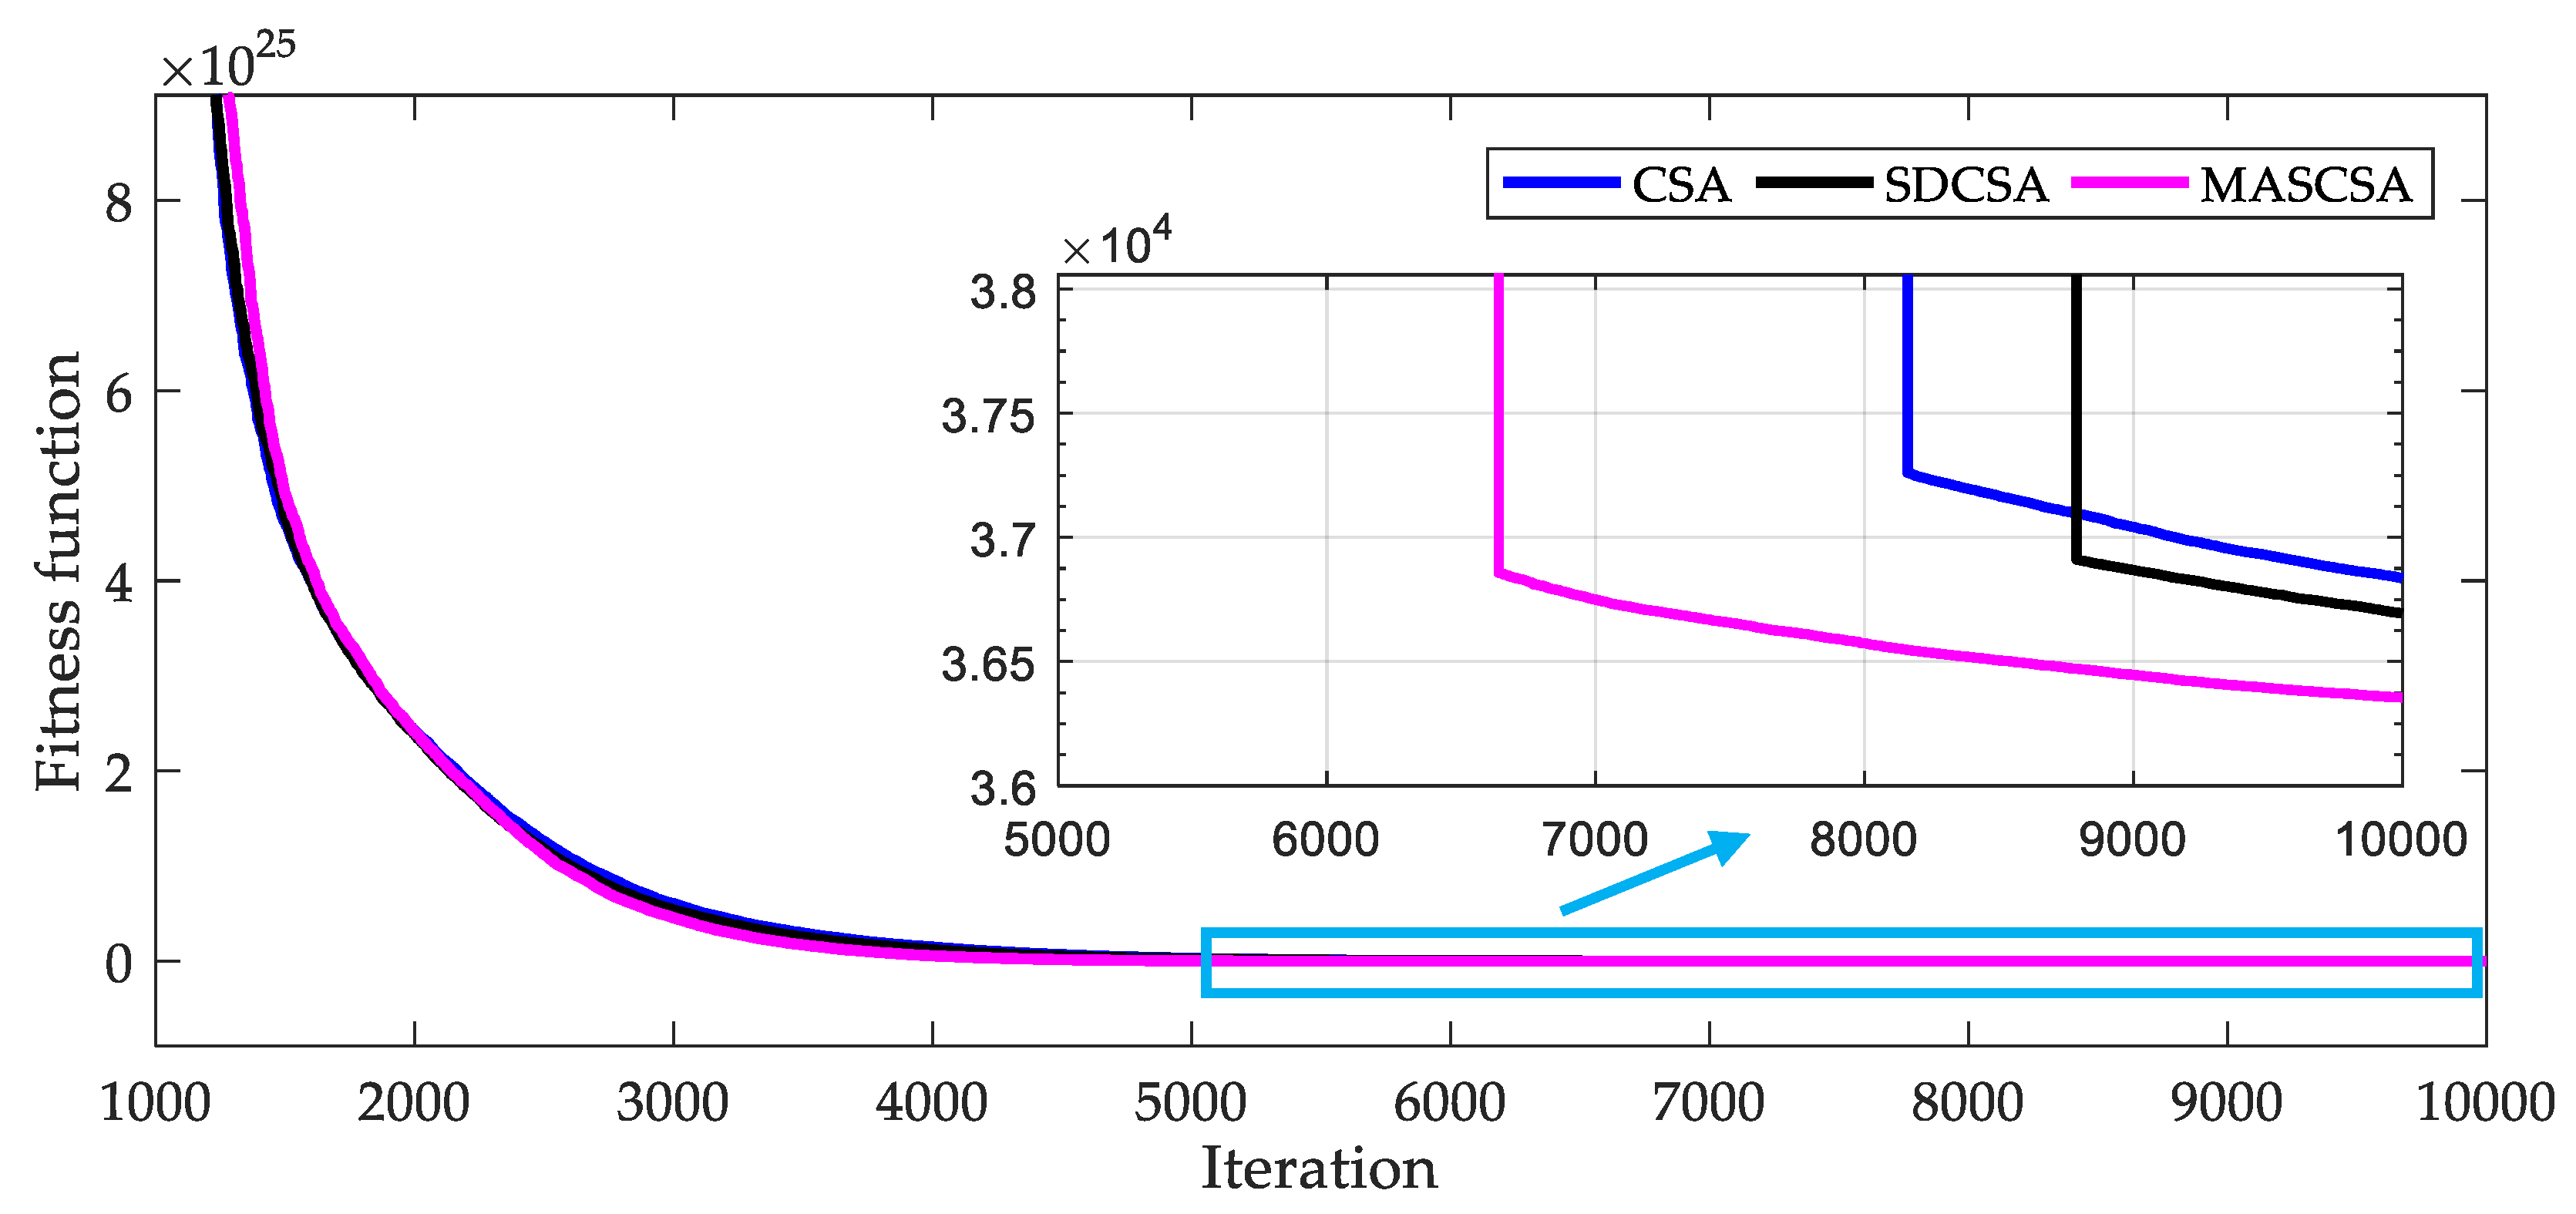
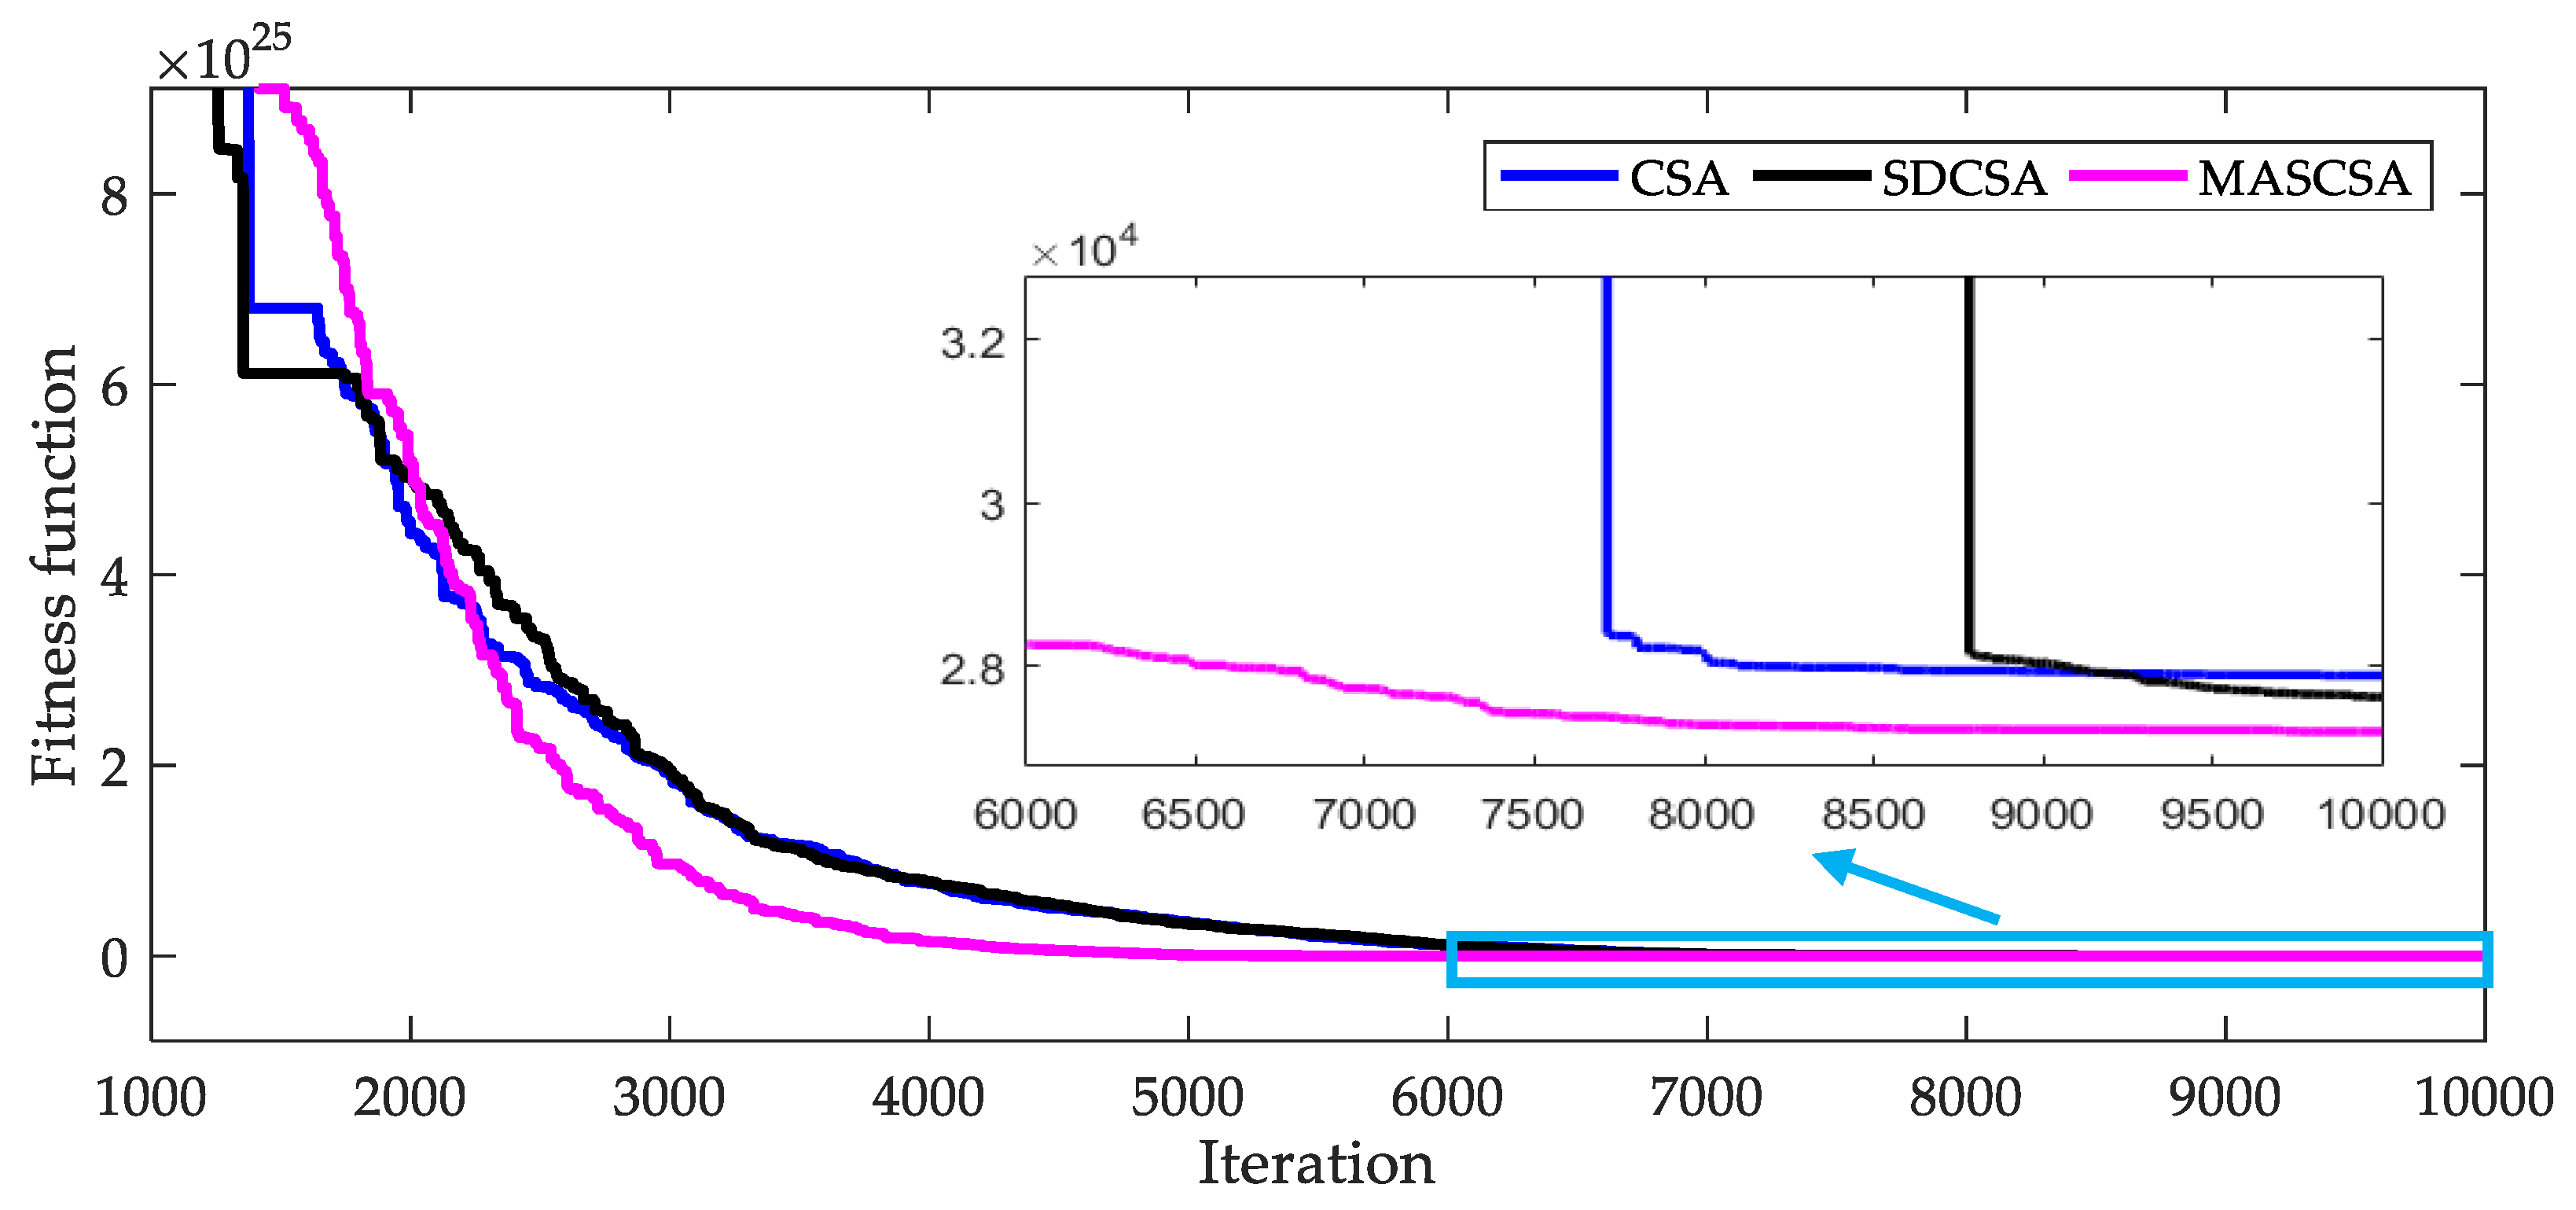
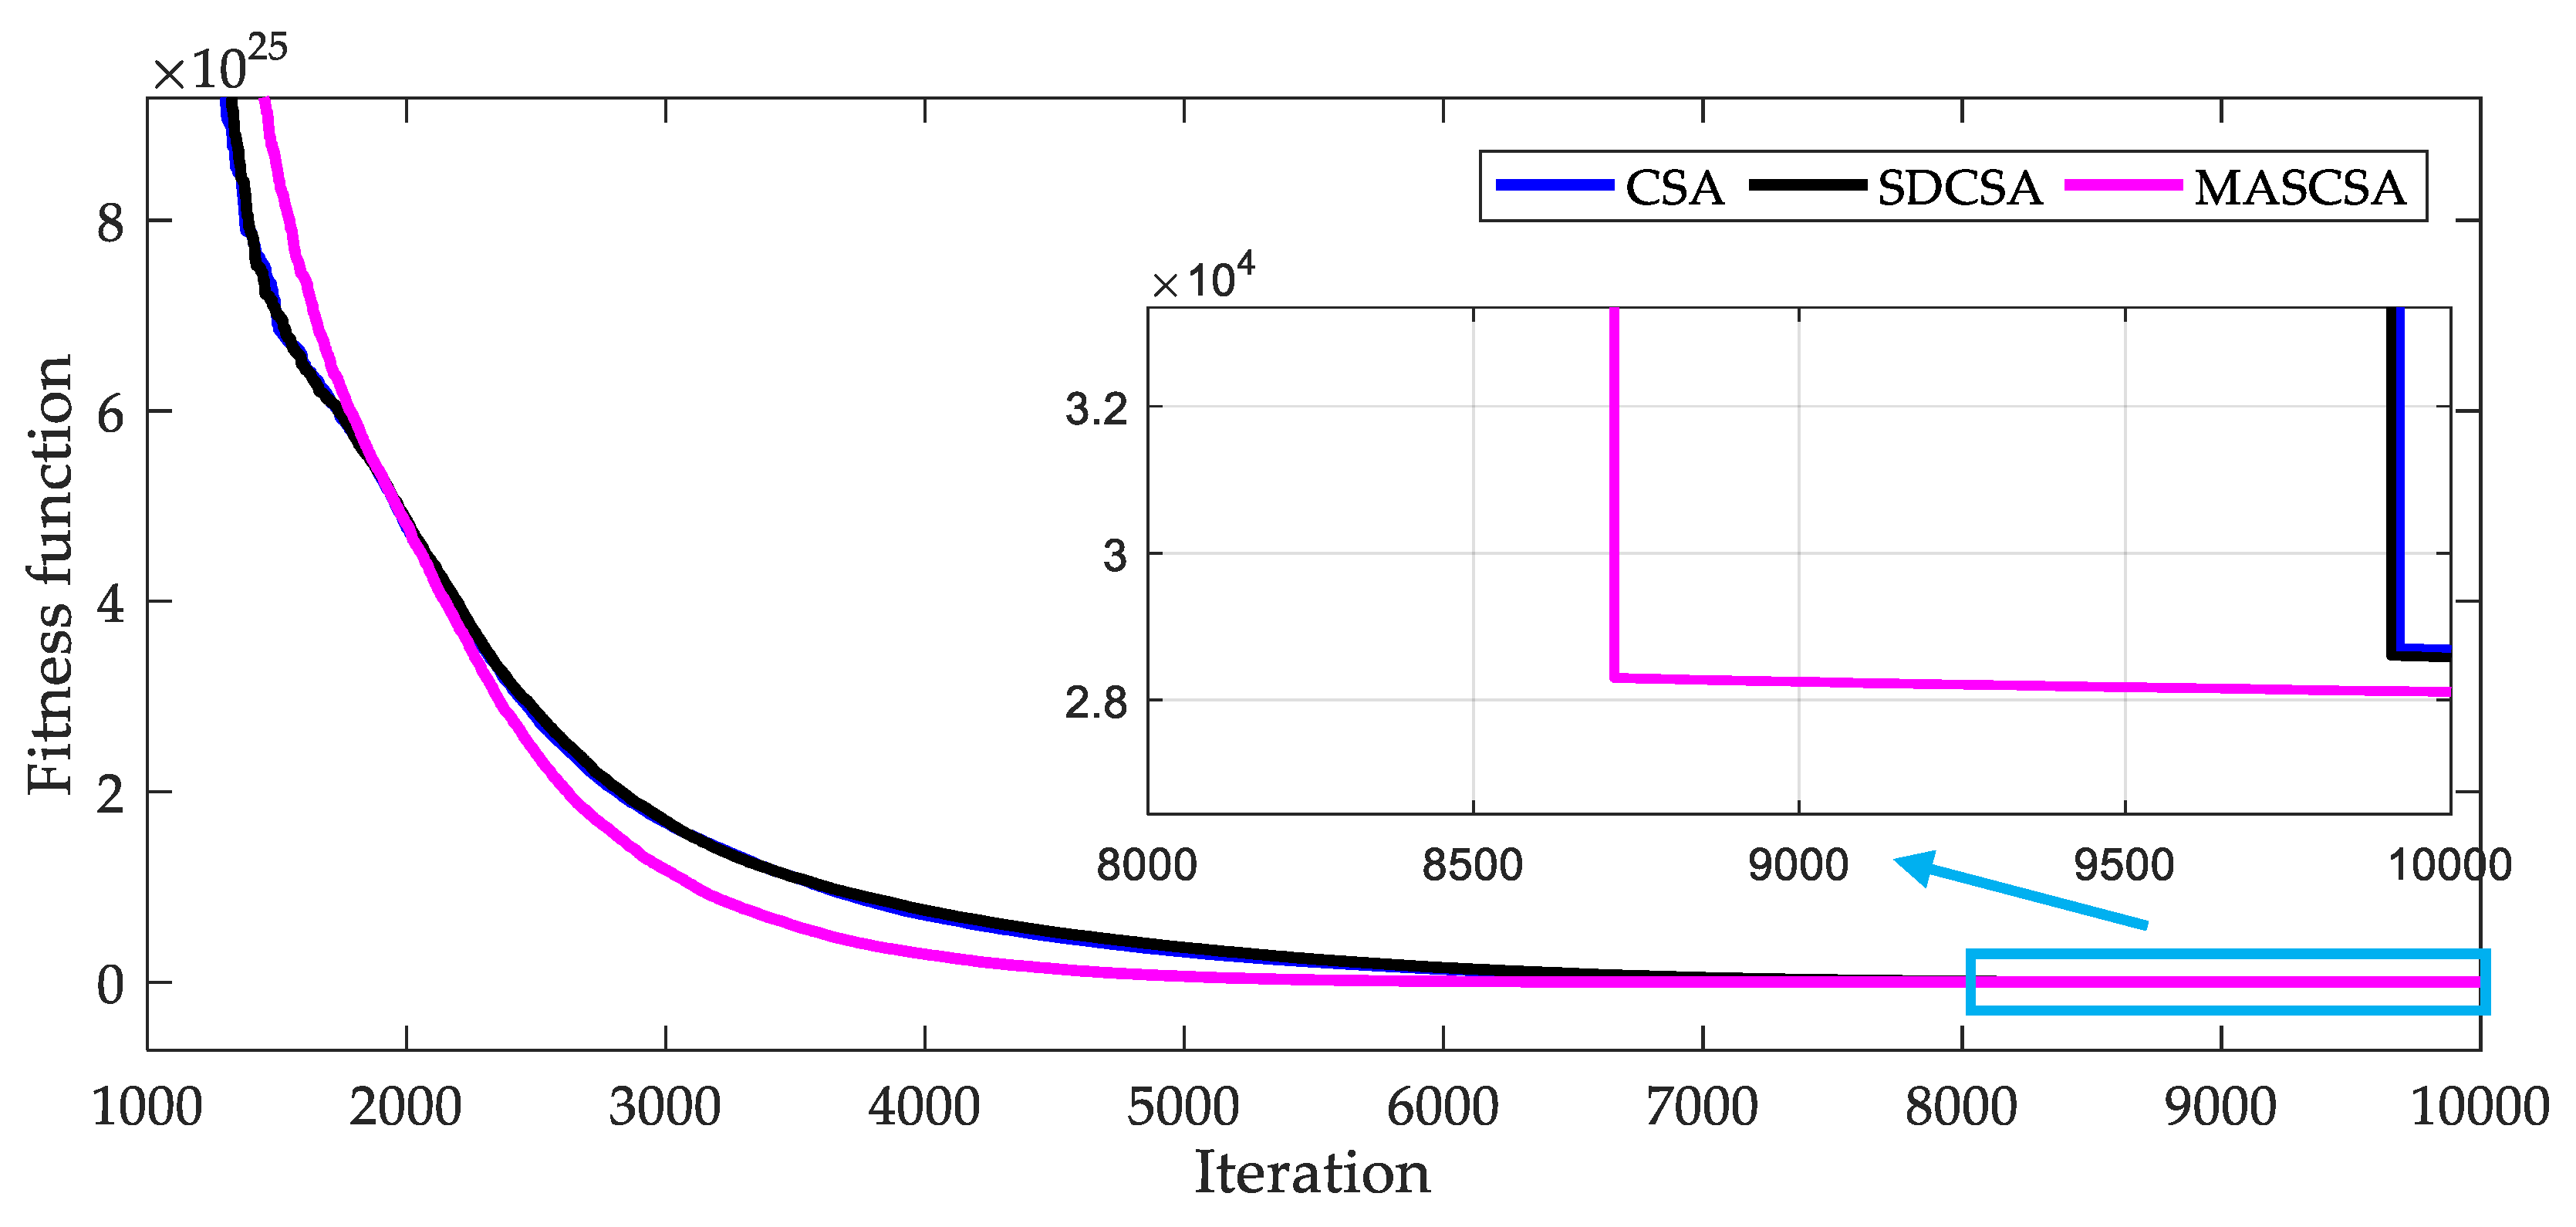
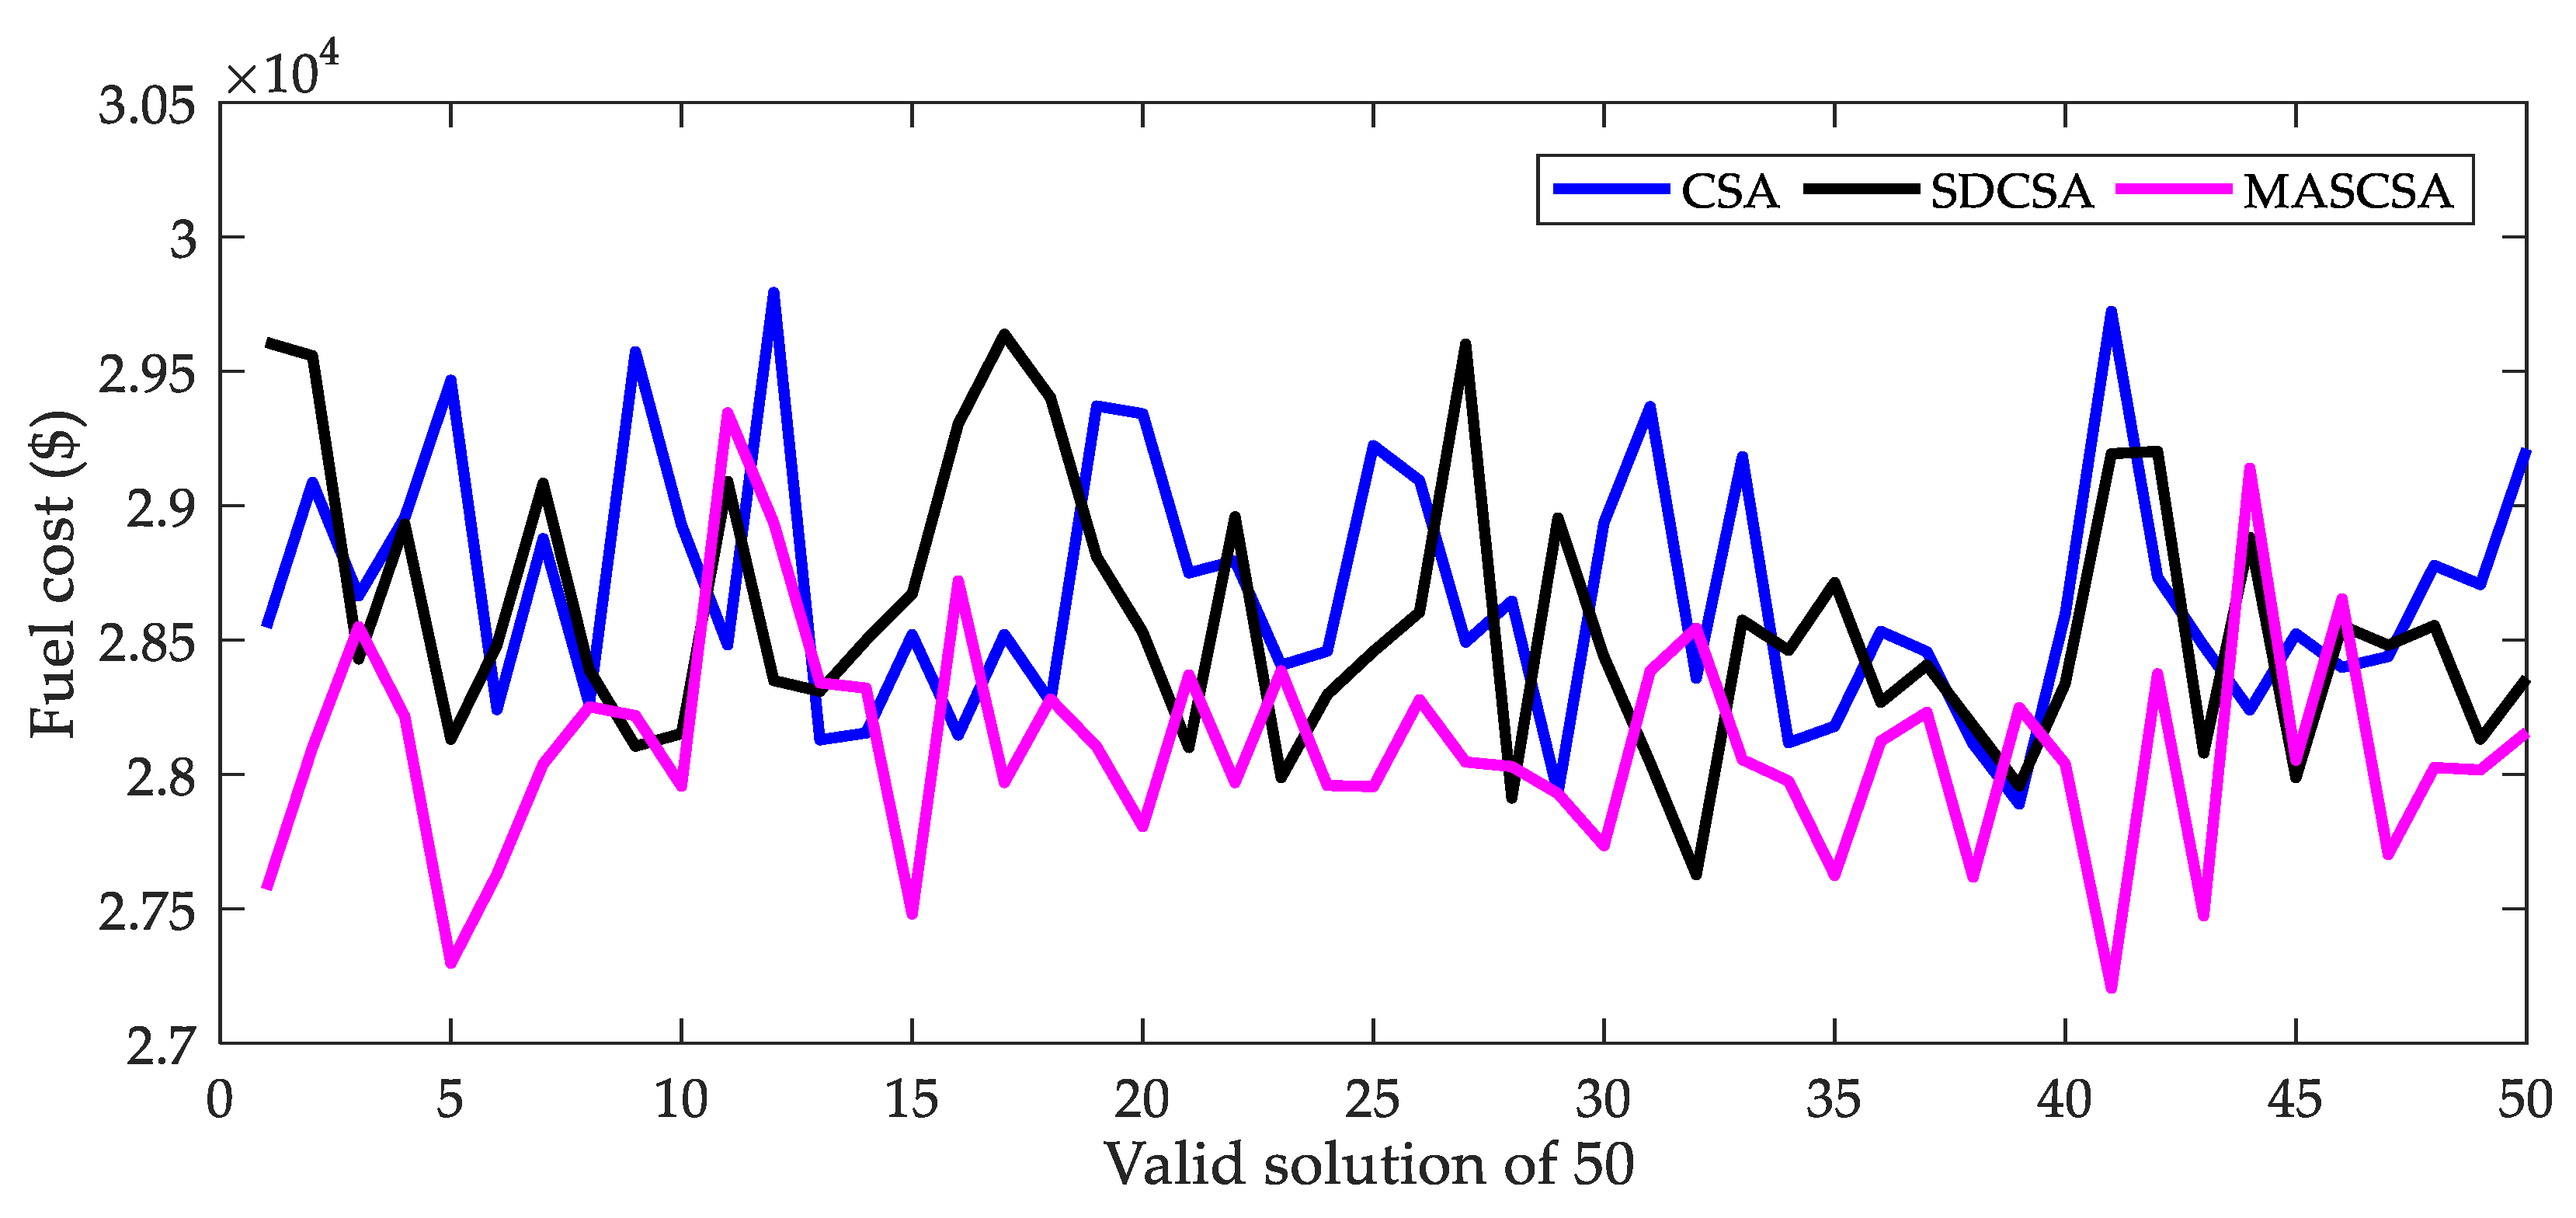
Figure 11 and Figure 12 illustrate the faster search performance of MASCSA than CSA and SDCSA for the best run and the whole search process of 50 successful runs. The pink curves of MASCSA in the two figures are always below the black and blue curves of CSA and SDCSA. The best solution and the mean solution of MASCSA are always more promising than those of CSA and SDCSA at each iteration. Namely, the best solution and the mean solution of MASCSA at the 7000th iteration have lower fitness functions than those of CSA and SDCSA at the 10,000th iteration. Fifty valid solutions shown in Figure 13 indicate that MASCSA can find a high number of better solutions than the best solution of CSA and SDCSA.
In summary, the proposed MASCSA can reach a higher success rate, better solutions, and faster speed than CSA and SDCSA for Test System 2. Consequently, the proposed MASCSA is really effective for the system.

6. Conclusions

In this paper, a Modified Adaptive Selection Cuckoo Search Algorithm (MASCSA) is implemented for determining the optimal operating parameters of a hydrothermal system and a wind-hydro-thermal system, to minimize the total electricity generation cost from all available thermal power plants. The fixed-head short-term model of hydropower plants is taken into consideration. All hydraulic constraints, such as initial and final reservoir volumes, the upper limit and lower limit of reservoir volume, and water balance of reservoir, are seriously considered. The proposed MASCSA competes with the conventional Cuckoo Search Algorithm (CSA) and Snap-Drift Cuckoo Search Algorithm (SDCSA). Two test systems are employed to run the proposed methods and those CSA methods. The comparison results indicate that the proposed method is more powerful than CSA and SDCSA in searching for optimal solutions, with much faster convergence. The proposed method can deal with all constraints more successfully and reach much better results. The success rate of the proposed method is 100% for all test cases, while the success rates of the other CSA methods are 0% or much lower than 100%. Furthermore, the proposed method can reach a speed that is twice as fast as CSA and SDCSA. The improvement of the proposed method is significant compared to CSA methods, even when it is over 2%. Consequently, the proposed method is effective for complicated problems with a set of complicated constraints.

Author Contributions

T.T.N. and L.H.P. have simulated results and written the paper. L.C.K. has collected obtained results and analyzed results. F.M. was responsible for supervising, writing, and editing. All authors have read and agreed to the published version of the manuscript.

Funding

This research received no external funding.

Conflicts of Interest

The authors declare no conflicts of interest regarding the publication of this paper.

Nomenclature

TFCTotal fuel cost for generating electricity of all thermal power plants
tiNumber of hours for the ith subinterval
ktp, mtp, ntp, αtp, βtpCoefficients of the fuel cost function of the tpth thermal power plant
PTtp,iPower generation of the tpth thermal power plant at the ith subinterval
PTtp,minMinimum power generation of the tpth thermal power plant
PTtp,maxMaximum power generation of the tpth thermal power plant
NtNumber of thermal power plants
NsNumber of subintervals
tpThermal power plant index
hpHydropower plant index
NwNumber of wind turbines in a wind farm
NhNumber of hydropower plants
RVhp,iReservoir volume of the hpth hydropower plant at the end of the ith subinterval
WIhp,iWater inflow into the reservoir of the hpth hydropower plant at the ith subinterval
Qhp,iTotal water discharge through turbines of the hpth hydropower plant over the ith subinterval
RVhp,startAvailable reservoir volume of the hpth hydropower plant before optimal scheduling
RVhp,endFinal reservoir volume of the hpth hydropower plant at the end of optimal scheduling
RVhp,NsReservoir volume of the hpth hydropower plant at the end of the Nsth subinterval
RVhp,minMinimum reservoir volume of the hpth hydropower plant
RVhp,maxMaximum reservoir volume of the hpth hydropower plant
qhp,minMinimum discharge per hour through turbines of the hpth hydropower plant
qhp,maxMaximum discharge per hour through turbines of the hpth hydropower plant
qhp,iDischarge per hour through turbines of the hpth hydropower plant over the ith subinterval
xhp, yhp, zhpDischarge function coefficients of the hpth hydropower plant
PHhp,minMinimum power generation of the hpth hydropower plant
PHhp,maxMaximum power generation of the hpth hydropower plant
PTtp,maxMaximum power generation of the tpth thermal power plant
wWind turbine index in the wind farm
PWw,iPower output of the wth wind turbine at the ith subinterval
NwNumber of wind turbines in a wind farm
PWwPower generation of the wth wind turbine
PTL,iTotal power loss at the ith subinterval
PL,iPower of load at the ith subinterval
PWw,rRated generation of the wth turbine
WVwWind speed flowing into the wind turbine
WVinCut-in wind speed
WVrRated wind speed
WVoutCut-out wind speed
SosnewThe sth new solution
SosThe sth solution
δRandomly generated number within 0 and 1
PSPopulation size
ItermaxMaximum number of iterations
FFsFitness function of the sth solution
FFsnewFitness function of the sth new solution

Appendix A

Table A1. Data of thermal units for Test Systems 1 and 2.
Thermal Plant (tp)ktp ($/h)mtp ($/MWh)ntp ($/MW2h)αtp ($/h)βtp (rad/MW)PTtp,min (MW)PTtp,max (MW)
1601.80.0011140.0410500
21002.10.0012160.03810675
31201.70.0013180.03710550
4401.50.0014200.03510500
Table A2. The data of hydropower plants of Test Systems 1 and 2.
Hydro PlantxhpyhpzhpPHhp,min (MW)PHhp,max (MW)RVhp,start (acre-ft)RVhp,end (acre-ft)RVhp,min (acre-ft)RVhp,max (acre-ft)
13304.970.000101000100,00080,00060,000120,000
23505.200.000101000100,00090,00060,000120,000
32805.000.0001101000100,00085,00060,000120,000
43004.800.0001101000100,00085,00060,000120,000
Table A3. Load demand and water inflows of Test Systems 1 and 2, and wind speed of Test System 2.
iPL,i (MW)WI1,i (acre-ft/h)WI2,i (acre-ft/h)WI3,i (acre-ft/h)WI4,i (acre-ft/h)WV1,i (m/s)WV2,i (m/s)
11200100080080060013.250011.8000
2150060050060060014.000012.0000
3110070050070070012.750012.2000
4180090070090090011.900012.4000
5120090070090090012.500012.5000
61300800100080080013.900014.0000
7120080080080080011.800015.0000
8150070080070070012.750014.5000
9110050080050050012.900013.0000
10180050080050050012.200013.7500
111200500100050050015.000013.4000
12130050050050050013.250013.4000
13120080050070080014.300012.8000
14150090060050090014.100012.2500
15110060060060060014.250011.4000
16180050050050090011.750011.5000
17120095095095090013.750011.0000
18130065065065090012.600011.2500
19120055055055070011.500011.1000
20150060080060060011.900011.0000
21110060080060060014.500011.4500
22180035080035070016.000011.8000
231200600100060060012.700011.7500
24130040040080080013.000012.2500
Table A4. Optimal generations obtained by MASCSA for Test System 1.
iPH1,i (MW)PH2,i (MW)PH3,i (MW)PH4,i (MW)PT1,i (MW)PT2,i (MW)PT3,i (MW)PT4,i (MW)
144.8080114.16502490.128587.4164389.345212.6211688.98154372.5341
2609.7317143.249312.82028307.173423.53235230.9884137.202635.30191
3109.646537.354092.452622124.604428.81944257.5346262.3531277.2352
4118.6829209.1928666.0213297.556512.51122258.6675166.980170.38769
556.9809445.39613206.5053160.326378.1622171.7098110.8455370.0738
6503.259629.56263129.0674139.901422.8082314.94842269.5132190.939
736.8607425.0810868.49895347.29294.0159154.25231265.6672308.3319
8354.087119.3664422.406422.1846310.7938440.37366317.7927212.9954
9144.10361.7666144.56178516.361425.0457133.7116315.01317259.4367
10655.227416.5905791.88618456.16418.12036176.534592.90249292.5745
11278.88388.192855.58513137.153891.5818554.79326122.136771.67637
12139.7707155.1218691.52449.5412132.304626.83425147.746997.15622
13303.2588157.3504313.977231.7176583.8376657.62889109.2016143.0277
1410.34539272.7907410.6611120.843618.0867188.22264305.0479274.0019
1588.2857572.0048591.755893.615984125.1402258.6483264.4204196.1286
16202.7669355.5148124.7267413.837821.475338.13277185.3267458.2191
17405.6118173.359865.81836191.381172.358281.6124916.9078292.95048
1853.41923578.287532.0445436.2421714.19755206.325217.42234362.0615
1925.1943955.43374107.4736606.115710.3814517.65185349.274728.47448
20113.4698387.7457218.9941476.710236.4421661.9807594.40057110.2567
2121.3686745.5628968.422350.0108983.52566176.4324517.9546186.7225
22781.8121182.528584.45162206.715212.2315610.00549152.9166369.3391
2332.8683439.96427319.672924.81205163.483728.45411231.0542359.6904
24488.95180.79913514.99782405.599113.56384100.0802197.85578.15313
Table A5. Optimal generations obtained by MASCSA for Test System 2.
iPH1,i (MW)PH2,i (MW)PH3,i (MW)PH4,i (MW)PT1,i (MW)PT2,i (MW)PT3,i (MW)PT4,i (MW)PW1,i (MW)PW2,i (MW)
116.85933229.550.134587148.8408159.250136.35852424.134731.4729954.4
2109.9363124.1835450.167129.375519.2958830.2673195.5862277.188310856
3156.153289.3319329.22211424.334240.384718.7097282.69941108.56479357.6
4513.1342271.135794.45502420.923372.21183249.642919.6089816.8881582.859.2
551.90915130.3908245.2019379.671714.69276115.629298.7023413.802159060
6294.873911.9783196.526834.9835593.8733835.32824182.5234271.1124106.872
7416.692485.923958.473279179.9067101.472122.1053197.93109125.895281.680
8351.3595155.4003202.7161240.538312.5360948.0601138.52946281.86029376
9389.960930.6464454.0425910.0147102.463686.0112177.38582190.674894.864
10720.8998144.4804329.3808181.518793.4664533.3786810.59862129.876686.470
11240.2481189.707886.89813349.991324.0310813.1577296.69512.0709712067.2
12244.4353271.5002395.898777.3669541.9680647.5092945.0870510.034429967.2
13168.008716.6519456.36502475.726611.1065812.3414273.02665212.7731111.662.4
14388.4088216.0905196.1856.1465229.3537172.20059179.7867244.6281109.258
1556.2770787.7448273.204634.6099752.19771161.4649181.1577291.143211151.2
1669.37554645.504983.869471.208510.5716487.95043180.7956117.72438152
1724.4054727.2146408.8432236.692927.55716134.5309146.720441.0353510548
18402.785312.41216333.92884.4410133.34047169.246103.312899.3333891.250
1964.22907202.196735.7458290.8564914.28666246.128598.05939321.69747848.8
20295.139975.00936206.4338254.564483.71423100.8545186.706166.777882.848
2136.08288120.2875402.70224.5884664.47947139.784141.62437104.851211451.6
220.69520718.65639438.5363708.04458.399475.50154141.1705184.596712054.4
23178.9307341.9207198.979380.8728222.2519629.9350410.96953189.739992.454
24396.568869.67454216.289157.785727.38508154.219288.015636.062029658

References

  1. Nguyen, T.T.; Vu Quynh, N.; Duong, M.Q.; Van Dai, L. Modified differential evolution algorithm: A novel approach to optimize the operation of hydrothermal power systems while considering the different constraints and valve point loading effects. Energies 2018, 11, 540. [Google Scholar] [CrossRef] [Green Version]
  2. Wood, A.; Wollenberg, B. Power Generation, Operation and Control; Wiley: New York, NY, USA, 1996. [Google Scholar]
  3. Zaghlool, M.F.; Trutt, F.C. Efficient methods for optimal scheduling of fixed head hydrothermal power systems. IEEE Trans. Power Syst. 1988, 3, 24–30. [Google Scholar] [CrossRef]
  4. Basu, M. Hopfield neural networks for optimal scheduling of fixed head hydrothermal power systems. Electr. Power Syst. Res. 2003, 64, 11–15. [Google Scholar] [CrossRef]
  5. Wong, K.P.; Wong, Y.W. Short-term hydrothermal scheduling part. I. Simulated annealing approach. IEE Proc. Gener. Transm. Distrib. 1994, 141, 497–501. [Google Scholar] [CrossRef]
  6. Yang, P.C.; Yang, H.T.; Huang, C.L. Scheduling short-term hydrothermal generation using evolutionary programming techniques. IEE Proc. Gener. Transm. Distrib. 1996, 143, 371–376. [Google Scholar] [CrossRef]
  7. Hota, P.K.; Chakrabarti, R.; Chattopadhyay, P.K. Short-term hydrothermal scheduling through evolutionary programming technique. Electr. Power Syst. Res. 1999, 52, 189–196. [Google Scholar] [CrossRef]
  8. Sharma, A.K.; Tyagi, R.; Singh, S.P. Short term hydrothermal scheduling using evolutionary programming. Int. J. Inv. Res., Eng. Sci. and Tech. 2014, 1, 19–23. [Google Scholar]
  9. Chang, H.C.; Chen, P.H. Hydrothermal generation scheduling package: A genetic based approach. IEE Proc. Gener. Transm. Distrib. 1998, 145, 451–457. [Google Scholar] [CrossRef] [Green Version]
  10. Sinha, N.; Chakrabarti, R.; Chattopadhyay, P.K. Fast evolutionary programming techniques for short-term hydrothermal scheduling. IEEE Trans. Power Syst. 2003, 18, 214–220. [Google Scholar] [CrossRef]
  11. Nallasivan, C.; Suman, D.S.; Henry, J.; Ravichandran, S. A novel approach for short-term hydrothermal scheduling using hybrid technique. In Proceedings of the 2006 IEEE Power India Conference, New Delhi, India, 10–12 April 2006; p. 5. [Google Scholar]
  12. Samudi, C.; Das, G.P.; Ojha, P.C.; Sreeni, T.S.; Cherian, S. Hydro thermal scheduling using particle swarm optimization. In Proceedings of the 2008 IEEE/PES Transmission and Distribution Conference and Exposition, Chicago, IL, USA, 21–24 April 2008; pp. 1–5. [Google Scholar]
  13. Farhat, I.A.; El-Hawary, M.E. Short-term hydro-thermal scheduling using an improved bacterial foraging algorithm. In Proceedings of the 2009 IEEE Electrical Power & Energy Conference (EPEC), Montreal, QC, Canada, 22–23 October 2009; pp. 1–5. [Google Scholar]
  14. Thakur, S.; Boonchay, C.; Ongsakul, W. Optimal hydrothermal generation scheduling using self-organizing hierarchical PSO. In Proceedings of the IEEE PES General Meeting, Minneapolis, MN, USA, 26 July 2010; pp. 1–6. [Google Scholar]
  15. Türkay, B.; Mecitoğlu, F.; Baran, S. Application of a fast evolutionary algorithm to short-term hydro-thermal generation scheduling. Energy Sources Part B Econ. Plan. Policy 2011, 6, 395–405. [Google Scholar] [CrossRef]
  16. Padmini, S.; Rajan, C.C.A. Improved PSO for Short Term Hydrothermal Scheduling. In Proceedings of the International Conference on Sustainable Energy and Interlligent Systems, Chennai, India, 20–22 July 2011; pp. 332–334. [Google Scholar]
  17. Padmini, S.; Rajan, C.C.A.; Murthy, P. Application of improved PSO technique for short term hydrothermal generation scheduling of power system. In Proceedings of the International Conference on Swarm, Evolutionary, and Memetic Computing, Visakhapatnam, India, 19–21 December 2011; Springer: Berlin/Heidelberg, Germany, 2011; pp. 176–182. [Google Scholar]
  18. Swain, R.K.; Barisal, A.K.; Hota, P.K.; Chakrabarti, R. Short-term hydrothermal scheduling using clonal selection algorithm. Int. J. Electr. Power Energy Syst. 2011, 33, 647–656. [Google Scholar] [CrossRef]
  19. Fakhar, M.S.; Kashif, S.A.R.; Saqib, M.A.; ul Hassan, T. Non cascaded short-term hydro-thermal scheduling using fully-informed particle swarm optimization. Int. J. Electr. Power Energy Syst. 2015, 73, 983–990. [Google Scholar] [CrossRef]
  20. Nguyen, T.T.; Vo, D.N.; Ongsakul, W. One rank cuckoo search algorithm for short-term hydrothermal scheduling with reservoir constraint. In Proceedings of the 2015 IEEE Eindhoven PowerTech, Eindhoven, The Netherlands, 29 June–2 July 2015; pp. 1–6. [Google Scholar]
  21. Nguyen, T.T.; Vo, D.N.; Dinh, B.H. Cuckoo search algorithm using different distributions for short-term hydrothermal scheduling with reservoir volume constraint. Int. J. Electr. Eng. Inform. 2016, 8, 76. [Google Scholar] [CrossRef]
  22. Dinh, B.H.; Nguyen, T.T.; Vo, D.N. Adaptive cuckoo search algorithm for short-term fixed-head hydrothermal scheduling problem with reservoir volume constraints. Int. J. Grid Distrib. Comput. 2016, 9, 191–204. [Google Scholar] [CrossRef]
  23. Nguyen, T.T.; Vo, D.N.; Deveikis, T.; Rozanskiene, A. Improved cuckoo search algorithm for nonconvex hydrothermal scheduling with volume constraint. Elektronika ir Elektrotechnika 2017, 23, 68–73. [Google Scholar]
  24. Nguyen, T.T.; Vo, D.N.; Dinh, B.H. An effectively adaptive selective cuckoo search algorithm for solving three complicated short-term hydrothermal scheduling problems. Energy 2018, 155, 930–956. [Google Scholar] [CrossRef]
  25. Jadhav, H.T.; Roy, R. Gbest guided artificial bee colony algorithm for environmental/economic dispatch considering wind power. Expert Syst. Appl. 2013, 40, 6385–6399. [Google Scholar] [CrossRef]
  26. Liu, X. Economic load dispatch constrained by wind power availability: A wait-and-see approach. IEEE Trans. Smart Grid 2010, 1, 347–355. [Google Scholar] [CrossRef]
  27. Yuan, X.; Tian, H.; Yuan, Y.; Huang, Y.; Ikram, R.M. An extended NSGA-III for solution multi-objective hydro-thermal-wind scheduling considering wind power cost. Energy Convers. Manag. 2015, 96, 568–578. [Google Scholar] [CrossRef]
  28. Zhou, J.; Lu, P.; Li, Y.; Wang, C.; Yuan, L.; Mo, L. Short-term hydro-thermal-wind complementary scheduling considering uncertainty of wind power using an enhanced multi-objective bee colony optimization algorithm. Energy Convers. Manag. 2016, 123, 116–129. [Google Scholar] [CrossRef]
  29. Chen, Y.; Wei, W.; Liu, F.; Mei, S. Distributionally robust hydro-thermal-wind economic dispatch. Appl. Energy 2016, 173, 511–519. [Google Scholar] [CrossRef]
  30. de Moraes, R.A.; Fernandes, T.S.; Arantes, A.G.; Unsihuay-Vila, C. Short-term scheduling of integrated power and spinning reserve of a wind-hydrothermal generation system with ac network security constraints. J. Control. Autom. Electr. Syst. 2018, 29, 1–14. [Google Scholar] [CrossRef]
  31. Damodaran, S.K.; Sunil Kumar, T.K. Hydro-thermal-wind generation scheduling considering economic and environmental factors using heuristic algorithms. Energies 2018, 11, 353. [Google Scholar] [CrossRef] [Green Version]
  32. He, Z.; Zhou, J.; Sun, N.; Jia, B.; Qin, H. Integrated scheduling of hydro, thermal and wind power with spinning reserve. Energy Procedia 2019, 158, 6302–6308. [Google Scholar] [CrossRef]
  33. Cotia, B.P.; Borges, C.L.; Diniz, A.L. Optimization of wind power generation to minimize operation costs in the daily scheduling of hydrothermal systems. Int. J. Electr. Power Energy Syst. 2019, 113, 539–548. [Google Scholar] [CrossRef]
  34. Daneshvar, M.; Mohammadi-Ivatloo, B.; Zare, K.; Asadi, S. Two-stage stochastic programming model for optimal scheduling of the wind-thermal-hydropower-pumped storage system considering the flexibility assessment. Energy 2020, 193, 116657. [Google Scholar] [CrossRef]
  35. Dasgupta, K.; Roy, P.K.; Mukherjee, V. Power flow based hydro-thermal-wind scheduling of hybrid power system using sine cosine algorithm. Electr. Power Syst. Res. 2020, 178, 106018. [Google Scholar] [CrossRef]
  36. Yang, X.S.; Deb, S. Cuckoo search via Lévy flights. In Proceedings of the 2009 World Congress on Nature & Biologically Inspired Computing (NaBIC) IEEE, Coimbatore, India, 9–11 December 2009; pp. 210–214. [Google Scholar]
  37. Rakhshani, H.; Rahati, A. Snap-drift cuckoo search: A novel cuckoo search optimization algorithm. Appl. Soft Comput. 2017, 52, 771–794. [Google Scholar] [CrossRef]
  38. Mohammadi, F.; Zheng, C. Stability Analysis of Electric Power System. In Proceedings of the 4th National Conference on Technology in Electrical and Computer Engineering, Tehran, Iran, 27 December 2018. [Google Scholar]
  39. Mohammadi, F.; Nazri, G.-A.; Saif, M. A bidirectional power charging control strategy for plug-in hybrid electric vehicles. Sustainability 2019, 11, 4317. [Google Scholar] [CrossRef] [Green Version]
  40. Mohammadi, F.; Nazri, G.-A.; Saif, M. An improved droop-based control strategy for MT-HVDC systems. Electronics 2020, 9, 87. [Google Scholar] [CrossRef] [Green Version]
  41. Mohammadi, F.; Nazri, G.-A.; Saif, M. An improved mixed AC/DC power flow algorithm in hybrid AC/DC grids with MT-HVDC systems. Appl. Sci. 2020, 10, 297. [Google Scholar] [CrossRef] [Green Version]
  42. Nguyen, T.T.; Mohammadi, F. Optimal placement of TCSC for congestion management and power loss reduction using multi-objective genetic algorithm. Sustainability 2020, 12, 2813. [Google Scholar] [CrossRef] [Green Version]
  43. Shojaei, A.H.; Ghadimi, A.A.; Miveh, M.R.; Mohammadi, F.; Jurado, F. Multi-Objective Optimal Reactive Power Planning under Load Demand and Wind Power Generation Uncertainties Using ε-Constraint Method. Appl. Sci. 2020, 10, 2859. [Google Scholar] [CrossRef]
  44. Yao, F.; Dong, Z.Y.; Meng, K.; Xu, Z.; Iu, H.H.C.; Wong, K.P. Quantum-inspired particle swarm optimization for power system operations considering wind power uncertainty and carbon tax in Australia. IEEE Trans. Ind. Inform. 2012, 8, 880–888. [Google Scholar] [CrossRef]
  45. Zhang, H.; Yue, D.; Xie, X.; Dou, C.; Sun, F. Gradient decent based multi-objective cultural differential evolution for short-term hydrothermal optimal scheduling of economic emission with integrating wind power and photovoltaic power. Energy 2017, 122, 748–766. [Google Scholar] [CrossRef]
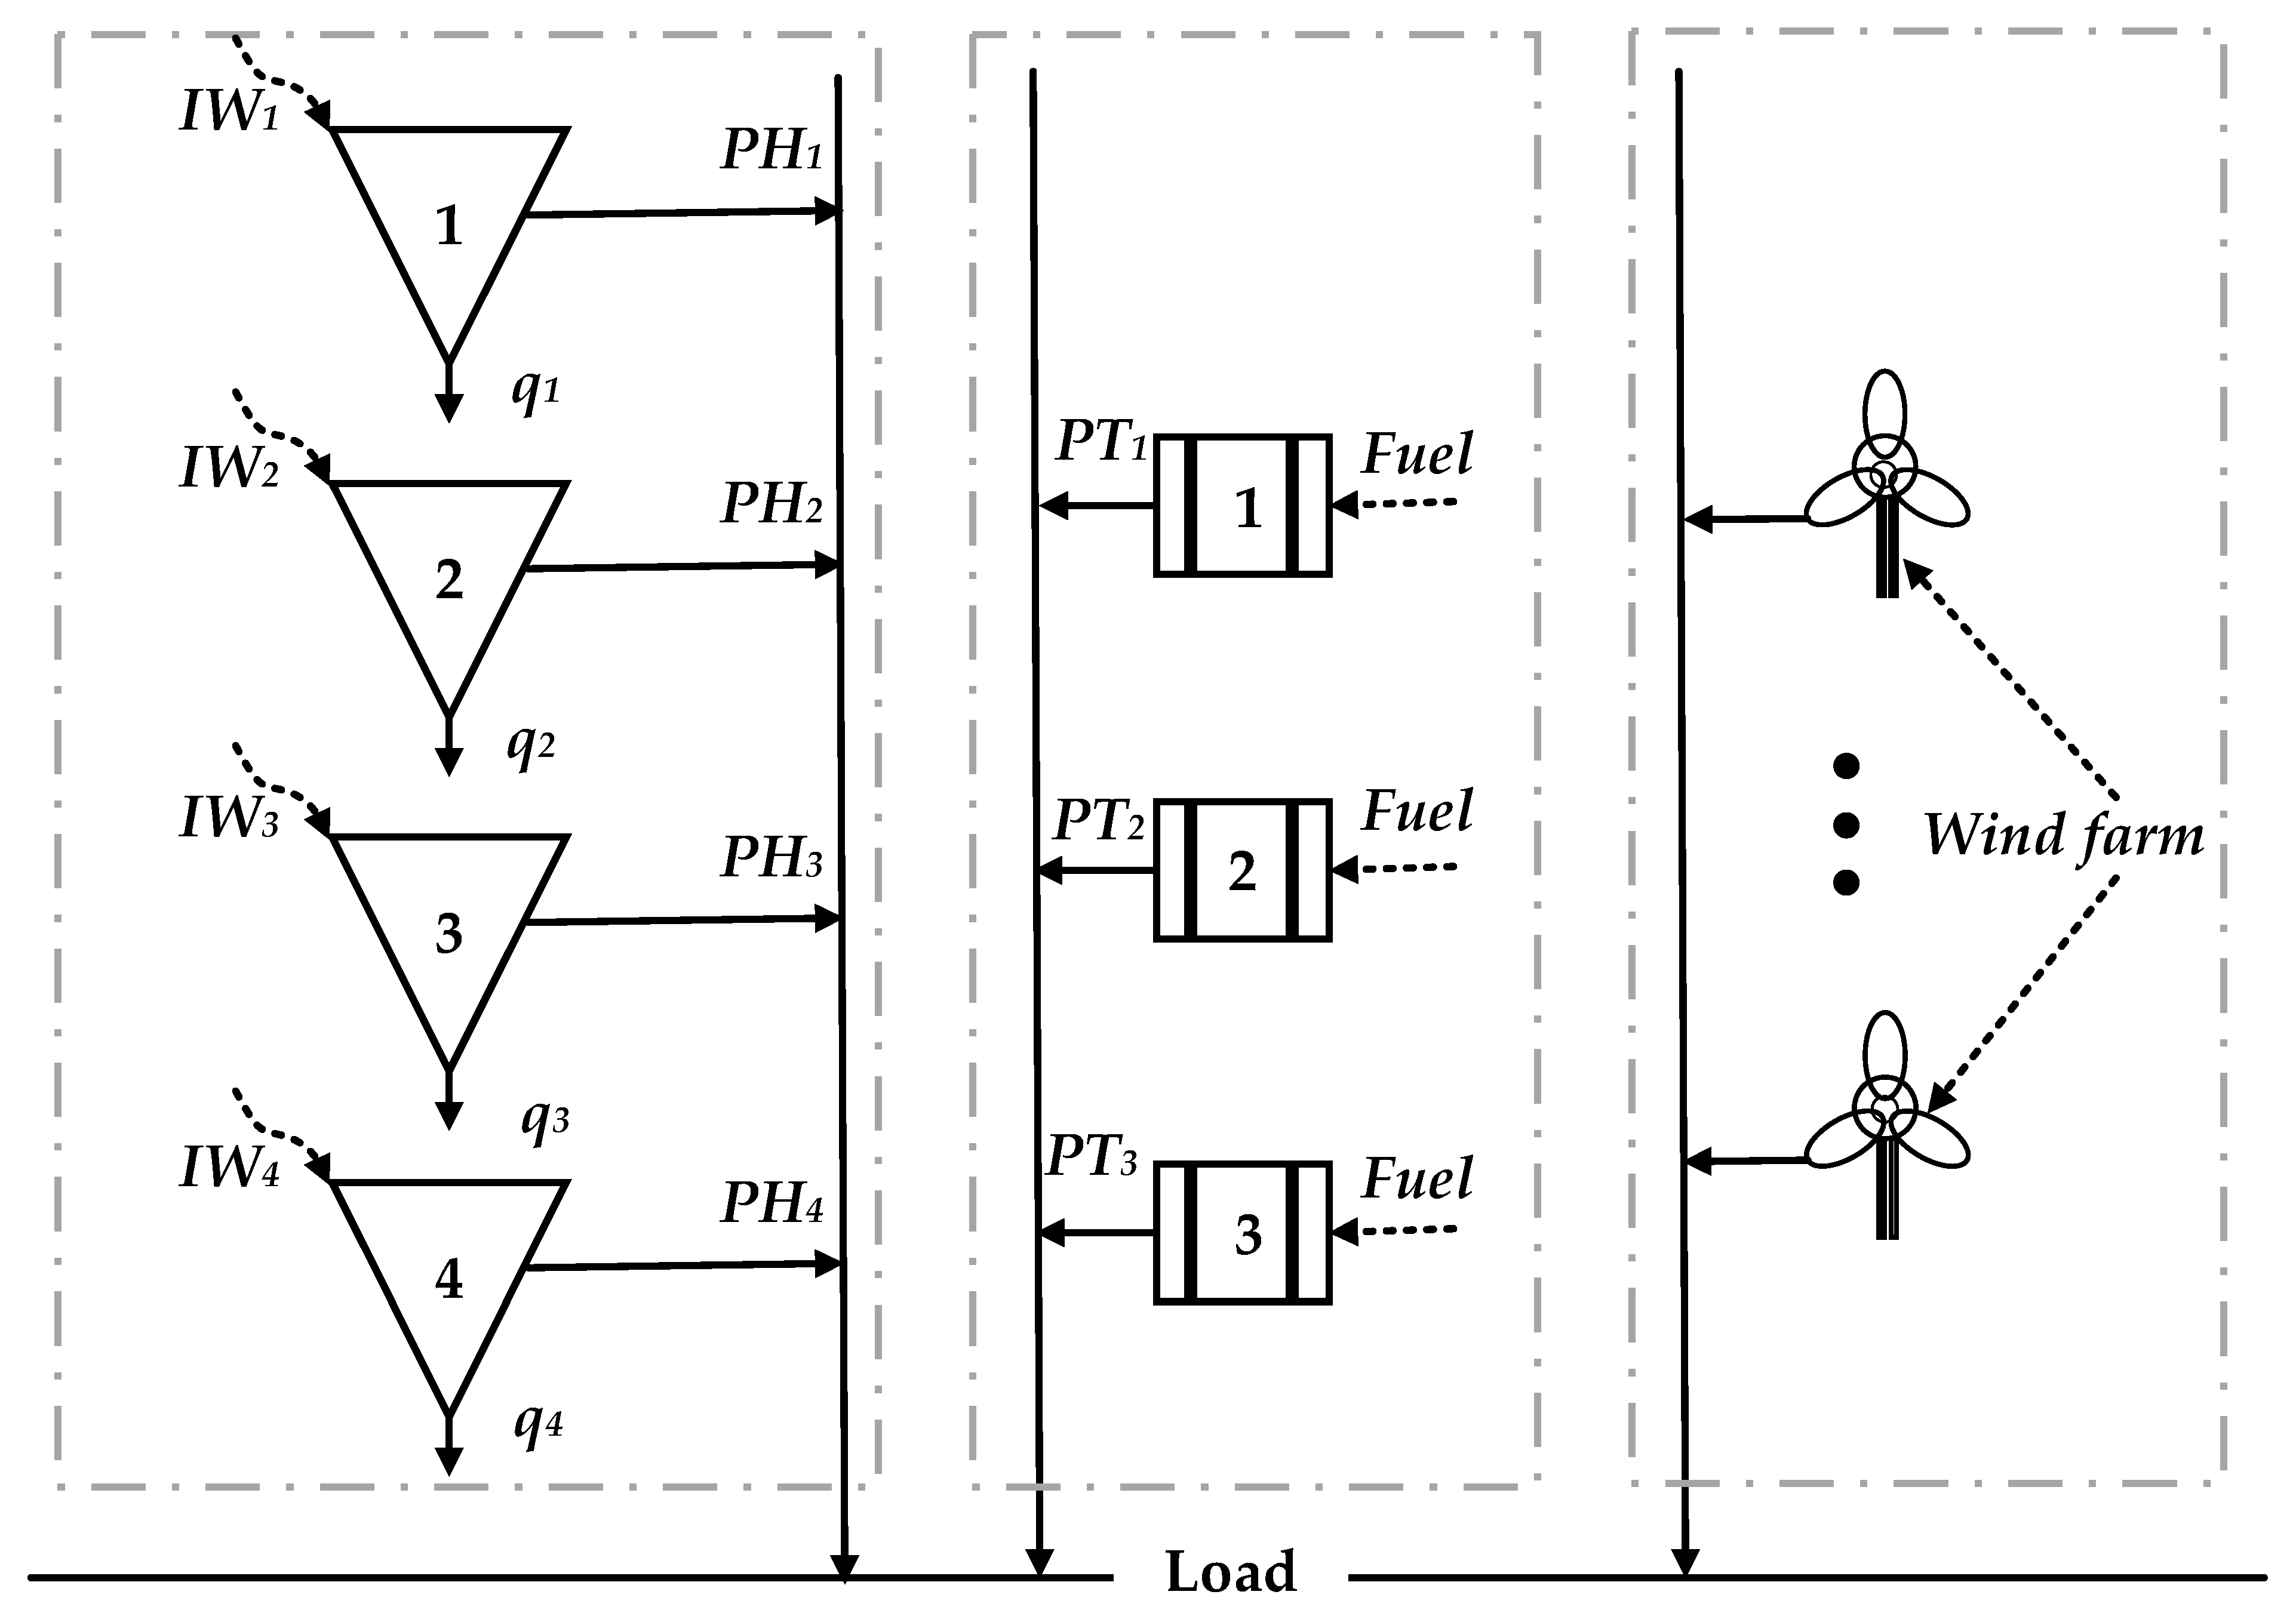
Figure 1. A typical wind-hydro-thermal system.
Applsci 10 02964 g001
Figure 2. A typical wind turbine characteristic.
Applsci 10 02964 g002
Figure 3. The flowchart for implementing MASCSA for OSWHT problem.
Applsci 10 02964 g003
Figure 4. Better cost in $ obtained by MASCSA, compared to CSA and SDCSA, for Test System 1.
Applsci 10 02964 g004
Figure 5. The level of improvement of MASCSA compared with CSA and SDCSA for Test System 1.
Applsci 10 02964 g005
Figure 6. The best convergence characteristics obtained by implemented CSA methods for Test System 1.
Applsci 10 02964 g006
Figure 7. The mean convergence characteristics of 50 successful runs obtained by implemented CSA methods for Test System 1.
Applsci 10 02964 g007
Figure 8. Fitness functions of 50 successful runs obtained by CSA methods for Test System 1.
Applsci 10 02964 g008
Figure 9. Better cost in $ obtained by MASCSA, compared to CSA and SDCSA for Test System 2.
Applsci 10 02964 g009
Figure 10. The level of improvement of MASCSA, compared to CSA and SDCSA for Test System 2.
Applsci 10 02964 g010
Figure 11. The best convergence characteristics obtained by implemented CSA methods for Test System 2.
Applsci 10 02964 g011
Figure 12. The mean convergence characteristics of 50 successful runs obtained by implemented CSA methods for Test System 2.
Applsci 10 02964 g012
Figure 13. Fitness functions of 50 successful runs obtained by CSA methods for Test System 2.
Applsci 10 02964 g013
Table 1. Summary of results obtained by CSA, SDCSA, and MASCSA for Test System 1.
MethodCSASDCSAMASCSA
Minimum Cost ($)35640.0935550.0635447.25
Average Cost ($)36835.2136694.2736355.55
Maximum Cost ($)38616.8238595.0737533.4
Std. Dev. ($)595.36628.65458.1301
Computation Time (s)437.30498.71457.92
Success Rate50/7050/5050/50
Table 2. Summary of results obtained by CSA, SDCSA, and MASCSA for Test System 2.
MethodCSASDCSAMASCSA
Minimum Cost ($)27890.6727628.0627205.16
Average Cost ($)28682.3728576.1728109.42
Maximum Cost ($)29793.5229638.0129346.04
Std. Dev. 471.41494.50421.88
Computation Time (s)440.5499. 1462.4
Success Rate (%)50/7250/6550/50