Abstract
Remote sensing data plays an important role in classifying land use/land cover (LULC) information from various sensors having different spectral, spatial and temporal resolutions. The fusion of an optical image and a synthetic aperture radar (SAR) image is significant for the study of LULC change and simulation in cloudy mountain areas. This paper proposes a novel feature-level fusion framework, in which the Landsat operational land imager (OLI) images with different cloud covers, and a fully polarized Advanced Land Observing Satellite-2 (ALOS-2) image are selected to conduct LULC classification experiments. We take the karst mountain in Chongqing as a study area, following which the features of the spectrum, texture, and space of the optical and SAR images are extracted, respectively, supplemented by the normalized difference vegetation index (NDVI), elevation, slope and other relevant information. Furthermore, the fused feature image is subjected to object-oriented multi-scale segmentation, subsequently, an improved support vector machine (SVM) model is used to conduct the experiment. The results showed that the proposed framework has the advantages of multi-source data feature fusion, high classification performance and can be applied in mountain areas. The overall accuracy (OA) was more than 85%, with the Kappa coefficient values of 0.845. In terms of forest, gardenland, water, and artificial surfaces, the precision of fusion image was higher compared to single data source. In addition, ALOS-2 data have a comparative advantage in the extraction of shrubland, water, and artificial surfaces. This work aims to provide a reference for selecting the suitable data and methods for LULC classification in cloudy mountain areas. When in cloudy mountain areas, the fusion features of images should be preferred, during the period of low cloudiness, the Landsat OLI data should be selected, when no optical remote sensing data are available, and the fully polarized ALOS-2 data are an appropriate substitute.
1. Introduction
Using remote-sensing data to quickly and accurately obtain land use/land cover (LULC) information can provide the basic data for studying the spatio–temporal changes in land use and global change [1]. The mountains in southwestern China (Chongqing, Sichuan, Guizhou, etc.) are affected by clouds and fog [2], only a few optical remote sensing images are available. Furthermore, the complex terrain severely affects the optical and microwave images [3], there is a large difference in the effective light received by each pixel of the remote-sensing image [4]. This phenomenon has resulted in considerable difficulties in the extraction of mountain-surface information.
In the early global and regional scales, LULC classification was mainly performed using normalized difference vegetation index (NDVI) of NOAA_AVHRR data or combined with the data obtained using other channels of AVHRR. On the basis of these data, researchers have conducted considerable research [5], however, the low spatial resolution (1 km) resulted in many uncertainties in the LULC classification. Landsat MSS/TM/ETM+, which has been shared for free globally since 2008, and terrain orthorectification products (L1T products) of the operational land imager (OLI) series satellites successfully launched in 2013 were used. The Landsat series data are more widely used for land-cover-change monitoring. Gilbertson [6] used the Landsat OLI panchromatic and multispectral fusion data to extract the crops by using decision trees, support vector machines (SVMs), and random forests. Wang [7] used the Landsat OLI data to conduct LULC classification in Beijing, the results showed that compared with Landsat TM/ETM+ data, the new features of the Landsat OLI data are helpful in improving the accuracy of LULC classification.
Since the 1990s, the technology of synthetic aperture radar (SAR) has developed rapidly and become a useful supplement to optical remote sensing. This technology has strong penetration imaging characteristics [8] and an added advantage that it can generate images during almost all weather conditions. Besides, it will not be affected by cloud or rain to a certain extent as well. The SAR has an added advantage that it can penetrate the surface to a certain extent depending upon the operating frequency and the dielectric constant of the target, SAR images contain useful information that cannot be found in optical images. At the beginning of the development of SAR remote sensing, the LULC classification could only work on the basis of multi-temporal, single-polar SAR data, i.e., to fully use the time-series characteristics of the backscatter coefficients of various types of surface features. In recent years, the SAR technology [9,10] has been developed to achieve high-resolution, multi-mode, and multi-polarization features. Not only can the shape of the ground object be retrieved by the power of the ground surface echo, but also the relative phase information between different polarization channels can be used to reflect the medium electrical properties and other characteristics [11]. Furthermore, dual-polarization and full-polarization SAR data contain more complete physical and structural information of the target, providing new technical methods [12,13] for dynamic land-use monitoring and LULC classification. SAR LULC classification methods are mainly divided into two types [14,15], one is to directly use the backscattering matrix or polarization covariance matrix and polarization coherence matrix of the SAR data; the other is to perform polarization coherence decomposition on the basis of different matrices in order to obtain classification features, combined with classifier classification. Data fusion is critical to improving the application ability of remote-sensing images, and it has been a research hotspot in the domain of remote-sensing information processing and application for a long time. Optical and microwave remote sensing are two of the most common methods for obtaining the surface information. Optical remote sensing data offer an enormous amount of spectral information. However, microwave data offer a certain penetration of ground objects that have high surface roughness, complex permittivity, and body structure. Furthermore, it is reflected that the fusion of optical images and SAR images can effectively improve the accuracy of LULC classification [16,17,18].
At present, remote-sensing image fusion has developed into the following three levels: pixel-level fusion, image fusion, and feature-level fusion [19]. Compared with the pixel-level fusion, feature-level fusion considers various factors such as the feature information and correlation contained in the image itself, and it helps obtain more macro-level feature-level information than that obtained using pixel-level fusion.
In this study, we intend to conduct the feature-level fusion of Landsat 8 OLI data and Advanced Land Observing Satellite-2 (ALOS 2) data, following which we analyze and compare the classification results and classification accuracy of different remote-sensing images and classification methods; subsequently, we select suitable methods for extracting the land information in cloudy, foggy mountain areas under different cloud covers. Taking Chongqing Zhongliang Mountain as a study area, the fusion classification method of optical and SAR images is verified, providing the theoretical guidance for LULC classification in cloudy mountainous areas.
2. Study Area and Data Sources
2.1. Study Area
Chongqing (Figure 1) is located in southwest China (105°17′ E–110°11′ E, 28°10′ N–32°13′ N), and the total basin area is approximately 82,400 km2, extending 450 km from the north to south and 470 km from the east to west. It is an important strategic fulcrum city for the development of the western region [20], construction of the “Belt and Road,” and development of the Yangtze River Economic Belt. The study area is located in the northwestern part of the main city of Chongqing, covering nine districts. Located between Huaying Mountain and Fangdou Mountain, it is located in the low hilly area of the parallel ridge valley. The terrain is high in the north and low in the south, west, and east. The Jialing River flows from the north to south, cutting through the three anticline mountains of Yunwu Mountain, Jinyun Mountain, and Zhongliang Mountain. When the mountains are cut down in the folds, valleys are formed crossing the mountains. The terrain is both high and low, and the maximum height difference is approximately 820 m. The study area [21] experiences mild climate, abundant rainfall, cloudy, scanty sunlight, and high humidity. The annual average temperature is 18.5 °C, annual precipitation approximately 1114.6 mm, and average annual sunshine time 1254.5 h; furthermore, in the areas belonging to the low-sunshine area, the annual number of cloudy days is as many as 204 days.
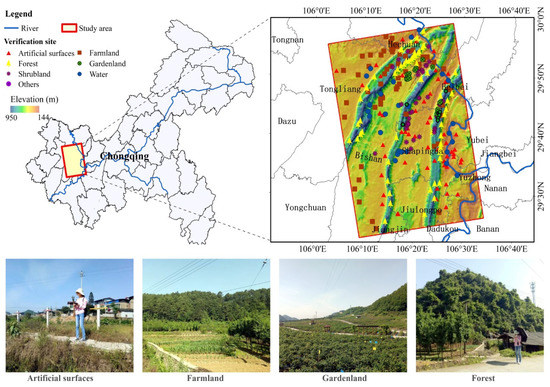
Figure 1.
Map of the cloudy mountainous study area and its location.
The study area has a variety of landforms, mainly mountainous; there are five types of landforms, namely, medium, low mountains, hills, platforms, and peace dams. The mountainous area (medium and low mountains) covers the area of 62,400 km2, accounting for 75.8% of the total area; the hilly area is approximately 15,000 km2, accounting for 18.2% of the total area; the platform and peace-dam area is 4900 km2, accounting for 6% of the total area. Furthermore, the karst landforms are widely distributed, and they are characterized by “one mountain, three ridges, and two troughs,” which has become a unique type of land karst in Chongqing. The main types of land on the basis of use are classified as farm land, forest land, waters, building, grass, and shrubs, where the vegetation mainly consists of evergreen broad-leaved forests, secondary coniferous-leaves forests, bamboo forests, and evergreen broad-leaved shrubs.
Supplemented by the vegetation community survey method, we conducted field surveys in May 2017. The route was laid according to the terrain and land cover types in the study area. The plots were mainly set up to have a more uniform spatial distribution of features and regional heterogeneity. In the survey, one to three samples of 5 m × 5 m are selected at uniform locations of land cover with intervals of 5 to 10 km. The hand-held GPS is used to record the latitude and longitude coordinates, elevation, land cover type, and surface features. After removing some abnormalities from the sample points, a total of 284 survey samples were recorded. As a typical ecologically fragile area, Chongqing has complicated topography and landforms, various land cover types, and covers most of the Three Gorges Reservoir, highlighting its important ecological geographical location, so it is important to study the land cover classification of this area.
2.2. Data and Processing
This study used ALOS-2 high-precision, full-polarization pattern (HH + VH + VV + HV) data. The imaging period was 27 May 2015; the product level was 1.1, range and single look azimuth compressed data is represented by complex I and Q channels to reserve the magnitude and phase information. In the case of ScanSAR mode, an image file is generated per each scan. The observation direction was right view, the track direction was ascending, the data format was Committee on Earth Observation Satellites (CEOS), the pixel spacing of range) was 2.861 m, and the pixel spacing of azimuth was 3.112 m. Furthermore, we used two-phase OLI data of different cloud coverage in order to perform the LCC test (LC81280392015173LGN00 and LC8128039 2015189LGN00); the imaging period was from 22 June 2015 to 8 July 2015, the cloudiness was 8.43% and 26.28%, respectively. The parameters of both ALOS 2 and Landsat 8 OLI images are listed in Table 1.

Table 1.
Parameters of Advanced Land Observing Satellite (ALOS) 2 and Landsat 8 operational land imager (OLI) images.
Landsat 8 OLI images were provided by the United States Geological Survey (USGS), and the data were L1T level. The pre-processing included system radiation error correction, geometric rough correction, ground-control point geometry correction, and terrain correction using digital elevation model. After preprocessing, the radiation calibration was performed using the annual absolute radiation calibration coefficient of Landsat 8 OLI with ENVI (Exelis Visual Information Solutions) 5.3, following which the atmospheric correction was implemented using the fast line-of-sight atmospheric analysis of spectral hypercubes (FLAASH) module [22] with ENVI 5.3. The processing results are shown in Figure 2. The spatial resolution of the OLI images was 30 m × 30 m and the projection was WGS_1984_UTM_Zone_33N.
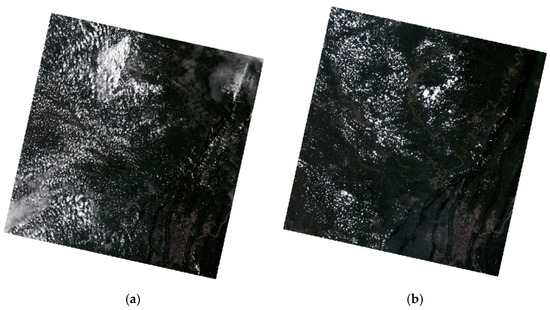
Figure 2.
Different cloud-cover Landsat OLI data. (a) Cloudiness: 26.28%; (b) Cloudiness: 8.43%.
The pre-processing of ALOS-2 SAR data [23] included polarization filtering, polarization decomposition, and terrain correction. According to the characteristics of SAR data, Lee [17] analyzed the effects of Lee filtering, Kuan filtering, Frost filtering, local sigma filtering and gamma filtering processing. Based on the polarized SAR coherent filtering criteria, this study used the directional non-square window and minimum mean square error filtering algorithm proposed by Lee et al., 2009. The filtering method avoids crosstalk between channels, and also maintains polarization information in a uniform region to the greatest extent. The boundary alignment windows maintain the sharpness of the image. Filtering can be performed in a sliding-window that the sizes were 5 × 5, 7 × 7, or 9 × 9. Figure 3 shows the comparison diagram of filtering effect, the filtering effect of 5 × 5 and 7 × 7 windows is equivalent, while large windows (i.e., 7 × 7, 9 × 9) can better smooth the coherent spots, and small windows can better retain the texture information. This study chooses the refined Lee filter, the filter window uses 5 × 5, which can appropriately maintain the texture information.
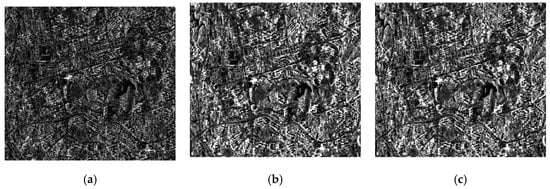
Figure 3.
Polarization filtering of ALOS-2 data. (a) Original image; (b) refined Lee (window 5 × 5); (c) refined Lee (window 7 × 7).
Comparative analysis of eigenvalues was performed using the Pauli, Cloude–Pottier, Freeman–Durden, and Yamaguchi decomposition methods [24,25,26,27,28,29], obvious differences were observed in the characteristics of various types of objects (Figure 4). The x-axis represents different land cover types in the image, the y-axis represents the eigenvalues after polarization decomposition, and r, g, and b represent the eigenvalues of the RGB spectral bands after polarization decomposition, respectively. Among these, after the decomposition using the Pauli method, the eigenvalues of the various types were observed to be significantly different from one another, which is conducive to better distinguish the types of objects. The RGB bands of Pauli decomposion correspond to three physical scattering mechanisms (i.e., odd-scattering, even-scattering, and volume scattering mechanisms) and can be used to qualitatively analyze the physical significance of the land covers in the polarimetric SAR image. The subsequent processing of ALOS 2 data is based on the results of the Pauli decomposition.
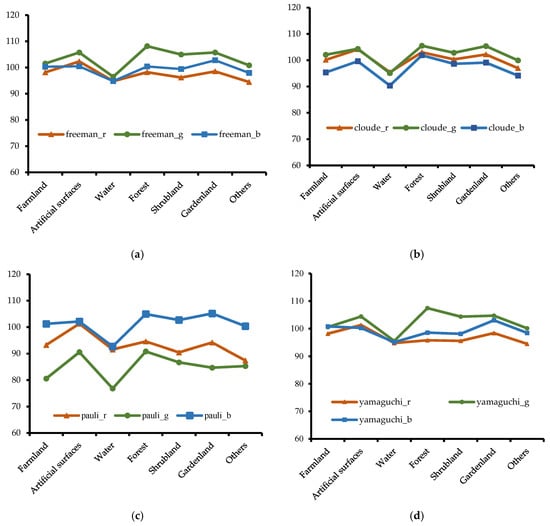
Figure 4.
Characteristic values after polarimetric decomposition. (Remark: Pauli: r: ; g: ; b: . Freeman: r: ; g: ; b: . Cloude: r: ; g: ; b: . Yamaguchi: r: ; g: ; b: ). (a) Freeman; (b) Cloude; (c) Pauli; and (d) Yamaguchi.
Without high-precision ground-control locations, firstly, the Range–Doppler (RD) geo-location model is established on the basis of the unoptimized parameters extracted from the SAR metadata; afterward, the indirect positioning method is used to obtain the SAR image coordinates corresponding to the ground target points. Subsequently, the geometric relationship between the ground and SAR images obtained using the indirect localization method employs a certain backscatter coefficient model in order to generate a simulated SAR image whose texture is similar to that of a real SAR image [30]. On the basis of the simulated SAR image, the geometric relationship between the ground and real SAR images can be obtained to complete the orthorectification. Owing to the large relief of the mountainous terrain, the local incident angle of the pixel exerts considerable influence. Different local incident angles will result in a large difference in the radar backscattering coefficient; this large difference is highly unfavorable for land-cover-information extraction. In this study, according to the high-precision digital elevation model (DEM) data generated on the basis of terrain correction and the local incident angle, the backscatter coefficient values of all the pixels are normalized to remove the local incident angle. Figure 5 depicts the ALOS 2 data both before and after the terrain correction.
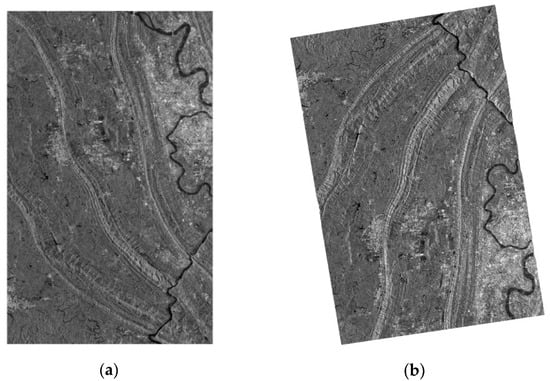
Figure 5.
Terrain correction of ALOS-2 data. (a) Before terrain correction; (b) After terrain correction.
3. Methodology
In this section, the methods for LULC classification based on fusion feature image are described in detail. Firstly, the features were extracted from Landsat 8 OLI and ALOS 2 SAR satellite images, and redundancy was removed from high-dimensional features. Then, we retained the features with low correlation and eliminated other redundant features. Features level fusion was conducted based on a certain weight. An adaptive multi-scale segmentation model was used to create image objects and optimize the scale parameters, and then an improved SVM classifier was used to conduct LULC classification experiments in the study area. The concept of the novel feature-level fusion framework and the detailed features processing is demonstrated in Section 3.1. Section 3.2 describes the basic concept of several classification system and LULC categories selected in this article. To the conduct experiment and assess the performance of the applied methods, the improved SVM classifier and its characters are described in Section 3.3.
3.1. Proposed Framework
The proposed framework of the study mainly included a few steps (Figure 6).
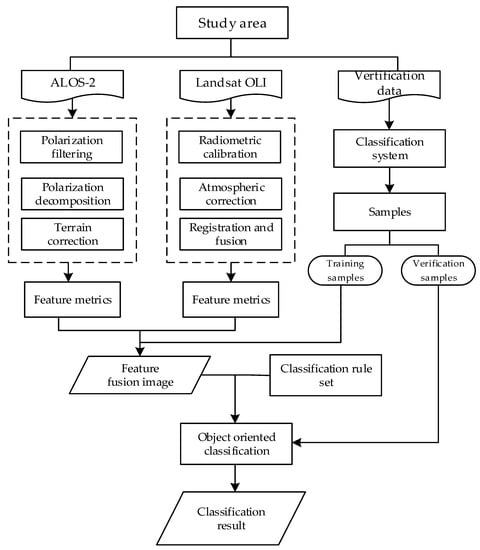
Figure 6.
Land use/land cover (LULC) classification strategy in cloudy mountainous areas.
- (1)
- Landsat 8 OLI feature extraction: to obtain high-quality optical data, the Gram–Schmidt image-fusion method [31,32] was used to fully utilize the spatial texture information via a panchromatic camera and the spectral information from the multispectral camera. On this basis, we calculated spectral features such as brightness value (BG), NDVI; gray-level co-occurrence matrix (GLCM) texture features, contrast, homogeneity, angular second moment, entropy, mean, dissimilarity, variance, and correlation. Simultaneously, we extracted the elevation and slope of different land-cover types in the study area.
- (2)
- ALOS 2 SAR data feature extraction: different ground targets in SAR images have different texture features. SAR images contain rich texture information, and texture features are important for image interpretation. We described SAR textures by studying the spatial-correlation properties of grayscale. We calculated the following eight texture features of the ALOS-2 image: contrast, variance, dissimilarity, angular second moment, mean, entropy, homogeneity, and correlation. In addition, the RGB images obtained using the Pauli decomposition were extracted.
- (3)
- Optical and SAR image feature level fusion: The OLI multi-spectral images are rich in hue and saturation information compared with high-resolution SAR images, but have less texture information. We can make full use of spectral information of OLI images and high-resolution polarization and texture information of ALOS-2 images, fuse SAR and optical pixels of the same name into multidimensional feature vectors at the feature level. The approach not only improves fusion effect, but also obtains richer feature information. The fusion features are involved in LULC classification to effectively improve accuracy of classification. In this study, two kinds of remote sensing images (ALOS-2 image, OLI image) were preprocessed and the features were extracted respectively. Then the principal component analysis (PCA) of the extracted features was performed, respectively. We retained the first three principal components, in which the features with low correlation and few redundant information. The optical and SAR texture information was superimposed with a certain weight, the spectral information of the first principal component of the optical image was enhanced by a specific weight, and then we added the features of the optical image to the first principal component of the SAR image in order to obtain the enhanced principal component. Then a local energy fusion strategy was used to fuse the texture components of the SAR image and the optical image to obtain the fused texture components. After the processing of spectral and texture components was completed, the contourlet method [33] was adopted to fuse the prepared features. In this paper, we consider the feature information and correlation of images, and get more macroscopic feature level information compared with pixel level fusion.
- (4)
- LULC classification was conducted by using an improved SVM classifier. Owing to the nonlinear nature of high-resolution remote-sensing data, the classification of remote-sensing data is mostly a nonlinear classification problem. To solve the classification of linear indivisible problems, we can improve the parameters of the radial basis function (RBF) in the SVM classifier.
- (5)
- Analysis and comparison of the results. We compared and analyzed the results derived using the method proposed in this study, where the classification results was obtained using a single image.
3.2. Classification System
There are many classification systems, and the general classification system for LULC mainly includes GlobleLand 30, “China Resource Environment Database” land-use-classification system, and relevant national land-classification system. The GlobleLand 30 classification system [34] mainly includes waters, wetlands, artificial surfaces, tundra, permanent snow, grass, bare land, cultivated land, shrubs, and woodland. The first level of “China Resource Environment Database” land-use-classification system includes farm lands, forest lands, grasslands, waters, buildings, and unutilized land; the second level is mainly divided into 25 types according to the natural attributes of the land, and the third level is mainly divided into eight types according to the type of land. In 2001, a national land-classification system for urban and rural classification was established, following which a three-level classification system was adopted. There are three first-class categories, namely, agricultural land, construction land, and unused land. There are 15 secondary classes, such as farm lands, garden lands, woodlands, pastures, other agricultural lands, and commercial lands; there are 71 categories in the third class. This work analyzed the above-mentioned several classification systems and combined them with the characteristics of the study area. The land cover is divided into seven types, namely, farmland, gardenland, forest, shrubland, artificial surfaces, water and others (Table 2).

Table 2.
Classification system reference list.
3.3. Improved SVM Model
The SVM theory can be found in the research of Cortesand Vapnik [35] and Devroye et al. [36]. Its advantage is that the SVM can search for support vectors with greater discrimination ability, perform the construction of classifiers, and maximize the interval between various types. The primary idea is to map non-linear separable sample data to a high-dimensional linear space, and then create an optimal classification hyperplane in the kernel space, transform the classification problem into a convex quadratic programming problem, and then introduce a kernel function. Furthermore, we synthesize empirical risk and confidence range in order to find the decision function to minimize the expected upper bound on risk [37]. The original SVM algorithm seeks a linear decision surface by using , where W denotes the vector of dimension coefficients and b the offset. The linear SVM achieves the best hyperplane by solving the following optimization problems:
Combining the above formulas gives the following formula:
The optimization of the best hyperplane can be transformed into a Lagrangian dual problem as follows:
where denotes the Lagrangian multiplier. The final classification discriminant function can be expressed as follows:
In most cases, the SVM maps non-linear training samples to a high-dimensional feature space and constructs a linear discriminant function. RBF is one of the most popular and generally used kernel functions. It offers satisfactory generalization ability. One has the following:
where denotes the constant coefficient. RBF is a useful feature, which has been widely implemented to map multiple original features to infinite dimensions. The RBF kernel needs to set two important parameters, namely, C and γ. C is the penalty parameter, which indicates a positive constant that determines the degree of penalized loss. γ is the kernel parameter, which controls the width of the RBF kernel and determines the distribution after datasets is mapped to a new feature space [38]. To explore the method for quickly finding the optimal parameters (C and γ) of the SVM classifier, this research employed an improved method. Aiming at the object-oriented high-resolution remote-sensing image classification, a large amount of sample data and a large number of dimensions led to the disadvantage of the time required by the grid search method in finding the best parameters. This study used PCA to achieve data-dimensionality reduction and eliminate the correlation between sample attributes, following which it set the initial value of the parameter search range on the basis of the dimensionality-reduction data [39]. On the basis of the optimal parameters of the SVM classifier based on PCA dimensionality reduction data [40,41], we delimited the search range of the original data classifier parameters, and we also optimized the parameters of the grid search method to obtain the best combination of parameters based on the original data.
4. Results
4.1. Features Metrics and Extraction
Feature extraction can be viewed as finding a set of vectors that represent an observation while reducing the dimensionality. In LULC classification, it is desirable to extract features that are focused on discriminating between classes. The development of feature extraction has been one of the most important research subjects in the field of LULC analysis and has been studied extensively. In this study, we concentrate on feature extraction for SAR and optical images based on LULC classification task, such features included geoscience auxiliary features, spectral features, texture features and relevant context features. The principal component transformation is based upon the global covariance matrix. It often works as a feature reduction tool because classes are frequently distributed in the direction of the maximum data scatter. Discriminant analysis is a method which is intended to enhance separability.
4.1.1. Geoscience Auxiliary Features
The study area is located in the parallel ridge valley area of eastern Sichuan. Yunwu Mountain, Jinyun Mountain, and Zhongliang Mountain are interspersed among them. The highest altitude is 950 m and the lowest elevation 144 m. It is a low mountainous area with hills, along with high and low undulations. The maximum height difference, the evident is 806 m. The distribution of the slope is up to 28°. The vertical regional distribution of vegetation in the study area is obvious, and the land-cover distribution is highly correlated to the elevation and slope height. Therefore, the elevation and slope characteristics are helpful in classifying the ground objects in the study area. From Figure 7, it is evident that the elevation and slope of the forest distribution are the largest, and the range is wide, followed by the shrubland. However, the elevation and slope of artificial surfaces and waters are low. Furthermore, the elevation and slope of the distribution of farmland and gardenland are in the middle, with the elevation approximately 400 m and the slope approximately 5°.
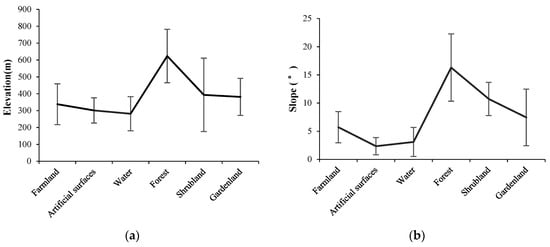
Figure 7.
Elevation and slope of various land-cover types. (a) Elevation; (b) Slope.
4.1.2. Texture Features of SAR and Optical Images
The texture features of different land-cover types based on the Landsat OLI data were compared with one another, the features include contrast, homogeneity, angular second moment, entropy, mean, dissimilarity, variance, and correlation. We selected the texture features of 100 land-cover samples. As depicted in Figure 8, Figure 9 and Figure 10, the texture features of different types were considerably different from one another. In addition, using comparative analysis, it was observed that contrast, which is an entropy (ENT) feature, was significantly different for each type, and that it was easy to extract the LCC information using the contrast feature. We selected these features to participate in the subsequent classification.
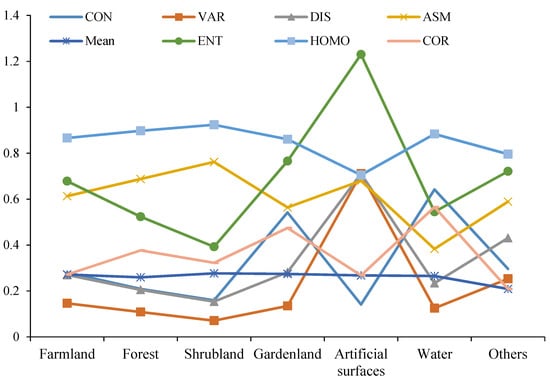
Figure 8.
Texture values for land cover types based on OLI data. (Remark: CON: contrast; VAR: variance; DIS: dissimilarity; ASM: angular second moment; Mean: mean; ENT: entropy; HOMO: homogeneity; COR: correlation).
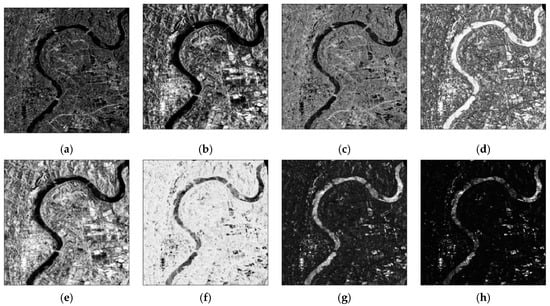
Figure 9.
Texture features of ALOS-2. (a) Contrast; (b) variance; (c) dissimilarity; (d) angular second moment; (e) mean; (f) entropy; (g) homogeneity; (h) correlation.
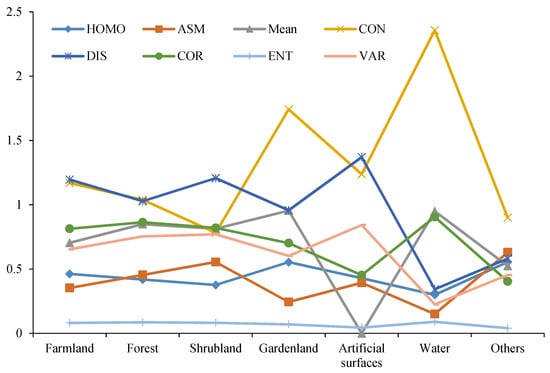
Figure 10.
Texture values of land-cover types based on ALOS-2.
4.1.3. Feature Analysis
To improve the texture-feature-extraction efficiency, PCA was used to perform the principal-component extraction on multi-band data. After performing the principal-component transformation, we observed that the first principal component, PCA 1, contained the information of 82.58% of all the bands, and that the first three principal components, PCA 1–3, contained 99.08% of the information. In addition, eight texture features were extracted from four window scales (3 × 3, 5 × 5, 7 × 7, 9 × 9) using PCA 1, following which the best window for extracting the texture features was discussed. According to the Method 2.2, the ALOS-2 data were preprocessed to obtain the result, as depicted in Figure 1. Compared with the optical images, the texture of ALOS-2 images was more obvious; different surface roughness results in different texture features. In addition, the artificial surface and other features with strong dispersion characteristics have strong echoes, which are brighter in the image and have obvious features. High-resolution SAR images have better texture and strong scattering characteristics than those of optical images. We extracted the following eight texture features of the SAR images by using the GLCM method: contrast, variance, dissimilarity, angular second moment, mean, entropy, homogeneity, and correlation. These texture feature values were normalized to be combined into a multi-band image similar to a multi-spectral image. Owing to the certain correlation between texture features, upon increasing the number of texture features, the complexity of the image also increased, and a satisfactory combination effect was not necessarily achieved. Therefore, analyzing the correlation matrix between individual texture features, separability and important textures were selected, and strong scattering features were also required to be well preserved. On the basis of the above-mentioned analysis, this study selected four textures, namely, mean, variance, dissimilarity, and second moment, to generate the main texture feature.
PCA was used to fuse the spectral, texture features of OLI images and texture features of ALOS 2 images (Figure 11).
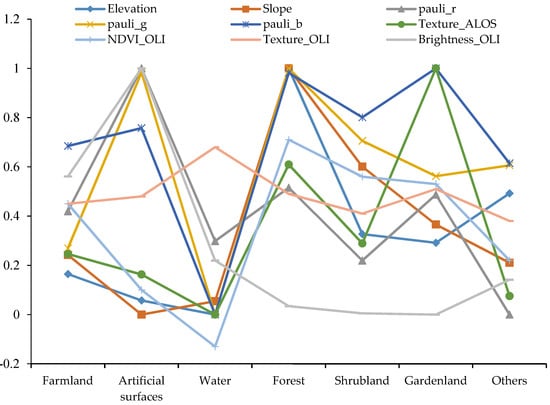
Figure 11.
Classification features of synthetic aperture radar (SAR) and OLI optical images.
4.2. Classification Results and Accuracy of the Proposed Method
For Landsat OLI and ALOS-2 features fusion data, multi-scale segmentation was still used in this study. The weights of the three bands after segmentation and fusion were set to 1; the shape coefficient was 0.1 and the compactness 0.5. I tried three scales of 5, 15, 20, and 30. Through comparison and discrimination with the naked eye, the scales were over segmented at 5, and the scales of 20 and 30 could not represent the best contours of the features. In addition, the image-segmentation scale was set to 15, which can satisfactorily maintain the boundary of the features, as depicted in Figure 12.
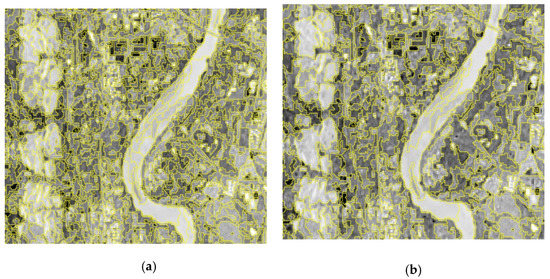
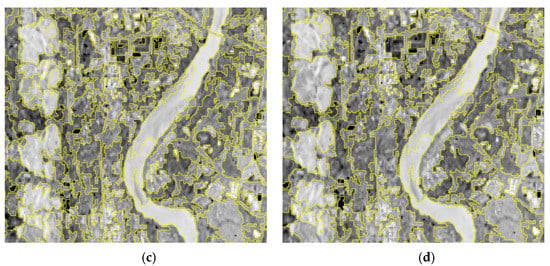
Figure 12.
Different scale-segmentation effects based on features fusion image. (a) Scales 15; (b) scales 25; (c) scales 35; (d) scales 50.
On the basis of the above, this study attempts to design an improved SVM method to classify fused images. By continuously selecting and optimizing the training samples, taking this sample as the center, continuously adjusting the core parameters in the SVM model, and after many experiments, the classification results were obtained, as depicted in Figure 13. The classification accuracy of each feature type is mainly measured by user accuracy (UA) and producer accuracy (PA). UA refers to any random sample from the classification result, which has the same conditional probability as the actual type on the ground, PA refers to the classifier’s ratio of the sampled pixels of the image correctly classified into the category A to the total number of the samples classified into the category A. As can be seen from the enlarged view of land types, artificial surfaces, farmland, forest, shrubland, water are better distinguished, producer accuracy (PA) and user accuracy (UA) are relatively high, which meets the classification needs of mountain land cover types. Figure 14 shows the comparison of classification results, A is the classification of Landsat OLI image (cloudines 8.43%), B is classification of ALOS 2 image, C is classification of Fusion features image, compared with the classification results and accuracy of A and B, the classification results and accuracy of C are greatly improved excluding the shrubland class. This is because the hierarchical structure of shrubland is not as regular as forest, and texture features of shrubland vary greatly in large scale regions. The accuracy of shrubland based on OLI image is higher compared with ALOS-2 image and fusion feature datasets. Table 3 shows the accuracy validation of land-cover type classification results based on fusion image.
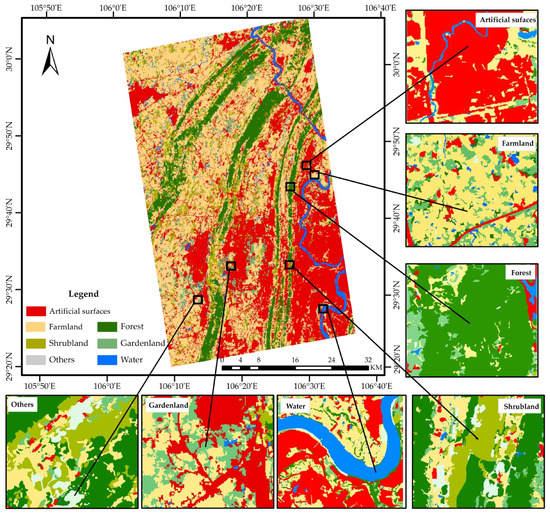
Figure 13.
Classification results of fusion features.
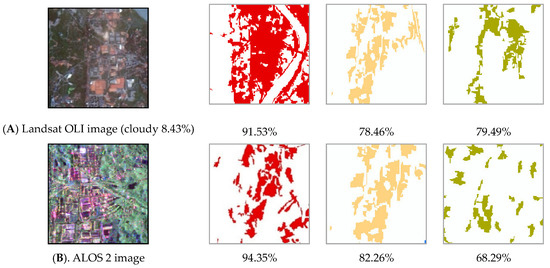

Figure 14.
Comparison of classification results. (Remark: the accuracies in subfigures represent the PA of different datasets).

Table 3.
Accuracy validation of land-cover type classification results based on fusion image.
4.3. Accuracy Assessment
The overall classification accuracies of the Landsat OLI data, ALOS-2 data, and the post-fusion data were mainly measured using the overall classification accuracy (overall’s accuracy) and Kappa coefficient (Table 4). The classification accuracy of several types of data is depicted in Figure 15. The Landsat OLI data (cloudiness 26.28%) have the lowest overall classification accuracy, with the total accuracy of 58.09% and a Kappa coefficient of 0.4913. The overall classification accuracy of the Landsat OLI data (cloudiness 8.43%) is comparable to that of the ALOS-2 data, with the total accuracy of approximately 83% The Kappa coefficient is approximately 0.8; the overall classification accuracy of the Landsat OLI and ALOS-2 data is the highest, with the total accuracy of 86.97% and the Kappa coefficient of 0.8447. The fused data contains both the spectral information of the optical data and the polarization decomposition characteristics of the fully polarized SAR data. It has strong information complementarity. Compared with the Landsat OLI image or ALOS-2 image alone, the overall accuracy is improved by about 4%.

Table 4.
Comparison of classification accuracies for different land types.
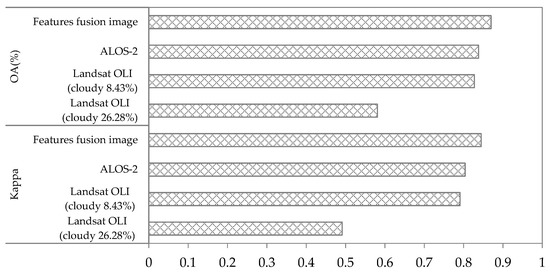
Figure 15.
Comparison of the overall accuracies based on LULC classification.
The specific classification accuracy of each locality type (forest, shrubland, gardenland, farmland, water, artificial surfaces and others) is shown in Figure 15, Figure 16 and Figure 17. In terms of three types of data, the feature fusion data has higher extraction accuracy for forest, shrubland, gardenland, farmland, water and artificial surfaces, especially in extracting forest and farmland. Landsat OLI data (cloudiness 8.43%) only has higher extraction accuracy for shrubland, ALOS-2 data has higher extraction accuracy for artificial surfaces and forest. The experimental data has lower accuracy in producer accuracy of shrubland and gardenland, indicating that these two types are most likely to be misclassified, forest and farmland are less likely to be misclassified. From the overall classification accuracy, it can be seen that, for the same Landsat OLI data, different cloud covers have a great impact on the classification accuracy of land cover. When the cloud cover is 8.43%, the OA is about 82.75%, and the Kappa coefficient is 0.791, which basically meets the general feature extraction requirements. When the cloud cover is 26.28%, the OA is 58.10%, and the Kappa coefficient is only 0.4913, under this situation the accuracy is low and cannot be used for basic feature type extraction, and it is difficult to identify the LULC types with more mixed pixels or objects. Figure 16, Figure 17, and as expected—the improved SVM method—is found as best suited for forest and shrubland features classification, accuracy of both UA and PA got increased. Accuracy of forest areas was improved, and this was reflected by the intensity values present in the microwave span image which contributed to the fused features image.
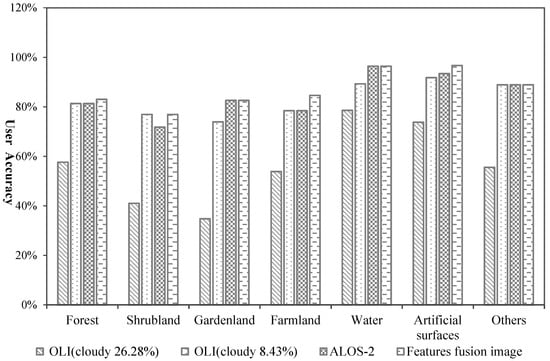
Figure 16.
Comparison of user accuracy (UA) of land cover types.
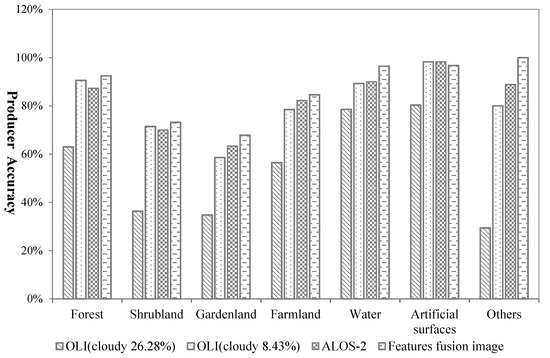
Figure 17.
Comparison of producer accuracy (PA) of various land-cover types.
5. Discussion
5.1. Classification Method and Effect Evaluation
Obtaining optical images in cloudy, foggy mountain areas has great uncertainty, limiting the ability of the optical data to identify features. SAR, which is a high-resolution imaging radar with a long wavelength that can penetrate a certain cloud layer, is not affected by the climate; in addition, it is based on active remote sensing, which can function almost all day and all weather and can also penetrate certain shelters, thereby obtaining more information than that obtained via optical remote sensing. The SVM method is used to classify optical and SAR feature fusion images. Combining the respective advantages of optics and SAR can effectively expand the useful information contained in the data, enhancing the ability to identify features. The features of both optics and SAR are combined to completely use the rich structure, texture information, and information characteristics of SAR in order to improve the spectral differences among different features and enhance the separability. The Landsat OLI data with a small amount of cloud were used to extract the first-class land class with the total accuracy of 82.74% and a Kappa coefficient of 0.791 (Figure 18). The Landsat OLI data can be obtained free of charge, and the data-processing and classification operations are relatively simple. In the periods during which optical remote-sensing images with little cloud and fog can be obtained and the classification accuracy is not very high, the research area can use Landsat OLI with less than 10% cloud data categorized.
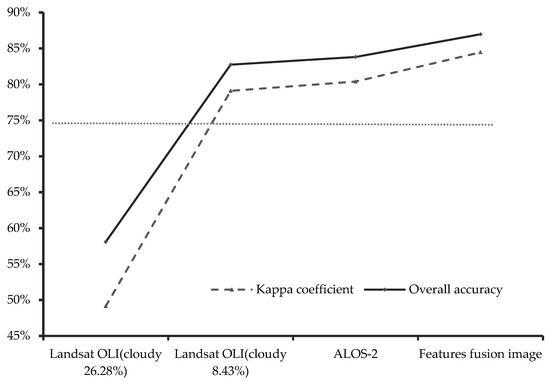
Figure 18.
Improvement of the accuracy under different datasets.
Optical remote sensing sensors have a large revisit cycle and weather, and their ability to acquire remote sensing data is not sufficiently stable. According to the statistics of the Landsat OLI archived data in the research area for the past three years, more than 90% of the images were with cloud cover in one year. In the case in which optical remote sensing images are not available, the fully polarized ALOS-2 data show better advantages, and SAR images can be used instead of optical image classification.
5.2. Advantages and Disadvantages of the SVM Model
Recently, considerable effort has been made toward the development of the LULC classification model by using remote-sensing images; to that end, multiple methods, such as the nearest neighbor method, decision tree model, artificial neural network model, and SVM model, have been used. The improved model used in this study offers several advantages: (1) It reduces the redundancy for object-based image analysis and is well suited for high-resolution remote-sensing images; (2) it can be used for feature selection and information extraction and offers the advantage of a higher reduction rate than that of other methods/models. In our future research, we plan to design and implement high-quality samples for achieving high-performance feature selection.
5.3. Limitations
Owing to the particularity of SAR data imaging methods, the geometric deformation of microwave images is very different from that of optical remote sensing images. Although the terrain correction of the ALOS-2 data is based on the RD geo-location model, the quantitative-accuracy analysis of the terrain-corrected image was not performed, and the contribution of the terrain correction to the improvement of image distortion has not been analyzed in depth. Furthermore, owing to the limitation of the data source, the imaging times of the Landsat OLI and ALOS-2 data used in this study differ by approximately one month. Because this time period is the stage of vigorous plant growth, the time difference may impact the classification results. In this study, fusion based on image feature level is attempted; however, other fusion methods are not explored in depth. Although it is said that with the development of science and technology and the improvement of mathematical level, the number of image-fusion methods aimed at spatial enhancement have increased, the fusion results should pay more attention to the maintenance of spatial details and spectral information.
6. Conclusions
The feature-level fusion of multi-source remote sensing images has shown their potential in many fields. In this study, to explore land use/land cover (LULC) classification in mountain area, a novel feature-level fusion framework, in which two different cloudiness amounts of the Landsat operational land imager (OLI) images, and an fully polarized Advanced Land Observing Satellite-2 (ALOS-2) image was applied for conducting the experiments. Comparing the accuracy of several types of remote sensing images, the results demonstrated that the feature fusion data performed better than that from single remote sensing data source, and achieved the best results with an OA of 87% and a Kappa of 84.5%. These findings not only can promote the use of multi-source remote sensing images whose features have been fused but also emphasize that SAR datasets are important to effective observing the earth’s surface. However, it should be pointed out that the features were manually prepared in the present study, which is a limitation for rapid LULC classification mapping. An automatic approach should be considered to extract features from multi-source imagery. It is also possible to directly use an existing features database if available.
Due to the particularity of SAR data, the geometric deformation of microwave images was different from optical remote sensing images. Although the terrain correction for ALOS-2 data was based on the RD localization model, the terrain corrected image is not quantitatively evaluated, and it is impossible to determine how much the contribution of the terrain correction is. For instance, this study only analyzes the fusion of Landsat-8 OLI and SAR images. Therefore, some additional datasets could be applied to improve the classification accuracy if it is available.
This work aims to provide a reference for selecting the suitable data and classification method for LULC classification in cloudy mountain areas. The findings of this paper indicates that when in cloudy mountain areas, the fusion data should be preferred, during the period of low cloudiness, the Landsat OLI data should be selected, when no optical remote sensing data are available, and the fully polarized ALOS-2 data are an appropriate substitute.
Author Contributions
H.X. and H.L. assisted with the study design and the interpretation of the results; R.Z. designed and wrote the paper; X.T., S.Y. and K.D. developed the algorithm and drafted the preliminary version of this paper. All authors have read and agreed to the published version of the manuscript.
Funding
This research was funded by the National Key Research and Development Program of China (grant number 2016YFB0501403).
Conflicts of Interest
The authors declare that they have no conflicts of interest.
References
- He, G.; Feng, X.; Xiao, P.; Xia, Z.; Wang, Z.; Chen, H.; Li, H.; Guo, J. Dry and wet snow cover mapping in mountain areas using SAR and optical remote sensing data. IEEE J. Sel. Top. Appl. Earth Obs. Remote Sens. 2017, 10, 2575–2588. [Google Scholar] [CrossRef]
- Araya-López, R.A.; Lopatin, J.; Fassnacht, F.E.; Hernández, H.J. Monitoring Andean high altitude wetlands in central Chile with seasonal optical data: A comparison between Worldview-2 and Sentinel-2 imagery. ISPRS J. Photogramm. Remote Sens. 2018, 145, 213–224. [Google Scholar] [CrossRef]
- Luo, K.; Li, B.; Moiwo, J. Monitoring Land-Use/Land-Cover changes at a provincial large scale using an object-oriented technique and medium-resolution remote-sensing images. Remote Sens. 2018, 10, 2012. [Google Scholar] [CrossRef]
- Stewart, J.C.; Zhou, W.; Santi, P.M. Using an integrated remote sensing approach for identification of bedrock and alluvium along the Front Range mountains, Colorado. J. Appl. Remote Sens. 2017, 11, 1. [Google Scholar] [CrossRef]
- Gopal, S.; Woodcock, C.E.; Strahler, A.H. Fuzzy neural net-work classification of global land cover from a 1° AVHRR data set. Remote Sens. Environ. 1999, 67, 230–243. [Google Scholar] [CrossRef]
- Gilbertson, J.K.; Kemp, J.; van Niekerk, A. Effect of pan-sharpening multi-temporal Landsat 8 imagery for crop type differentiation using different classification techniques. Comput. Electron. Agric. 2017, 134, 151–159. [Google Scholar] [CrossRef]
- Wang, T.T.; Li, S.S.; Li, A.; Feng, X.X.; Wu, Y.W. Land cover classification in Beijing using Landsat 8 image. J. Image Graph. 2015, 20, 1275–1284. [Google Scholar]
- Liu, H.; Wang, F.; Yang, S.; Hou, B.; Jiao, L.; Yang, R. Fast semisupervised classification using histogram-based density estimation for large-scale polarimetric SAR data. IEEE Geosci. Remote Sens. Lett. 2019, 16, 1844–1848. [Google Scholar] [CrossRef]
- Sica, F.; Pulella, A.; Nannini, M.; Pinheiro, M.; Rizzoli, P. Repeat-pass SAR interferometry for land cover classification: A methodology using Sentinel-1 Short-Time-Series. Remote Sens. Environ. 2019, 232, 111277. [Google Scholar] [CrossRef]
- Hoang, H.K.; Bernier, M.; Duchesne, S.; Tran, Y.M. Rice mapping using RADARSAT-2 dual- and quad-pol data in a complex land-use watershed: Cau River Basin (Vietnam). IEEE J. Sel. Top. Appl. Earth Obs. Remote Sens. 2016, 9, 3082–3096. [Google Scholar] [CrossRef]
- Tavares, P.A.; Beltrão, N.E.S.; Guimarães, U.S.; Teodoro, A.C. Integration of Sentinel-1 and Sentinel-2 for classification and LULC mapping in the urban area of Belém, Eastern Brazilian Amazon. Sensors 2019, 19, 1140. [Google Scholar] [CrossRef]
- Yin, J.; Yang, J.; Zhang, Q. Assessment of GF-3 polarimetric SAR data for physical scattering mechanism analysis and terrain classification. Sensors 2017, 17, 2785. [Google Scholar] [CrossRef]
- Li, D.; Zhang, Y. Adaptive model-based classification of PolSAR data. IEEE Trans. Geosci. Remote Sens. 2018, 56, 6940–6955. [Google Scholar] [CrossRef]
- Chatziantoniou, A.; Psomiadis, E.; Petropoulos, G.P. Co-orbital Sentinel 1 and 2 for LULC mapping with emphasis on wetlands in a Mediterranean setting based on machine learning. Remote Sens. 2017, 9, 1259. [Google Scholar] [CrossRef]
- Hagensieker, R.; Roscher, R.; Rosentreter, J.; Jakimow, B.; Waske, B. Tropical land use land cover mapping in Pará (Brazil) using discriminative Markov random fields and multi-temporal TerraSAR-X data. Int. J. Appl. Earth Obs. Geoinf. 2017, 63, 244–256. [Google Scholar] [CrossRef]
- Hütt, C.; Koppe, W.; Miao, Y.; Bareth, G. Best accuracy Land Use/Land Cover (LULC) classification to derive crop types using multitemporal, multisensor, and multi-polarization SAR satellite images. Remote Sens. 2016, 8, 684. [Google Scholar] [CrossRef]
- Sameen, M.; Nahhas, F.H.; Buraihi, F.H.; Pradhan, B.; Shariff, A.R.B.M. A refined classification approach by integrating Landsat Operational Land Imager (OLI) and RADARSAT-2 imagery for land-use and land-cover mapping in a tropical area. Int. J. Remote Sens. 2016, 37, 2358–2375. [Google Scholar] [CrossRef]
- Sanli, F.B.; Esetlili, T.; Sunar, F.; Abdikan, S. Evaluation of image fusion methods using PALSAR, RADARSAT-1 and SPOT images for land use/land cover classification. J. Indian Soc. Remote Sens. 2016, 45, 591–601. [Google Scholar] [CrossRef]
- Ghassemian, H. A review of remote sensing image fusion methods. Inf. Fusion 2016, 32, 75–89. [Google Scholar] [CrossRef]
- Zhang, R.; Zhou, Y.; Luo, H.; Wang, F.; Wang, S. Estimation and analysis of spatiotemporal dynamics of the net primary productivity integrating efficiency model with process model in Karst Area. Remote Sens. 2017, 9, 477. [Google Scholar] [CrossRef]
- Xiao, Q.; Tao, J.; Xiao, Y.; Qian, F. Monitoring vegetation cover in Chongqing between 2001 and 2010 using remote sensing data. Environ. Monit. Assess. 2017, 189, 189. [Google Scholar] [CrossRef] [PubMed]
- Anderson, G.P.; Felde, G.W.; Hoke, M.L.; Ratkowski, A.J.; Cooley, T.W.; Chetwynd, J.J.H.; Gardner, J.A.; Adler-Golden, S.M.; Matthew, M.W.; Berk, A.; et al. MODTRAN4-based atmospheric correction algorithm: FLAASH (fast line-of-sight atmospheric analysis of spectral hypercubes). Proc. SPIE Int. Soc. Opt. Eng. 2002, 4725, 65–71. [Google Scholar]
- Koyama, C.N.; Watanabe, M.; Hayashi, M.; Ogawa, T.; Shimada, M. Mapping the spatial-temporal variability of tropical forests by ALOS-2 L-band SAR big data analysis. Remote Sens. Environ. 2019, 233, 111372. [Google Scholar] [CrossRef]
- Cloude, S.; Pottier, E. A review of target decomposition theorems in radar polarimetry. IEEE Trans. Geosci. Remote Sens. 1996, 34, 498–518. [Google Scholar] [CrossRef]
- Freeman, A.; Durden, S.L. Three-component scattering model to describe polarimetric SAR data. In Proceedings of the International Society for Optical Engineering, San Diego, CA, USA, 12 February 1993; Volume 1748, pp. 213–224. [Google Scholar]
- Yamaguchi, Y.; Moriyama, T.; Ishido, M.; Yamada, H. Four-component scattering model for polarimetric SAR image decomposition. IEEE Trans. Geosci. Remote Sens. 2005, 43, 1699–1706. [Google Scholar] [CrossRef]
- Cloude, S.; Pottier, E. An entropy based classification scheme for land applications of polarimetric SAR. IEEE Trans. Geosci. Remote Sens. 1997, 35, 68–78. [Google Scholar] [CrossRef]
- Cloude, S.R. Radar target decomposition theorems. Inst. Electr. Eng. Electron. Lett. 1985, 21, 22–24. [Google Scholar]
- Lee, J.S.; Pottier, E. Polarimetric Radar Imaging: From Basics to Applications; CRC Press, Taylor & Francis Group: Boca Raton, FL, USA, 2009. [Google Scholar]
- Ghasemi, N.; Mohammadzadeh, A.; Sahebi, M.R. Assessment of different topographic correction methods in ALOS AVNIR-2 data over a forest area. Int. J. Digit. Earth 2013, 6, 504–520. [Google Scholar] [CrossRef]
- Yilmaz, V.; Yilmaz, C.S.; Güngör, O.; Shan, J. A genetic algorithm solution to the gram-schmidt image fusion. Int. J. Remote Sens. 2019, 41, 1458–1485. [Google Scholar] [CrossRef]
- Guo, B.; Wen, Y. An optimal monitoring model of desertification in naiman banner based on feature space utilizing landsat8 oli image. IEEE Access 2020, 8, 4761–4768. [Google Scholar] [CrossRef]
- Chu, T.; Tan, Y.; Liu, Q.; Bai, B. Novel fusion method for SAR and optical images based on non-subsampled shearlet transform. Int. J. Remote Sens. 2020, 41, 4590–4604. [Google Scholar] [CrossRef]
- Jun, C.; Ban, Y.; Li, S. Open access to Earth land-cover map. Nature 2014, 514, 434. [Google Scholar] [CrossRef] [PubMed]
- Cortes, C.; Vapnik, V. Support-vector networks. Mach. Learn 1995, 20, 273–297. [Google Scholar] [CrossRef]
- Devroye, L.; Györfi, L.; Lugosi, G. Vapnik-Chervonenkis theory. In A Probabilistic Theory of Pattern Recognition; Springer: New York, NY, USA, 1996; pp. 187–213. [Google Scholar]
- Kalantar, B.; Pradhan, B.; Naghibi, S.A.; Motevalli, A.; Mansor, S. Assessment of the effects of training data selection on the landslide susceptibility mapping: A comparison between support vector machine (SVM), logistic regression (LR) and artificial neural networks (ANN). Geomat. Nat. Hazards Risk 2017, 9, 49–69. [Google Scholar] [CrossRef]
- Zhang, R.; Ma, J. Feature selection for hyperspectral data based on recursive support vector machines. Int. J. Remote Sens. 2009, 30, 3669–3677. [Google Scholar] [CrossRef]
- Liang, Y.; Lee, H.; Lim, S.; Lin, W.; Lee, K.; Wu, C. Proper orthogonal decomposition and its applications—Part I: Theory. J. Sound Vib. 2002, 252, 527–544. [Google Scholar] [CrossRef]
- Zhao, G.; Maclean, A.L. A comparison of canonical discriminant analysis and principal component analysis for spectral transformation. Photogramm. Eng. Remote Sens. 2000, 66, 841–847. [Google Scholar]
- Metternicht, G.; Zinck, J. Remote sensing of soil salinity: Potentials and constraints. Remote Sens. Environ. 2003, 85, 1–20. [Google Scholar] [CrossRef]
© 2020 by the authors. Licensee MDPI, Basel, Switzerland. This article is an open access article distributed under the terms and conditions of the Creative Commons Attribution (CC BY) license (http://creativecommons.org/licenses/by/4.0/).