1. Introduction
Travel time is a derived demand, which can be generated from various activities that travelers can engage in. Traffic congestion has been increasing for a long time, and it is always concentrated in city centers, where all major activities take place. Additionally, the continuous increment in demand for motorized transport modes—especially private cars—has made the condition worse, requiring remedial action. One effective solution that can help city planners to reduce the number of moving cars in the inner streets of a city is making a kind of restriction on the use of cars inside the city center, such as parking pricing. On the other hand, different solutions can be used in the case of travelers who must travel for a long time to reach the city center and are more willing to use their cars, instead of other available transport modes, such as public transport. The park-and-ride (P&R) system involves constructing parking facilities outside of the city center, and these facilities should be located very close to the public transport stops to encourage mass transit and alleviate the number of cars on the road network. The target group of P&R users are travelers who live outside of a city center and use their private cars for travel. They park their cars in the vicinity of public transport and change to a public transport mode. In this case, a traveler saves time and avoids time spent searching for a parking space. In this system, not only can the severity of congestion be solved, but land can also be saved and utilized for several alternative uses. Moreover, travel time can be optimized when travelers use autonomous vehicles (AVs), instead of their private cars, since activities can be conducted on-board AVs, and AVs have the ability to take full control of a car. It has been suggested that the travel time of AVs is less than that of private cars, because people generally can enjoy their travel time in AVs, unlike in private cars. As mentioned in the literature, each traveler tries to maximize their benefit when they conduct a daily activity plan, such as minimizing travel time, minimizing the cost, making the journey more pleasant, choosing the proper transport mode, and choosing their companions.
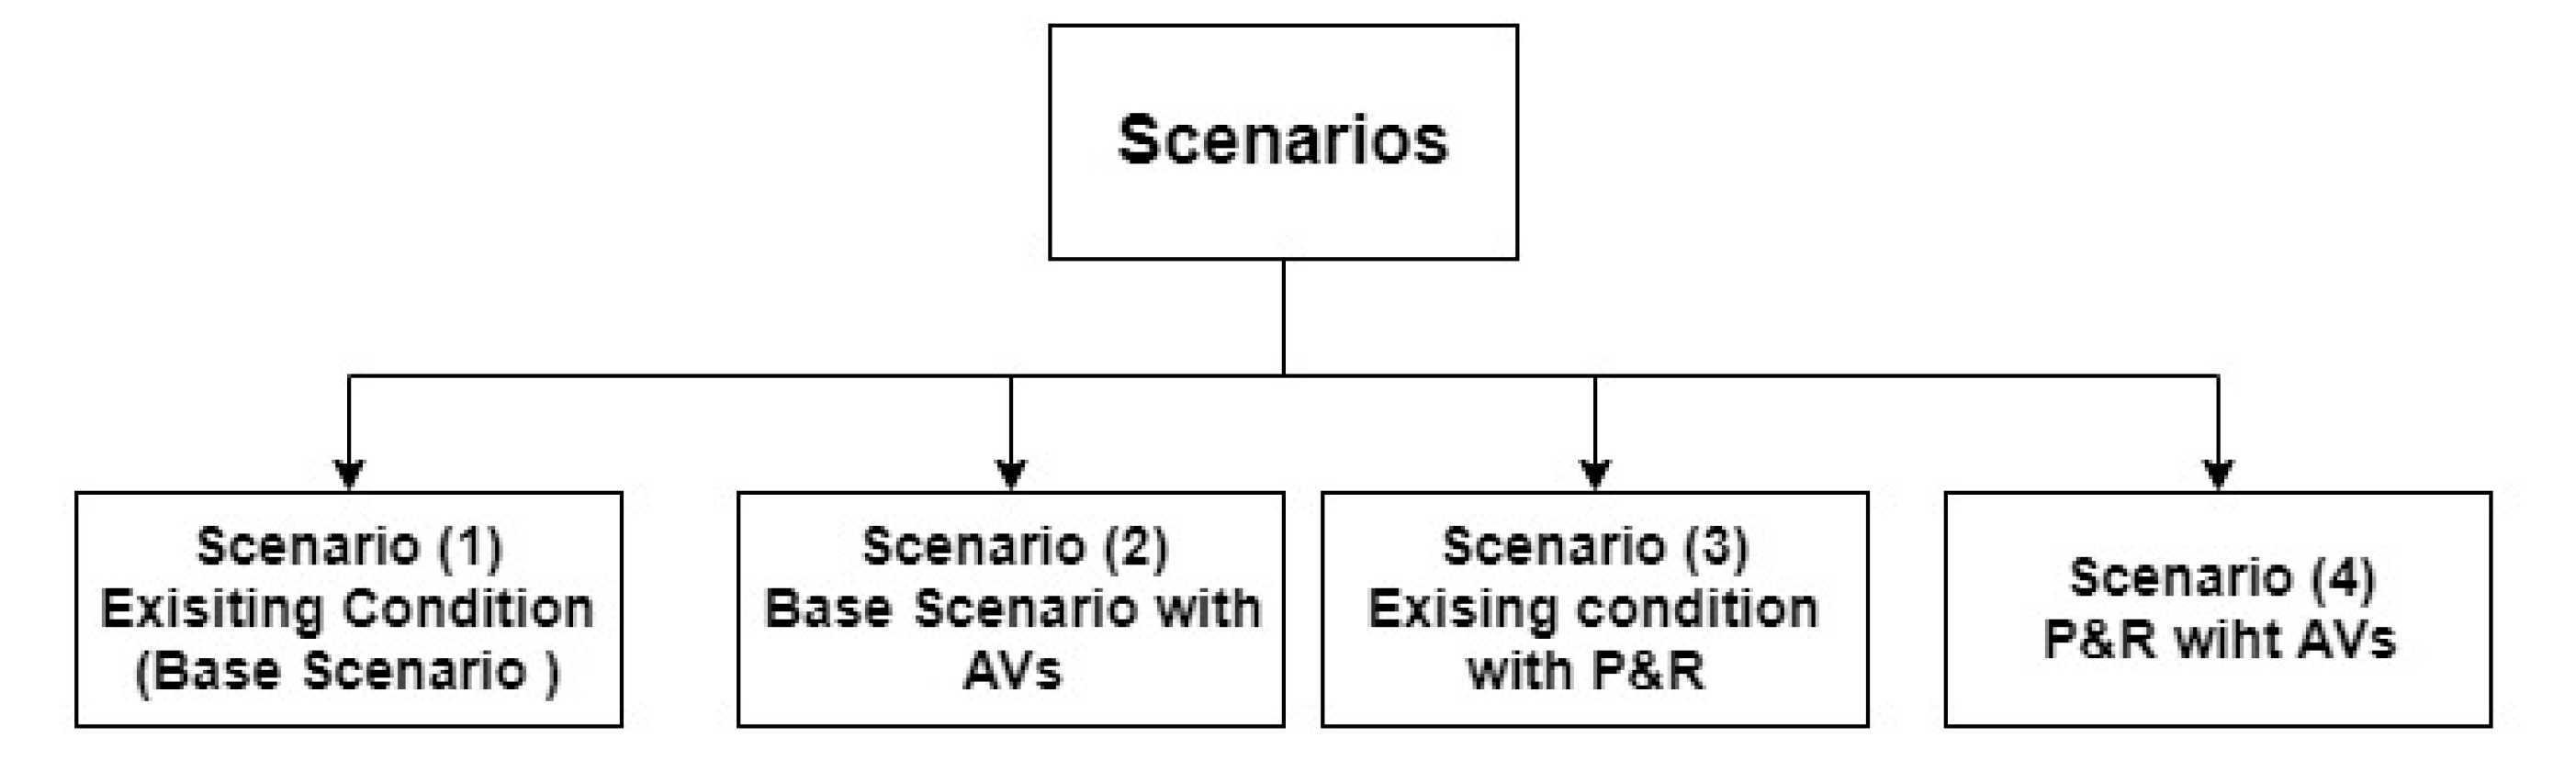
In this particular study, the P&R system and AVs were simulated and integrated with public transport to evaluate the impact of P&R integration system on the overall mobility. This is study is the first study of its kind in Hungary regarding studies on P&R and AV. The objectives of this study are: finding the impacts of P&R system on the travel time of certain people using an integrated approach that connects P&R with the daily activity chain plans of travelers, and the impacts of the AVs on the mobility of the travelers in the developed system. Thus, the impact of the availability of P&R facilities on the activity plans of travelers and the availability of AVs, as a replacement for cars, were presented. In this regard, four scenarios were prepared, which are as follows:
A simulation of the existing transport modes of the travelers.
A simulation of their daily activity plans, when their transport modes were changed to AVs.
A simulation of the travelers, when P&R facilities were included in their activity chain plans.
A simulation of their daily activity plans, when both P&R and AVs were included in their activity chain plans.
The contributions of this study are (1) the inclusion of P&R in the activity chain plan framework, and (2) the study of the impact of including P&R and AVs, together and separately, in the activity chain plans of the travelers on their mobility. The overall contributions were summarized in the simulations of four scenarios, where the utility was maximized.
2. Literature Review
The park-and-ride system is used everywhere to motivate drivers to enter a city center, and these facilities are recommended to be as close as possible to the locations of public transport. The selection of P&R facilities depends on the locations of different activities, especially work and shopping activities, which are the main considerations in this paper. The size of these facilities can be determined based on the parking generation models or rates, for example, a study of Al-Sahili and Hamadneh (2016) [
1]. Decision-makers at the municipal level can impose a law to prevent people from parking their cars for more than a certain number of hours inside the city center, which increases the turnover of parking [
2]. Travelers who are more likely to stay for a long time in the city center will most likely use a P&R system or other rented lots to park their car. The integration of the P&R system in the daily activity chain plans of certain travelers is required in order to study how it affects travel time and distance. The construction of a new P&R system requires selecting appropriate locations for the P&R facilities, which fulfill the needs of users. In this regard, Du and Wang used the Modal Choice formulation to calculate the optimal number of P&R facilities, locations, and capacity of each with respect to the lowest-cost route [
3]. A multi-objective spatial optimization model was proposed by Farhan et al. (2008) to find the optimal locations for P&R facilities [
4]. The result was used to reallocate the existing ones and construct new facilities [
4]. As an extension of Farhan et al. (2008), a discrete-choice model, which studied private vehicles, P&R, and buses, was developed by Cavada and Antunes (2019) to construct P&R facilities in the city of Coimbra [
5]. The catchment area of a P&R facility can be determined by several methods, and it is very important to make the system successful [
6]. The factors that affect a P&R system are the availability and reliability of the public transport system, congestion level, and location of the P&R facilities themselves [
7]. A mathematical model, a geographical model, and a combination of them have been used to calculate the size of a P&R facility [
8]. Types of mathematical models, used by Memon et al. (2014), were varied in defining the catchment area of a P&R facility, for example, a geometric shape, circle, parabola, etc. [
8]. The authors did not consider dynamic accessibility to the locations [
9]. The market area method (geographic) is used to delineate the catchment area of a P&R facility, based on the travel distance and time [
10]. Similarly, Fang and Murray (2005) define the boundary of a P&R catchment based on the time, cost, and fee [
11]. They used geographical information system (GIS) tools in the study to represent and delineate the catchments based on the three mentioned factors.
Besides, autonomous vehicles are a promising technology that will enter the market soon, and this technology can be used to reduce the area of P&R facilities, because AVs do not park if a traveler needs to be served. The acceptance of AVs depends on several factors, such as the trip time, cost, trip purpose, sociodemographic factors, and sharing acceptability [
12]. In the meantime, people can use AVs as a full replacement for their normal transport modes. AVs have many benefits compared to personal cars: in AVs, people can conduct more activities, such as reading, writing, and relaxing on-board compared to what they can in personal cars. On-board activities can help to make travel time productive (a less negative utility) [
13]. In fact, AVs can be used individually or shared, and this is determined by the preferences of the travelers during their trips. Finally, maximization of the utility of people, when they conduct their daily activities, is needed, and this can be obtained by using the most suitable transport mode, best route, and a suitable travel time and cost. The vehicle routing problem has been analyzed through several studies which added a set of elements that provide a more qualified comprehension of the daily activity [
14,
15,
16]. Yin and Chuang (2016) presented a new problem to study the least cost green vehicle of routing planning, where the vehicles transport the goods from the providers to the clients concerning the constraints of CO2 [
14]. Elgarej et al. (2020) developed a routing problem that included a set of activities of an electric vehicle (EV) and charging stations, the authors solved the routing problem by the Ant system algorithm to guide the EVs using routes to their destinations where chagrining stations are closed [
17]. A novel contribution has been done by Aïder and Skoudarli (2020), in which the demand was included as a parameter of the method that used an epistemic representation [
18]. Rizopoulos and Esztergár-Kiss (2020) developed an approach to model the behavior of electric vehicles concerning transport modes, charging stations, locations of the activities, and the departure times of the travelers [
16]. However, MATSim which uses the co-evolutionary algorithm, was used to understand in more solid form the routing problems.
In this research, MATSim, which is an agent-based modeling, activity-based microsimulation model using a co-evolutionary algorithm to simulate the daily activity plans of travelers, was used [
19]. MATSim can simulate extensive projects of up to 10
7 agents in competitive time, compared with other software [
20]. The MATSim tool is built in Java, which is a more flexible programing language. The MATSim loop is used to optimize the utility of travelers based on the Charypar and Nagel utility function, which includes mobility simulation, scoring, and re-planning steps. The selection of a plan, after the re-planning step, is carried out by Logit model probability [
19]. The re-planning step is where a mutation and selection of a plan are executed (genetic algorithm) to generate a good solution, rather than the optimum one. It is worth mentioning that the scoring depends on several factors, such as the time and cost, as well as Vickrey bottleneck model parameters [
21,
22]. Vickrey bottleneck model parameters include the following utilities for traveling, waiting, and being late: −12/h, −6/h, and −18/h for β
trav, β
wait and β
late.
ar, respectively [
22]. Scholars have published several articles on autonomous vehicles and their envisaged impact on the mobility of travelers. A study in Germany by Bischoff and Maciejwski (2016) showed that one AV could replace around 10 conventional cars, in the case of an unshared ride, and around 6 conventional cars in the case of a shared ride [
23]. Travelers are forced to wait a certain time for an AV before starting their travel, and this waiting time is considered to be acceptable if it is not beyond 10 min, as stated in the literature [
24]. In this regard, a Zurich study showed that people could wait for an AV for 10 to 15 min during peak hours and 5 min during other periods [
24].
In reality, a group of people asked for a highly accessible service, which can only be provided to them by their cars, but in the case of AVs, accessibility is increased based on the assumption that this technology is not bounded to a certain area, and the travel time is decreased because the number of cars on the road network can be replaced by a fleet of AVs, which are smaller than private cars. People can track the location of AVs at their home, rather than wait at a public transport stop, and this is more efficient for them with respect to variables such as weather conditions [
23]. Furthermore, the waiting time for public transport could be less than the AV waiting time, but travelers have to walk to reach the nearest public transport station. Moreover, a traveler can wait a long time at their activity, compared to a public stop station, which leads to a longer acceptable waiting time for AVs, which includes the access/egress time, and a slightly higher waiting time than that for public transport [
24]. Thus, travelers do not need to walk a certain distance to reach AVs, while in the case of using public transport, they need to walk to the nearest public transport stop [
24]. In conclusion, the minimum acceptable waiting time equals the sum of the waiting time at the public transport stop and the walking distance to get there.
A study conducted by Boesch et al. (2016) mentioned that the acceptable waiting time affected the required fleet size of AVs to serve all of the demand, and it decreased the fleet size by 90% [
25]. Bischoff et al. (2018) used 10 min as an acceptable waiting time for AVs, 60 s as the waiting time for public transport stop, and 8 passengers as the capacity of AVs, when they studied the impact of AVs on demand-responsive transport (DRT) [
26]. A simulation was conducted, and it was considered that the first rider should not be exposed to a waiting time of more than 10 min, based on the number of passengers along the assigned path [
27]. Fagnant et al. (2015) said that one shared autonomous vehicle (SAV) with a capacity of 4 passengers could replace 9.3 conventional private cars in the urban area of Austin city. The authors divided the city into certain blocks and assigned a certain number of SAVs to each block. Those assigned SAVs can give priority to the demand on their blocks, and in the case of a surplus, they can go and serve the demand in the vicinity blocks. Using this strategy, they minimized the waiting time and the traveled distance, which was also the finding in [
28]. Fegnant et al. produced a strategy that allowed for a lower waiting time than that of a random distribution of SAVs on the road network of a city, without giving any priority to a specific zone or block [
28]. The study of Hamadneh and Esztergár-Kiss (2019) showed that one SAV can replace up to 8 conventional private vehicles, with an acceptable average waiting time of 7 to 10 min [
12].
The impacts of both AVs and the P&R system on the mobility of travelers have not been well covered in the literature. However, different tools can be used to study the impact of these two elements on mobility, such as the MATSim open source tool. This paper used MATSim in studying the travel time, traveled distance, and required supply of AVs to serve a certain demand. It is worth mentioning that MATSim uses an activity-based model, where daily activity plans are simulated, and utility is maximized. Relevant literature was used to find related parameters to be used in this particular study, such as an acceptable waiting time, parking time, location of parking facilities, and passenger drop off and pick up time.
3. Methodology
The sample size was taken from a revealed preference survey, which was conducted by the Hungarian Census Bureau in 2014. This government body conducts a periodic survey every decade [
29]. The study used data on Budapest city, which covered around 8500 travelers, and these data contained the daily activity plan of each traveler and other related information, such as socio-demographic variables. Budapest is the largest city in Hungary, and it contains 18% of the whole population of the country [
29]. The daily activity plans of travelers included information about their transport mode, departure time, arrival time, travel time, activity type, car ownership, employment status, age, parking fees, parking process time, and family size. In this study, travelers who use their car to travel for either work or shopping destinations were studied. These two types of travelers were chosen because of their frequent travel to either work or shopping, and they are more likely to use P&R system to save time searching for parking spaces, avoid extra cost for parking, and avoid congestion at the city center. While other travelers are less likely to use P&R facilities because they are not frequent travelers and their behaviors are different than workers and shoppers, for example, the value of travel time is lower than for shoppers and workers [
30,
31]. From the literature, the P&R system can be used mainly by those travelers who travel for work or shopping using their conventional personal cars [
32]. Thus, around 1782 travelers were derived from the collected data to be used in this study, and this sample size is considered sufficient for a city such as Budapest because the percentage of types of travelers used in this study is not high compared to other travelers who used public transport, for example.
Table 1 shows that 90% of the travelers are workers, and 10% are shoppers.
The sample size was prepared in accordance with the MATSim requirements. As a result, four files were created to be used in each scenario: (1) the existing transport mode (base scenario (1)), (2) AVs scenario, (3) P&R scenario (base scenario (2)), and (4) P&R and AVs scenario, as shown in
Figure 1.
The MATSim tool, in which the utility of all travelers was optimized, as discussed in detail later, was used in this study. The requirements for conducting a simulation of MATSim are mainly the road network, population, facilities, public transport network and schedule, and vehicle characteristics. These requirements were satisfied and prepared using the JOSP MATSim plugin to derive a road network from OpenStreetMap (OSM) [
33] and BKK, which is the operator of public transport in Budapest and contains an updated file on public transport (GTFS) [
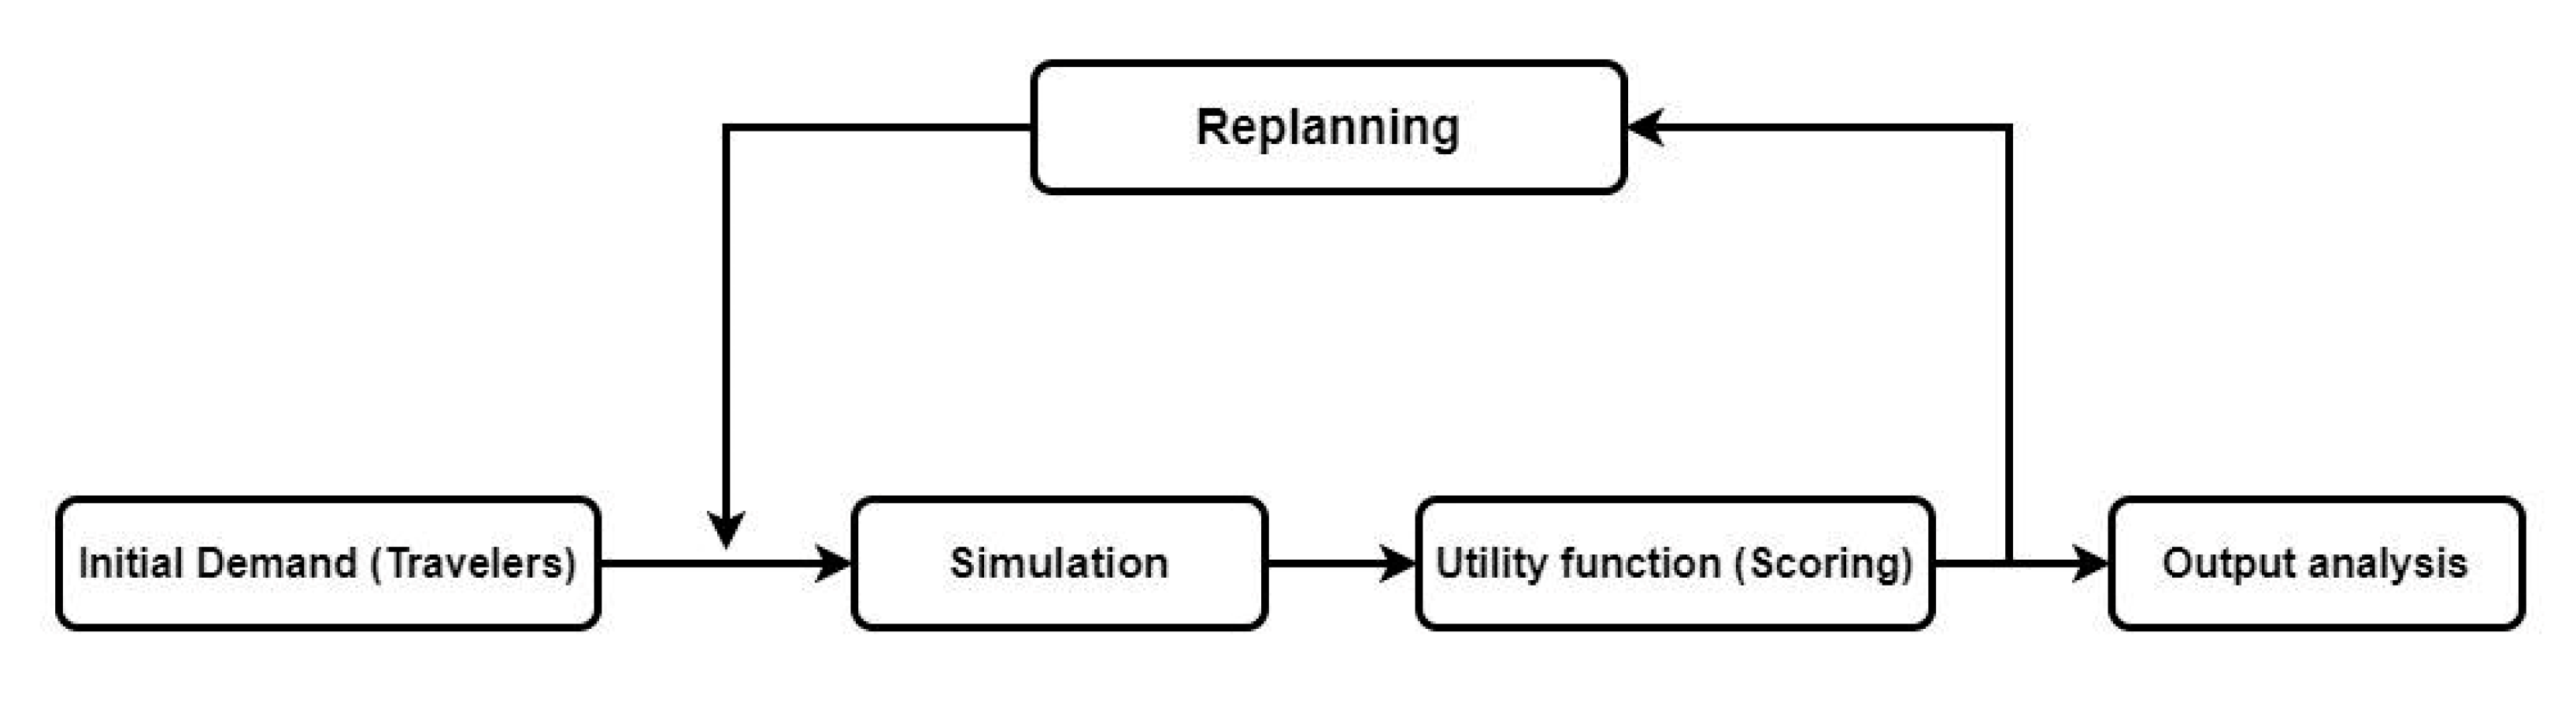
34]. The aforementioned daily activity plans were simulated using the MATSim tool, which applies the co-evolutionary algorithm in optimizing the utility of travelers, where the MATSim loop is executed many times, as shown in
Figure 2.
The MATSim tool is built in the Java programming language, and it is characterized as a detailed disaggregated microsimulation tool, which can simulate large projects in a competitive time, compared with other software. It has the ability to study more details concerning daily activity plans at the micro-level than other software does. The MATSim loop was executed for all simulations in this study. The existing transport mode of the travelers was evaluated in terms of travel time and travel distance, based on their daily activity plans, to judge the possible benefit of P&R availability. It is worth mentioning that Budapest has 23 districts, which are divided into 1178 zones, and the number of P&R facilities inside the 23 districts is 31. Based on the sample size, which was extracted from the original data, only 10 P&R facilities were used. ArcGIS and Google Maps Directions API Service were used to produce the real road network measurements for travelers who used their private vehicles to reach the P&R facilities nearest to them.
Initial demand is the daily activity plans of travelers, and this demand is executed through three steps (MobSim, scoring, and re-planning), where an optimization of the travelers’ utility can be determined based on some preset parameters, such as the travel distance, travel time, opening hours of facilities, and penalty for arriving early or late. Particularly, the daily activity plan of a traveler is evaluated each time a loop is executed, until it reaches the maximum. Moreover, the system has to be stable and reach the equilibrium condition, where no benefit can be obtained. Starting from MobSim in the MATSim loop, the daily activity plans are loaded on the network using the MobSim (mobility simulation), where each activity takes its place in reality based on the provided coordinates of the activity, transport mode, and departure time in the activity plans file. Moreover, the initial route is assigned to each trip using a built-in Dijkstra’s routing algorithm in MATSim, where MobSim (which uses the Qsim engine to load the plans on the road network using the first in first out (FIFO) traffic strategy and reflects the capacity factors) generates events after and before each step in the MATSim loop and also for every iteration. The MATSim condition is that at least the departure time, activity location, and transport mode in the activity plans are known. Technically, the MATSim default transport mode is driving a car, while the other transport modes, such as public transport, walking, and riding a bike, can be used relative to the default mode, and this process is called teleportation, which depends on speed, time, and distance factors [
19].
The MATSim loop is executed in several iterations based on the resulting score in each iteration. The initial demand is in fact executed based on the actual travel time, transport mode, route, and travel cost. In the scoring section, the chosen activity plans are scored based on Equation (1), which is the utility/score function, combining both the activity time and travel time. This utility function, which was used in MATSim, is the Charypar-Nagel function in the scoring step [
21]. The concept of the variables in this function is derived from the desired benefit that the driver tries to obtain when they perform their daily activity. Equation (1) combines both travel and activity time utilities/scores. The function contains time, cost, money, and distance parameters, which can be used to evaluate the utility of the travelers during their daily life.
where
Uplan is the score of following a selected plan, and
Uact,i is the score of conducting an activity. The score of an activity is always positive, while the score of travel is always negative (disutility). After the first iterations, the activity plans go through the re-planning step (genetic algorithm), where modifications to these plans, such as route changes, changes to the time allocation, and changes to the leg mode are introduced to maximize the benefit of travel and activities. The number of iterations can be any number, and it is governed by the shape of the resulting scoring curve. When this curve shows that there is no change in the scoring, it can be generated from the re-planning step. Moreover, Charypar and Nagel (2005) mentioned in their MATSim book that the positive utility can be calculated based on the logarithmic form of the equation, which is shown in Equation (2) [
21].
where
tact is the actual performed duration of the activity, and
βact is the marginal utility of conducting an activity, with its typical duration (
t*).
t0 can be calculated based on the minimum duration of an activity and its priority. The chosen modules in the re-planning step in the “configuration file” are route choice, departure time, and mode choice [
21]. It is worth mentioning that the re-planning process is considered as a learning mechanism in MATSim, where the travelers can enhance their plans in every iteration until a steady-state condition is reached. Additionally, a multinomial logit model (ML) is used in selecting a plan out of several generated alternatives (plans), and it is used to calculate the probability of using a certain mode, which depends on the distribution of the utility function [
35]. Recently, Zhou et al. (2019) studied the park-and-ride system in residential areas in Japan, where people can park their cars in P&R facilities, then use AVs to get to a subway station and, finally, reach their destinations [
36]. The study of Japan concluded that it would be feasible for shared autonomous vehicles to serve a demand of 10,000, since travelers would receive an acceptable level of service, such as an acceptable waiting time.
Generally, autonomous vehicle simulation has been executed through a specific algorithm, which matches travelers with the existing fleet size of vehicles, and this can be conducted by MATSim through the dynamic vehicle routing problem (DVRP) algorithm [
19,
37]. Additionally, the fleet size is a selected fleet size, and it can be changed based on the output of the simulation and, particularly, based on the average waiting time, which has been stated to be not more than 10 min. AVs have characteristics that are different from those of personal cars, such as a passenger pick up time of 120 s and a drop-off time of 60 s [
26]. It is worth mentioning that the main factors that make AVs beneficial are their improvement in the value of travel time, decrease in travel costs, and the size of the fleet size. Generally, the cost of using AVs depends on whether an autonomous vehicle is shared or unshared, the fleet size, and the vehicle insurance cost. This vehicle can park itself or serve unserved demand if there is any, and this leads to P&R facilities having a smaller size than those for personal cars.
5. Discussion
The daily activity plans of shoppers and workers were simulated using the MATSim tool. In the simulation, the travel time, travel distance, and AV fleet size were optimized. The transport mode of the first scenario was driving conventional cars, and the second scenario was using AVs. The third scenario was driving cars and using public transport (intermodal), while the third scenario was using AVs and Public transport (intermodal).
Table 6 presents the results of the four scenarios, where scenarios (1) and (2) present the results of the existing activity plans where existing conventional private cars and AVs were used. On the other hand, in scenarios (3) and (4), representing the new activity chain plans (a P&R system integrated into existing activity plans), the results of the MATSim simulation of the new daily activity chain plans of both shoppers and workers are presented in
Table 6.
The obtained benefits of using AVs are clearly presented in
Table 6, which showed a reduction in the travel time. The travel time was reduced from 69.5 to 39.5 min when conventional cars were replaced by AVs (fleet of 450 AVs), which means that AVs can increase the utility of travelers, because they are more likely to decrease their travel time. Moreover, users of AVs can obtain other benefits, compared with users of personal cars, because travelers have the opportunity to conduct more activities on-board AVs than driving personal cars. Additionally, a traveler would be exposed to 11.4 min of waiting time during the day on average, and they have to wait at their place, rather than on the street or at a specific location. Additionally, AV travelers are not required to care about parking the AVs, because they park themselves or go to serve another order, which means savings in terms of the time spent in the parking process.
Scenario (3) showed an increase in the travel time, compared to scenario (1). This increase was produced because the travelers used the public transport mode (slow mode) and diverted to the shortest path to the destination, and the parking process time was added. Moreover, the utility of travelers in scenario (1) is not bad, because the parking price (which was set by the municipality) inside the city is high, and travelers are interested in avoiding it. As a result, using P&R would be a good choice for people who travel from outside the city center. The extra 4.5 min can be reduced by managing the P&R facilities. For example, an agent can take a traveler’s car and park it on behalf of the traveler, or the design of the P&R system could determine the required time for parking. Finally, the simulation of scenario (4) showed that the travel time of scenario (2) could be reduced if personal cars were replaced by AVs. The reduction in travel time was 50.3, based on a fleet size of 750 AVs, and the total waiting time per day for each traveler was on average 10.2 min.
As a summary, the simulation of the existing transport modes produced an average daily travel time of 69.5 min, which includes the total time of all trips conducted in the day and a parking process time of 9 min. The simulation of existing transport modes with AVs showed a reduction in the average daily travel time, compared with the existing condition, of 26.7%, including the total average waiting time. This shows the benefit of using AVs instead of conventional private cars, where fewer cars are on the road network, and no parking process is needed. Furthermore, the simulation of the existing transport modes with the P&R system showed an increase in the average total daily travel time by 51.2%, and this increase was caused by the use of a slower transport mode (public transport, instead of private cars), traveling a farther distance (for some travelers) to use P&R facilities, and the walking distance at the end to reach their destination. It is worth noting that this increase cannot be compared with scenario (1), because the benefit can be realized by travelers in terms of a cost reduction or an environmental impact reduction, such as noise, and emissions, and congestion. Travelers who travel long distances, where public transport is not affordable, are more likely to use their private cars to reach the public transport stop closest to their destinations. In that regard, AVs were used as a replacement for cars, and the P&R system was integrated into the daily activity plans of travelers. AVs were used as a feeder system to public transport, and the result was a reduction in the travel time of 38.4%, compared with the existing transport mode with P&R scenario. Thus, the P&R system increases travel time, decreases the number of vehicles inside a city center, decreases congestion resulting from the parking search process, allows travelers to avoid using expensive parking inside the city center, and generally increases the daily utility of travelers. In addition, using AVs would provide more benefits to travelers, such as travel time minimization, travel cost minimization, onboard activities, and the ability to utilize land spaces for purposes other than parking spaces.
6. Conclusions
The integration of the P&R system in the activity plans of travelers encourages conventional private cars to park their cars outside of the city center of Budapest. The city center has specific regulations that add extra costs to the travel utility of daily travelers, especially workers and shoppers. The impact of the P&R system on the travel behavior of users was assessed in this paper. Moreover, AVs are a promising technology that may create several opportunities for certain groups to use private cars, without use restrictions, such as a driving license. Thus, a simulation of the existing transport modes of travelers and the P&R system was run using the MATSim software, including conventional private cars, public transport, and AVs. Four scenarios were simulated, including (1) the existing transport mode (cars), which compromised existing daily activity plans of travelers, (2) the existing transport mode with AVs, (3) the existing transport mode with the integration of the P&R system, where travelers park their cars at the nearest P&R facility to their destination and switch to public transport, and (4) the P&R system, with AVs as a feeder system to public transport (conventional private cars in scenario 3 are replaced by AVs). In conclusion, the result showed that the P&R system increased the overall travel time of travelers, compared with travelers’ existing transport modes. In the P&R system, the parking process time was reduced, because the travelers could park their cars, rather than search for parking spaces in the city center, and the cost of parking was less at the P&R facility, compared with that in the city center. Moreover, the results demonstrated that using AVs as a transport mode to replace personal cars reduced travel time, because the number of vehicles on the road network was reduced, and the parking process time was removed. In this regard, AVs can transport travelers to the location of P&R facilities and park there (if they are not called), and this strategy can decrease the size of the P&R facilities.
The limitations of this study are: (1) the study used a sample size that only covered only the Budapest city and did not include the travelers who come to the city from other cities and towns. In this regard, a recommendation for making a wider survey to include the large size of sample size that considers the travelers from outside of Budapest; (2) the results of this study were produced based on the current transportation system—especially the schedule of public transport network and lines—as well as the road network, and changes in this would change the results of this study; (3) the study used the existing P&R facilities in Budapest, whereas constructing new facilities would change the result negatively or positively, which leads to the importance of conducting a simulation study to evaluate and optimize the locations of the proposed P&R facilities; and (4) the locations of the activities of the travelers and the characteristics of trips and travelers affect the result of the simulations conducted in this paper in terms of the AV fleet size, travel time, P&R strategy (management and operational process), and travel distance. Therefore, future researches based on the limitations of this study are recommended.


