1. Introduction
With the development of the fifth generation (5G) communication network, the increase in data traffic has increasing raised service quality requirements. The delayed performance of 5G networks is highly influenced by dynamic traffic variations. Therefore, to design systems related to packet delay or packet throughput, randomly deployed networks with queueing interactions must be accurately modelled and analyzed. To account for the actual dynamic traffic in cellular networks, stochastic geometry was combined with queueing theory to establish spatiotemporal models to capture both spatial distribution randomness and packet arrival randomness [
1,
2,
3].
Stamatiou et al. [
4] bridged the gap between the work considering Poisson point process (PPP) modelling with backlogged nodes and the work on random access protocol did not consider the random spatial distributions of nodes. Zhong et al. [
5] employed tools from queueing theory and point process theory to study the sufficient and necessary conditions for queue stability of a static Poisson network. The results were based on constant link distances and failed to capture random network topology. Yang et al. [
6] deduced mean packet throughput using the random scheduling (RS) strategy in small cell networks. However, the method limits the maximum number of users served per cell and ignores the user association randomness. Zhong et al. [
7] analyzed the packet delay in a cellular heterogeneous network, considering randomly generated data traffic. They evaluated the delay performance of three scheduling schemes: RS, first-in first-out scheduling, and round-robin (RR) protocol. However, only bounds for the delay distribution were obtained and active probabilities of base stations (BSs) were fixed. The signal-to-interference-ratio (SIR) analysis and the status of the queues were not decoupled. Yang et al. [
8] derived the delay outage of a Poisson point processe (PPP) distributed small cell network with RS or RR being adopted. The user number per cell was fixed. Assumptions in these analyses were usually simplified. Accurate modelling is still necessary to help gain useful insights and design suitable methods.
In the letter, a spatiotemporal model is developed in a K-tier heterogeneous network (HetNet), where the data packets’ arrival of each user are initiated randomly and the BS locations in each tier are modelled as independent PPPs. The effects of bias association, scheduling schemes, and universal frequency reuse (UFR) mode are all considered to more realistically reveal the HetNet scenario. Interference interactions in the spatiotemporal HetNet are accurately captured. By adopting stochastic geometry and queueing theory, accurate expressions of mean packet throughputs of the network are derived, which can help provide insights into system designs associating with packet throughput.
2. System Model
In this paper, we consider interference performance under direct data transmission in a downlink K-tier heterogeneous network. The research on heterogeneous networks dates back to the BARWAN (Bay Area Research Wireless Access Network) project initiated by the University of California, Berkeley in 1995. The project leader, RH Katz, first mentioned the integration of different types of networks that overlap each other to form heterogeneous networks. Network to meet the business diversity needs of future terminals. Each converged network is called a layer of heterogeneous network, and a layer of heterogeneous network usually contains a base station and several mobile terminals. In the following decades, heterogeneous networks have attracted widespread attention in the field of wireless communications, and have also become the development direction of next-generation wireless networks. Locations of BSs from the ith () tier formed an independent homogeneous PPP with density and the users formed another PPP with density . The BS transmission power of the ith tier is .
The propagation channel suffers from small-scale Rayleigh fading with unit mean power and large-scale path loss, which can be written as , with being the path loss exponent according to the power law model. The Rayleigh fading channel is a statistical model of the radio signal propagation environment. In the wireless communication channel environment, after the electromagnetic waves reach the receiver through multiple paths such as reflection, refraction, and scattering, the intensity of the total signal obeys the Rayleigh distribution. At the same time, due to the movement of the receiver and other reasons, characteristics such as signal strength and phase are fluctuating, so it is called Rayleigh fading. Rayleigh fading is applicable to the case where there is no direct signal from the transmitter to the receiver, and it is especially suitable for complex heterogeneous network scenarios. To balance the load among different tiers, we assume the ith tier has the bias factor .
Each user is associated with the BS, providing the maximum average biased received power. The universal frequency reuse mode is adopted, and users suffer from both intra-and inter-tier interference. The general frequency reuse mode is to reuse frequencies and was first used in GSM networks. Frequency multiplexing means that the same frequency covers different areas. These areas using the same frequency need to be separated from each other by a certain distance to suppress the same frequency interference to within the allowable index. In order to make full use of frequency resources, frequency reuse technology has also become an important research content of next-generation wireless networks.
We introduce discrete time queueing model to capture the sporadic wireless data generation conditions. In particular, time is divided into a series of equal time intervals, i.e., time slots. Packet arrivals at each user follow an independent Bernoulli process at a rate of
(packets/slot). Under normal circumstances, the data in the network is bursty. To facilitate the analysis and analysis of system performance, it is assumed that the arrival of the data packet follows the Bernoulli process. The size of each packet is unified. We assume the BS is equipped with an infinite buffer and all the incoming packets of a cell follow first come first serve (FCFS). In a heterogeneous network, all nodes will try to send data in the same time slot. Whether the data is successfully transmitted depends on the data buffer and channel conditions. At the beginning of the time slot, the base station with data packets waiting to be sent starts a transmission attempt. After the user receives the signal from the BS, if the instantaneous SIR exceeds a predefined threshold, the user sends an acknowledge character(ACK) through the error-free feedback channel, and the BS deletes the data packet from its buffer; otherwise, the BS receives negative acknowledge(NACK). The data packet remains at the head of the queue and waits for the next transmission opportunity.
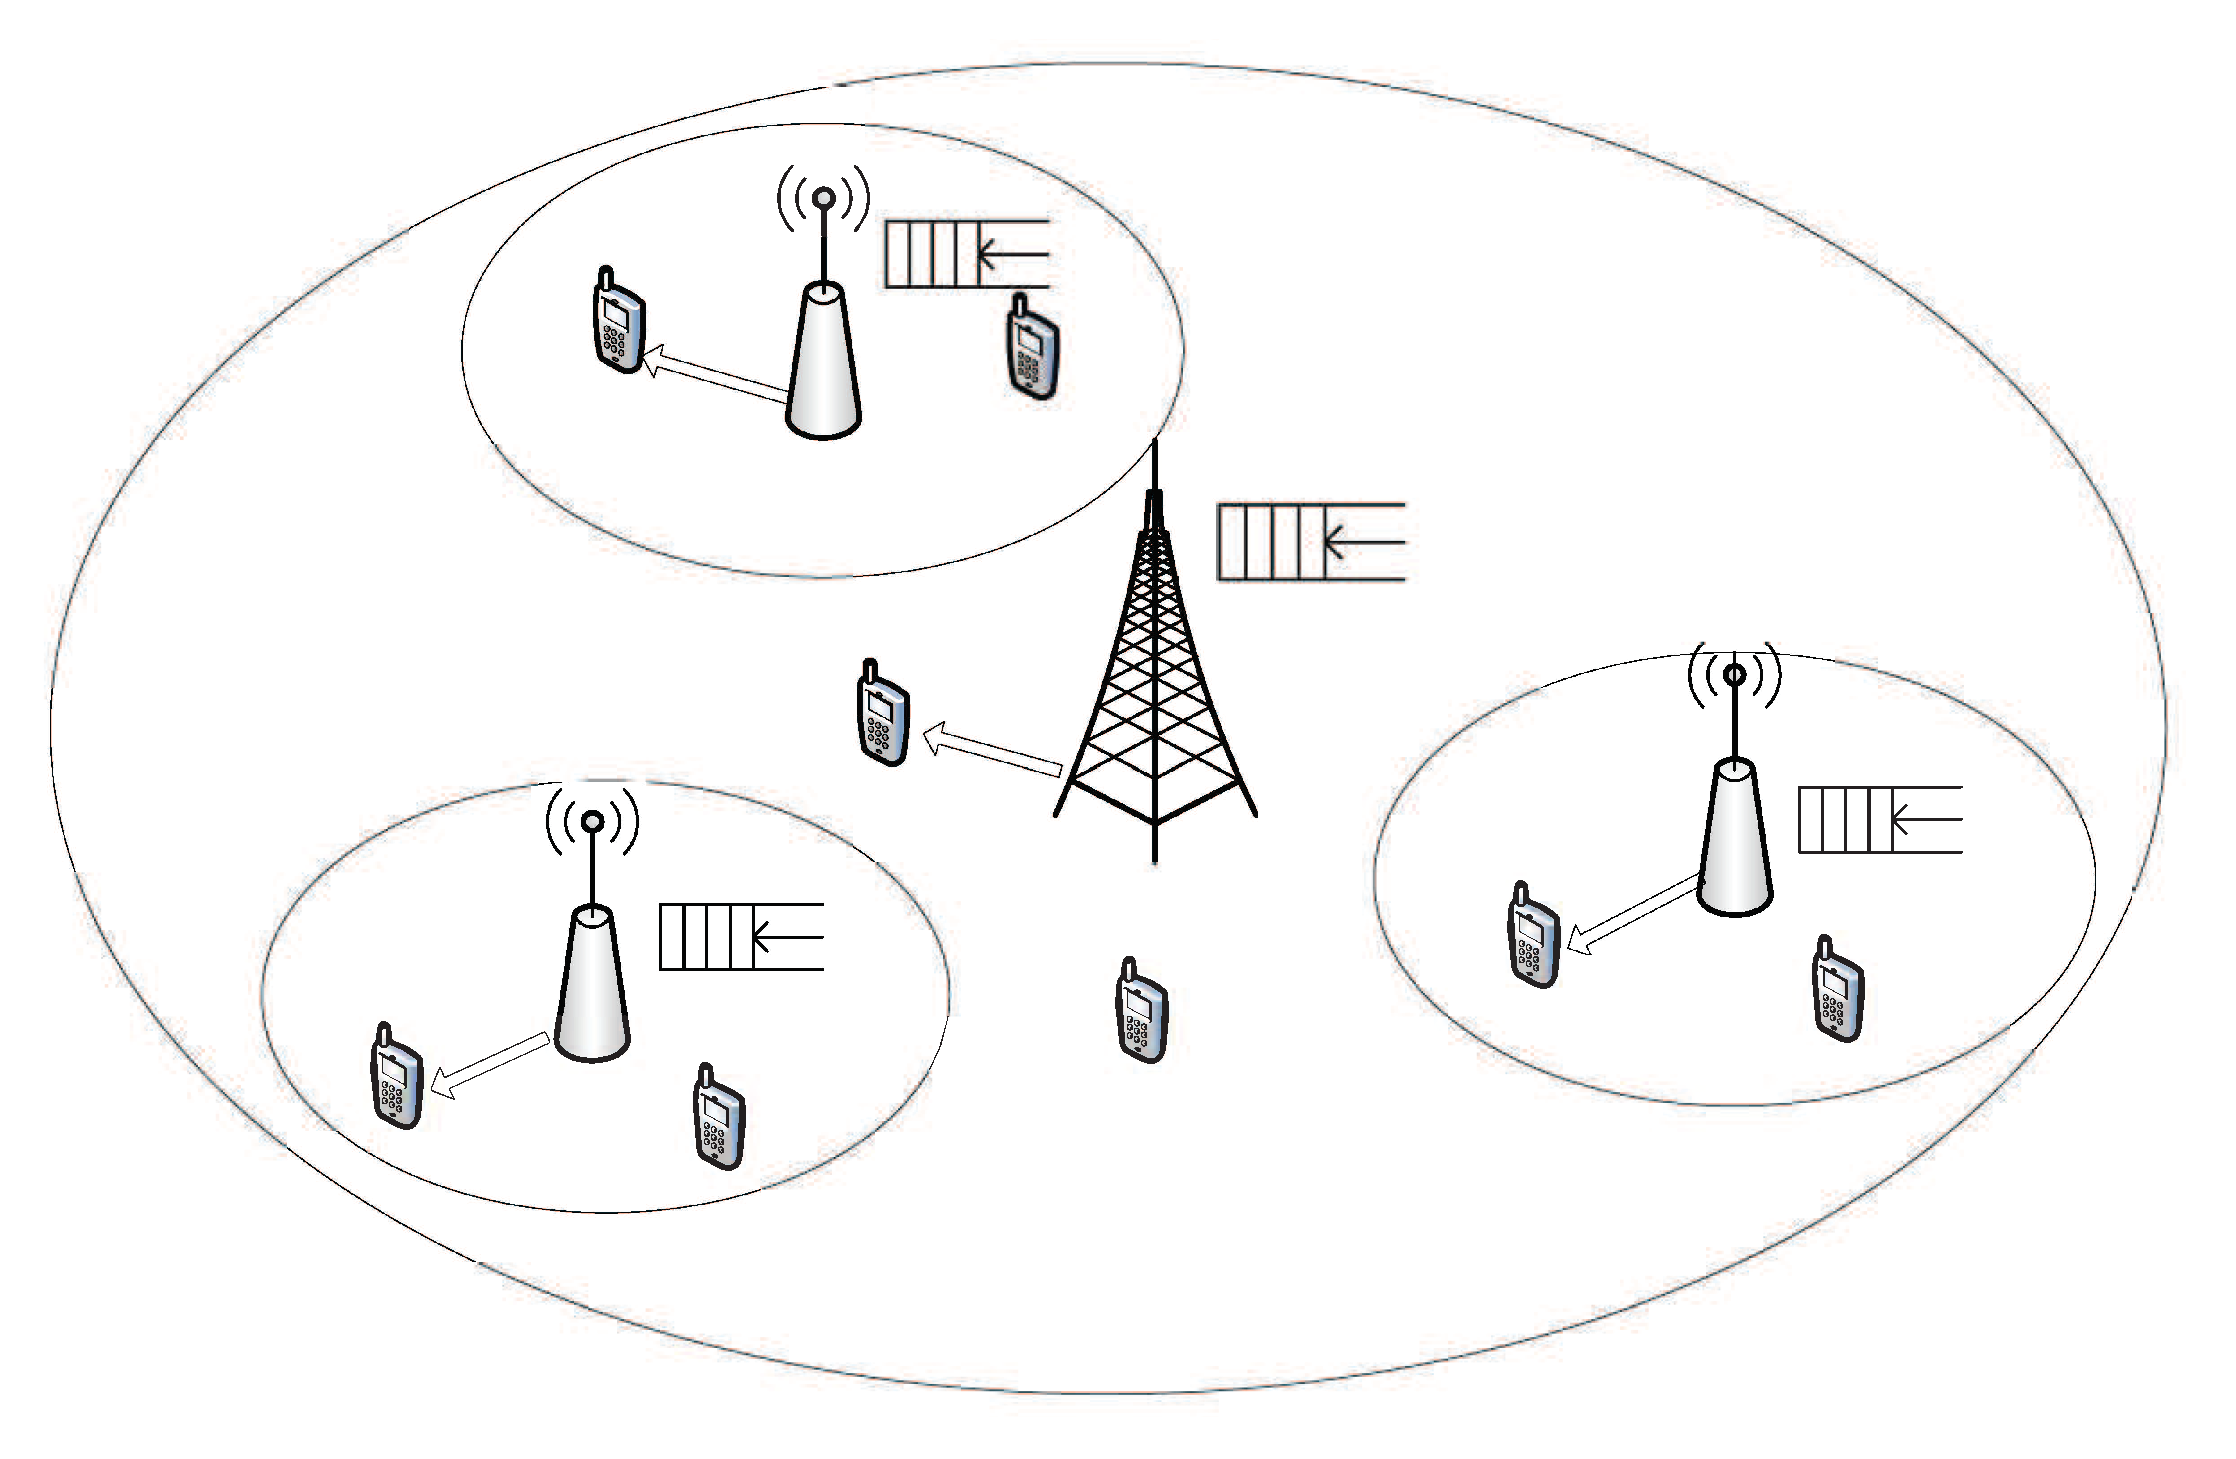
Figure 1 depicts a two-tier heterogeneous network with spatiotemporal model.The disc is used to indicate the coverage of the base station wireless signal. Among various scheduling schemes, RS and RR are the two popular policies from which operators may choose for resource allocation among users as their implementation costs are low [
9]. We assume that
tiers use RS and
tiers use RR
.
3. Mean Packet Throughput Analysis
3.1. Preliminaries
Due to Slivnyark‘s theorem [
10], at time slot
t, the Signal-to-Interference Ratio (SIR) of the typical user, which is located at the origin, is:
where
and
represent small-scale fading of the transmission link and interfering link, respectively;
and
denote the serving distance and interfering distance, respectively;
is the spatial realization of all the point processes, denoted as
: =
; and
denotes the transmission status (transmission or not) of user at
at time slot
t, i.e.,
shows the user is transmitting.
. Please note that the interference contains intra-tier and inter-tier interference.
As shown in
Figure 1, a heterogeneous network usually includes a macro station and several small base stations. The object of this study is a wireless terminal in a small base station, called typical user. Let
be the transmission success probability of the typical user, which depends on the probability that the SIR of the typical user
is above a certain threshold
with the condition of
, i.e.,
. For deriving mean packet throughput, we provide a formal definition as follows:
Definition 1. is the average number of data packets arriving at a transmitter x in time slot , and is sojourn time from the arrival of the ith packet to its successful sending. The definition of mean packet throughput is as follows: Please note that the spatiotemporal characteristics of the network involve two aspects: (1) the service rate of the queueing depends on spatial distribution of users in the network; and (2) the active probability of each BS relies on the queueing status of the transmitters.
From Lemma 1 and Lemma 2 in [
8], we obtain the mean packet throughput and activity probability of a BS with
N associated users under the RS strategy, subject to the realization of the point processing
. The expressions are as follows:
With the same method, the mean packet throughput and active probability of a BS with
N associated users under the RR strategy condition on
are given, respectively, as follows:
3.2. Mean Packet Throughput of the Heterogeneous Network with UFR
Use the same method as in [
11,
12], we know that the probability mass function (PMF) of the user number per cell for a single-tier PPP network with density
is
where
is the gamma function,
.
For a
K-layer heterogeneous network, the area distribution of Voronoi cells in a single-layer PPP network with a density of
[
13] can be used to accurately estimate the area distribution of weighted Voronoi cells in the
ith tier, where
is the probability that a typical user is associated with the
ith tier. The expression is as follows:
Then, the probability mass function (PMF) of
n user per cell in the
ith tier is as follows:
Lemma 1. The expression of the average active probability of the ith tier is as follows:where represents the probability of success transmission of the ith tier. Proof. We assume
. According to Loynes theorem,
is then the maximum average number of users per cell in the
ith tier to maintain the stability of the cell queue states. For cells of the
ith tier that have
associated users, they are active with probability
. For cells that have more than
users, the queueing status is unstable, which means that the BSs are always active. By deconditioning Equations (
4) or (
6) on
N, we obtain get the BS active probability in Equation (
10). □
According to the above derivations, we are now ready to derive the mean packet throughput via queueing theory and stochastic geometry.
Theorem 1. Under UFR mode, Equation (11) gives the mean packet throughout of the network in which tiers adopt RS policy and tiers adopt RR policy. In Equation (11), and are the collections of the tiers that adopt RS and RR, respectively; , , denotes the cardinality of the set; the success transmission probabilities of all tiers satisfy the following equations:where is the density of the kth tier normalized by the density of the ith tier, i.e., , is the bias factor of the k-th tier normalized by the bias factor of the i-th tier, i.e., ,where is the Gauss hypergeometric function. Proof. The transmission success probability of the
ith tier is derived as:
where
follows from the probability generating function (PGFL) and conditional PGFL of PPP [
14],
is the probability density function (PDF) of the serving distance.
is the minimum distance between the typical user and its closest BS from the
kth tier based on the bias association policy.
Therefore,
satisfy the coupling equations in Equation (
12). Please note that the success transmission probability of each tier is associated with that of all other tiers.
By deconditioning Equation (
3) on
N, the mean packet throughput of the
ith tier with RS policy is obtained as:
By deconditioning Equation (
5) on
N, the mean packet throughput of the
ith tier with RR policy is derived as:
Then, the mean packet throughput can be obtained based on the total probability law as:
□
4. Numerical and Simulation Results
In this section, we present the MATLAB simulations that were used to verify the validity of the above analytical results. The extensive simulation results are given to illustrate the behavior of the system with respect to the change in its loading parameters. For simplicity, we analyze the throughput performance of a two-tier heterogeneous network. The first and second tiers are assumed to use RR and RS policy, respectively. We considered a simulation area of
km
2 with base stations and users scattered across the square plane, whose position remains static once they are settled. The total time slots for simulation was set to
. The major parameters in our simulation were as follows, unless otherwise stated [
7,
8]: the packet arrival rate was set to
packets/slot, the SIR is set as
dB, the path loss exponent
is 3.8. This paper studies the performance of internal users of small base stations in heterogeneous networks. Because the data is not always available, the data arrival rate is set to 0.05 packets/slot which is the same setting in [
7,
8]. The BS transmit powers in the first tiers is assumed to be 39 dBm, and the second tiers is respectively to be 24 dBm. The density of the BSs from the two tiers was respectively set to
km
2,
. We first simulated how bias factors influence the throughput performance of the two-tier network model. We set the bias factor of the first-tier
to 1 and analyzed the effect of the second-tier bias factor
. To validate our derived results, the simulation results were carried out and repeated for over 10,000 iterations. The simulation parameters that were based on the Monte Carlo simulation method are shown in
Figure 2 and
Figure 3.
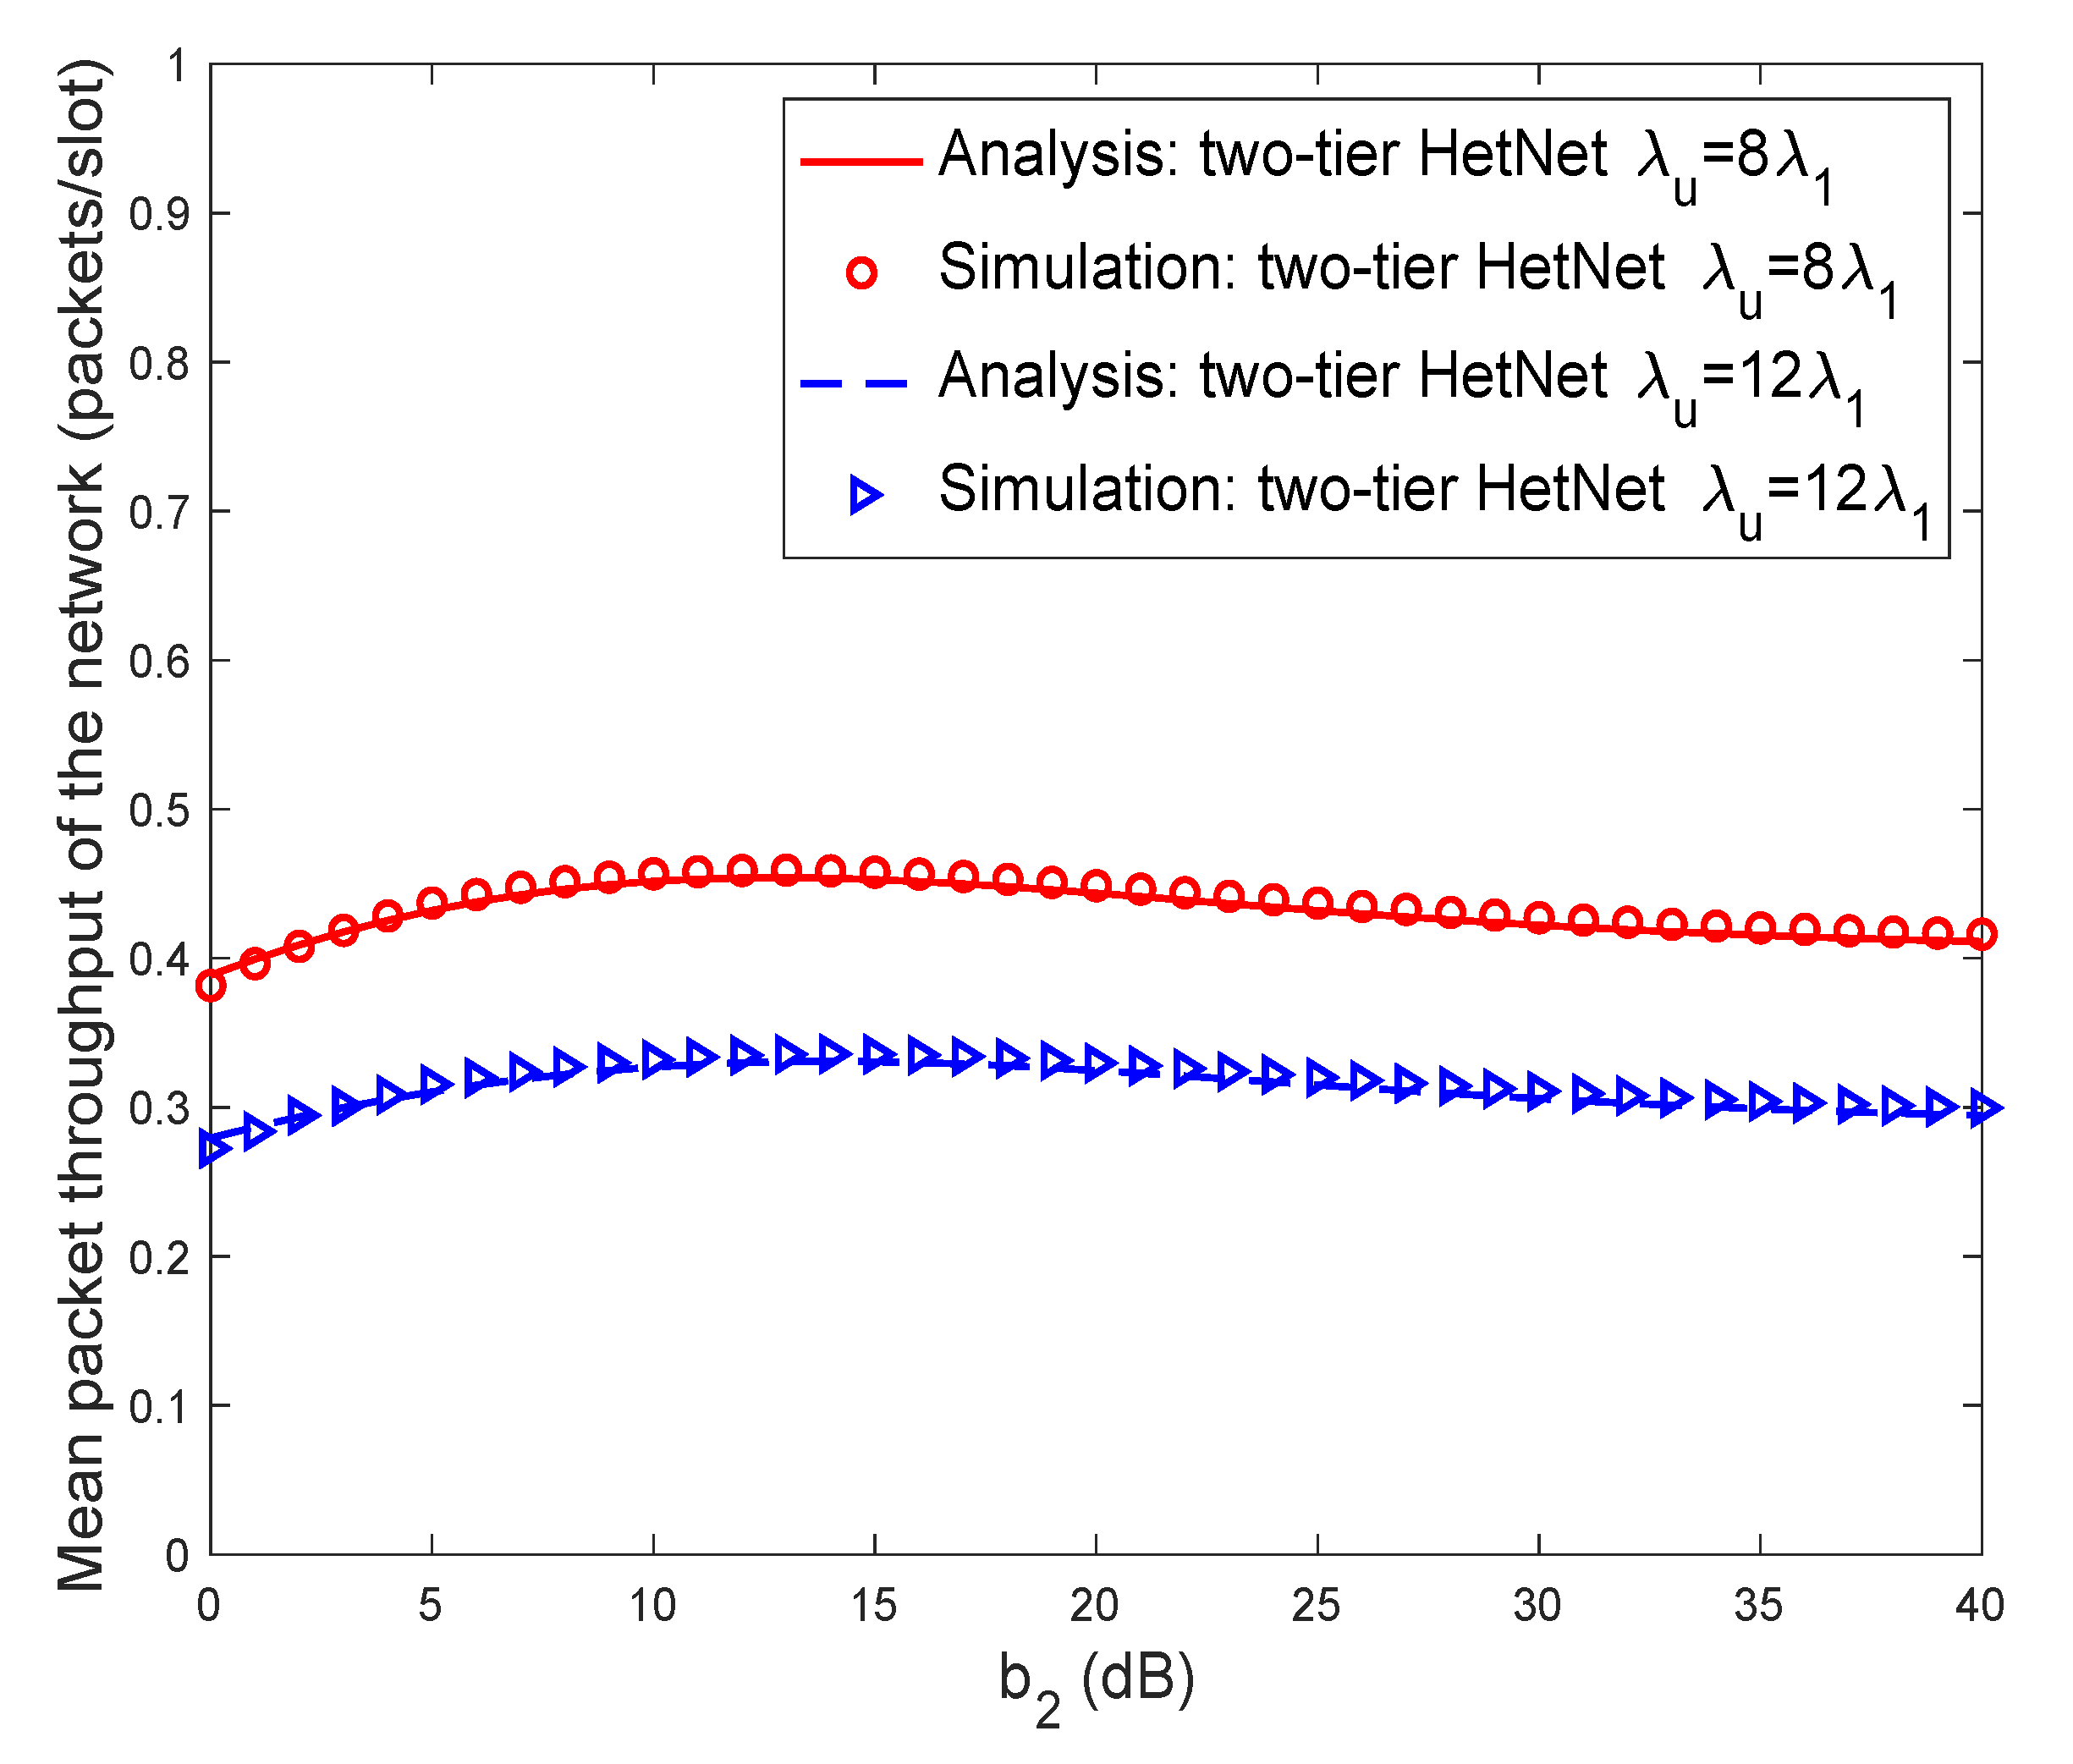
Figure 2 depicts the mean packet throughput of the two-tier network versus
which validates our analysis. The analytical results match the simulation results very well, which verifies the correctness of mathematical derivation. The figure shows that the average packet throughput increases first and then decreases with the increase in
, i.e., an optimal bias factor
maximizes average packet throughput. This occurs because as
increases, more traffic will be offloaded to the second tier, and the first tier becomes less congested. Therefore, the first tier can provide higher packet service rate and higher packet throughput, while the throughput of the second tier is lowered due to increased burden. Given
is small, the throughput of first tier dominates the mean packet throughput. The significant increase in the first-tier throughput led to an increase in network throughput. When
increases, more traffic is transferred to the second tier, and the curve approaches the throughput of the second tier. Therefore, our analytical results can help with the design of an optimal bias factor for a network to maximize the mean packet throughput.
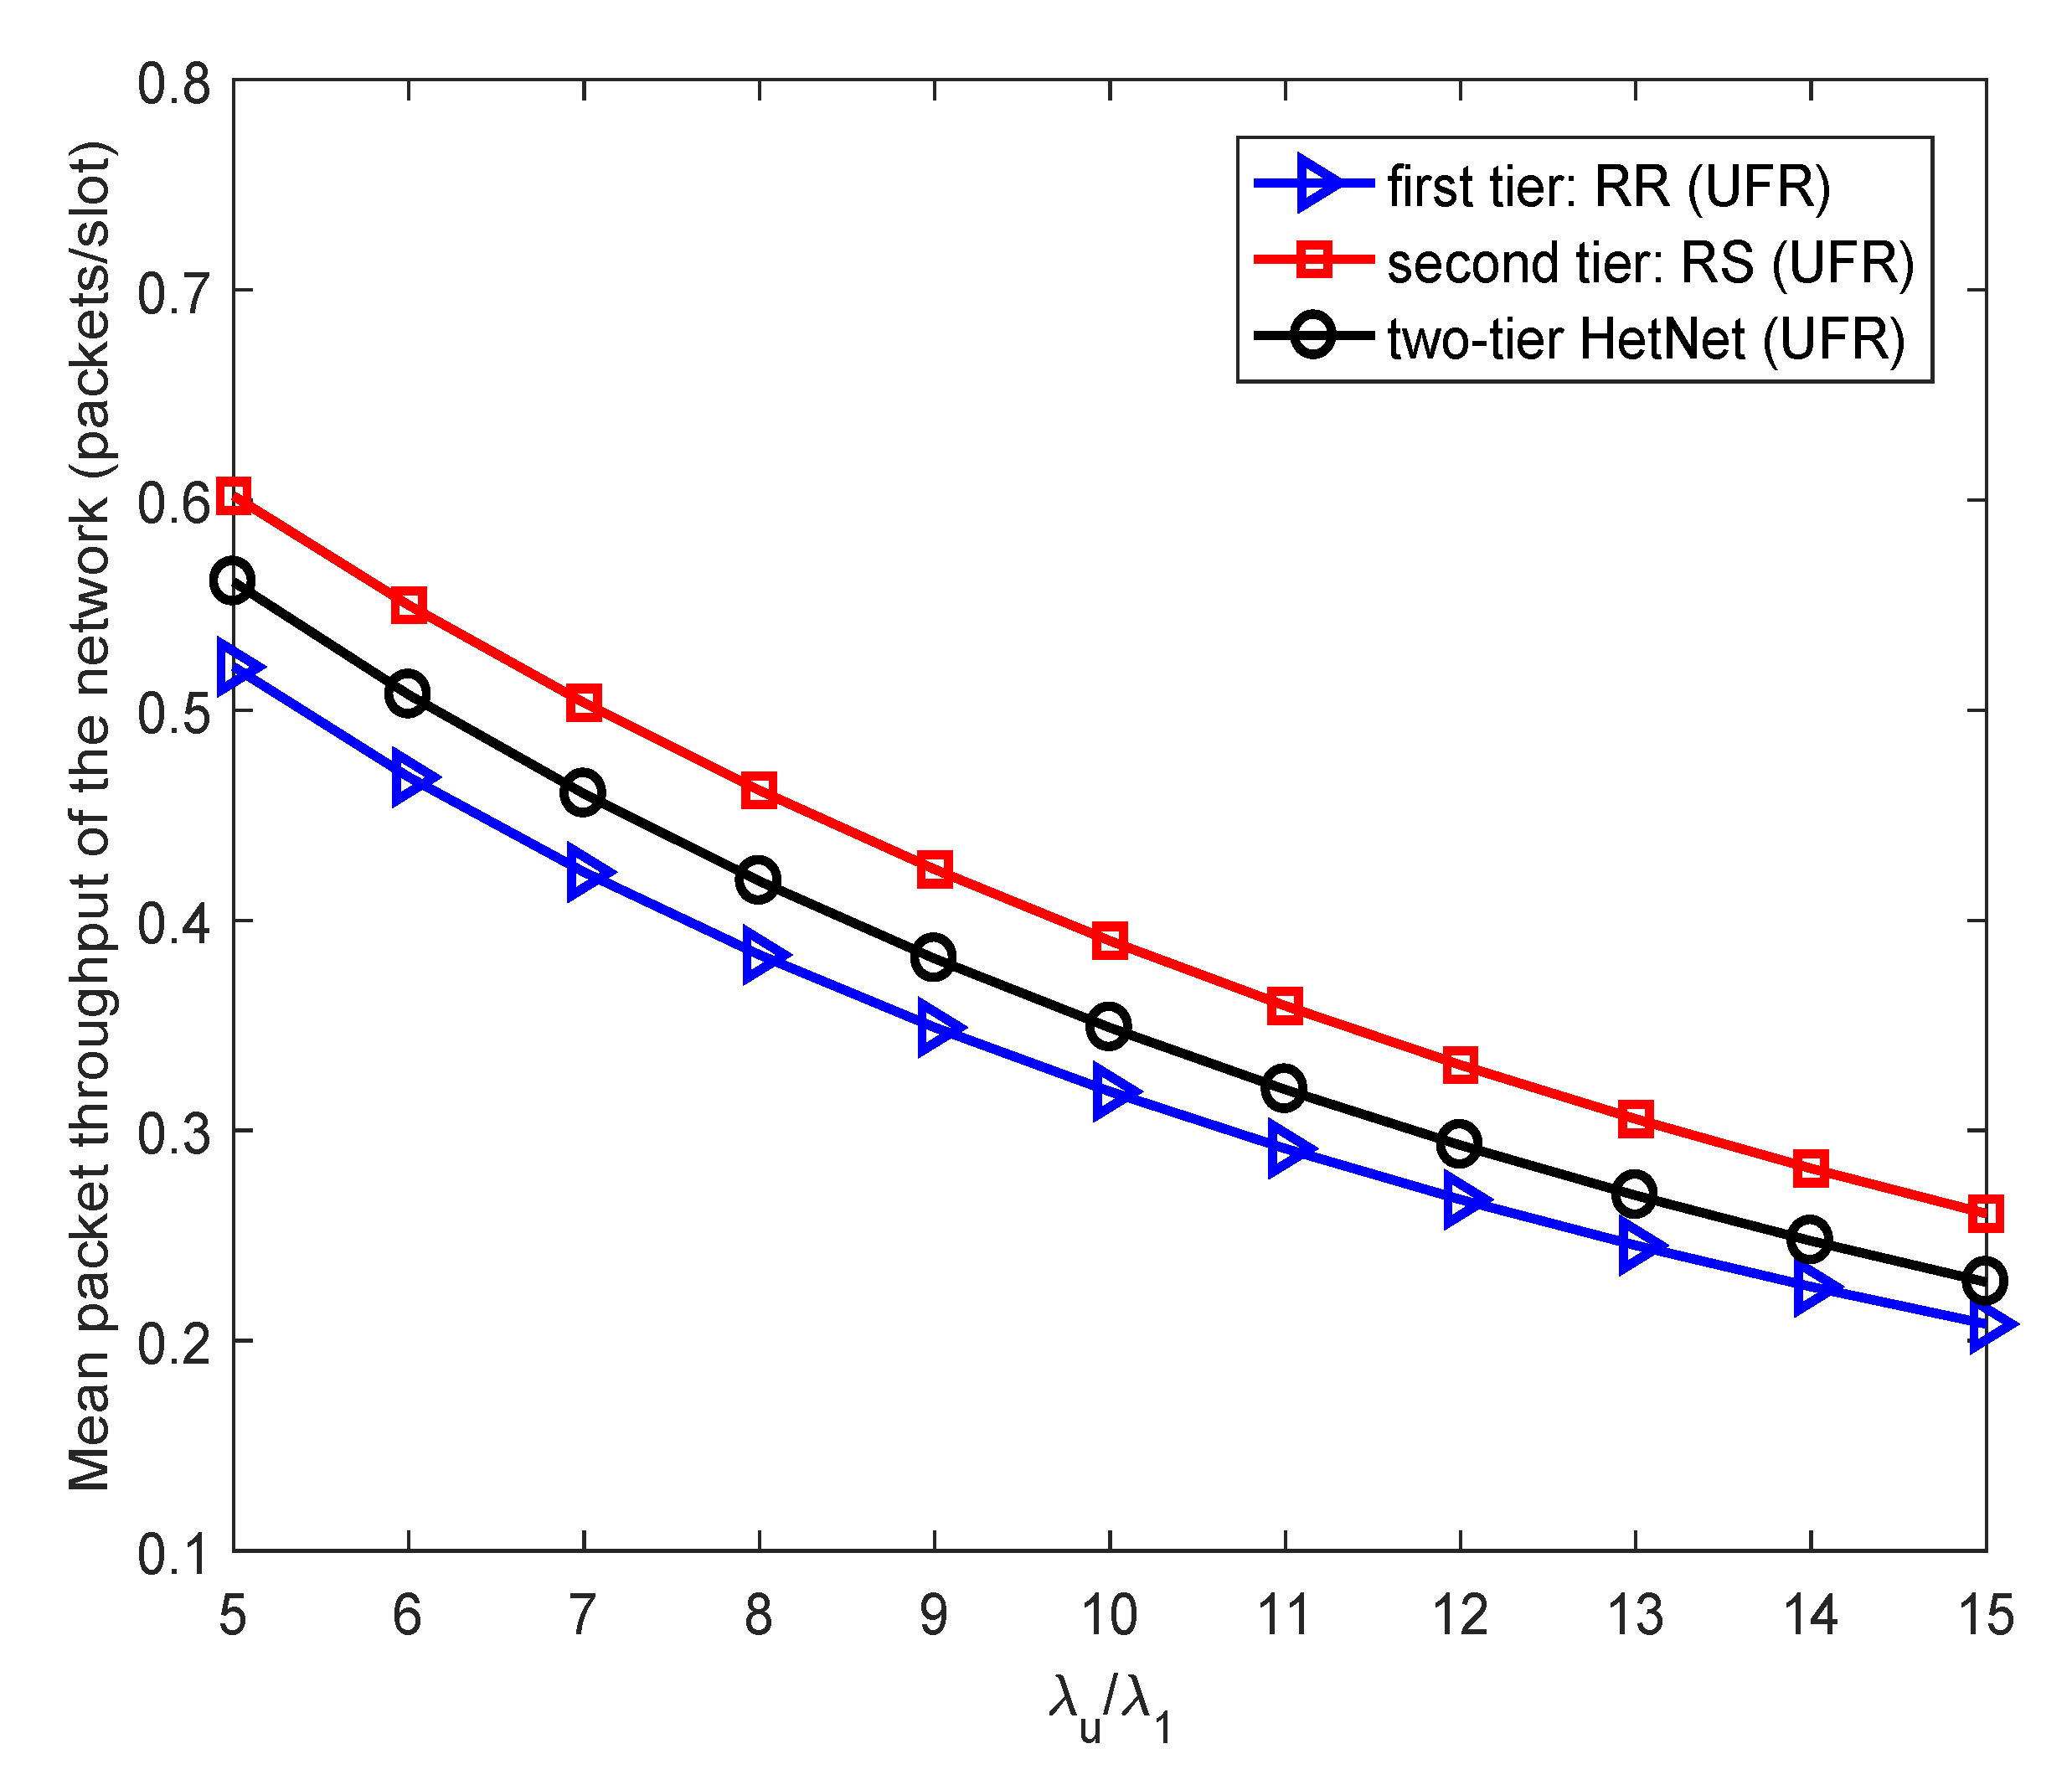
Figure 3 depicts the variation of the mean packet throughput of the network with the density ratio
. The mean packet throughput shows a decreasing tendency. This can be explained by a higher
leading to more congestion, which leads to a higher probability of BS activity and greater interference with typical users. When
increases, the mean packet delay is prolonged, which leads to the decline in the mean packet throughput. For achieving a certain packet throughput value, BS density can be designed for a given user density according to our analysis.
5. Conclusions
In this letter, the downlink packet throughput of a K-tier PPP distributed heterogeneous network with spatiotemporal traffic was analyzed. The dynamic traffic involves both spatial and temporal randomness, which respectively reside in PPP distributed user locations and Bernoulli packet arrivals. To balance traffic among tiers, bias association was employed. For traffic management, we used RR and RS protocols. For spectrum reusing, we assumed all tiers use the same spectrum for more realistic modelling. Interference interactions of the proposed spatiotemporal heterogeneous network were accurately captured. As a result of linking the transmission success probability to the active probability, we obtained accurate expressions of mean throughput of the network under universal frequency. The parameters of our analysis provide guidance for designing spatiotemporal models in heterogeneous networks.
For example, based on the analysis, we can see that the proper design optimal deviation factor can maximize the average packet throughput of the network under various packet arrival rates. Conversely, according to our analysis results, the BS density can also be designed to ensure the network reaches a certain average packet throughput level under a given user density.
Author Contributions
J.X., Y.W. and Q.Z. conceived and designed the experiments; J.X. performed the experiments; J.X., T.Z., G.L. and Q.Z. analyzed the data; J.X. contributed reagents/materials/analysis tools; J.X. wrote the paper. All authors have read and agreed to the published version of the manuscript.
Funding
The work is supported by Natural Science Foundation of China (61571234, 61631020), Innovation project for postgraduates of Jiangsu province (KYCX19_0887), Youth Foundation of Anhui Polytechnic University (2014YQ40) and General research project of Anhui higher education promotion plan (Grant TSKJ2015B18, KZ00215021), the High-level Introduction of Talent Scientific Research Start-up Fund of Jiangsu Police Institute (2019).
Conflicts of Interest
The authors declare no conflict of interest.
References
- Ephremides, A.; Zhu, R.-Z. Delay analysis of interacting queues with an approximate model. IEEE Trans. Commun. 1987, 35, 194–201. [Google Scholar] [CrossRef]
- Blaszczyszyn, B.; Jovanovic, M.; Karrat, A.K. Performance laws of large heterogeneous cellular networks. In Proceedings of the 13th International Symposium on Modeling and Optimization in Mobile, Ad Hoc, and Wireless Networks (WiOpt), Mumbai, India, 25–29 May 2015; pp. 597–604. [Google Scholar]
- Baccelli, F.; Blaszczyszyn, B.; Muhlethaler, P. Stochastic analysis of spatial and opportunistic Aloha. IEEE J. Sel. Areas Commun. 2011, 59, 3122–3134. [Google Scholar] [CrossRef]
- Stamatiou, K.; Haenggi, M. Random-access poisson networks: Stability and delay. IEEE Commun. Lett. 2010, 14, 1035–1037. [Google Scholar] [CrossRef]
- Zhong, Y.; Haenggi, M.; Quek, T.Q.S.; Zhang, W. On the stability of static poisson networks under random access. IEEE Trans. Commun. 2016, 64, 2985–2998. [Google Scholar] [CrossRef]
- Yang, H.H.; Geraci, G.; Zhong, Y.; Quek, T.Q.S. Packet throughput analysis of static and dynamic TDD in small cell networks. IEEE Wirel. Commun. Lett. 2017, 6, 742–745. [Google Scholar] [CrossRef]
- Zhong, Y.; Quek, T.Q.S.; Ge, X. Heterogeneous cellular networks with spatio-temporal traffic: Delay analysis and scheduling. IEEE J. Sel. Areas Commun. 2017, 35, 1373–1386. [Google Scholar] [CrossRef]
- Yang, H.H.; Wang, Y.; Quek, T.Q.S. Delay analysis of random scheduling and round robin in small cell networks. IEEE Wirel. Commun. Lett. 2018, 7, 978–981. [Google Scholar] [CrossRef]
- Hahne, E.L. Round-robin scheduling for max-min fairness in data networks. IEEE J. Sel. Areas Commun. 1991, 9, 1024–1039. [Google Scholar] [CrossRef]
- Andrews, J.G.; Baccelli, F.; Ganti, R.K. A tractable approach to coverage and rate in cellular networks. IEEE Trans. Commun. 2011, 59, 3122–3134. [Google Scholar] [CrossRef]
- Ferenc, J.-S.; Néda, Z. On the size distribution of Poisson-Voronoi cells. Phys. A Stat. Mech. Appl. 2007, 385, 518–526. [Google Scholar] [CrossRef]
- Elsawy, H.; Hossain, E. On cognitive small cells in two-tier heterogeneous networks. In Proceedings of the 11th International Symposium and Workshops on Modeling and Optimization in Mobile, Ad Hoc and Wireless Networks (WiOpt), Tsukuba Science City, Japan, 13–17 May 2013. [Google Scholar]
- Singh, S.; Dhillon, H.S.; Andrews, J.G. Offloading in heterogeneous networks: Modeling, analysis, and design insights. IEEE Trans. Wirel. Commun. 2013, 12, 2484–2497. [Google Scholar] [CrossRef]
- Jo, H.S.; Sang, Y.J.; Xia, P.; Andrews, J.G. Heterogeneous cellular networks with flexible cell association: A comprehensive downlink SINR analysis. IEEE Trans. Wirel. Commun. 2012, 11, 3484–3495. [Google Scholar] [CrossRef]
© 2020 by the authors. Licensee MDPI, Basel, Switzerland. This article is an open access article distributed under the terms and conditions of the Creative Commons Attribution (CC BY) license (http://creativecommons.org/licenses/by/4.0/).


