1. Introduction
In contrast to subtractive manufacturing methods, additive manufacturing (AM, also known as 3D printing) produces components and parts by adding material layer-upon-layer of a predefined thickness. AM offers increased design freedom, lead-time reductions, and the possibility of functional integration, with AM technologies being increasingly adopted and developed by industry, resulting in more varied and affordable processes, accompanied by greater market acceptance and penetration [
1,
2,
3]. In particular, 3D printing has become a viable alternative to conventional manufacturing processes in numerous applications, i.e., in the automobile, aerospace, medical, and construction industries and widely in furniture production [
4,
5,
6,
7]. Especially in the aerospace sector, parts previously manufactured by traditional means are being replaced by additively manufactured low-weight polymer components. Although AM was previously primarily used to produce prototypes, it has now developed sufficiently for customized mass production of functional parts [
8,
9].
AM technologies can be classified into seven main categories [
10,
11] under which polymers can be 3D printed via polymerization, powder-bed-based processes, and extrusion-based processes [
12]. In the polymerization process, an energy source such as a laser beam or UV radiation solidifies/cures a liquid photopolymer (monomer) layer by layer following a slicing strategy. The second method (powder-bed-based process) uses a bonding agent, such as an adhesive applied onto sequential layers of powder which then stick together and in aggregate form the part [
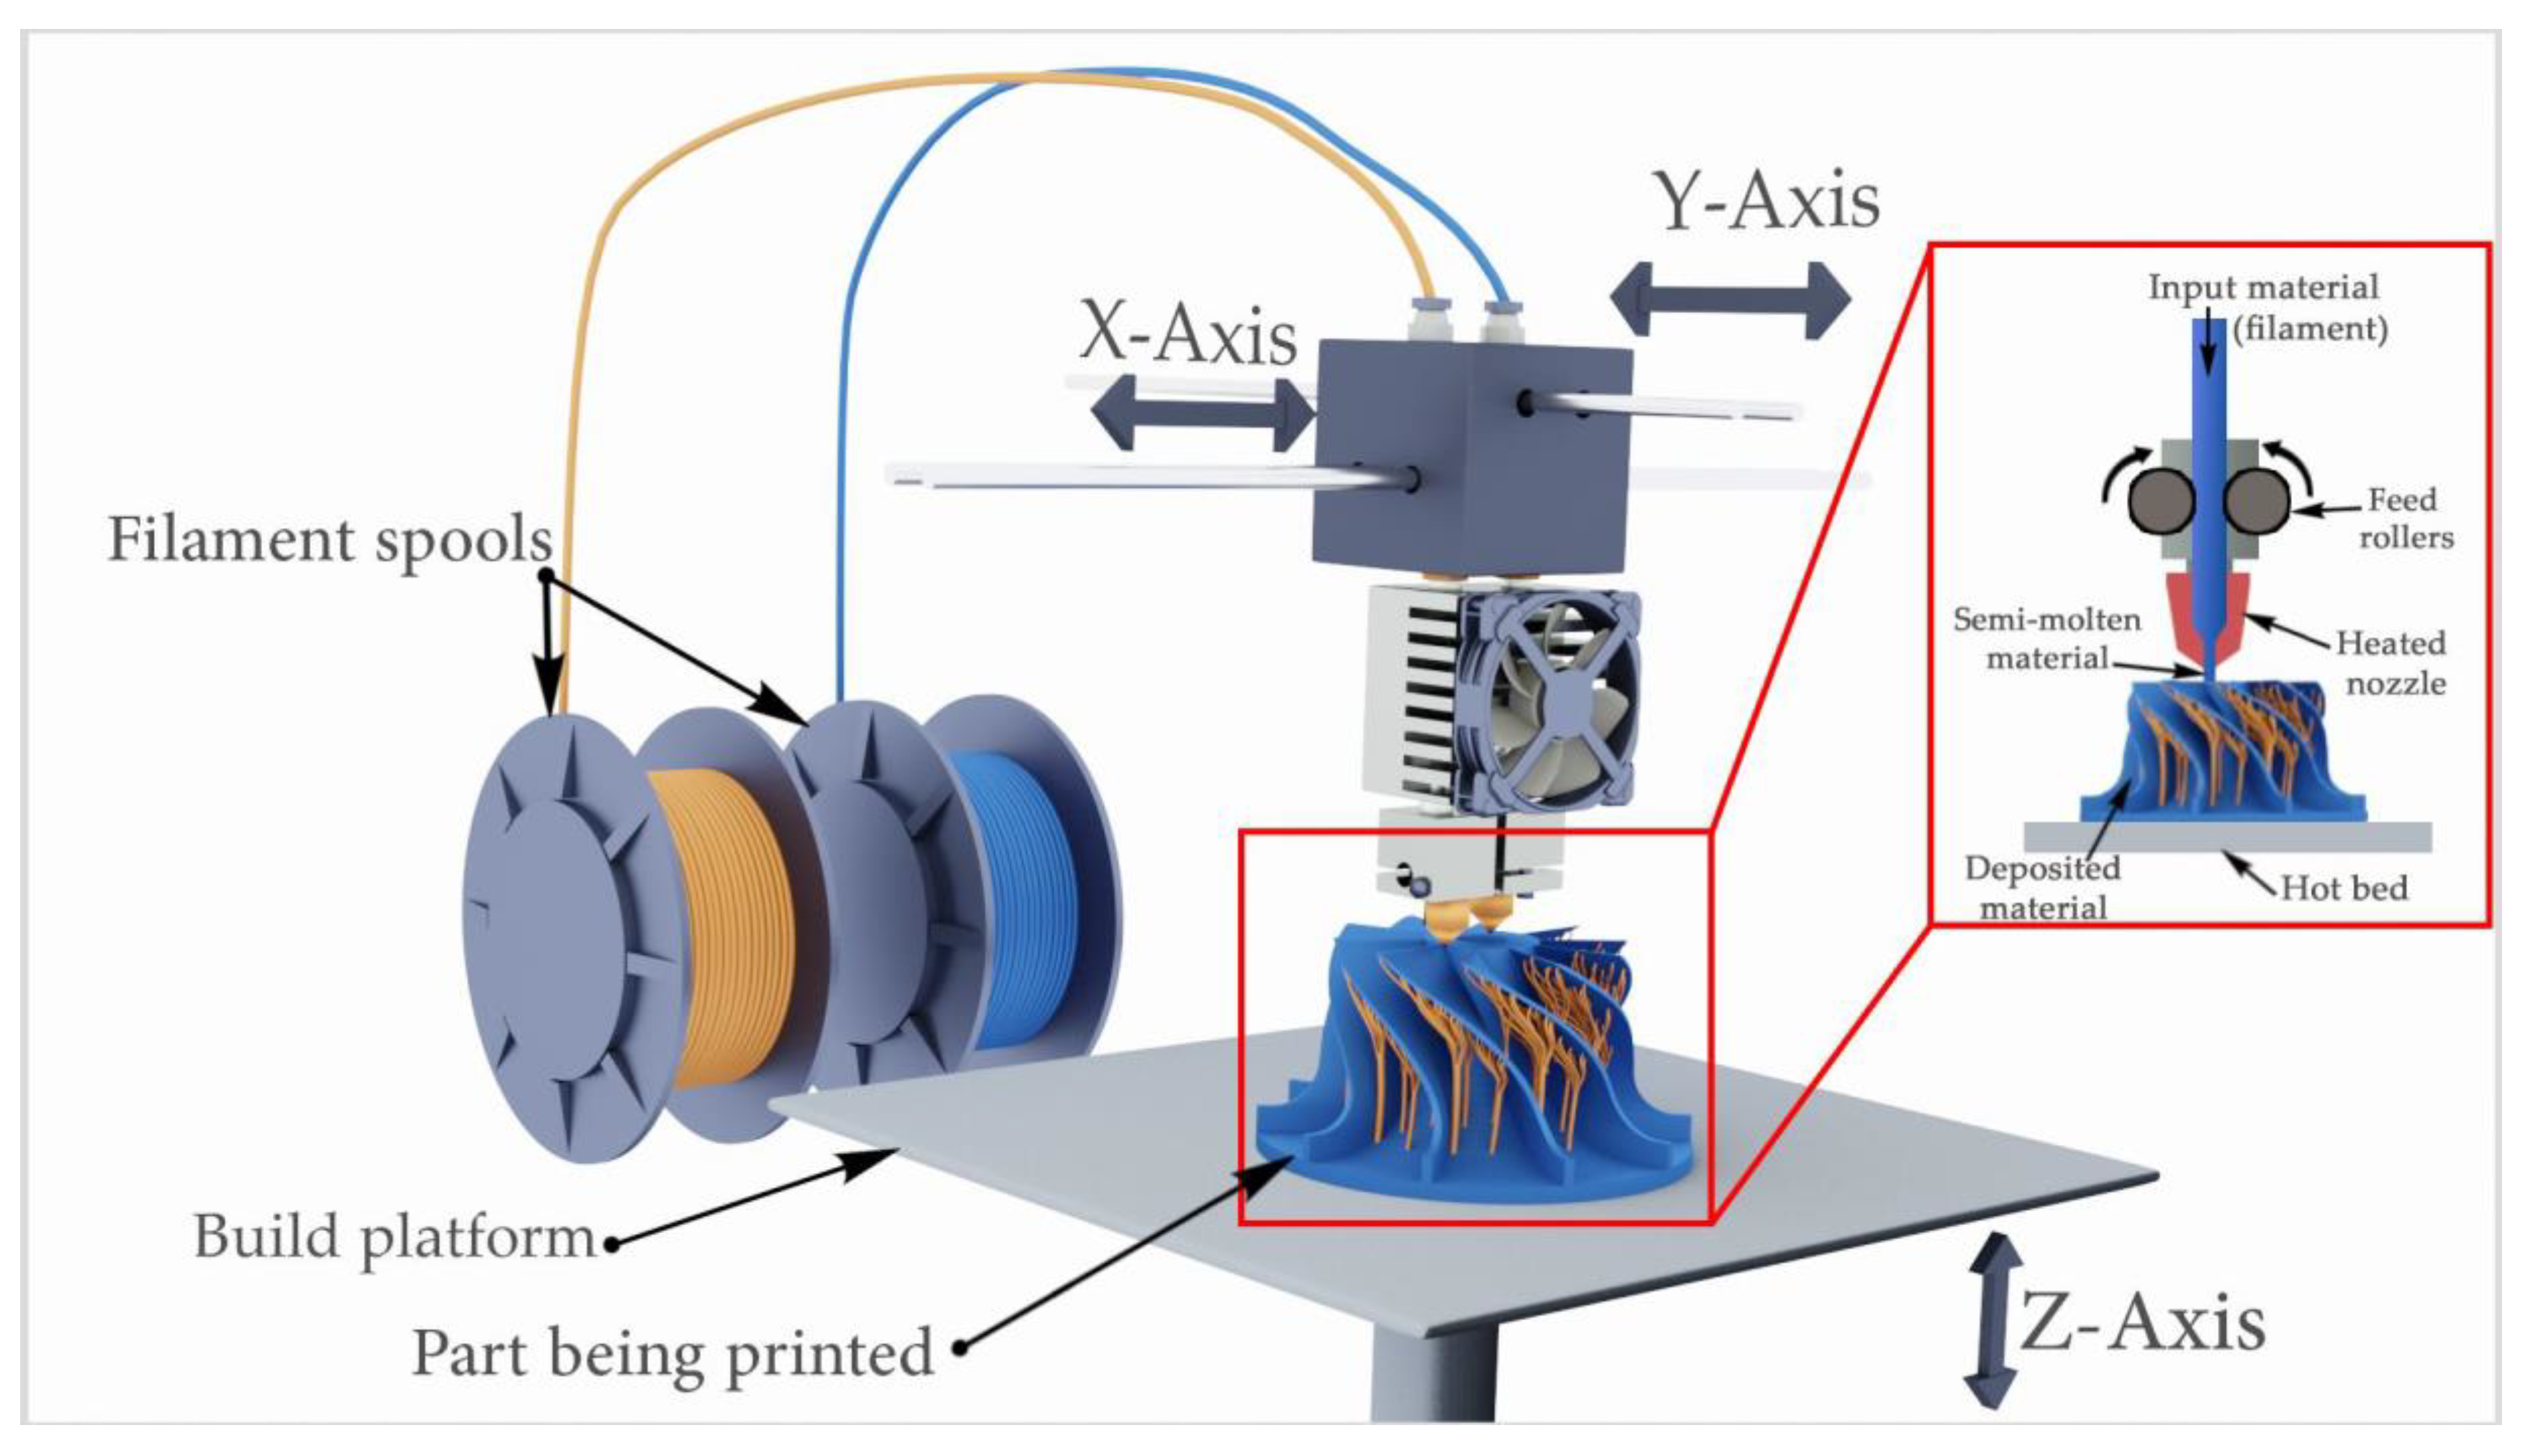
13]. The third, extrusion-based process, is where an induction heater is applied to a wire-shaped filament to form the component layer by layer by depositing the molten filament onto the printing platform in a G-code predefined path. An example of the third process is fused filament fabrication (FFF) in which a continuous filament of a thermoplastic material is extruded through a heated “printer head” controlled via G-code, which is deposited, layer-by-layer, on a platform to form the component, see
Figure 1. The movement of the extruder is invariably in the X–Y directions only, with the build platform moving in the Z direction [
14].
By using printers with dual or multiple extrusion nozzles, multicolored or multiple material parts can be produced. Simultaneous 3D printing of multiple materials enables integration of different properties (e.g., flexibility, folding, deployment, shape memory, and electric conductivity) into intricate products in a single manufacturing process [
15,
16,
17,
18]. Additionally, a wide range of polymers used for FFF nowadays can be recycled, and the nonmelted material (metal and polymer) from different AM processes can be reused [
3,
19,
20].
AM technologies are considered key enablers for modern industry due to their potential to revolutionize manufacturing, by introducing new processes, materials, and applications [
21]. Given the present rate of growth, there exists a real need to ensure sustainable development for these technologies [
22]. In the context of climate change, production processes need to be environmentally friendly, but they also have to be competitive regarding time, price, and quality. In particular, enhancing sustainability by consuming less energy and reducing material wastage will help unleash the full potential of these technologies, and offer enormous opportunities to realize smart resource-orientated manufacturing in the context of Industry 4.0. However, with FFF printing, defects, inaccuracies, or other problems regarding the quality often arise [
23]. In particular, the surface roughness of 3D-printed parts is not able to match the quality of those being manufactured using conventional subtractive techniques or injection molding. Currently, time, costs, and technical challenges for postprocessing these surfaces exceed the saved time and costs of the more convenient 3D printing process and restrict FFF from industrial application [
24]. One possibility of overcoming these problems is to optimize the process beforehand by identifying appropriate printing parameters [
25]. In order to do this, it is necessary to investigate the large number of individually adjustable printing parameters and their stochastic behavior in the FFF printing process.
In the published literature, a number of studies can be found on optimization of 3D printing parameters. Griffiths et al. [
26] experimentally examined the effect of varying four of the significant process parameters, i.e., slice orientation, infill percentage, number of shells, and layer thickness on the energy and waste consumption when 3D printing with polylactic acid (PLA) materials. It was found that slice orientation had the greatest influence on the scrap weight, whereas layer thickness was the most significant parameter affecting energy consumption and production time. It was pointed out that there were trade-off effects of changing slice orientation on production time and material waste. This was because the orientation that gave a larger vertical cross-sectional area is associated with more waste but a smaller number of layers and lower production time. Peng et al. [
27] analyzed the correlation of surface roughness and energy consumption with layer thickness, printing speed, and infill ratio, for three desktop printers using PLA as printing material. A portable wattmeter and a laser microscope system were used to measure the responses. The results showed that energy consumption was linked to the printing time, which was influenced mainly by layer thickness. In addition, surface roughness was found to depend primarily on the layer thickness, one increasing with the other. Therefore, layer thickness is a conflicting factor, but the energy consumption can be reduced by increasing printing speed while maintaining a good surface quality. Pérez et al. [
28] inspected the effect of layer thickness, printing speed, temperature, and wall thickness (contour thickness) on the surface roughness. Using analysis of variance, layer thickness and wall thickness were identified as critical factors, while printing speed and temperature seemed to have less influence. Raju et al. [
29] investigated the effect of layer thickness, support material, infill percentage, and part orientation on the surface quality. The study revealed a correlation between surface quality and increasing layer thickness due to the staircase effect, roughness increasing with step height. Roughness could be optimized by a part orientation of 90°, and a reduction in model interior from solid to high density. Valerga et al. [
30] studied the influence of material pigmentation, environmental humidity, and extrusion temperature on surface quality, dimensional quality, and mechanical strength. Only the extrusion temperature significantly affected surface and dimensional qualities. It was found that high extrusion temperatures increased dimensional deviations due to reduced viscosity. High extrusion temperature also increased the occurrence of bubbles, which negatively influenced the surface quality and increased dimensional deviations. Srivastava et al. [
31] investigated the influence of slice height, contour width, raster width, and air gap (between part and support structure), with three levels for each factor, on the material volume of an acrylonitrile butadiene styrene (ABS) test specimen using a FFF 3D printer. Regression analysis showed that the air gap was the most significant factor affecting the model material volume, followed by contour width, slice height, and raster width. Yang, et al. [
32] studied the impact of five printing parameters on the mechanical properties, surface finish quality, and production time of additive manufactured PLA test pieces using FFF. They examined the effect of nozzle diameter, liquefier temperature, extrusion velocity, filling velocity, and layer thickness, each having three levels, on surface roughness, tensile strength, and production time. Using a central composite design for the experiment, they validated the previously developed regression model and showed that by increasing nozzle diameter, filling velocity, and layer thickness both surface roughness and tensile strength increased but production time was reduced. Generally, liquefier temperature and extrusion velocity had less impact on the product than expected. Huang et al. [
33] examined the mechanical properties, surface quality, and microstructure of FFF 3D-printed ABS samples by varying four process parameters, i.e., layer thickness, printing speed, raster angle, and build orientation, and found the most important factor to be layer thickness, for all three dependents followed by the build orientation.
This literature review shows there exists a number of statistical-based experimental studies to optimize the FFF process. However, the design of experiment (DoE) in previous studies is mostly limited to three input factors with three or less levels for each factor, and therefore, a smaller number of experimental runs. Furthermore, most of the reported works in the literature solely examine either quality or efficiency, rather than the correlation of both. Hence, there is a gap concerning a broad analysis, which includes a wide range of factors and their levels and which provides a detailed insight into the interactions and effects of varying these parameters on the quality and resource efficiency of printed parts. In an attempt to fill this gap, this paper reports a comprehensive investigation aimed at optimizing FFF printing parameters through experiment-based data analysis to fulfil the requirement of low-energy consumption coupled with high productivity and with high-quality printed parts in terms of surface quality and dimensional accuracy.
Following this introduction, the remainder of the paper is organized as follows. First, the experimental work, entailing material and methods, is described. Here, the applied processing parameters, measurement instrumentations, and procedures are presented. Next, the results are analyzed and discussed. Finally, conclusions are drawn and future work is suggested.
2. Materials and Methods
The material often used for a wide range of 3D printing applications is PLA, a biodegradable material which is easy to print and has fewer printing problems than other polymers in terms of adhesion to the printing platform and resulting warping of the part, a print issue at which the corners of the printed part bend up and detach from the build platform due to a lack of adhesion between the printed part and the platform. In this study, the effects and interactions of five process parameters (infill percentage, layer thickness, printing speed, printing temperature, and surface inclination angle) on generated surface roughness, dimensional accuracy, productivity, and energy consumption are examined.
Figure 1 shows the test structure (H × W × D 10 mm × 46 mm × 46 mm). It was designed to allow assessment of dimensional accuracies of 5, 10, and 20 mm long features in the X and Y directions, a 10 mm long feature in the Z direction, and surface roughness at surface inclination angles of 0°, 45°, 60°, 75°, and 90°. Note that the effect of the surface inclination angle will be analyzed only in relation to surface roughness, since it has no reasonable influence on the other three responses.
To convert the 3D model of the test structure shown in
Figure 2 into printable files, the slicing software Simplify3D was used, and subsequently, the test samples were printed using the Zmorph 2.0 SX,
Figure 3, under the different printing conditions.
Table 1 lists the printing parameters maintained constant for the experimental trials.
It was decided to use a Taguchi orthogonal array (OA), rather than a central composite design, since in this investigation, all levels are equally important and only values commonly found in FFF printing are used. Moreover, it was expected that the values of the outer levels have a higher influence on the output parameters, and therefore, a more detailed investigation of those is necessary. Next, it was decided which OA to use. Taguchi (OA) designs offer the possibility of investigating five factors at five levels, starting with the Taguchi (OA) L25 (5^6), continuing with the Taguchi (OA) L50 (2^1 × 5^11) and the Taguchi L125 (5^31). The L25 was not detailed enough, whereas the L125 was too extensive. Therefore, the L50 was selected because it was sufficiently detailed while relatively time saving. The L50 is a mixed orthogonal array (2^1 × 5^11), meaning one factor, in comparison to the others, is varied on only two levels instead of five. It was decided to set the infill percentage as the factor with only two levels due to its anticipated linearity, and its predominant influence was expected to be on build time and material consumption. The detailed allocation of levels and normalized values can be found in
Table 2.
Under each set of printing conditions, three samples were printed to be able to determine an average of the characterized process responses considering the overall need to examine process repeatability and availability of resources. To measure the magnitudes of the process responses, different measuring devices were employed. To evaluate the dimensional accuracy of the structures, each structure was measured with a digital caliper and the percentage error was calculated. For the surface roughness, Ra, the stylus-type profilometer MarSurf GD 26 was used (see
Figure 4). A sample length of 4 mm was traversed by the stylus. For each run, the roughness at the concerning inclination angle was measured at three samples and the average was calculated.
To measure the energy consumption (in kWh) a Voltcraft Energy Check 3000 was used, see
Figure 5a. The device was simply plugged into the electrical outlet and the printer into the device, and current flow was measured. To calculate the productivity, all samples were weighed using the analytical balance Sartorius Extend ED224S (see
Figure 5b). Next, the averaged mass of the samples was divided by the build time to achieve the productivity (g/min) (see Equation (7)).
3. Results and Discussion
To process the collected data and better understand the effects of the factors and their interactions on the process responses, statistical models were created using MATLAB (R2018b, MathWorks). In particular, the measured data was utilized to generate quadratic regression models by fitting the second-order polynomial as shown in Equation (2).
where “
y” is the output variable (percentage error for dimensional accuracy, surface roughness, energy consumption, and productivity), “
b0,
” “
bi,” “
bii,
” and “
bjj” are the regression coefficients or predictors, and “
xi” is the value of the
ith factor (infill percentage, layer thickness, printing speed, printing temperature, and surface inclination angle).
Predicted responses were plotted to show effects of process parameters and their interactions on process responses. In
Figure 6, Figures 8, 11, 13, and 15, the predictions, the green lines on the plots, were based on quadratic regression models, and show the effects of each process parameter on the response value, when keeping the other parameters constant. The dotted red lines show the 95% confidence bounds. These interactive prediction plots allow optimization of the process parameters.
Figure 7, Figures 9, 12, 14, and 16 show the effect of interaction (quadratic model) of process parameters on each process responses individually. Analysis of variance (ANOVA) was conducted to identify the most significant terms affecting the response values. These were located through the
p-value in the ANOVA. A term is regarded as significant if the
p-value is below 0.05 and considered as highly significant if the
p-value is below 0.01.
3.1. Dimensional Accuracy
Three different values of structure length (5, 10, and 20 mm) were tested in the X and Y directions. The results in terms of the dimensional error% were very similar for all lengths in both the X and the Y direction, and that is why only one value (for 10 mm) in the X direction is presented and discussed.
The developed quadratic regression model for the percentage error of dimensional accuracy for 10 mm in the x-direction (termed:
in this paper for abbreviation) is shown in Equation (3). The model originally presents 21 terms for the 5 process parameters that were studied in this work. Nevertheless, in the following equations, all factors with coefficient less than 0.001 were ignored.
where “
x1” is the normalized value for infill percentage, “
x2” refers to the normalized value of layer thickness, “
x3” denotes the normalized value of printing speed, “
x4” is the normalized value for printing temperature, and “
x5” represents the normalized value for the surface inclination angle.
ANOVA was used to identify the three most significant parameters: first was printing speed (
p-value = 0.00023); second was layer thickness (
p-value = 0.00206), and third was printing temperature (
p-value = 0.0171). Looking at the plot, see
Figure 6, and respective regression model in Equation (3), it is evident that with either increasing layer thickness or printing speed, the error% rises quite sharply. It is assumed that thicker layers contribute to a greater inaccuracy as they tend to spread out more after extrusion. Such a possibility could be reduced by lowering the printing temperature, which could improve the accuracy, since a lower temperature will mean a higher value for the viscosity which would reduce the spread of the PLA and enhance the ability to maintain the desired dimensions of the printed structure. Printing temperature was found to have an effect on the obtainable dimensional accuracy error%, and this effect was attributed to change of viscosity of the melted material. Faster printing speeds increased inaccuracy, which could be attributed to lower accuracy during extrusion and placement of the filament, since it is tauter and has less time to connect to the previous layer. These observations go in hand with the results of ANOVA. Higher infill percentages foster inaccuracy, due to possible widening of the dense raster inside the build part. Surface inclination angle was found to have no significant effect on the obtainable dimensional accuracy of the printed part.
The predicted interaction effects, illustrated in
Figure 7, show thinner layers, and lower printing speeds lead to negative errors, which means the built part is smaller than the CAD design, these can be attributed to greater contraction of the part. In contrast, thicker layers and higher printing temperatures contribute to a greater positive error, possibly due to the filament spreading outwards. In addition, higher printing speeds and temperatures give greater positive error, as the material is more liquid and under greater tension and is, therefore, more stretched.
The results of this study agree with the findings of Galantucci et al. [
34] that printing speed is the most effective process parameter determining dimensional accuracy. Valerga et al. [
30] have affirmed the negative influence of high printing temperatures on dimensional accuracy. The results of Sood et al. [
35] agree only in part with this study, since they recommended greater layer thickness to reduce percentage deviation. This disagreement can be put down to the different materials used, PLA in this study and ABS in the study by Sood et al. ABS is subject to greater shrinkage than PLA [
3]. They also found that a larger air gap (corresponding to a lower infill percentage) decreases percentage change, which is in accordance to the findings of this study.
To obtain the optimal values for each response, the prediction plots generated by MATLAB are used. Hence, the vertical dashed lines in
Figure 6 and
Figure 8, Figures 11, 13 and 15 were moved along the trends to the corresponding parameter values in order to acquire the desired optimal response value, which should be either the minimum or maximum.
For optimization of dimensional accuracy (10 mm in X direction) three parameters were set to minimize the percentage error using a regression model created by MATLAB; layer thickness was set to 0.11 mm, printing speed to 40.7 mm/s, and printing temperature to 216 °C. The infill percentage and the surface inclination angle stayed at the medium values of 35% and 45°, respectively. These values were applied in an experimental test to validate the predictions. With these settings, the model predicted a percentage error of 0.02%, but the validation test print produced an even smaller value of 0.01%.
In comparison to the effects of the predictors on the dimensional accuracy in X and Y directions, the effects in the Z direction differ. Equation (7) presents the regression model for the percentage error of dimensional accuracy for 10 mm in the Z direction (termed
)
where “
x1” is the normalized value for infill percentage, “
x2” refers to the normalized value of layer thickness, “
x3” denotes the normalized value of printing speed, “
x4” is the normalized value for printing temperature, and “
x5” represents the normalized value for the surface inclination angle.
Figure 8 shows the effects regarding printing speed, printing temperature, and infill percentage. These were less extreme than for the X and Y directions. To achieve a lower value of percentage error, either low or high values of layer thickness should be used. The higher accuracy of thin layers (0.1 mm) can be put down to the fact that thinner layers do not accumulate errors as the thicker ones do. However, the higher accuracy of the thickest layer (0.3 mm) cannot be explained yet, but further investigations will be carried out. Hot printing temperature and slower printing speed give better accuracy because of the lower viscosity of the material and because the material is not under so great a tension, and therefore, bonds better with the previous layer and reduces inaccuracies in the Z direction. A slight, but recognizable, effect shows that higher percentages of infill reduce measured error since the denser the infill, the less sagging of the top layers.
Again, ANOVA was used to identify the three most significant parameters: first was the interaction of layer thickness and printing speed (
p-value = 0.00077), second, the interaction of infill percentage and surface inclination angle (
p-value = 0.00239), and third, the interaction of printing speed and printing temperature (
p-value = 0.00912). The importance of these parameter interactions is also shown in
Figure 9. The greatest error occurs with 0.2 mm layer thickness, independent of the printing speed or temperature, whereas the outcome, when employing 0.1 or 0.3 mm, depends on the printing speed and temperature. When printing at slow speeds, thick layers lead to a negative error, but when printing with speeds faster than 86 mm/s, thick layers lead to greater error than thinner layers due to the tension on the filament not allowing a good connection to the previous layer. Low temperatures combined with thick layers also indicate a negative error, as do thin layers and high temperatures. However, at high temperatures the outcome varies depending on the speed. When applying low speeds, the error is negative since the liquid filament spreads out, which is enhanced when printing with thin layers. In comparison, at high speeds, the error is higher than 0.5%, which can be explained by the tension on the filament and inadequate bonding with the previous layer, which leads to a stacking of badly connected layers (see
Figure 10).
The effect of layer thickness and the resulting shrinkage problem, especially in the Z direction, was also found by Galantucci et al. [
34]. Sood et al. [
35] improved the dimensional accuracy in the Z direction by applying thin layers, which is in accordance with the findings of this study.
To optimize the dimensional accuracy in the Z direction, a dense infill should be applied together with a high printing temperature. Thin layers and high printing speeds reduce percentage error. Although thick layers can, apparently, also achieve good accuracy, a layer thickness of 0.11 mm was chosen, since thin layers are still more accurate. The infill was set at 47%, printing speed at 95.8 mm/s, and printing temperature at 226 °C, which should produce a percentage error of 0.06%. However, when experimentally applied in a validation test, these values, produced a percentage error of 0.2%.
3.2. Surface Roughness
When looking at the regression prediction model for surface roughness (
Ra) across the X–Y plane traversed in the X direction (see Equation (5) and
Figure 11), it was noticeable that the surface inclination angle had the most significant influence on the obtainable roughness, followed by layer thickness, which is supported by the results obtained using ANOVA, which identified the three most significant parameters, such as first, surface inclination angle (
p-value = 0.0031), second, layer thickness (
p-value = 0.0051), and third, printing speed (
p-value = 0.4316).
where “
x1” is the normalized value for infill percentage, “
x2” refers to the normalized value of layer thickness, “
x3” denotes the normalized value of printing speed, “
x4” is the normalized value for printing temperature, and “
x5” represents the normalized value for the surface inclination angle.
Although printing speed came third in this list, it is much less significant for generating surface roughness than surface inclination and layer thickness. This can be explained by the staircase effect. When printing with thicker layers, the staircase becomes more distinct, since there are fewer, but higher steps. If the surface inclination angle is close to 90°, the staircase changes to the layer profile. Because of that the surface roughness decreases but does not disappear. A higher printing speed and printing temperature slightly increase roughness, while the infill percentage has no influence. Note that surface roughness in the Y direction was found to have same trends to that obtained in the X direction.
Figure 12 illustrates some interaction effects. Again, the staircase effect can be observed, when looking at the interaction of surface inclination angle and layer thickness. With rising angle and layer thickness, the surface roughness increases. In addition, the gap between the graphs shows that thick layers combined with angles between 45° and 90° enhance the staircase effect and hence, the roughness. In addition, the printing temperature, printing speed, and layer thickness appear to affect surface roughness. Thin layers and slow speeds paired with a high temperature decreases the roughness, since the filament is less viscous, not under tension, and is able to spread out and connect with previous layers. The opposite is observed at low temperatures, thin layers, and slow speeds, because the filament creates blobs due to its high viscosity, the slow speed does not stretch the filament, and thin layers cool rapidly.
The investigations of Peng et al. [
27], Pérez et al. [
28], Yang et al. [
32], and Huang et al. [
33] confirm the results of this study that layer thickness greatly influences the surface quality. Raju et al. [
29] also ascribe this result to the staircase effect. Moreover, both Raju et al. [
29] and Huang et al. [
33] support the observation that the part/build orientation, which is comparable to the surface inclination angle, is having a significant impact on surface roughness. Agreement is also found concerning the impact of printing speed, which was low in the investigation of Pérez et al. [
28] agreeing with the ANOVA result obtained in this study. Yang et al. [
32] and Pérez et al. [
28] confirmed the low impact of printing temperature, if it is considered independently from the other parameters. Valerga et al. [
30] validated only the negative influence of high printing temperature, but the interaction between temperature and layer thickness was not examined. However, this investigation has shown that high temperature, when combined with thin layers, decreases the surface roughness, but the influence of printing temperature on surface roughness in general is only marginal.
When optimizing surface roughness, it would be obvious to set the surface inclination angle to 0°, thus horizontal, since the roughness is least there. Nevertheless, it is also interesting to determine how the staircase effect can be minimized through the optimization of other parameters. Therefore, a surface inclination angle close to 0° (7.3°) was chosen for both surfaces in X and Y directions. For optimization of surface roughness, an infill percentage of 50%, a layer thickness of 0.1 mm, a printing speed of 92 mm/s, and a printing temperature of 220 °C were chosen, with a predicted roughness value of 0.094 µm. After conducting a validation test print with these settings, a roughness of 7.5 µm was measured. However, it is quite clear that values as low as the predicted ones are not yet achievable with the FFF process. This is due to limitations in the printing technique and printer equipment (used nozzle diameter was 0.2 mm). Moreover, it is obvious that the regression model developed to predict surface roughness is not yet precise enough to consider this physical boundary and needs refinement. Nevertheless, the roughness achieved was an improvement compared to the levels obtained before optimization.
3.3. Energy Consumption
Equation (6) presents the quadratic regression model for the predicted energy consumption.
where ”
x1” is the normalized value for infill percentage, “
x2” refers to the normalized value of layer thickness, “
x3” denotes the normalized value of printing speed, “
x4” is the normalized value for printing temperature, and “
x5” represents the normalized value for the surface inclination angle.
Figure 13 shows the influence of the five factors on energy consumption. The longer the duration of the printing process, the greater the amount of energy consumed, which is also a function of infill percentage, the printing speed, and the layer thickness. This finding is supported by ANOVA were the three most important terms were found to be: first, printing speed (
p-value = 2.81 × 10
−12), second, layer thickness (
p-value = 5.98 × 10
−8), and third, interaction of layer thickness and printing temperature (
p-value = 7.45 × 10
−5). As expected, the energy consumed is linearly related to infill percentage. With increase in printing temperature, the energy consumed rises until the temperature reaches 210 °C and then remains constant until 230 °C. However, the difference is only marginal and therefore not significant. It is also interesting to note that the energy consumed generally decreased with increased printing speed, however, the curve is not linear and has its minimum at roughly 86 mm/s. This suggests that at printing speeds higher than 86 mm/s, energy saved due to saved production time is exceeded by the energy expended on the printing head motors.
The interaction effects related to energy consumption are shown in
Figure 14. Looking at the interaction of printing speed and layer thickness, it is not difficult to see that lower printing speeds and thinner layers result in higher energy consumption. A 0.1 mm layer thickness results in a big gap between the plotted lines, but the separation gets smaller, the thicker the layers. An inverse trend can be observed with the printing temperature, i.e., the influence of printing temperature is only recognizable at low speed or thin layers, meaning it is only visible in interaction with other parameters as indicated by ANOVA.
In this study, layer thickness was the second most important parameter after printing speed, but Griffiths et al. [
26] found that layer thickness had the greatest effect on energy consumption because they did not investigate the latter. They also examined the infill percentage and found no effect worth mentioning, but a trend was observed which was similar to the one seen in our study. Griffiths et al. [
26] agreed with the statement that energy consumption depends very much on the build time, and this has also been confirmed by studies of Yang et al. [
32] and Peng et al. [
27]. The latter also found a correlation between increasing printing speed, layer thickness, and reduction of build time regarding the energy consumption, which fits with the importance of those two parameters found in our study.
Because the energy consumption is determined mainly by build time, it was important to reduce this to a minimum when optimizing the parameters. Thus, layer thickness was set to 0.3 mm, printing speed to 74 mm/s, and infill percentage to 20%. As mentioned earlier, printing temperature also affects the energy consumption and this was set to 190 °C. With these settings, a validation test was carried out with a predicted energy consumption of 0.0397 kWh, while the test print consumed 0.079 kWh. The difference between obtained and predicted value cannot be explained and hence, further investigations are necessary.
3.4. Productivity
Looking at the prediction plot and regression model for productivity,
Figure 15 and Equation (7), the importance of layer thickness and printing speed is clearly visible, which matches with the results for the energy consumption, and suggests a strong dependency on build time. The importance of these two parameters and their interaction is verified by ANOVA, where the three most important terms were found to be: first, layer thickness (
p-value = 1.10 × 10
−24), second, printing speed (
p-value = 8.52 × 10
−24), and third, interaction of layer thickness and printing speed (
p-value = 8.88 × 10
−9). This is enhanced by the aspect that greater layer thickness and faster printing speed both increase material consumption per unit time.
where “
x1"” is the normalized value for infill percentage, “
x2” refers to the normalized value of layer thickness, “
x3” denotes the normalized value of printing speed, “
x4” is the normalized value for printing temperature, and “
x5” represents the normalized value for the surface inclination angle.
Higher infill percentage requires greater material consumption, also a longer build time, so infill percentage was, as expected, linearly related to productivity, but was not an important factor as layer thickness and printing speed. In addition, noticeable is the slight decrease in productivity when increasing the printing temperature, whereas it might be expected that higher printing temperature produces a more liquid filament, which should facilitate the flow and thus enhance productivity.
Figure 16 shows the interaction of parameters regarding productivity. The interaction plots of layer thickness and printing speed both show clearly that the effect of one parameter is reinforced by a high value of the other, which can be seen in the growing gap between plots and the low
p-value in ANOVA. Similar to the interactions regarding energy consumption, we once again note that the influence of printing temperature is only visible at low speeds and layer thicknesses, and appears as a separation between the plots, e.g., see at 0.1 mm layer thickness and 20 mm/s printing speed.
By Equation (1), it can be said that productivity can mainly be increased by reducing the build time independently from the model mass, although a higher mass can enhance this effect. Hence, the analysis of production time in both Yang et al. [
32] and Peng et al. [
27] can be used for comparison. Their results agree with those obtained in this study, confirming the high impact of printing speed and layer thickness on build time and therefore, productivity. Furthermore, Srivastava et al. [
31] investigated the model material volume, which is proportional to the mass. It was found that the model volume rises with a higher contour width, thus a more solid part. This goes in hand with this study’s finding that a higher infill percentage, hence a denser part, enhances productivity.
Since productivity is the only response that should be maximized, it was possible to use the outer boundary values for each parameter: 50% infill, 0.3 mm layer thickness, 100 mm/s printing speed, and a printing temperature of 230 °C. According to the prediction plot, the temperature should be set as low as possible to increase productivity, but because of the interaction of printing speed and printing temperature, a high temperature is advisable when using a printing speed of 100 mm/s. A productivity of 0.473 g/min was predicted and 0.515 g/min was actually reached in the validation test print. It should be noted that these parameters gave the highest productivity achieved for all prints.
4. Conclusions
The aim of this work is to provide a detailed insight into the relative effects of FFF printing parameters: infill percentage, layer thickness, printing speed, printing temperature, and surface inclination angle on build part quality (dimensional accuracy and surface roughness) and resource usage, namely, energy consumption and productivity, by modeling and optimization. To achieve this aim, a literature review was carried out and a suitable experiment-based model to assess and optimize the parameters was developed. Different sets of parameters were modeled, measurements were conducted, and the results were analyzed and compared to experimental tests.
Considering all the parameters, dimensional accuracy is mainly influenced by layer thickness and printing speed, whereas the surface roughness depends on surface inclination angle and on layer thickness. Energy consumption and productivity are primarily affected by printing speed and layer thickness. Although interactions between printing parameters can be beneficial for the required outcome, they can also hamper the process. Generally, it is apparent that layer thickness and printing speed dominate the other parameters in their importance and usually define the outcome of the printing process. However, on the other hand, there will be a trade-off between layer thickness and printing speed to ensure part quality and resource usage, which must be resolved in order to obtain high-quality and resource-efficient built parts.
Further investigations might include a follow-up on this work by a more detailed investigation of the effects of layer thickness regarding the dimensional accuracy in the Z direction as well as the influence of the printing temperature on productivity. Moreover, the accuracy of the regression model for surface roughness needs to be enhanced to achieve more reliable predictions.
All in all, it is evident that there is a need for further investigations on build part quality in connection with resource usage. Further, printing parameters and output variables need to be analyzed and optimized, in order to establish the FFF process as a reliable, sustainable, and competitive manufacturing alternative. Further interesting possible responses could be production costs, amount of waste, and mechanical properties of the built parts.


