Article

Voice Conversion Using a Perceptual Criterion

Department of Electronic Engineering, Konkuk University, 1 Hwayang-dong, Gwangjin-gu, Seoul 143-701, Korea
Appl. Sci. 2020, 10(8), 2884; https://doi.org/10.3390/app10082884
Submission received: 17 March 2020 / Revised: 17 April 2020 / Accepted: 17 April 2020 / Published: 22 April 2020
(This article belongs to the Special Issue Intelligent Speech and Acoustic Signal Processing)

Abstract

:
In voice conversion (VC), it is highly desirable to obtain transformed speech signals that are perceptually close to a target speaker’s voice. To this end, a perceptually meaningful criterion where the human auditory system was taken into consideration in measuring the distances between the converted and the target voices was adopted in the proposed VC scheme. The conversion rules for the features associated with the spectral envelope and the pitch modification factor were jointly constructed so that perceptual distance measurement was minimized. This minimization problem was solved using a deep neural network (DNN) framework where input features and target features were derived from source speech signals and time-aligned version of target speech signals, respectively. The validation tests were carried out for the CMU ARCTIC database to evaluate the effectiveness of the proposed method, especially in terms of perceptual quality. The experimental results showed that the proposed method yielded perceptually preferred results compared with independent conversion using conventional mean-square error (MSE) criterion. The maximum improvement in perceptual evaluation of speech quality (PESQ) was 0.312, compared with the conventional VC method.

1. Introduction

Voice conversion (VC) is a method of changing the features derived from speech signals, so that one voice is made to sound like another. If the features of one speaker (reference speaker) are modified so that the features are close to those of another specific speaker (target speaker), the resultant speech signals sound as if it was spoken by target speaker. This technique is referred to as voice personality transformation [1]. Voice personality transformation has numerous applications in a variety of areas such as personification of text-to-speech synthesis systems [2,3], speaker adaptation for automatic speech recognition [4], reducing the artifacts of abnormal speech [5], and foreign language training systems [6].
VC is closely related with speaker recognition/identification tasks [7] and practically achieved by using converted speech parameters to synthesize speech. The feature parameters adopted in VC reflect the speaker-related characteristics. Typical feature parameters that satisfy such properties include Mel-frequency cepstral coefficients (MFCCs) [8,9], linear prediction coefficients (LPCs) [10,11,12,13] and line spectrum pair (LSP) coefficients [14,15,16]. Pitch period and the spectrum of LP-residual (spectral fine structure) have also been adopted for VC [17]. These have important roles in modifying source characteristics of the given voices [18].
The ultimate goal of VC is to convert input reference speech sounds so that it perceptually approximates the target speaker’s voice. Since MFCCs are computed based on human auditory systems [19], perceptual aspects have been considered to some extent in the VC techniques that have been designed to minimize the differences in MFCCs. In most VC schemes, however, the differences perceived by the human ear were not sufficiently addressed in constructing the conversion rules. For example, the conversion rules for the spectral envelope of most conventional VC methods either minimize the mean squared errors between the converted and target MFCCs [20,21] or they minimize the squared errors between the warped version of the reference spectra and the target spectra [22,23]. The statistical properties (e.g., the mean and standard deviation) of the converted pitch periods are the major concerns in prosody conversion [2,24]. This indicates that the perceptual aspects have been given limited consideration in current VC techniques. Since converted speech will be listened to by a human, it is highly desirable to adopt human auditory-based distance as an objective function to be minimized. Such a distance measure has already been used for various forms of speech processing procedures, such as speech enhancement [25], speech recognition [26], speech coding [27], speech synthesis [28,29] and speech quality evaluation [30]. This distance measure has not yet been adapted as an objective metric in VC.
In the proposed VC method, the conversion rules for both the spectral envelope and the pitch were designed so that the perceptual differences between the converted spectra and that of the target speech is minimized. The perceptual evaluation of speech quality (PESQ) [30], which has been widely used in speech quality evaluation was adopted to compute the perceptual differences. The PESQ is one of the best known objective metrics for speech coding [30] and speech enhancement [25]. We extended the utility of the PESQ to construct VC mapping rules and evaluate the quality of the converted speech. The two conversion functions, one for the spectral envelope and the other for the spectral fine structure, were cascade connected and incrementally trained to reduce the unique objective function. This differs from the conventional VC approaches wherein the conversion rules for each feature parameter are independently constructed by minimizing the separate distance measurements. One of the advantages gained by the construction of cascaded conversion rules is that one step can compensate for the conversion errors in another, thereby further reducing the overall conversion error. The conversion function was implemented by using the deep neural networks (DNN) [31], which were widely employed in the VC methods [32,33,34,35,36,37]. The objective function of the DNN is different from the previous DNN-based methods where the log-likelihood [32] or the joint probability function [33] was adopted. The WaveNet vocoder [38], which was originally developed for text-to-speech (TTS) was fine-tuned to improve the quality of the converted speech signals [34,36]. The perceptual aspects, however, were not addressed in construction of the conversion rules.
In addition to conventional forms of objective (such as mel-ceptral distance) and subjective (such as MOS test) evaluation, PESQs were calculated by comparing the converted speech with time-aligned target speech to verify the effectiveness of the proposed method. The remainder of this paper is organized as follows. First, Section 2 introduces the overall structure of the proposed VC method, and procedure of construction of the conversion rules. Then, the adopted distance measurement is explained in Section 3. Estimation of the conversion parameters is described in Section 4. Experimental results are shown in Section 5. Finally, conclusions are drawn in Section 6.

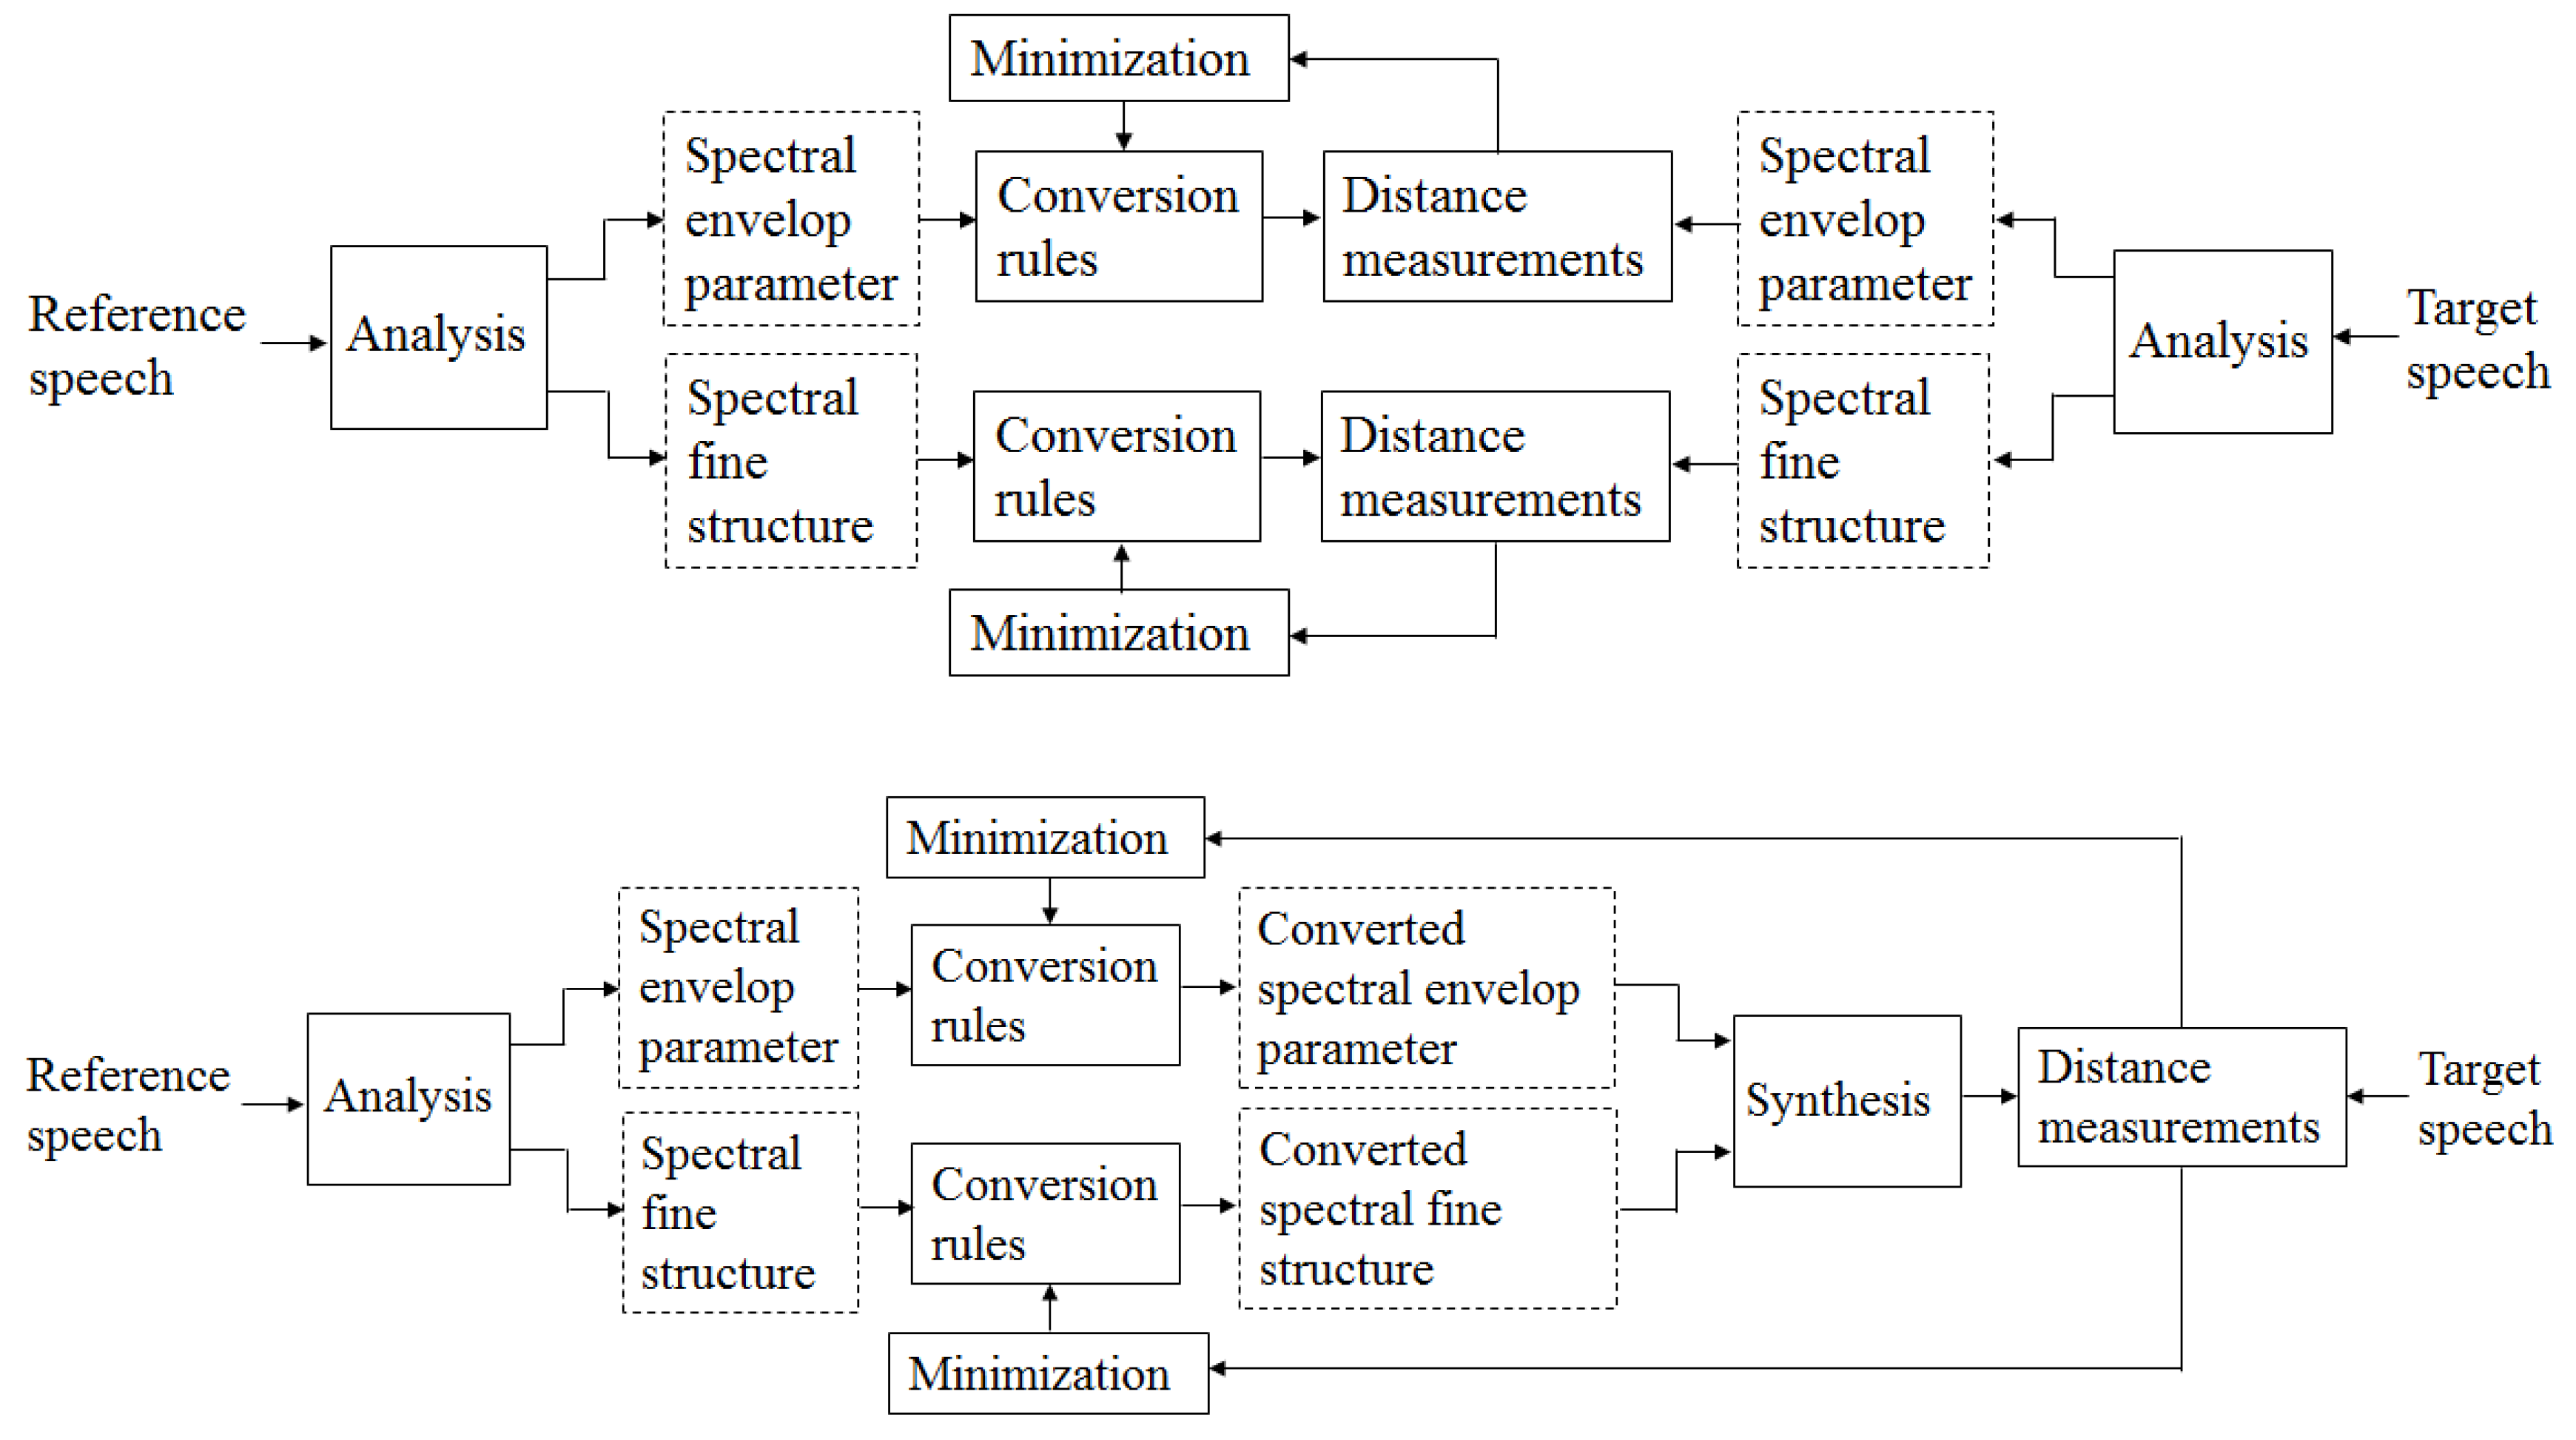
2. The Structure of the Proposed VC Method

The overall procedure proposed for the VC method appears in Figure 1 wherein a typical conventional VC scheme is also presented for comparison. The first step of VC is analysis that extracts a set of speech feature parameters of both the reference and target speakers. The spectral envelop parameter and spectral fine structure were used as feature parameters, which were associated with the vocal tract transfer function and prosody information, respectively. The linear prediction coefficient cepstrum (LPCC) was chosen to represent the spectral envelope and the spectral fine structure was represented with the pitch period. In practice, even if the reference/target speakers utter the same words, it is unlikely that a synchronized set of feature sequences would be produced. Dynamic Time Warping (DTW) [39] was first applied in a preprocessing step in order to time-align these sequences. Time-alignment using DTW produced frame-level synchronized sequences, but waveform-level synchronization between the neighboring frames, is not guaranteed. This could potentially result in occurrence of undesired pitch-pulse misalignment. To cope with this problem, a synchronized overlap and add (SOLA) method [40] was applied to the frame-level time-aligned target speech. A pairing of reference speech and time-aligned (both in frame-level and waveform-level) target speech was used to construct the conversion rules and for evaluation. An example of the final time-aligned target speech that is subsequently used for construction of the conversion rules and evaluation is shown in Figure 2. This shows that the onset/termination times of the time-aligned target speech are relatively consistent with those of reference speech.
When F H and F E denote the conversion functions for the LPCC and the spectral fine structure, respectively, then the optimal conversion rules for conventional VC methods, F H * , F E * are given by
F H * = arg min F H D H ( H t , H ^ t )
F E * = arg min F E D E ( E t , E ^ t )
where H ^ t = F H ( H r ) , E ^ t = F E ( E r ) . H r = { h r , n } n = 1 N and H t = { h t , n } n = 1 N are the sets of the reference and time-aligned target LPCCs, respectively, and N is the total number of the parameters for constructing the conversion rules. In a similar manner, E r = { e r , n } n = 1 N and E t = { e t , n } n = 1 N are the sets of the spectral fine structures for reference and target speakers, respectively. D H and D E are the objective functions for the LPCC and the spectral fine structures, respectively. The mean squared error (MSE) was mostly adopted as the objective function in previous VC methods. Equation (1) indicates that the conversion rules for two parameters are independently obtained by minimizing each objective function, as shown in the top of Figure 1.
In the proposed method, construction of the two conversion rules was achieved by minimizing the unique distance measurement,
F H * ,   F E * = arg min F H ,   F E D PD ( H t , H ^ t , E t , E ^ t )
where D PD is the perceptual distance measure that is explained in the next section. As illustrated in Figure 1, the distance measurement is computed using the synthesized speech signals and the target speech signals. That is a major difference from conventional VC schemes, in which the distance measurements are independently computed using the corresponding feature parameters. Independent minimization of each feature parameter leads to producing the converted speech which is close to the target speech. However, since the synthesized speech signals are directly heard, it is more desirable to minimize the differences between the target speech and the synthesized ( converted) speech.
It is not possible to simultaneously obtain F H * and F E * . Hence, incremental estimation was adopted in this study. Beginning with the initial rules F H ( 0 ) , F E ( 0 ) the conversion functions for each parameter are updated at the i-th iteration as follows:
Re estimation   stage   for   F H : F H ( i ) = arg min F H D PD ( H t , F H ( H r ) , E t , F E ( i 1 ) ( E r ) ) Re estimation   stage   for   F E : F E ( i ) = arg min F E D PD ( H t , F H ( i ) ( H r ) , E t , F E ( E r ) )
The detailed explanation of minimization (4) is given in the next section. The minimization process is repeated until a convergence threshold is reached. Assuming that each re-estimation stage yields the conversion functions that minimize the perceptual distance, the algorithm ensures a non-increasing sequence of the perceptual distances such as
D PD ( 0 ) D PD ( 1 ) D PD ( i ) D PD ( i + 1 )
where D PD ( i ) = D PD ( H t , F H ( i ) ( H r ) , E t , F E ( i ) ( E r ) ) . This can be easily proved as follows. First, since the minimum criterion is adopted in the re-estimation stage for H, the D PD is at least as small as that for the previous re-estimation stage for E. Therefore, the following inequality holds for every i
D PD ( H t , F H ( i 1 ) ( H r ) , E t , F E ( i 1 ) ( E r ) ) D PD ( H t , F H ( i ) ( H r ) , E t , F E ( i 1 ) ( E r ) )
Next, the re-estimated F E by (4) yields the minimum D PD . Thus, the following inequality also holds for every i:
D PD ( H t , F H ( i ) ( H r ) , E t , F E ( i 1 ) ( E r ) ) D PD ( H t , F H ( i ) ( H r ) , E t , F E ( i ) ( E r ) )
From (6) and (7), it can be easily proved that this inequality D PD ( i 1 ) D PD ( i ) holds for every i.

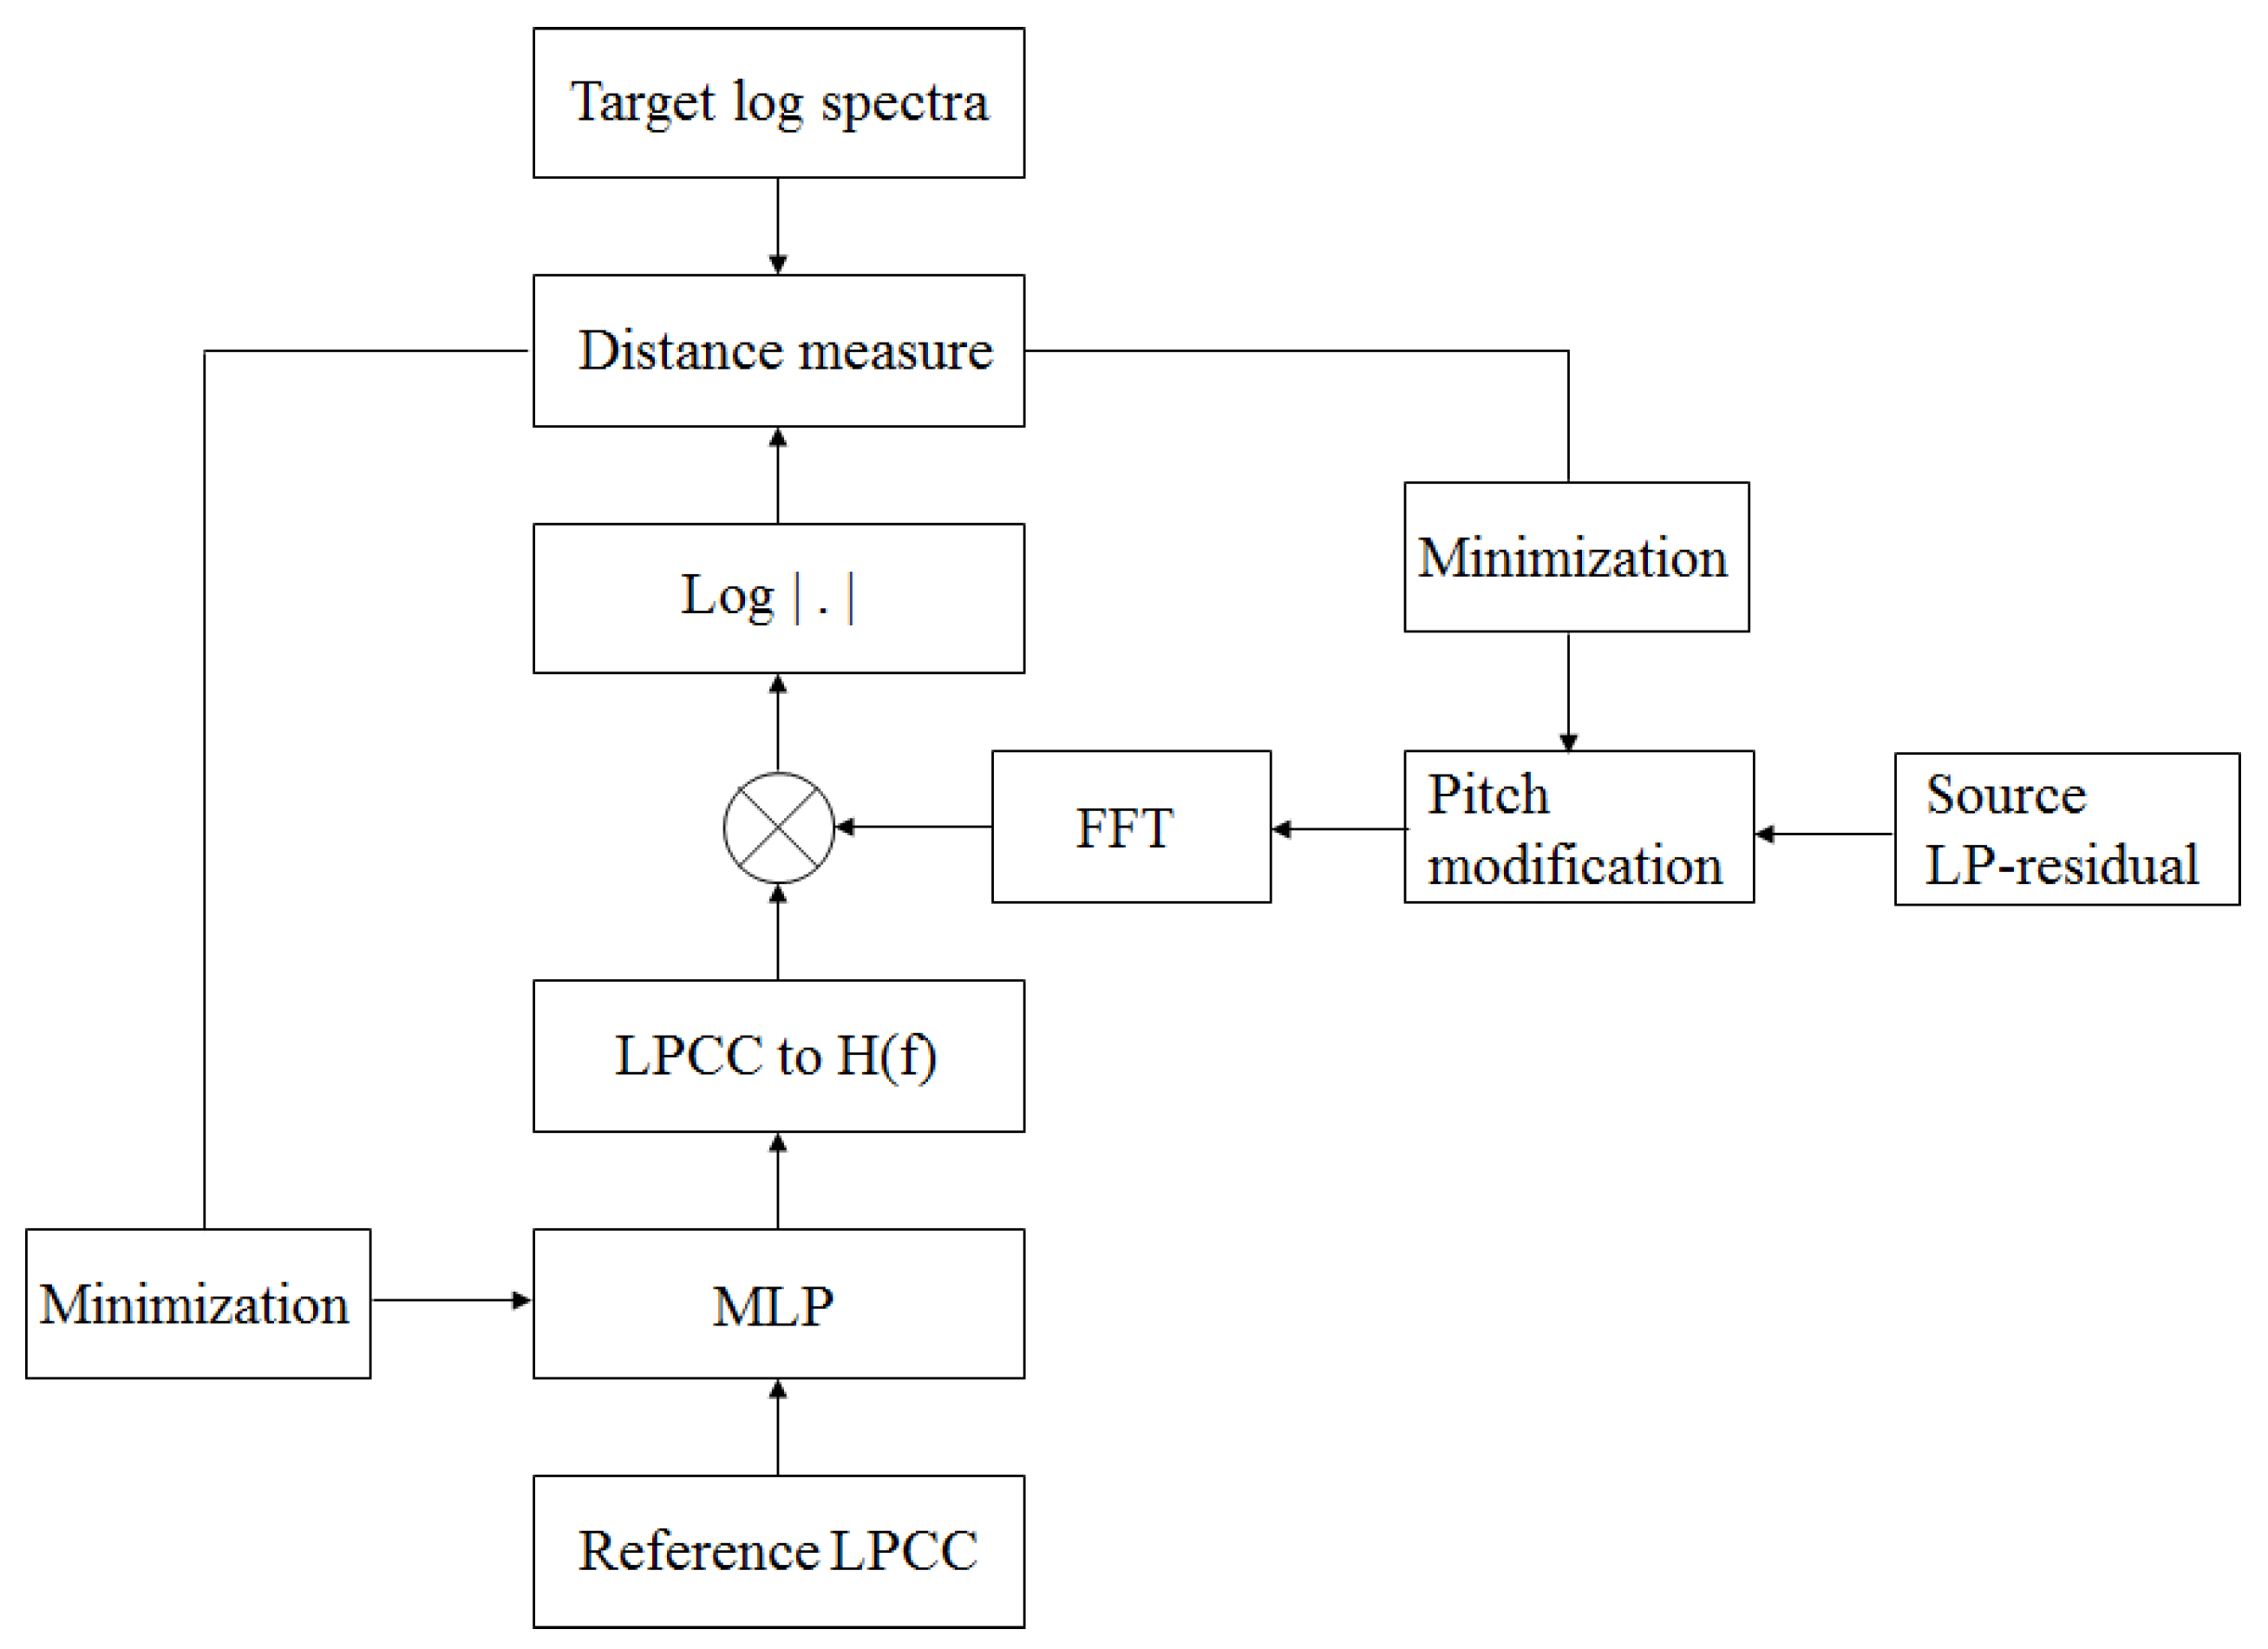
3. Perceptual Distance

Although the MSE has previously been shown to be a reasonably successful choice both for modifying speaker individuality and obtaining transformed voice with high quality, it was not guaranteed that the MSE necessarily reflected the perceptual differences. The objective of this study is to incorporate a distance metric that sufficiently reflects the perceptual differences into the conversion rules. Our assumption is that the usage of a perceptually relevant distance metric ensures that the resulting converted speech sounds perceptually closer to target speech, and it is hoped, would outperform the conventional MSE-based methods. There are several ways to implement a perceptually relevant distance metric. The properties of the human auditory system was mostly exploited in this kind of distance metric. Hence, frequency-selective emphasis, non-uniform frequency sampling, and loudness transformation were adopted to measure the perceptual distance. In the present study, the structure of the distance metric used in the PESQ, which quantitatively measured the degree of perceptual degradation, was employed to measure the distances between the converted and target speech signals. Accordingly, the traditional MSE-based objective function was modified by incorporating both a symmetrical disturbance, D ( s ) , and an asymmetrical disturbance, D ( a ) [25]
D PD = 1 N n MSE n + α D n ( s ) + β D n ( a )
where MSE n is the MSE of the n-th spectrum
M S E n = 1 M m = 0 M 1 1 σ m 2 log | X t , n ( m ) | 2 | X ^ t , n ( m ) | 2 2
where | X t , n ( m ) | 2 and | X ^ t , n ( m ) | 2 are, respectively, the target and converted power spectra obtained by multiplying the spectral envelope derived from the LPCC, h t , n ( m ) , and the spectral fine structure, e t , n ( m ) , while σ m is the standard deviation of | X t , n ( m ) | 2 . Indices n and m denote, respectively, frame and frequency, while M is the number of frequency bins. The number of frequency bins was chosen according to the frame length and the sampling frequency, that was 256. In (8), α and β are weighting factors for each disturbance. The symmetrical disturbance reflects the absolute difference between the converted and target loudness spectra when auditory masking effects are account for. When the symmetrical disturbance is applied to VC, it can be regarded as a distance function between the reference and target speakers measured in a domain that reflects human auditory system. There are two types of difference patterns in VC, one where the target value is greater than the reference value and vice-versa. Such difference patterns cannot be reflected on the distance metric such as MSE and the symmetrical disturbance. Whereas the signs of the loudness differences are considered in the asymmetrical disturbance. The negative differences (loss of target spectral component) and positive differences (residuals of reference spectral component) are differently perceived owing to masking effects. By using the asymmetrical disturbance, the differences between the two speakers can be described in more detail, which can lead to the improvement of the VC performance.
The calculation of symmetrical and asymmetrical disturbances reflects the human auditory system and is composed of several steps, briefly described as follows [25,30]:
(1)
Perceptual domain transformation: The target and converted loudness spectra s t , n = [ S t , n ( 0 ) , , S t , n ( Q 1 ) ] T and s ^ t , n = [ S ^ t , n ( 0 ) , , S ^ t , n ( Q 1 ) ] T , which are perceptually closer to the actual human listening are obtained as follows,
s t , n = T s [ H · x t , n ] ,   s ^ t , n = T s [ H · x ^ t , n ]
where Q is the number of Bark bands, H is a Bark transformation matrix that converts the power spectra x t , n = [ X t , n ( 0 ) , , X t , n ( M 1 ) ] , x ^ t , n = [ X ^ t , n ( 0 ) , , X ^ t , n ( M 1 ) ] into the Bark spectra b t , n = [ B t , n ( 0 ) , , B t , n ( Q 1 ) ] , b ^ t , n = [ B ^ t , n ( 0 ) , , B ^ t , n ( Q 1 ) ] , respectively. T s [ · ] is the mapping function that converts each band of the Bark spectrum to a sone loudness scale as follows,
S t , n ( q ) = s l P 0 ( q ) 0.5 γ · 0.5 + 0.5 B t , n ( q ) P 0 ( q ) γ 1
where s l is a loudness scaling factor, P 0 ( q ) is the absolute hearing threshold for the q-th Bark band and γ is set to 0.23 [25]
(2)
Disturbances computation: A relative small difference between the target and converted loudness spectra can be negligible [25,30,41]. Accordingly, a center-clipping operator over the absolute difference between the loudness spectra was applied to compute the symmetrical disturbance vector as follows,
d n ( s ) = max ( | s ^ t , n s t , n | m n , 0 )
where m n = 0.25 · min ( s ^ t , n , s t , n ) is a clipping factor and | · | , min ( · ) , and max ( · ) are applied element-wise, while 0 is a zero-filled vector of length Q. The asymmetrical disturbance vector is obtained as d n ( a ) = d n ( s ) r n , where ⊙ denotes an element-wise multiplication and r n is a vector of asymmetry ratios with components computed from the Bark spectra,
R n , q = B ^ t , n ( q ) + ϵ B t , n ( q ) + ϵ λ
For the speech enhancement task, the constants ϵ and λ were set to 50 and 1.2, respectively [25]. In this study, the experiments were carried out to optimally determine the two constants, ϵ and λ . The experimental results showed that the same values adopted in [25] also yielded the minimum D PD . The symmetrical and asymmetrical disturbance terms in (8) are given by the weighted sum of each disturbance vector,
D n ( s ) = | | w b | | 1 1 2 · | | w b d n ( s ) | | 2 D n ( a ) = | | w b d n ( a ) | | 1 = w b T · d n ( a )
where the components of the weight vector w b are proportional to the width of the Bard bands, as explained in [30].

4. Estimation of the Conversion Parameters

The overall procedure of constructing the conversion parameters is explained in Figure 3. Basically, the converted and target speech signals are represented in the frequency domain, since the perceptual distance is computed using the power spectra. The converted spectra were given by multiplying the spectral envelope derived from the LPCC and the pitch-scaled spectral fine structure. A supervised learning framework was adopted where DNN [31] are used to estimate the conversion rules for the LPCC, F H . The power spectra necessary for calculation of the perceptual distance is obtained by
x t , n = ( G · h t , n ) e t , n ,   x ^ t , n = ( G · h ^ t , n ) e ^ t , n
where G is the transformation matrix that transforms the LPCC vector into the power spectrum. The elements of the matrix G are given by
g i j = cos π i ( j + 1 ) M 1 ,   0 i M 1 ,   0 j N L
where N L is the order of the LPCC. The updated estimate of the DNN weights W with a learning rate λ W is computed iteratively as follows:
W n + 1 = W n λ W W D P D ( X t , X ^ t )
The conversion rule for the spectral fine structure, F E , was achieved by pitch modification wherein the time-domain pitch-synchronized overlap and addition (TD-PSOLA) [6] method was performed on the LP-residual of the reference speech. Note that pitch modification was adapted only to the voiced regions, and hence, the pitch locations of the unvoiced regions were not changed. Since TD-PSOLA was implemented in the time domain, the modified reference spectrum was obtained by discrete Fourier transform (DFT) of the pitch-scaled LP-residual signal. Estimation of the conversion rule F E is then formulated as finding the optimal pitch modification factor that minimizes the overall perceptual distortion with the given converted LPCCs, as shown in (4). Although there was no explicit relationship between D P D and the pitch modification factor, the convexity of the perceptual distance function over the pitch modification factor was clearly observed for all conversion pairs, as shown in Figure 4. Accordingly, the gradient descent algorithm was employed to find the pitch modification factor as follows:
φ n + 1 = φ n λ φ φ D P D ( X t , X ^ t )
where φ n is the pitch modification factor that is estimated at the n-th iteration. A learning rate λ φ was heuristically determined, that was 0.01. Note that the derivative term φ D P D cannot be computed mathematically. The mean value theorem was employed to approximate φ D P D as follows;
φ D P D ( X t , X ^ t ) D P D ( X t , X ^ t | φ n ) D P D ( X t , X ^ t | φ n 1 ) φ n φ n 1
where D P D ( X t , X ^ t | φ ) is the perceptual distance in case when the pitch modification factor is given by φ .

5. Experiments and Results

5.1. Experiment Setup

The evaluation was carried out using the CMU ARCTIC database [42] for US English and was sampled at 16 kHz. These databases were constructed as phonetically balanced, and originally designed for unit selection speech synthesis research. These databases consist of around 1150 utterances and includes US English male and female speakers as well as other accented speakers. Among them, two male speakers, bdl and rms, and two female speakers, clb and slt were used. Four different voice conversion tasks were investigated including male-to-male (rms → bdl), male-to-female (bdl → slt), female-to-female (slt → clb) and female-to-male (clb → rms) conversion. To obtain the conversion rules, 200 utterances were used, and the remaining 100 utterances were prepared for evaluation. The order of the LPCC was 20. The speech data were analyzed pitch-synchronously, at the manually labelled pitch marks. For voiced regions, the frame length was set to two or three pitch periods depending on the pitch modification factor [6], whereas the frame length was set to be constant (=25 msec) for unvoiced regions. A pre-emphasis factor 0.95 was applied.
Since it is impossible to mathematically determine the optimum number of hidden layers and optimum number of hidden nodes, we performed several experiments to investigate the relationship between the number of hidden layers and objective performance in terms of overall perceptual distances. No clear relationship between them was found. According to the experimental results, the best performance was achieved in case when the DNN had three hidden layers and the number of the nodes in the hidden layer was set to 100. To prevent the network from converging to poor local minima, a deep generative model of input features was adopted to initialize the network by a stacking of multiple restricted Boltzmann machines (RBMs) [43,44]. The number of RBM pre-training epoches in each layer was 20. The learning rate of the RBM training was set as 0.0005. A fixed learning rate of 0.001 was applied for the fine-tuning of the baseline. The total number of epoches at the fine-tuning stage was 50. For both RBM pre-training and fine-tuning, The momentum was set to 0.05 for the first five epochs, then maintained at 0.07 thereafter. Mean and variance normalization was applied to the input and target feature vectors of the DNN. The performance of the DNN was expected to be improved by dropout regularization [45]. Hence, dropout regularization with a keep probability of 0.8 was employed.
For comparison, the performance of the four conventional VC methods including the minimum mean square error (MMSE)-based joint Gaussian method (JGMM) [20], the maximum likelihood trajectory conversion method (JDGMM) [21], dynamic frequency warping with amplitude scaling (DFW) [22], and DNN-based conversion with independent pitch scaling (MLP-ind) were also evaluated. For all these methods, pitch modification with a fixed scale factor was employed to convert the spectral fine structures. For each conversion, the pitch modification factors were determined so that the statistical properties (mean and standard variation) of the converted pitch periods were matched with those of the target pitch periods [24]. Three measurements, Mel-cepstral distance (MCD), perceptual distance (8), and PESQ, were employed to evaluate the performance of each method objectively. Note that all three measurements are relevant to distortions perceived by the human auditory system. PD and PESQ, however, were newly adopted in this study. The listening tests were conducted to subjectively evaluate the validity of the proposed VC method. The ABX test and a preference test were performed wherein stimuli consisting of 10 sentences were presented to 20 subjects (15 males, 5 females, ages ranging from 21 to 51 years, mean: 34.3, standard deviation: 10.8). All subjects had normal hearing ability. Although they were native Korean, they had participated in many VC tests using English utterances. In the ABX test, the first and second stimuli, A and B, were either the reference speaker’s or the target speaker’s, while the last stimuli X was converted speech achieved using the underlying methods. The subjects were then asked to select either A or B as a candidate for X. The subjects were allowed to listen to each utterance as many times as they wished before making a judgment.
Along with the ABX test, a preference test was conducted in which the same subjects participated in the ABX test listened to two randomly selected converted utterances per method and conversion pair. The subjects were asked to choose the perceptually preferred stimuli. In this test, each pair of stimuli consisted of the two converted utterances, one from the proposed method and the other from the conventional methods. Since this test was designed to evaluate the overall quality rather than voice personality, the subjects were asked to pay more attention to the naturalness and intelligibility of the converted speech signals.

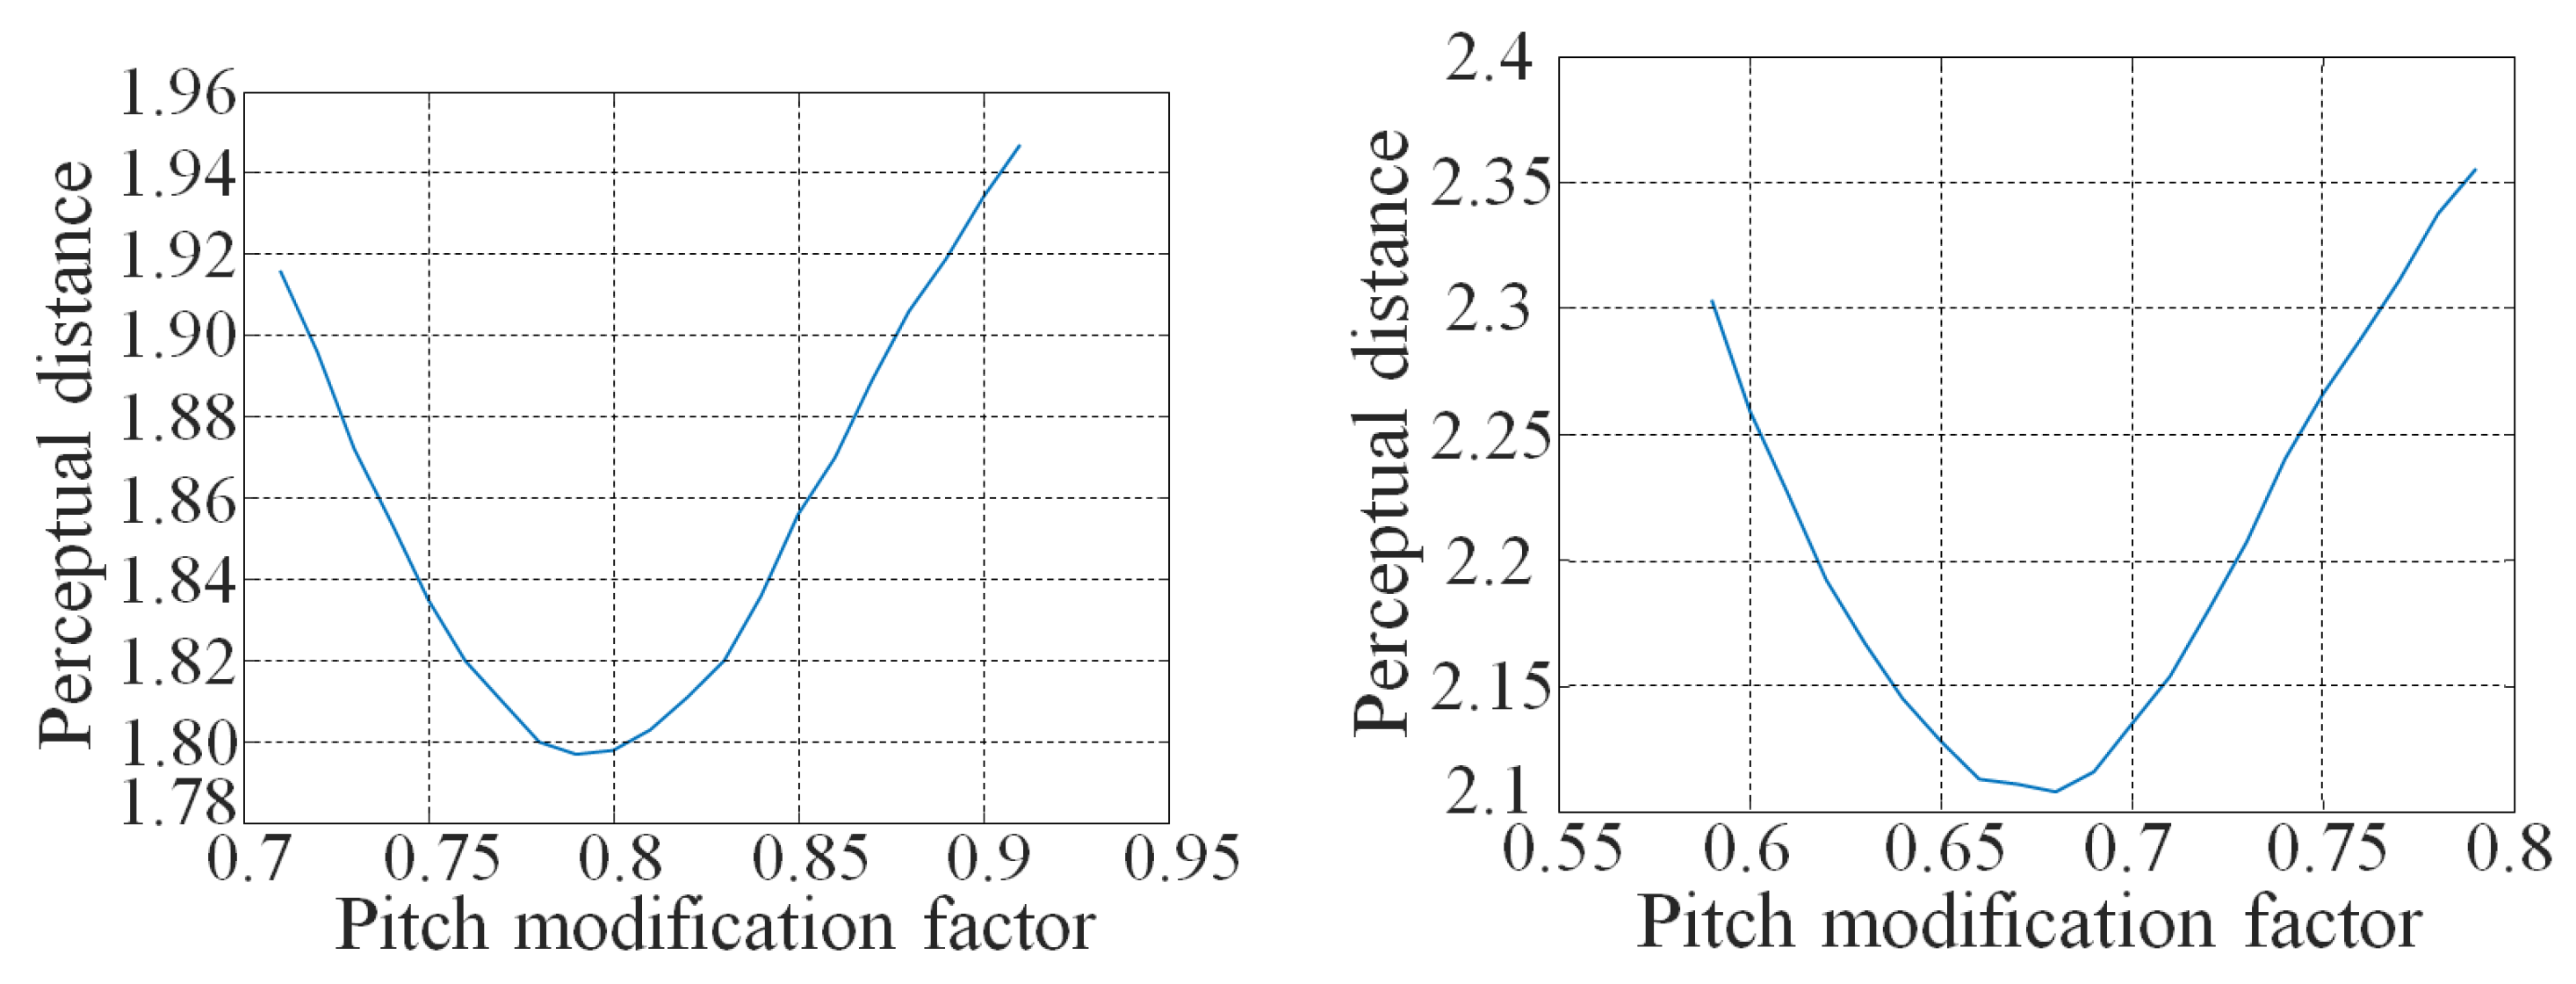
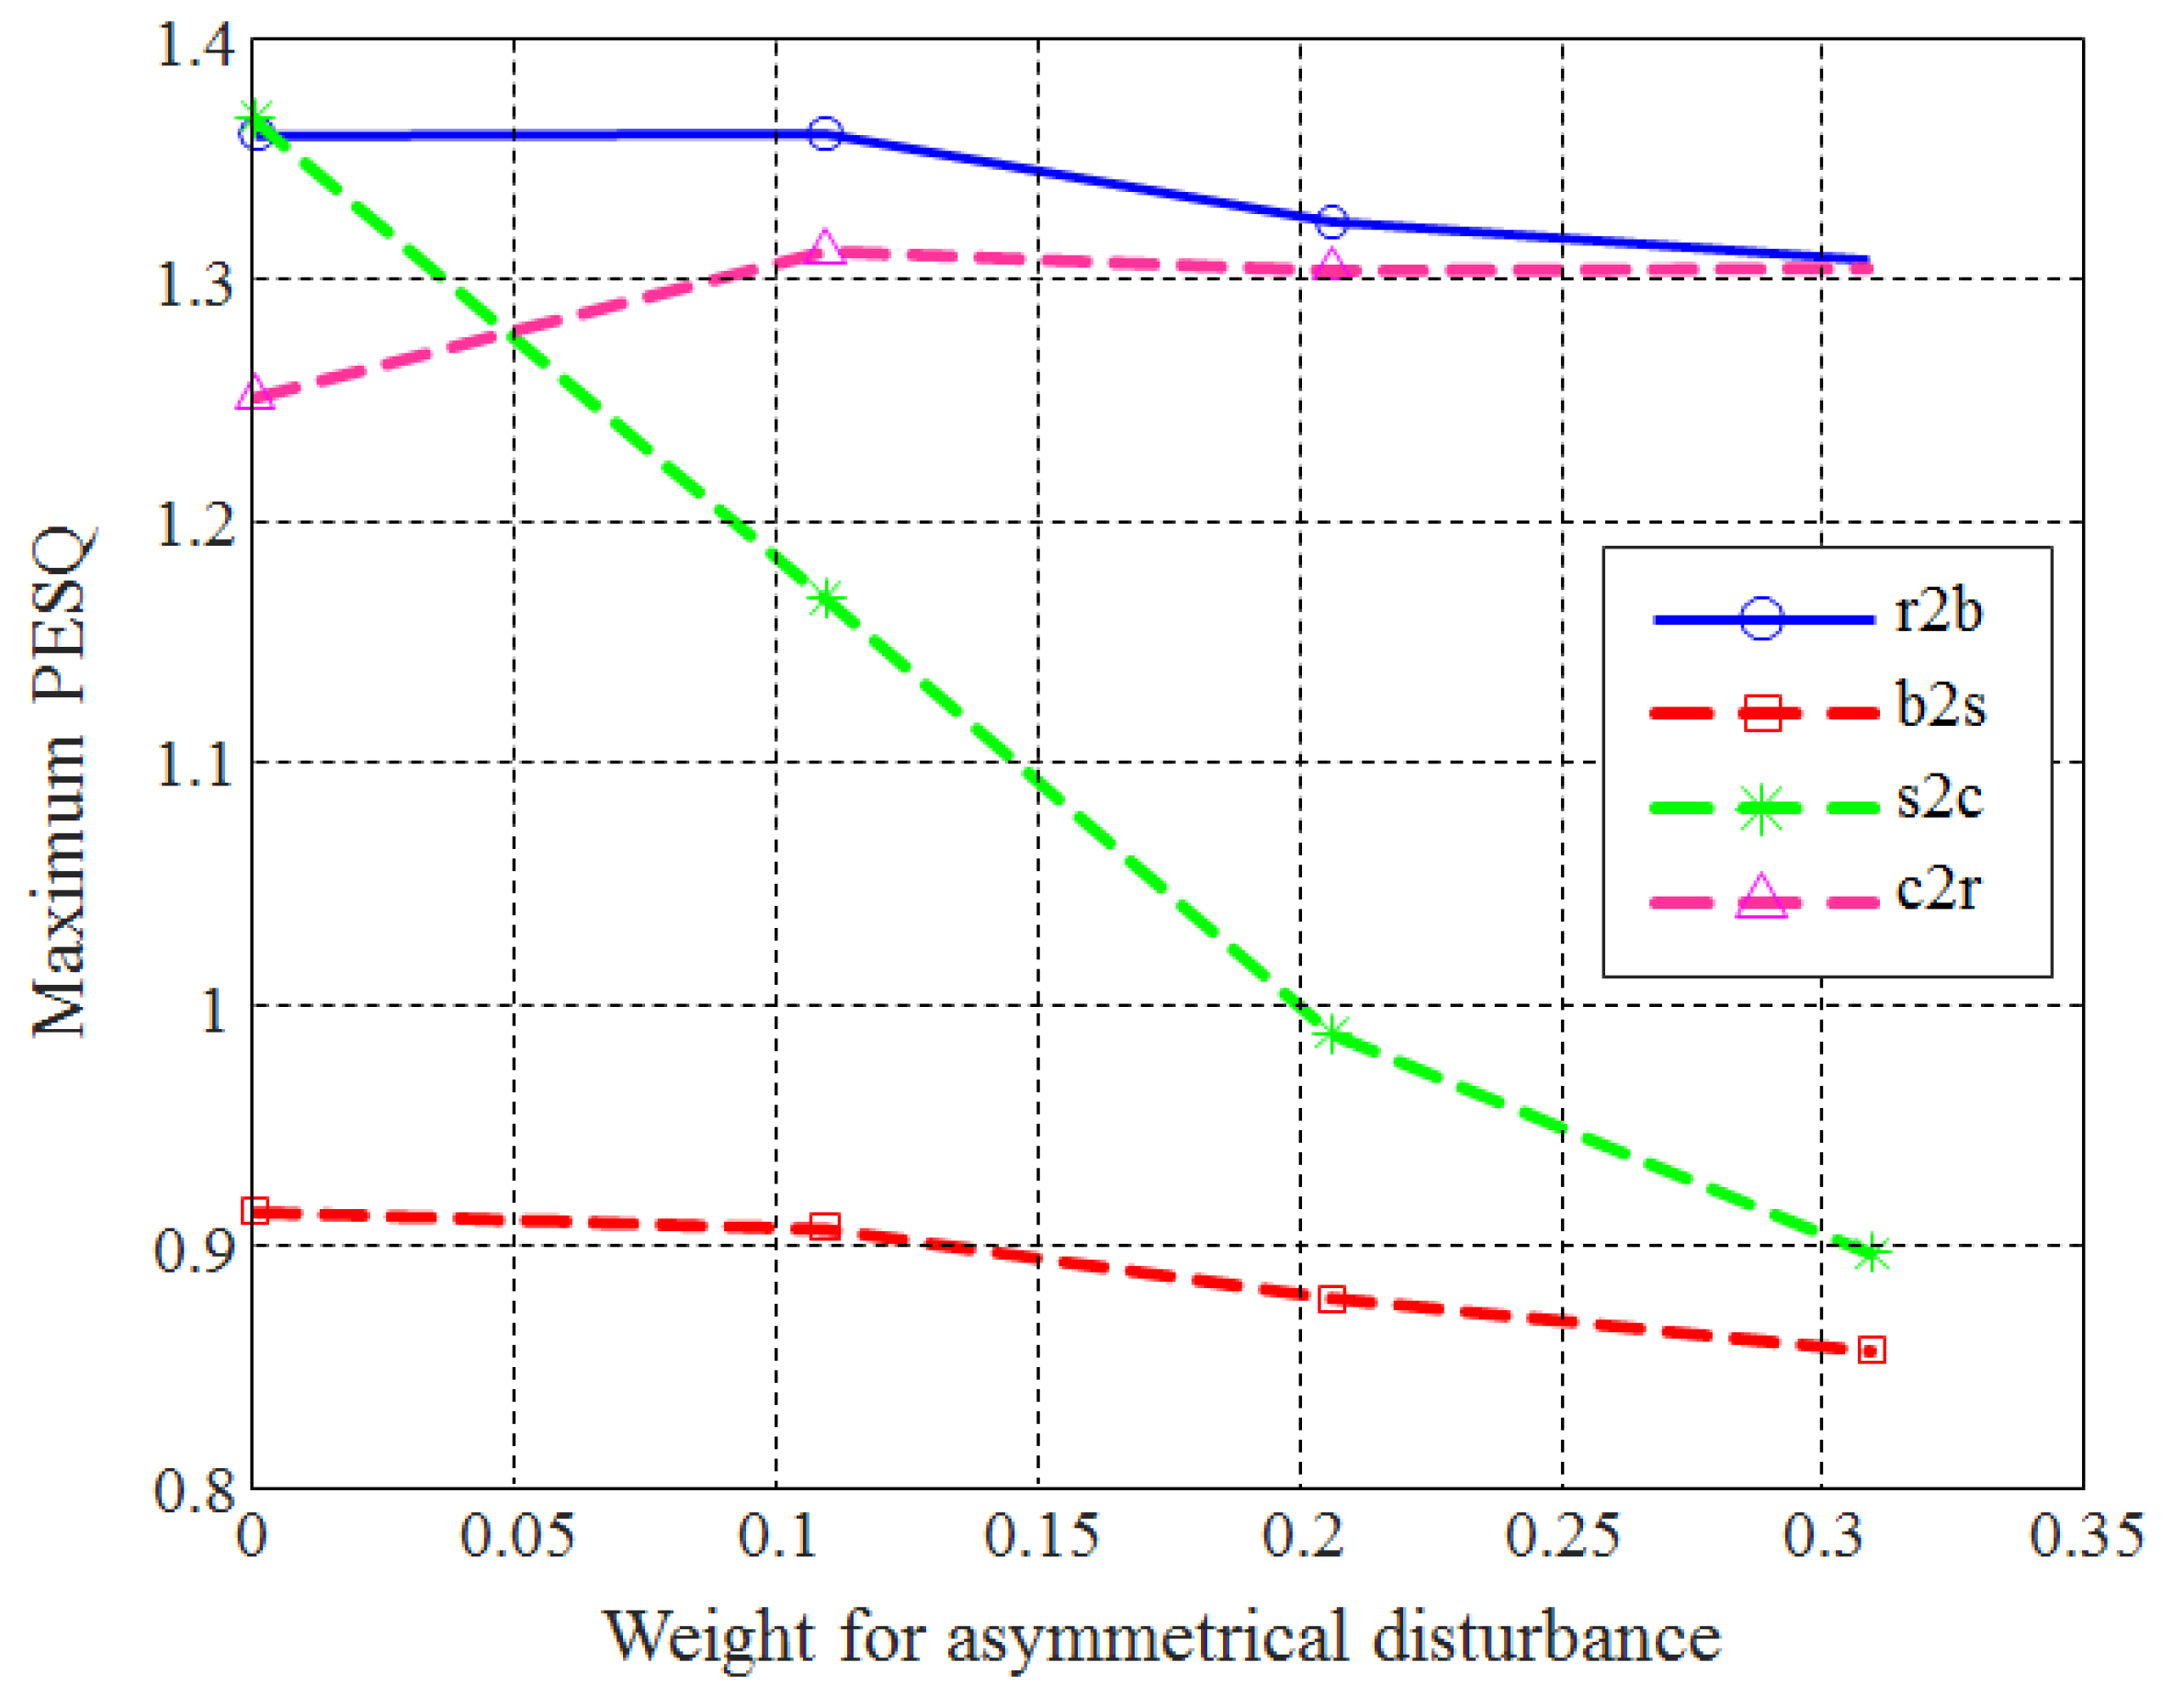
5.2. Determination of the Weights for Each Disturbance

The weights ( α , β ) for each of the disturbances in (8) were first determined so that the average PESQ was maximized. This provided the necessary information for calculating the perceptual distance in the future experiments. The average PESQs according to the weight for the asymmetrical disturbance, β in (8) are plotted in Figure 5 where the weight for the symmetrical disturbance α is given by 1 β . The correlations between the two variables (average PESQ and the asymmetrical disturbance) were −0.9321, −0.9722, −0.9888, and 0.7172 for conversion pairs r2b (rms → bdl), b2s (bdl → slt), s2c (slt → clb), and c2r (clb → rms), respectively. This means that except for c2r, lowering the asymmetrical disturbances was helpful in increasing the PESQ. Such results are somewhat different from in the case of speech enhancement, where the asymmetrical disturbance contributed to an increase in perceptual quality [25]. This results indicated that the perceptual similarity between the converted speech and the target speech was not remarkably affected by the residual components of the reference speech spectra and the loss of the target speech spectra. Whereas in speech enhancement [25], the residuals of the unwanted components (noise spectra) and the loss of the desired components (signal spectra) highly affected the perceptual similarity to the original speech signals. A possible reason for this results is that in speech enhancement, the unwanted components are always less correlated with the desired signal components, and hence, the residuals of the unwanted components and the loss of the desired components seriously degraded the quality of the reproduced speech signals. Whereas in VC, both the unwanted components and the desired components correspond to the reference and target spectra, respectively. The degree of the correlation between the two components may be varied according to the underlying two speech signals (reference and target). In other words, usefulness of the asymmetrical disturbance may be determined by combination of the reference/target signals. For example, the two speech signals are perceptually more correlated for the pairs (rms, bdl), (bdl, slt), and (slt, clb), compare with the pair (clb, rms). The conversion of clb → rms is female-to-male conversion, and hence, it can be reasonably assumed that the perceptual correlation between them is not as high as other pairs. The conversion of rms → slt is also different gender conversion. However, the degree of the correlation in the perceptual domain between them is assumed to be higher than the pair (clb, rms).
In the follows, the weights for each of the disturbances that yielded the highest average PESQ were adopted for each conversion pair.

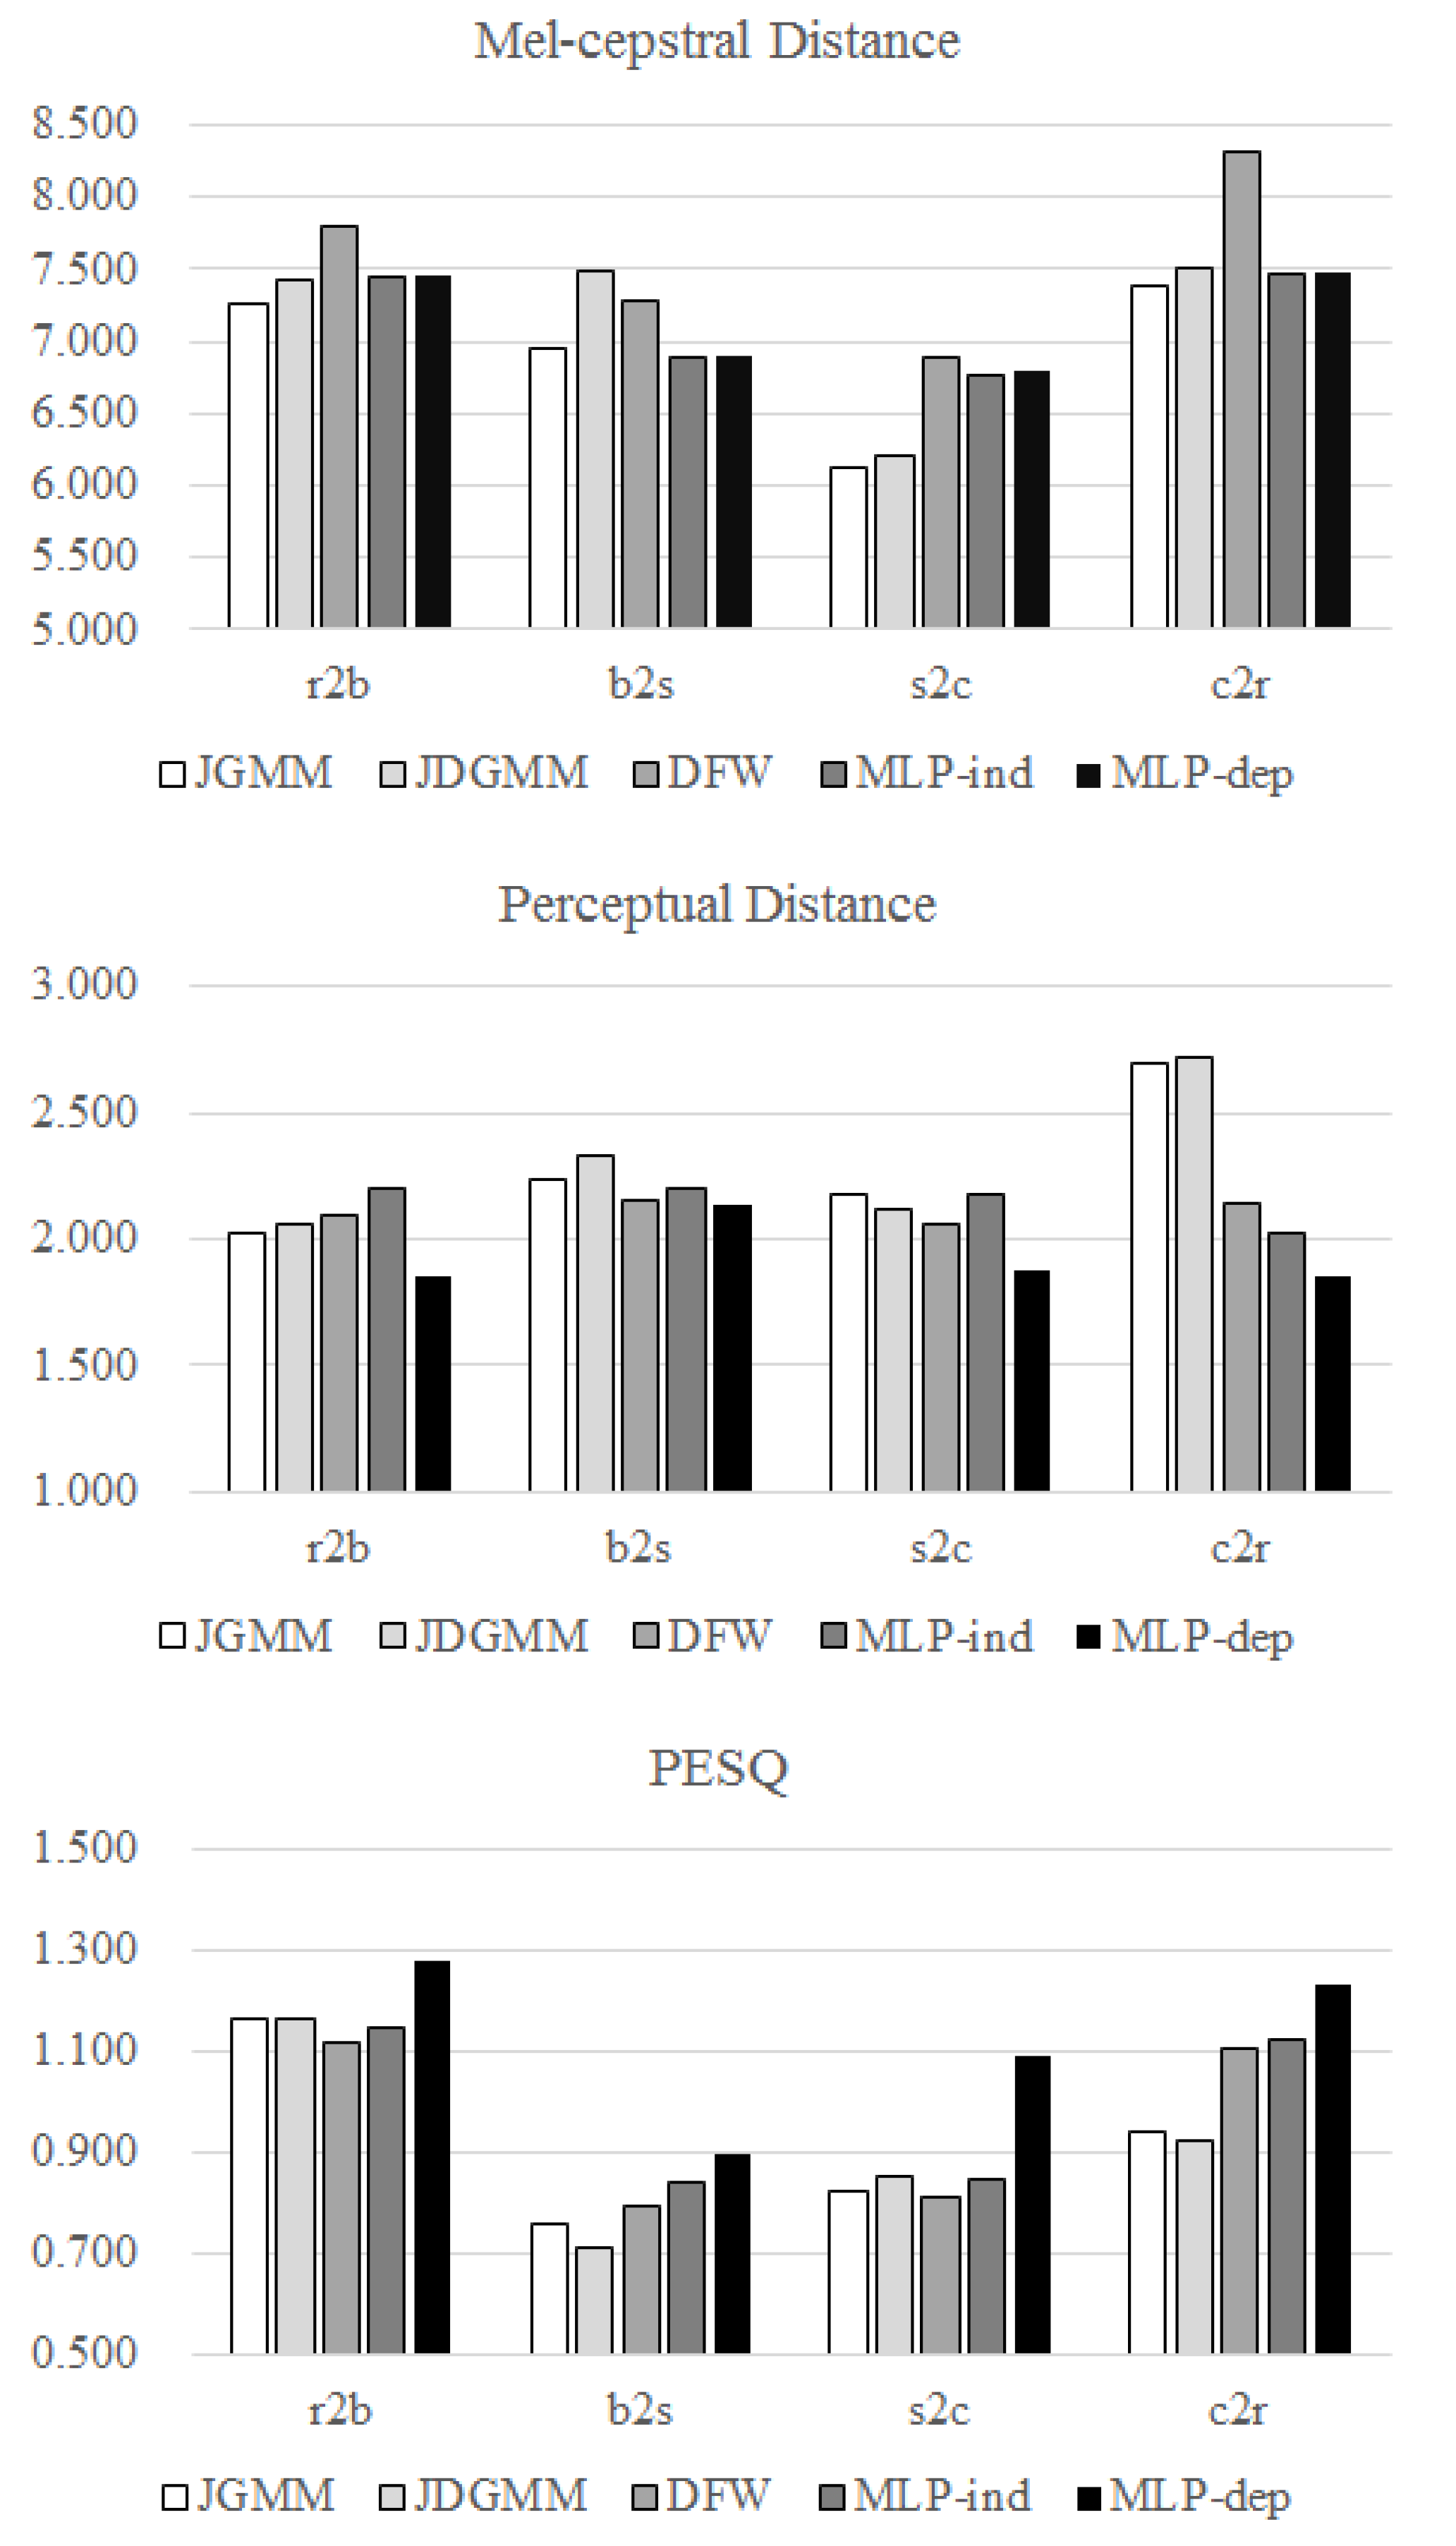
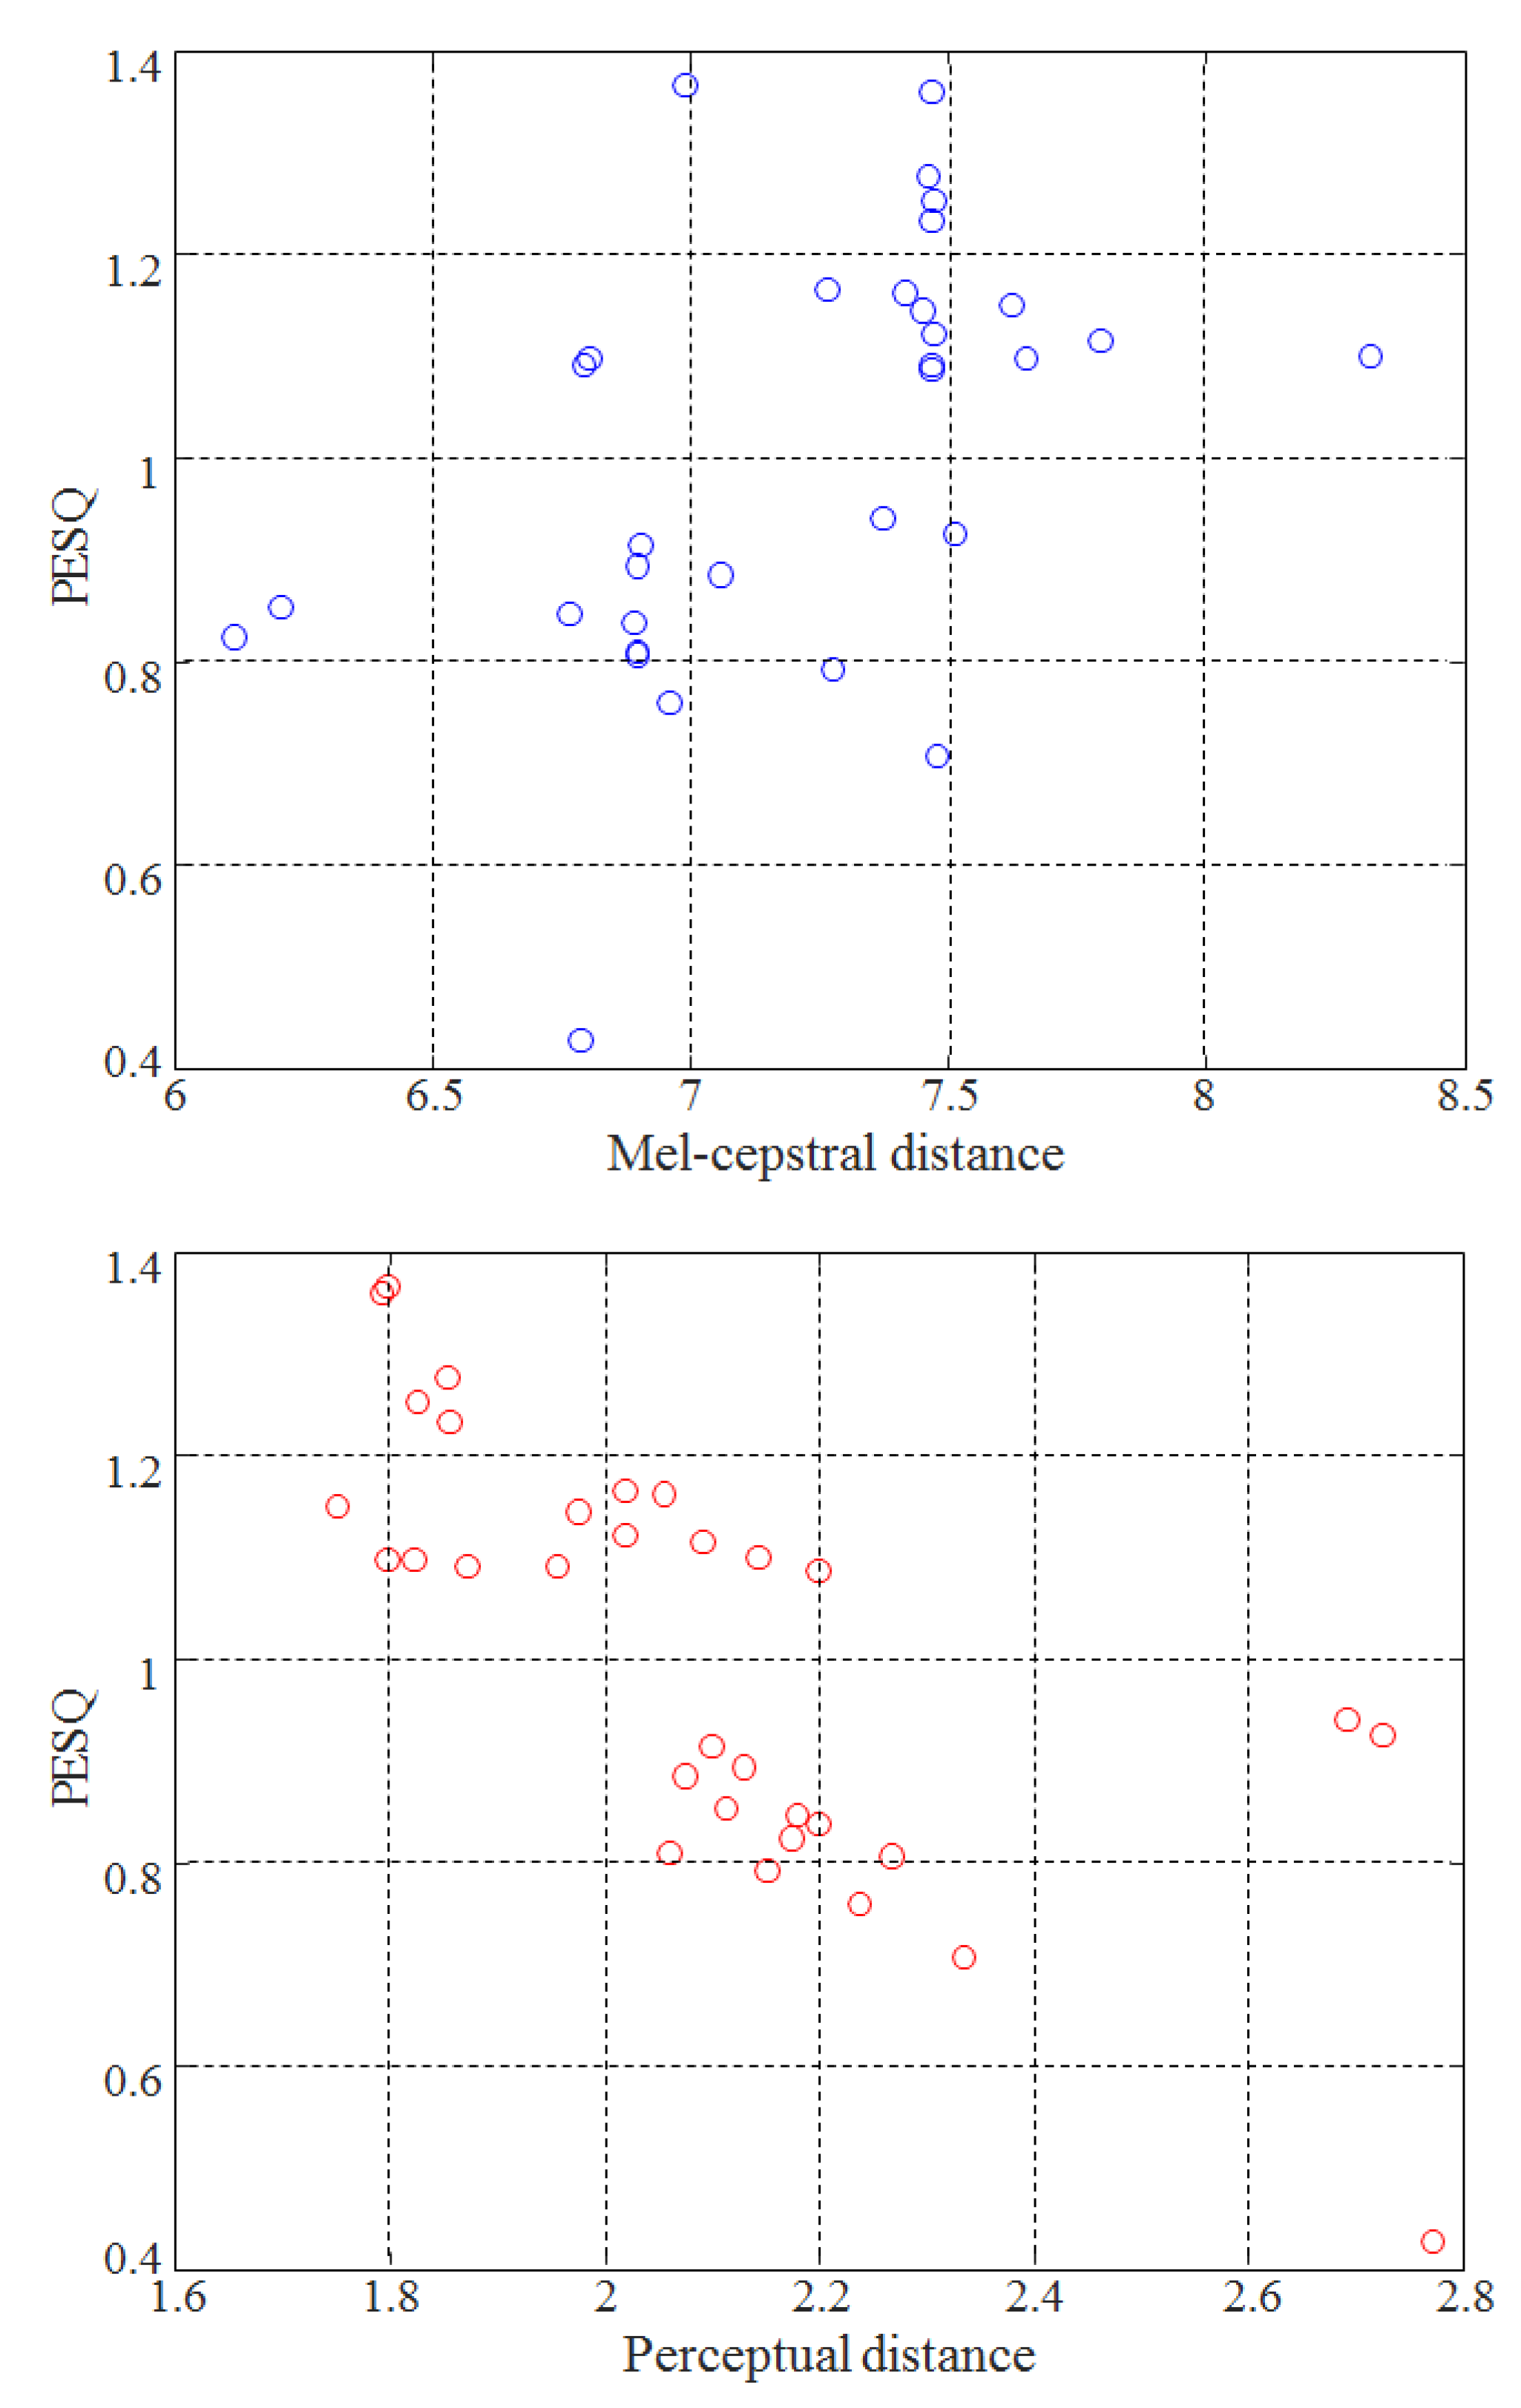
5.3. Objective Evaluation

The results are presented in Figure 6. The JGMM method revealed the best performance in terms of MCD for all conversion pairs. This result was due to the MCC minimization criterion adopted in the JGMM method. In terms of PD and PESQ, the proposed VC method was superior to the other methods for all conversion pairs. This results can be explained by the fact that the objective function for the proposed VC method was similar to that adopted in calculating the PESQ. The original purpose of the PESQ was to perceptually compare the overall quality of clean (untouched) speech with that of reconstructed (or distorted) speech [25,30]. The role of the PESQ in distinguishing the voices of different speakers has not been discussed to date. Our assumption was that even if two different speakers uttered the same sentence and the two voices were time-aligned using DTW and SOLA, the PESQ between the two voices would be very small. This assumption was verified by the experimental result wherein the average PESQs between the reference voices and time-aligned target voices were 0.922, 0.581, 1.084, and 0.614 for rms → bdl, bdl → slt, slt → clb, and clb → rms conversions, respectively. Considering the range of PESQs is −0.5 to 4.5 [30], these values are remarkably low, and hence, the PESQ is also a good indicator of differences in voice personality. The average PESQ of the proposed method was always higher than that between the reference and time-aligned target voices for all conversion pairs, as shown in Figure 6. Such improvements in PESQ mainly came from conversion to target speech, since no attempt to improve the quality was carried out on reference speech. The experimental results also showed that the correlation between the perceptual distance and the PESQ was −0.7315, whereas the correlation between MCD and the PESQ was 0.4805. This was graphically verified by the scatter plots presented in Figure 7 where the perceptual distance is more clear correlated with the PESQ, compared with MCD. Consequently, the distance metric adopted in this study is more usful for the prediction of perceptual similarity to target speech by comparison with the previously employed distance metric.

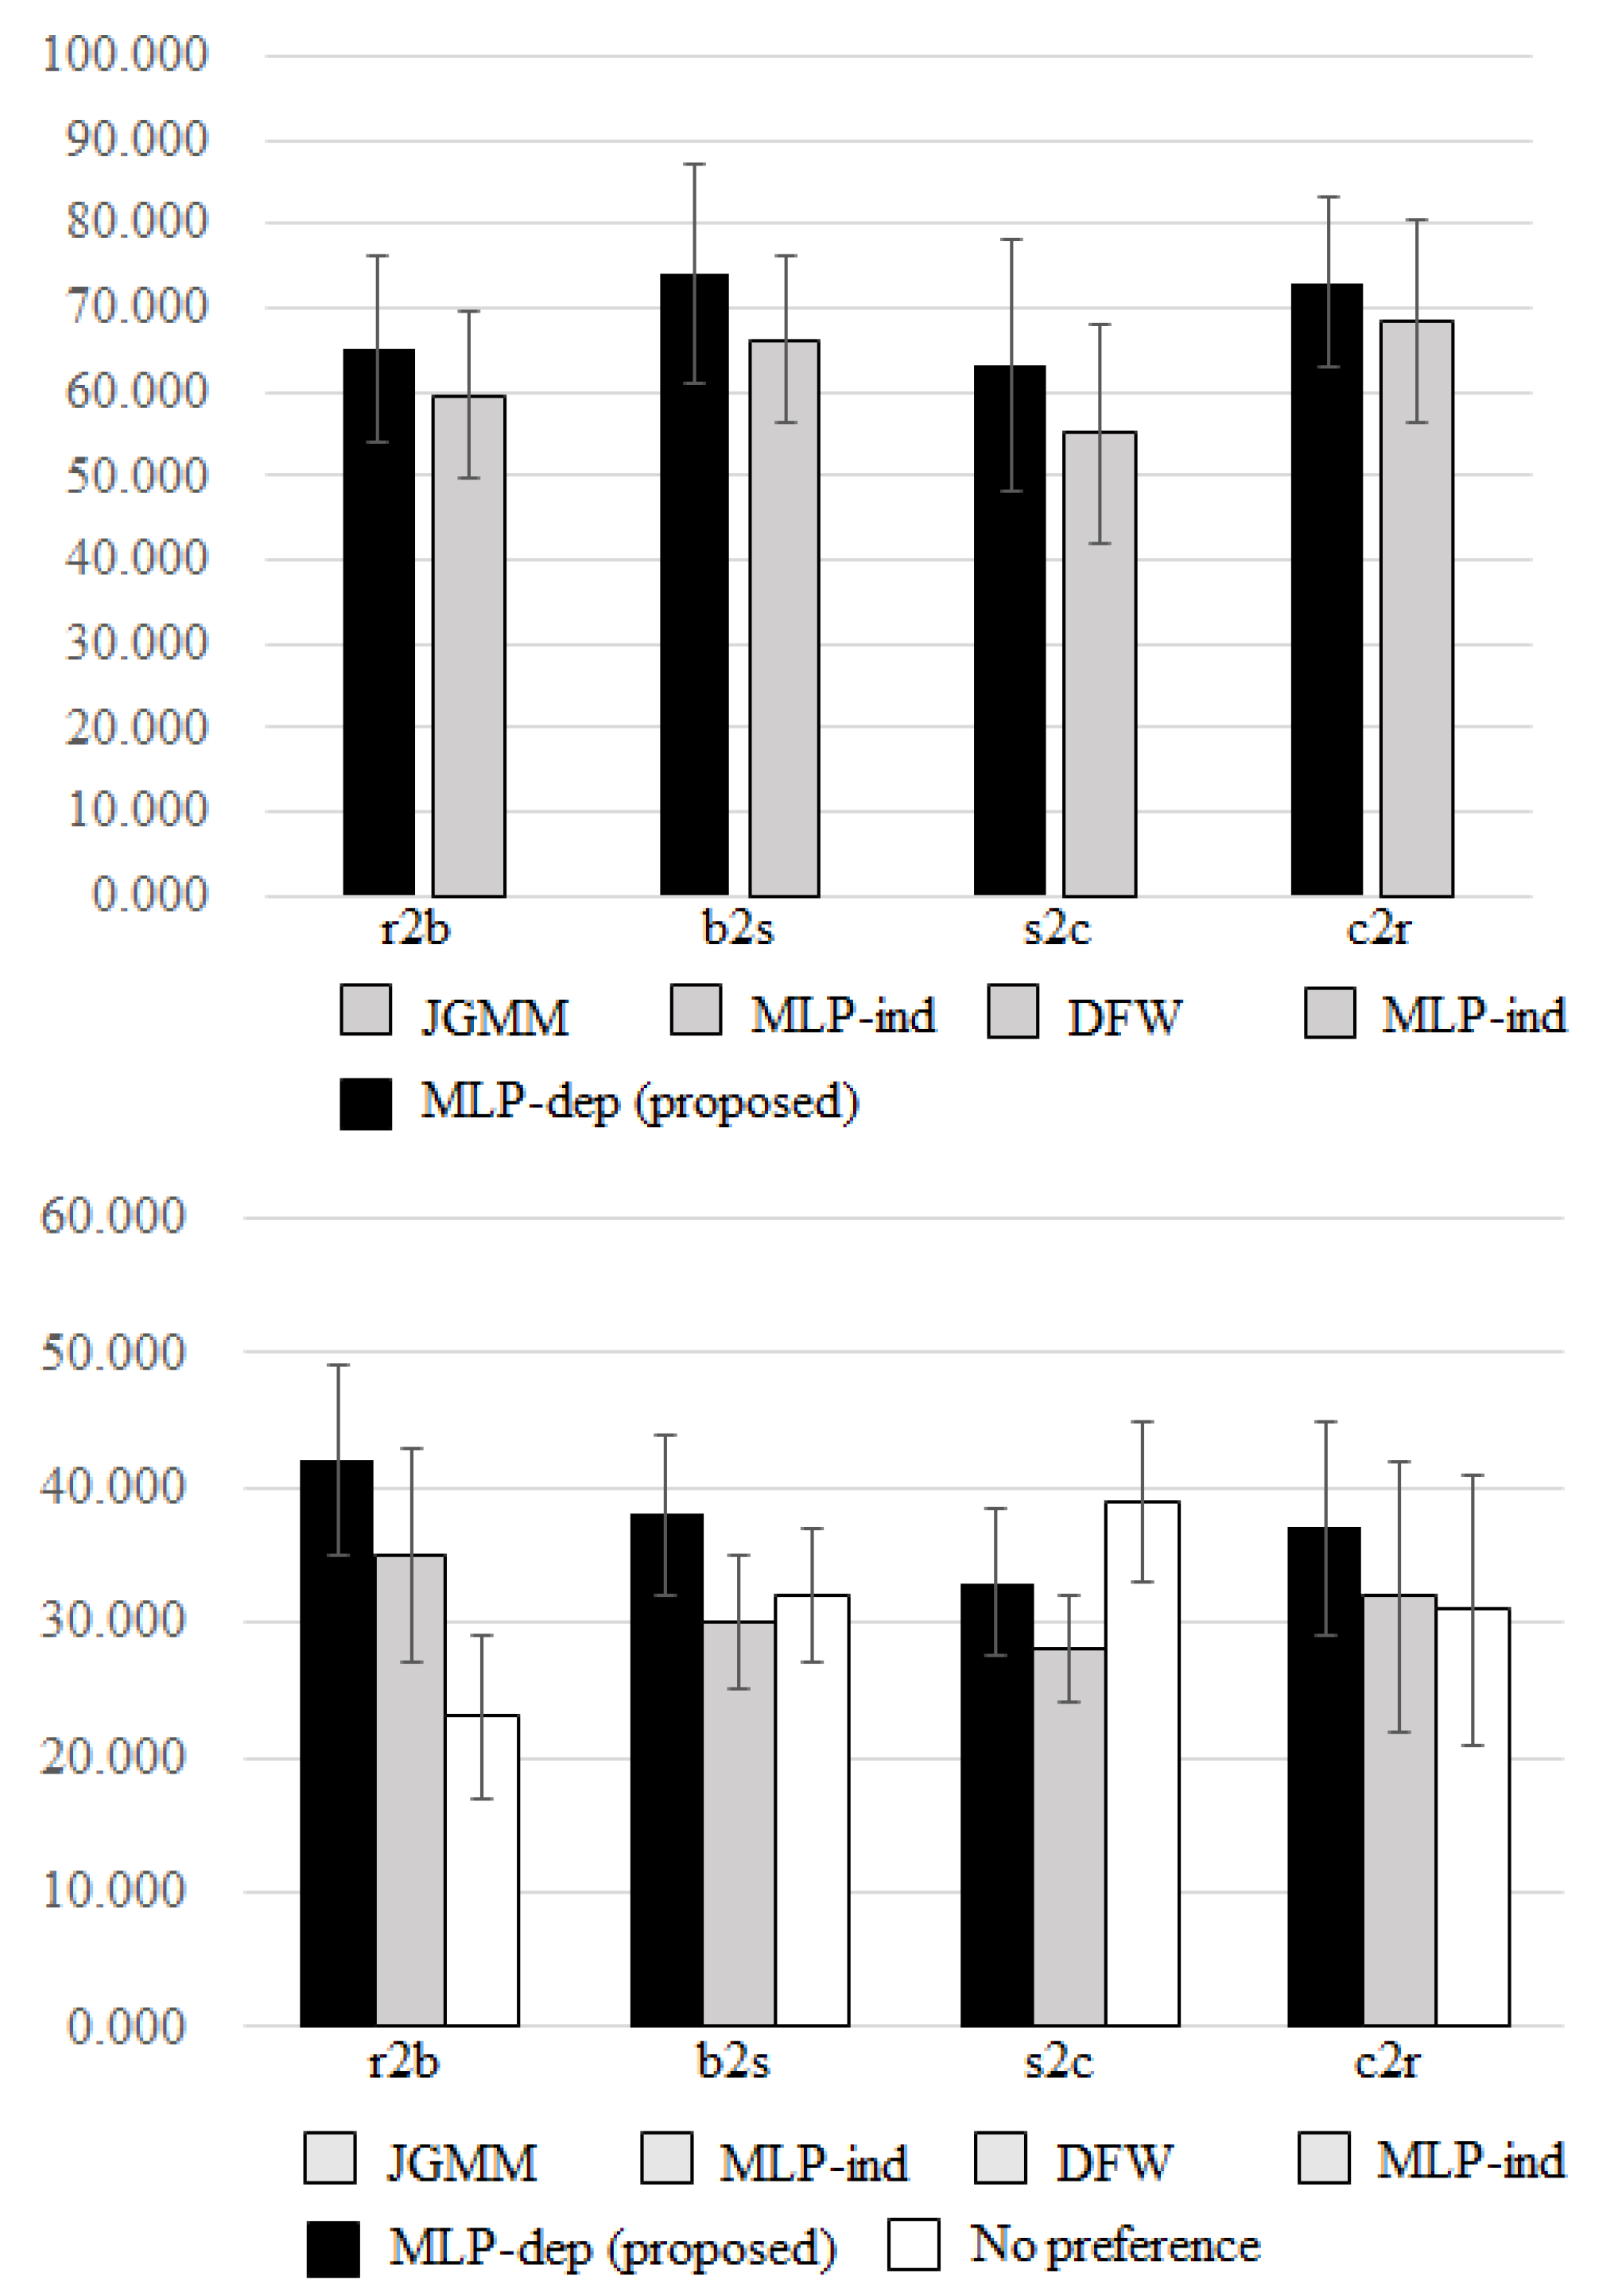
5.4. Subjective Evaluation

Although it can be inferred in the previous section, that voice personality was one of the major factors affecting the PESQ, it was worthwhile to verify whether the PESQ results were consistent with those from a subjective listening test. Figure 8 lists the results of the methods, other than the proposed method, that yielded the highest score for each conversion pair. Such results are consistent with those obtained from the objective evaluation, including PD and PESQ. This confirms that PD and PESQ well predicted the perceptual quality of the converted speech and potentially replace the subjective listening tests. The listeners indicated that the voices converted by the proposed method sounded more clear than those from the MMSE, JGMM, and JDGMM methods. A common characteristics of these three methods is that the converted features are given by a linear combination of some representative vectors (e.g., mean vectors of each Gaussian component). This resulted in ambiguous and unclear voices, due to the averaging effects. Such undesired effects were alleviated by adopting the global variance (GV) compensation method [21]. The proposed method yielded the perceptually preferred voices without GV compensation. It was not clearly verified whether perceptually more pleasant quality of the proposed method came from the properties of the DNN-based estimator or from the adopted objective function. Considering the fact that the MLP-dep (proposed) method yielded higher preferences than MLP-ind, it can be said that using conversion rules based on perceptual distance is one of the contributions of improvements in perceptual quality. Consequently, although the evaluations were carried out on the limited number of speakers, one language, and the limited number of the subjects, the results appear to be somewhat promising in that some improvements over the conventional MSE-based VC methods especially in perceptual quality could be achieved by employing the perceptual distance measurement.

6. Conclusions

A voice conversion method was proposed, based on a perceptually meaningful criterion. The objective function resides in the conventional MMSE and in the perceptual distance. The conversion rules for spectral envelop and spectral fine structure were jointly constructed in an iterative manner so that the perceptual distance was decreased incrementally. The effectiveness of the proposed method was confirmed through both objective and subjective evaluations. The experimental results also showed that the perceptual distance revealed a strong correlation with the PESQ. Moreover, it was confirmed that the results of the PESQ were consistent with the subjective listening test results. Currently, a simple conversion method is adopted for the spectral fine structure, which is based on PSOLA with a global pitch modification factor. More complicated conversion schemes for spectral fine structures will be considered in future study, and these will include pitch modification as well as LP-residual conversion.

Funding

This work was supported by the Basic Science Research Program through the National Research Foundation of Korea through the Ministry of Science and ICT under Grant S202003S00170.

Acknowledgments

This paper was written as part of Konkuk University’s research support program for its faculty on sabbatical leave in 2017.

Conflicts of Interest

The author declare no conflict of interest.

Abbreviations

The following abbreviations are used in this manuscript:
VCVoice Conversion
DNNDeep Neural Networks
MLPMulti-Layer Perceptron
MSEMean Squared Error
PESQPerceptual Evaluation of Speech Quality
MCCMel Cepstral Coefficients
MFCCMel-Frequency Cepstral Coefficients
LPCLinear Prediction Coefficients
LSPLine Spectrum Pair
MOSMost Opinion Score
DTWDynamic Time Warping
SOLASynchronized OverLap and Add
LPCCLinear Predictive Ceptral Coefficients
TD-PSOLATime Domain Pitch synchronous OverLap and Add
DFTDiscrete Fourier Transform
PDPerceptual Distance
MCDMel-Cepstral Distance
RBMRestricted Boltzmann Machines

References

  1. Mohammadi, S.H.; Kain, A. An overview of voice conversion systems. Speech Commun. 2017, 88, 65–82. [Google Scholar] [CrossRef]
  2. Wu, C.-H.; Hsia, C.-C.; Liu, T.-H.; Wang, J.-F. Voice conversion using duration-embedded bi-HMMs for expressive speech synthesis. IEEE Trans. Audio Speech Lang. Process. 2006, 4, 1109–1116. [Google Scholar]
  3. Huang, Y.-C.; Wu, C.-H.; Chao, Y.-T. Personalized spectral and prosody conversion using frame-based codeword distribution and adaptive CRF. IEEE Trans. Audio Speech Lang. Process. 2013, 1, 51–62. [Google Scholar] [CrossRef]
  4. Cox, S.J.; Bridle, J.S. Unsupervised speaker adaptation by probabilistic spectrum fitting. In Proceedings of the International Conference on Acoustic, Speech Signal Processing, Glasgow, UK, 23–26 May 1989; pp. 294–297. [Google Scholar]
  5. Bi, N.; Qi, Y. Application of speech conversion to alaryngeal speech enhancement. IEEE Trans. Audio Speech Lang. Process. 1997, 2, 97–105. [Google Scholar]
  6. Moulines, E.; Charpentier, F. Pitch synchronous waveform processing techniques for text-to-speech synthesis using diphones. Speech Commun. 1990, 9, 453–467. [Google Scholar] [CrossRef]
  7. McDougall, K. Assessing perceived voice similarity using Multidimensional Scaling for the construction of voice parades. Int. J. Speech Lang. Law 2013, 20, 163–172. [Google Scholar] [CrossRef]
  8. Wu, Z.; Kinnunen, T.; Chng, E.S.; Li, H. Mixture of factor analyzers using priors from non-parallel speech for voice conversion. IEEE Signal Process. Lett. 2012, 12, 914–917. [Google Scholar] [CrossRef] [Green Version]
  9. Nakashika, T.; Takiguchi, T.; Ariki, Y. Voice conversion using RNN pre-trained by recurrent temporal restricted Boltzmann machine. IEEE Trans. Audio Speech Lang. Process. 2015, 3, 580–587. [Google Scholar] [CrossRef]
  10. Abe, M.; Nakamura, S.; Shikano, K.; Kuwabara, H. Voice conversion through vector quantization. In Proceedings of the International Conference on Acoustic, Speech Signal Processing, New York, NY, USA, 11–14 April 1988; pp. 565–568. [Google Scholar]
  11. Valbret, H.; Moulines, E.; Tubach, J.P. Tubach, Voice transformation using PSOLA technique. Speech Commun. 1992, 11, 175–187. [Google Scholar] [CrossRef]
  12. Lee, K.S. Statistical approach for voice personality transformation. IEEE Trans. Audio Speech Lang. Process. 2007, 2, 641–651. [Google Scholar] [CrossRef]
  13. Lee, K.S.; Youn, D.H.; Cha, I.W. A New voice personality transformation based on both linear and nonlinear prediction analysis. In Proceedings of the 4th International Conference on Spoken Language Processing, Philadelphia, PA, USA, 3–6 October 1996; pp. 1401–1404. [Google Scholar]
  14. Erro, D.; Moreno, A.; Bonafonte, A. Voice conversion based on weighted frequency warping. IEEE Trans. Audio Speech Lang. Process. 2010, 5, 922–931. [Google Scholar] [CrossRef]
  15. Ye, H.; Young, S. Quality-enhanced voice morphing using maximum likelihood transformations. IEEE Trans. Audio Speech Lang. Process. 2006, 4, 1301–1312. [Google Scholar] [CrossRef]
  16. Mouchtaris, A.; der Spiegel, J.V.; Mueller, P. Nonparallel training for voice conversion based on a parameter adaptation approach. IEEE Trans. Audio Speech Lang. Process. 2006, 3, 952–963. [Google Scholar] [CrossRef] [Green Version]
  17. Raitio, T.; Lu, H.; Kane, J.; Suni, A.; Vainio, M.; King, S.; Alku, P. Voice source modelling using deep neural networks for statistical parametric speech synthesis. In Proceedings of the European Signal Processing Conference, Lisbon, Portugal, 1–5 September 2014; pp. 2290–2294. [Google Scholar]
  18. Rabiner, L.R.; Schaffer, R.W. The mechanism of speech production. In Digital Processing of Speech Signals; Prentice Hall Inc.: Englewood Cliffs, NJ, USA, 1978; pp. 39–41. [Google Scholar]
  19. Chatterjee, S.; Kleijn, W.B. Auditory Model-Based Design and Optimization of Feature Vectors for Automatic Speech Recognition. IEEE Trans. Audio Speech Lang. Process. 2011, 6, 1813–1825. [Google Scholar]
  20. Kain, A.; Macon, M.W. Spectral voice conversion for text-to-speech synthesis. In Proceedings of the International Conference on Acoustic, Speech Signal Processing, Seattle, WA, USA, 12–15 May 1998; pp. 285–288. [Google Scholar]
  21. Toda, T.; Black, A.W.; Tokuda, K. Voice conversion based on maximum likelihood estimation of spectral parameter trajectory. IEEE Trans. Audio Speech Lang. Process. 2007, 8, 2222–2235. [Google Scholar] [CrossRef]
  22. Godoy, E.; Rosec, O.; Chonavel, T. Voice conversion sugin dynamic frequency warping with amplitude scaling, for parallel or nonparallel corpora. IEEE Trans. Audio Speech Lang. Process. 2012, 4, 1313–1323. [Google Scholar] [CrossRef]
  23. Tian, X.; Lee, S.W.; Wu, Z.; Chng, E.S.; Li, H. An exemplar-based approach to frequency warping for voice conversion. IEEE Trans. Audio Speech Lang. Process. 2017, 10, 1863–1876. [Google Scholar] [CrossRef]
  24. Arslan, L.M.; Talkin, D. Speaker transformation using sentence HMM based alignments and detailed prosody modification. In Proceedings of the International Conference on Acoustic, Speech Signal Processing, Seattle, WA, USA, 12–15 May 1998; pp. 289–292. [Google Scholar]
  25. Martin, J.M.; Gomez, A.M.; Gonzalez, J.A.; Peinado, A.M. A deep learning loss function based on the perceptual evaluation of the speech quality. IEEE Signal Process. 2018, 11, 1680–1684. [Google Scholar] [CrossRef]
  26. Moritz, N.; Anemüller, J.; Kollmeier, B. An Auditory Inspired Amplitude Modulation Filter Bank for Robust Feature Extraction in Automatic Speech Recognition. IEEE Trans. Audio Speech Lang. Process. 2015, 11, 1926–1937. [Google Scholar] [CrossRef]
  27. Cernak, M.; Asaei, A.; Hyafil, A. Cognitive Speech Coding: Examining the Impact of Cognitive Speech Processing on Speech Compression. IEEE Signal Process. Mag. 2018, 3, 97–109. [Google Scholar] [CrossRef]
  28. Tachibana, K.; Toda, T.; Shiga, Y.; Kawai, H. An Investigation of Noise Shaping with Perceptual Weighting for Wavenet-Based Speech Generation. In Proceedings of the International Conference on Acoustic, Speech Signal Processing, Calgary, AB, Canada, 15–20 April 2018; pp. 5664–5668. [Google Scholar]
  29. Gupta, C.; Li, H.; Wang, Y. Perceptual evalution of singing quality. In Proceedings of the APSIPA Annual Summit and Conference, Kuala Lumpur, Malaysia, 12–15 December 2017; pp. 577–586. [Google Scholar]
  30. ITU-T, Rec. P. 862. Perceptual Evaluation of Speech Quality (PESQ): An Objective Method for End-to-End Speech Quality Assessment of Narrow Band Telephone Networks and Speech Codecs; International Telecommunication Union-Telecommunication Standardisation Sector: Geneva, Switzerland, 2001. [Google Scholar]
  31. Liu, W.; Wang, Z.; Liu, X.; Zeng, N.; Liu, Y.; Alsaadi, F.E. A survey of deep neural network architectures and their applications. Neurocomputing 2017, 19, 11–26. [Google Scholar] [CrossRef]
  32. Wen, Z.; Li, K.; Tao, J.; Lee, C.H. Deep neural network based voice conversion with a large synthesized parallel corpus. In Proceedings of the IEEE 2016 Asia-Pacific Signal and Information Processing Association Annual Summit and Conference, Jeju, Korea, 13–15 December 2016; pp. 1–5. [Google Scholar]
  33. Chen, L.H.; Ling, Z.H.; Song, Y.; Dai, L.R. Joint spectral distribution modeling using restricted boltzmann machines for voice conversion. In Proceedings of the Interspeech, Lyon, France, 25–29 August 2013; pp. 3052–3056. [Google Scholar]
  34. Tobing, P.L.; Wu, Y.C.; Hayashi, T.; Kobayashi, K.; Toda, T. Voice conversion with cyclic recurrent neural network and fine-tuned WaveNet vocoder. In Proceedings of the IEEE International Conference on Acoustics, Speech and Signal Processing, Brighton, UK, 12–17 May 2019; pp. 6815–6819. [Google Scholar]
  35. Ding, S.; Zhao, G.; Liberatore, C.; Gutierrez-Osuna, R. Learning Structured Sparse Representations for Voice Conversion. IEEE Trans. Audio Speech Lang. Process. 2020, 28, 343–354. [Google Scholar] [CrossRef]
  36. Zhang, J.-X.; Ling, Z.-H.; Lui, L.-J.; Jiang, Y.; Dai, L.-R. Sequence-to-sequence acoustic modeling for voice conversion. IEEE Trans. Audio Speech Lang. Process. 2019, 27, 631–643. [Google Scholar] [CrossRef] [Green Version]
  37. Zhang, J.-X.; Ling, Z.-H.; Dai, L.-R. Non-Parallel Sequence-to-Sequence Voice Conversion with Disentangled Linguistic and Speaker Representations. IEEE Trans. Audio Speech Lang. Process. 2020, 28, 540–552. [Google Scholar] [CrossRef]
  38. Oord, A.V.D.; Dieleman, S.; Zen, H.; Simonyan, K.; Vinyals, O.; Graves, A.; Kalchbrenner, N.; Senior, A.; Kavukcuoglu, K. WaveNet: A generative model for raw audio. In Proceedings of the 9th ISCA Speech Synthesis Workshop, Sunnyvale, CA, USA, 13–15 September 2016; p. 125. [Google Scholar]
  39. White, G.M.; Neely, R.B. Speech recognition experiments with linear prediction, bandpass filtering, and dynamic programming. IEEE Trans. Acoust. Speech Signal Process. 1976, 2, 183–188. [Google Scholar] [CrossRef]
  40. Roucos, S.; Wilgus, A.M. High quality time-scale modification for speech. In Proceedings of the International Conference on Acoustic, Speech Signal Processing, Tampa, FL, USA, 26–29 March 1985; pp. 493–496. [Google Scholar]
  41. Zwicker, E.; Fastl, H. Critical bands and excitation. In Psychoacoustics; Springer: Heidelberg, Germany, 1990; pp. 149–174. [Google Scholar]
  42. Kominek, J.; Black, A.W. The CMU ARCTIC speech databases. In Proceedings of the 5th ISCA ITRW on Speech Synthesis, Pittsburgh, PA, USA, 14–16 June 2004; pp. 223–224. [Google Scholar]
  43. Hinton, G.E.; Salakhutdinov, R. Reducing the dimensionality of data with neural networks. Science 2006, 5786, 504–507. [Google Scholar] [CrossRef] [PubMed] [Green Version]
  44. Deng, L.; Seltzer, M.L.; Yu, D. Binary coding of speech spectrogram using a deep auto-encoder. In Proceedings of the 11th Annual Conference of the International Speech Communication Association, Makuhari, Japan, 26–30 September 2010; pp. 1692–1695. [Google Scholar]
  45. Hinton, G.E. Training products of experts by minimizing contrastive divergence. Neural Comput. 2002, 8, 1711–1800. [Google Scholar] [CrossRef]
Figure 1. The block diagrams of the two voice conversion (VC) schemes. Top: Conventional VC scheme. Bottom: Proposed VC scheme.
Applsci 10 02884 g001
Figure 2. Examples of the time-aligned waveforms. Top: Reference speech. Middle: Target speech. Bottom: Time-aligned target speech.
Applsci 10 02884 g002
Figure 3. Block diagram of constructing of the conversion parameters.
Applsci 10 02884 g003
Figure 4. Examples of perceptual distances according to the pitch modification factors. Left: male-to-male. Right: male-to-female conversions.
Applsci 10 02884 g004
Figure 5. Average PESQs for each conversion pair according to the weight for the asymmetrical disturbance.
Applsci 10 02884 g005
Figure 6. The objective evaluation results for each method, each conversion pair.
Applsci 10 02884 g006
Figure 7. Scatterplot of PESQ values. Top: Mel-cepstral distance. Bottom: Perceptual distance.
Applsci 10 02884 g007
Figure 8. Subjective evaluation results with 95% confidence interval. Top: ABX test results, Bottom: Preference test results.
Applsci 10 02884 g008

