Article

Synthesis of Molecularly Imprinted Polymer via Emulsion Polymerization for Application in Solanesol Separation

1
College of Chemical Engineering, Hebei University of Technology, Tianjin 300130, China
2
Beijing Key Laboratory of Thermal Science and Technology, Technical Institute of Physics and Chemistry, Chinese Academy of Sciences, Beijing 100190, China
3
Zunyi Tobacco Company of Guizhou Provincial Tobacco Corporation, Zunyi 563000, China
4
Key Laboratory of Prevention and Control of Residual Pollution in Agricultural Film, Ministry of Agriculture and Rural, Institute of Environment and Sustainable Development in Agriculture, Chinese Academy of Agricultural Sciences, Beijing 100081, China
*
Authors to whom correspondence should be addressed.
Appl. Sci. 2020, 10(8), 2868; https://doi.org/10.3390/app10082868
Submission received: 16 March 2020 / Revised: 16 April 2020 / Accepted: 17 April 2020 / Published: 21 April 2020

Abstract

:

Featured Application

Solanesol molecularly imprinted polymers (SSO-MIPs) can specifically recognize solanesol to achieve the purpose of improving the purity of solanesol. The obtained high-purity solanesol can be used in pharmaceuticals, such as anti-cancer and anti-ulcer drugs, etc.

Abstract

High-purity solanesol can be used for pharmaceutical applications, but the current method for purifying solanesol has high cost and difficult continuous operation, and the use of molecular imprinting to purify natural products is a hot research topic of current research. Solanesol molecularly imprinted polymers were synthesized via emulsion polymerization for the first time. The morphology of the SSO-MIPs was observed with a scanning electron microscope, and the effects of the synthesis time, initiator dosage, functional monomer dosage, and cross-linking agent dosage on the adsorption effects under high-temperature and rapid synthesis conditions were discussed. The results demonstrate that the optimum synthesis conditions were a ratio of the template molecules to the functional monomers to the cross-linking agents of 1:8:30 (mol:mol:mol), 10 mg of the initiator, and a synthesis temperature of 70 °C. The imprinting factor of SSO-MIPs synthesized under the optimized process was found to reach 2.51, and the SSO-MIPs synthesized by this method exhibited a good adsorption effect, emitted less pollution during the synthesis process, and are convenient for demulsification. This research reports a reliable method for the synthesis of solanesol molecularly imprinted polymers.

1. Introduction

Molecularly imprinted polymers (MIPs) are macromolecular materials with a specific recognition function for template molecules. The synthesis of molecularly imprinted polymers is a process of combining template molecules with functional monomers under the action of initiator and cross-linking agent, and then the template molecules are eluted from the polymers. Water-soluble redox initiator is commonly used in emulsion polymerization. The initiator decomposes under the condition of illumination or heating to generate free radicals. The active free radicals to initiate the polymerization reaction, and the template molecules are combined with the functional monomers under the action of the cross-linking agent to form molecularly imprinted polymers. The detailed synthesis process is as follows. Firstly, the functional monomers and the template molecules are pre-polymerized, and the pre-polymerization time is generally 12 h. In order to improve the pre-polymerization effect, ultrasonic assistance can be used. Then, cross-linking agents and initiators are added to carry out a polymerization reaction under suitable conditions. The cross-linking agent generally requires reduced pressure distillation before use. Finally, the obtained polymers are eluted under appropriate conditions to elute the template molecules. Thus, molecularly imprinted polymers with imprinted holes matched with the size, shape, and functional groups of the template molecules are obtained [1,2]. Pauling, a famous scholar, put forward the theory of antibody formation in the 1940s, which laid a theoretical foundation for the generation of molecular imprinting technology [3]. In 1972, Wulff et al. successfully prepared an MIP for the first time [4]. Today, molecular imprinting technology is widely used in solid-phase extraction [5,6], chromatographic separation [7,8], bionic sensing [9], membrane separation [10], the food industry [11,12], natural drug separation [13], medicine [14], and environmental monitoring [15], among other applications. The methods of the synthesis of MIPs include bulk polymerization, solution polymerization, dispersion polymerization, suspension polymerization, and emulsion polymerization. MIPs obtained by different polymerization methods have different morphologies and adsorption effects. The conventional bulk polymerization method and solution polymerization method produce block MIPs, which need to be pulverized and ground; therefore, the polymer ultimately obtained is not uniform in shape or size. Additionally, the imprinted holes are buried in the polymer and directly affect the adsorption effect [16]. The emulsion polymerization method can directly synthesize spherical MIPs, and it does not require complicated post-treatment processes such as subsequent grinding or screening, thus reducing the probability of the destruction of imprinted holes. Spherical polymers synthesized by the emulsion polymerization method have a uniform particle size and high use efficiency. The emulsion polymerization method is fast and has a stable dispersion system, and it can realize continuous production. Additionally, water is used as a dispersion medium, which is beneficial to heat transfer and temperature control, a safe production process, and the reduction of environmental pollution [17,18].
Solanesol (SSO) is an important pharmaceutical intermediate and an irreplaceable natural raw material for the synthesis of coenzyme Q10 and anti-ulcer and anti-cancer drugs [19]. Crude solanesol cannot be directly used as a medicinal raw material, so it is necessary to separate and purify it. In recent years, it has been reported that molecular imprinting technology can be used to purify solanesol. Ma [20] synthesized spherical solanesol molecularly imprinted polymers (SSO-MIPs) in a size range of 250–350 μm via suspension polymerization, which was used to purify solanesol via rapid chromatography. Under optimal chromatographic conditions, the adsorption capacity of the MIP-Flash column was determined to be 107.3 μmol/g, and, in each process, 370.8 mg of purified solanesol (98.4%) could be obtained from the extract of tobacco leaves (14.7 g), and the yield of solanesol was 2.5% of the dry weight of tobacco leaves. Long [21] used the bulk polymer method to synthesize SSO-MIPs and studied the influences of different factors on the adsorption effect of the polymers. Solanesol is unsaturated alcohol; because it contains 9 unsaturated double bonds, it can easily absorb free radicals, and in addition, dehydrogenation, oxidation, and rearrangement reactions can also easily occur. In her master’s thesis, Ma reported that methyl methacrylate (MMA) is the best functional monomer for the synthesis of SSO-MIPs [22].
In the present research, SSO-MIPs were synthesized by emulsion polymerization, and the effects of the amounts of the functional monomer, cross-linking agent, and initiator, as well as the synthesis temperature, on the adsorption performance of the SSO-MIPs were investigated.

2. Experimental

2.1. Reagents and Instruments

Analytically pure MMA and ethylene glycol dimethacrylate (EGDMA), as well as industrial-grade solanesol (95%), were purchased from Shanghai McLean Biochemical Technology Co., Ltd (Shanghai, China). Analytically pure potassium persulfate (KPS) was purchased from Zhengzhou Paini Chemical Reagent Factory (Zhengzhou, China). Analytically pure sodium dodecyl sulfate (SDS) was purchased from Chemical Reagents Co., Ltd (Shanghai, China)., of the China National Medicine Group. Analytically pure dichloromethane, methanol, and glacial acetic acid were purchased from Beijing Chemical Works (Beijing, China). Finally, analytically pure hexane was purchased from Tianjin Concord Technology Co., Ltd (Tianjin, China).
A Vanquish ultra-high-performance liquid chromatography (UHPLC) system from Thermo Fisher Scientific was used (Waltham, MA, USA). A BCD-400EGX5S refrigerator from China Kangjia Tongchuang Electric Appliance Co., Ltd (Hefei, China). A DF-101S model heat-collecting thermostatic heating magnetic stirrer from Henan Yuhua Instrument Co., Ltd (Zhengzhou, China). An LSC-20 low-speed centrifuge from Changzhou Zhengrong Instrument Co., Ltd (Changzhou, China). Scanning electron microscopy was conducted on a Quanta 250 FEG field emission gun scanning electron microscope from FEI (Hillsboro, OR, USA). A Varian 3100 Fourier transform infrared spectrometer from American Varian Technology China, Ltd (Palo Alto, CA, USA). A NALYSETTE 22 NanoTec plus model laser particle size analyzer from Fritsch Co., Ltd (Idar-Oberstein, Germany). Finally, a Autosorb-IQ-MP Pulsar LC-D200 model fully automatic gas adsorption and detection system from Quantachrome Co., Ltd (Boynton Beach, FL, USA).

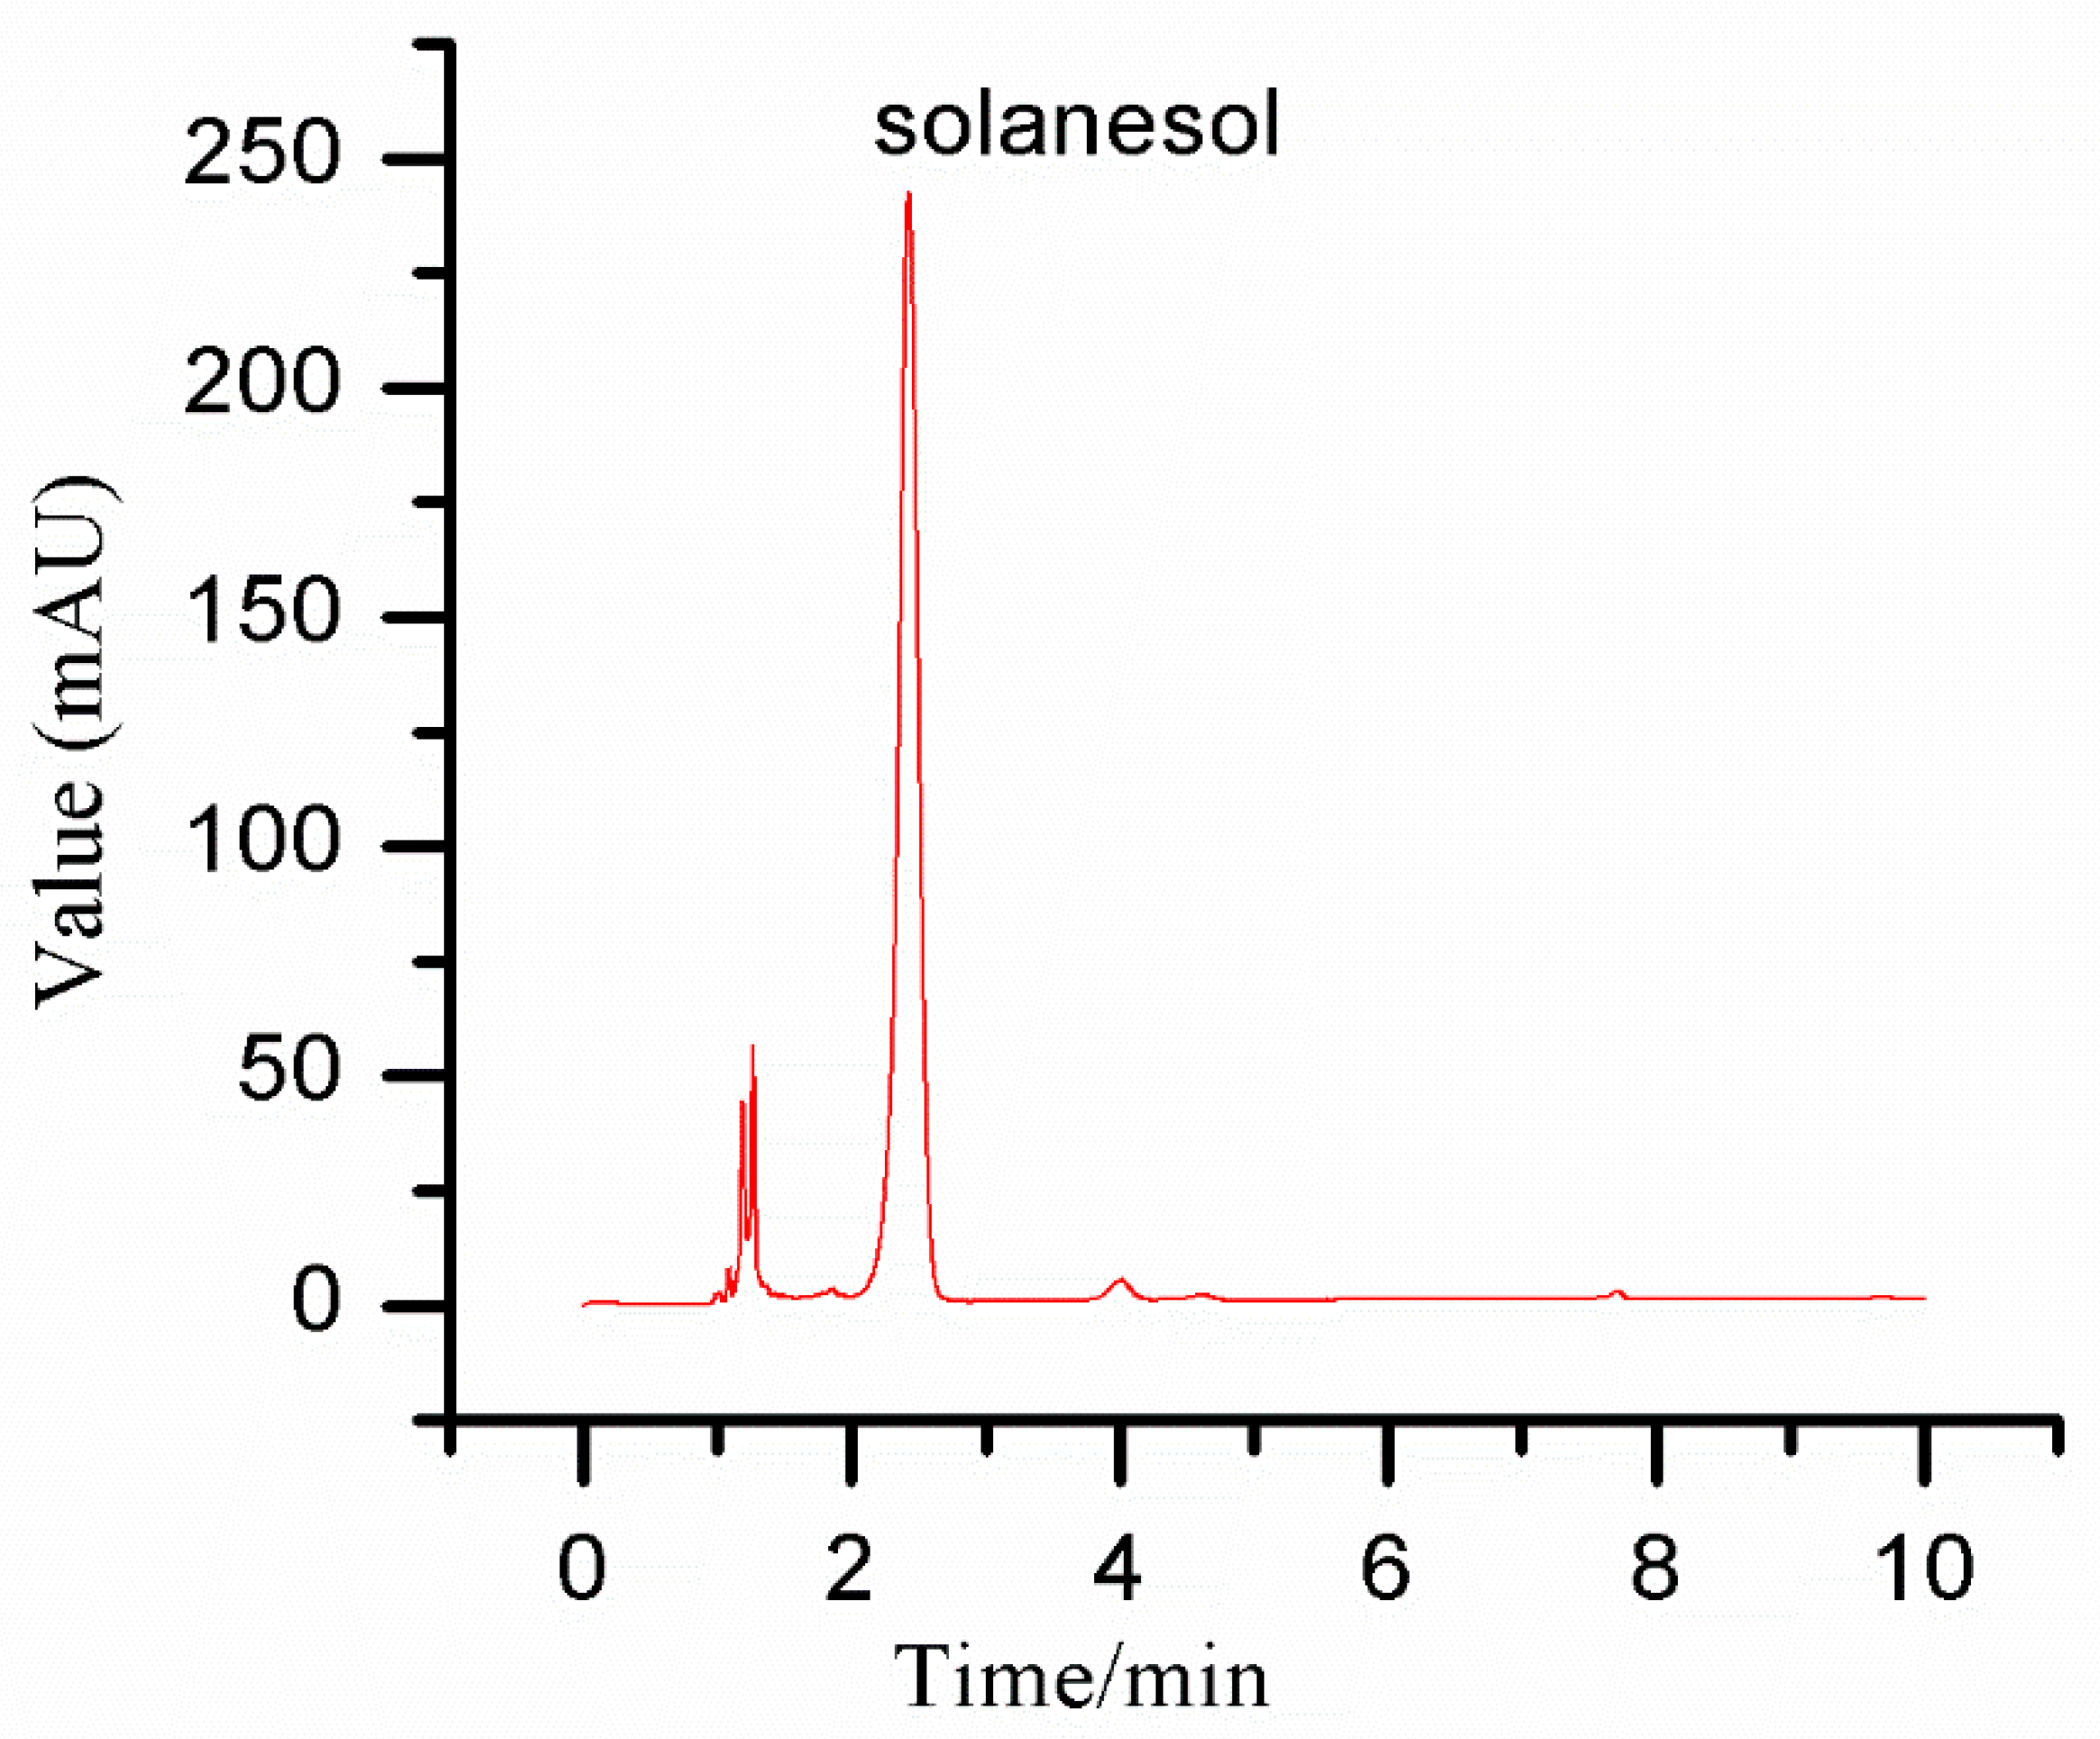
2.2. Solanesol Concentration Detection

An Accucore Vanquish C18+ (100 × 2.1 mm, 1.5 μm) chromatographic column (Thermo Fisher Scientific, Waltham, MA, USA) was used, and the mobile phase was pure methanol. The detection wavelength was 210 nm, the column temperature was 30 °C, the flow rate was 0.2 mL/min, and the injection volume was 5 μL. The concentration of solanesol was detected, and Figure 1 presents the ultra-high-performance liquid chromatogram of the solanesol methanol solution under these conditions.

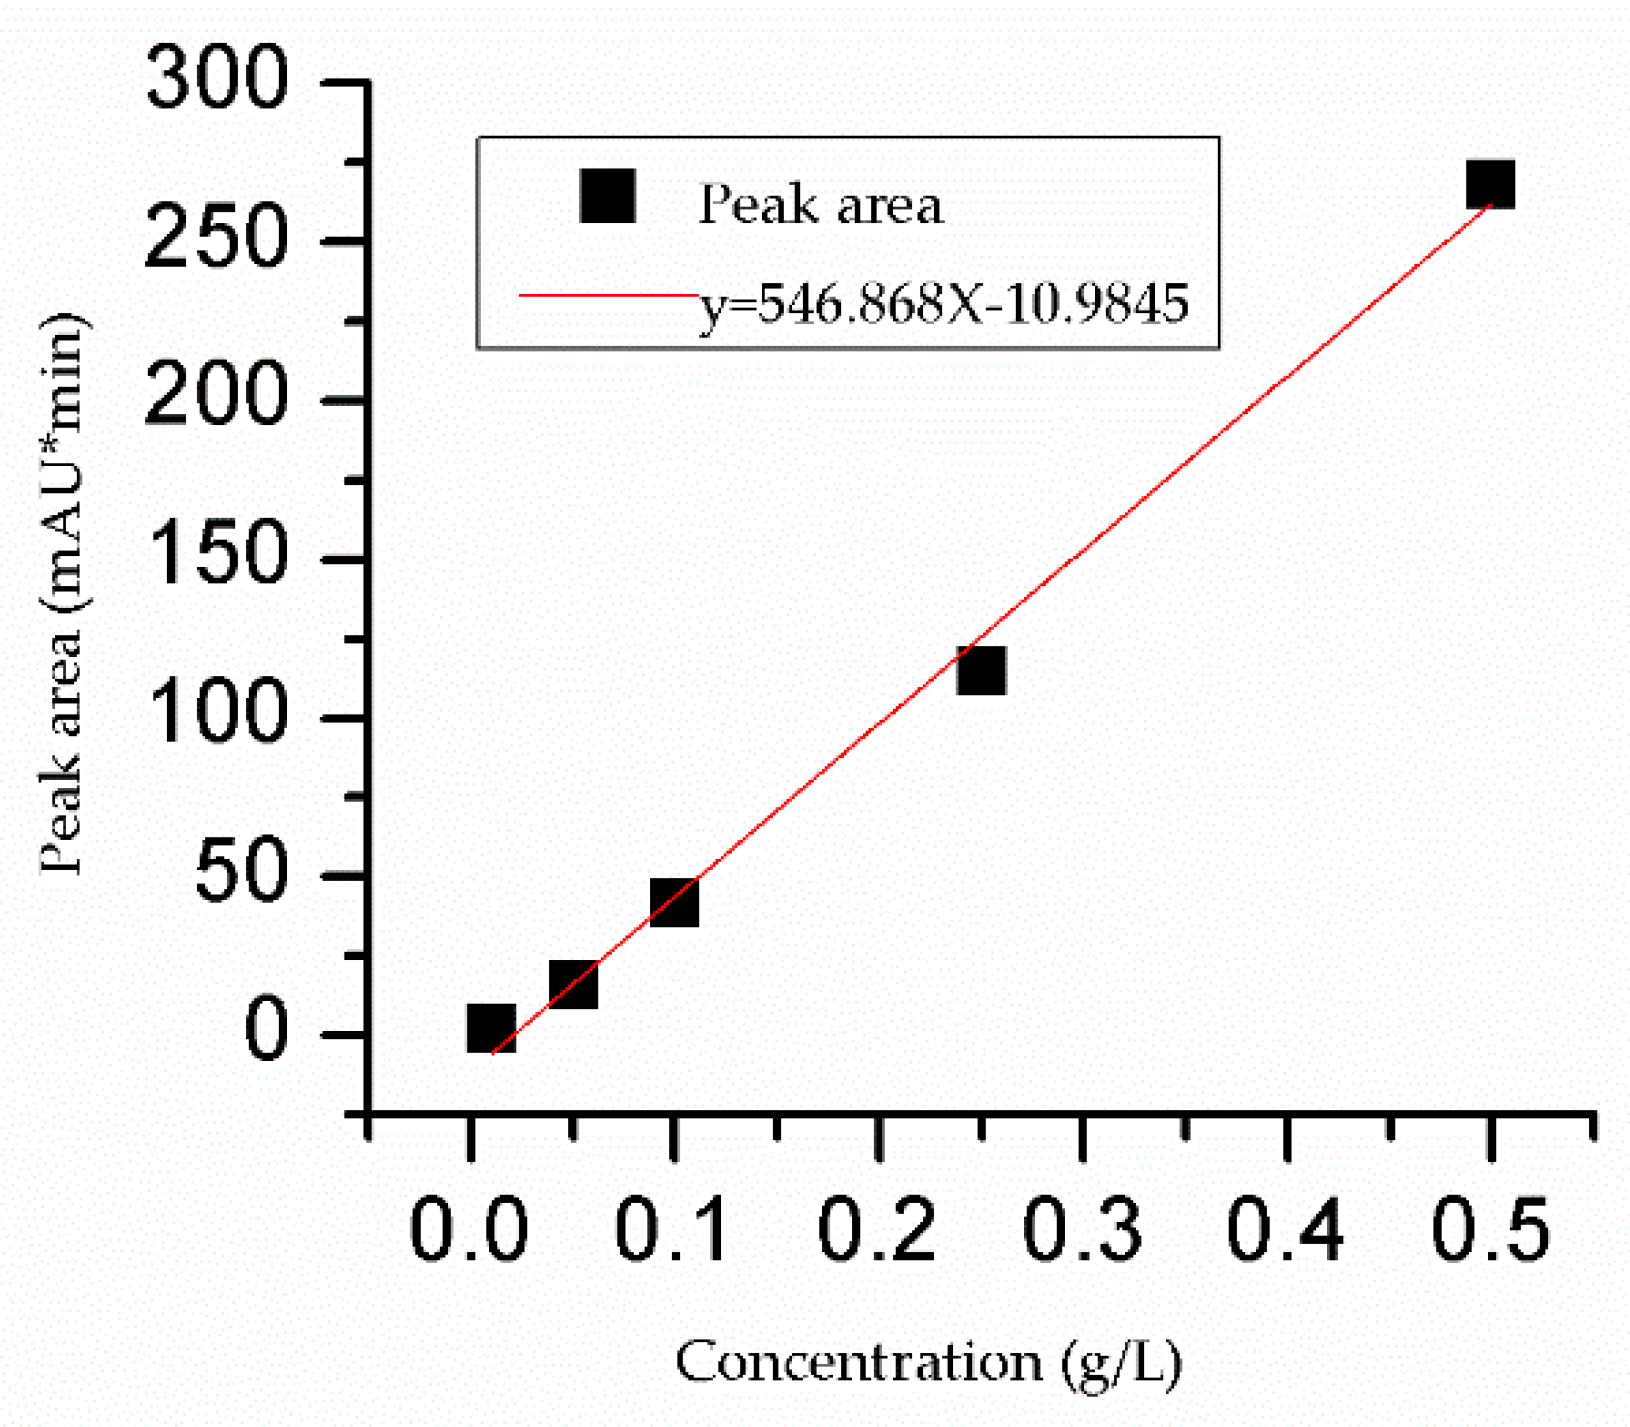
2.3. Preparation of Standard Curve

First, 0.050 g of solanesol dissolved in methanol was accurately weighed, and the volume was fixed to 100 mL to obtain 0.50 g/L of solanesol methanol solution. Solanesol methanol solutions of 0.50 g/L were accurately measured at 5.00, 2.00, 1.00, and 0.20 to 10 mL, respectively, and solanesol methanol solutions of 0.25, 0.1, 0.05, and 0.01 g/L were obtained. The concentration of solanesol was found to have a good linear relationship with the peak area between 0.01 and 0.5 g/L, R2 = 0.99399. The standard curve of solanesol in methanol solution is shown in Figure 2.

2.4. Synthesis of SSO-MIPs

A certain amount of solanesol was dissolved in functional monomers assisted via ultrasound and pre-polymerized for 12 h. The inhibitor was removed by vacuum distillation before EGDMA was used. Then, the mixtures of solanesol functional monomers and cross-linking agents were slowly dripped into an aqueous solution of an emulsifier (SDS:H2O = 40:15, mg:mL). They were emulsified at high-speed for 30 min and then stirred for 15 min with a certain amount of KPS. Then, N2 was purged into the reaction system for 15 min. After the reaction was finished, the emulsion was frozen for 6 h in the refrigerator and then demulsified at room temperature. After demulsification, the product was filtered and dried in a dryer. The dried polymer was added to dichloromethane and precipitated with n-hexane to remove some impurities. Finally, the polymer was eluted with methanol/glacial acetic acid (90:10, V:V) for 24 h; then, it was eluted with methanol for 6 h to remove excess hydrogen ions and finally put into a vacuum dryer for drying.
The preparation method of the non-molecularly imprinted polymers (NIPs) was the same as that of the SSO-MIPs, except that the solanesol template molecule was not added during the preparation process.
Table 1 presents the synthesis information of SSO-MIPs. Experiments 1, 2, 3, 4, 5, and 6 correspond to 3.2, 3.3, 3.4, 3.5, 3.6, and 3.7 of the Results and Discussions section, respectively.

2.5. Static Adsorption Experiment

A certain mass of solanesol dissolved in methanol was weighed as an adsorption solution, and 200 mg of SSO-MIPs was weighed and added into 40 mL of the adsorption solution. Then, it was stirred and adsorbed for 4 h at 30 °C, and the adsorbed mixed solution was then centrifuged for 30 min. The concentrations of solanesol in the solution before and after adsorption were detected via UHPLC. The adsorption amount of SSO-MIPs was calculated by the following formula:
Q = ( C 0 C ) V W ,
where C0 is the concentration of solanesol before adsorption, C is the concentration of solanesol after adsorption, V is the volume of the adsorption solution, and W is the mass of the SSO-MIPs.

2.6. Kinetic Experiment

First, 200 mg of SSO-MIPs or NIPs were added into 40 mL of 4 g/L solanesol methanol solution, and 0.2 mL of the mixed solution was taken at intervals. The volume was fixed to 2 mL, and the supernatant was taken by centrifugation. Then, the concentration was measured via UHPLC, and the adsorption amount was calculated. A quasi-first-order kinetic model and quasi-second-order kinetic model were used to analyze and fit the adsorption data.
The Lagergren quasi-first-order and quasi-second-order kinetic models are commonly used to analyze and simulate solid–liquid adsorption systems, and their model equations are respectively given as follows [23,24]:
ln ( Q e Q ) = lnQ e K 1 t ,
t Q = 1 K 2 Q e 2 + t Q e ,
where Qe is the adsorption amount when the adsorption reaches equilibrium, Q is the adsorption amount at any time, K1 is the adsorption rate constant of the Lagergren pseudo-first-order kinetic model, and K2 is the adsorption rate constant of the Lagergren pseudo-second-order kinetic model.

2.7. Adsorption Isotherm Detection

First, 200 mg of SSO-MIPs were weighed and placed in solanesol methanol solutions of different concentrations (0.2–4 g/L) and adsorbed at 30 °C. After 180 min, the concentrations of solanesol in the adsorbed solutions were detected via UHPLC, and the adsorption amounts were calculated.
The Scatchard model was used to analyze the thermodynamic behavior of SSO-MIPs adsorption, and its formula is as follows [25]:
Q e C = Q max Q e K d ,
where Qe is the equilibrium adsorption amount at different concentrations, Qmax is the maximum adsorption amount, C is the concentration of the adsorption solution, and Kd is the equilibrium dissociation constant of the binding site.

2.8. Experiment of Solanesol Purification by SSO-MIPs

The SSO-MIPs used in solanesol purification mainly includes three steps. The first step was to use n-hexane to extract solanesol from tobacco leaves to obtain solanesol extract solution. In the second step, 200 mg of SSO-MIPs was put into solanesol extract solution, and then adsorption for 3 h at 40 °C. Then, the SSO-MIPs were separated from the solanesol extract solution using a centrifuge. In the third step, SSO-MIPs was placed in a Soxhlet extractor and desorbed with methanol for 5 h at 50 °C. After desorption, the percentage of the solanesol peak area in desorption solution was detected by UHPLC, and the purity of solanesol was judged by the percentage of the peak area of solanesol. Five parallel experiments were conducted.

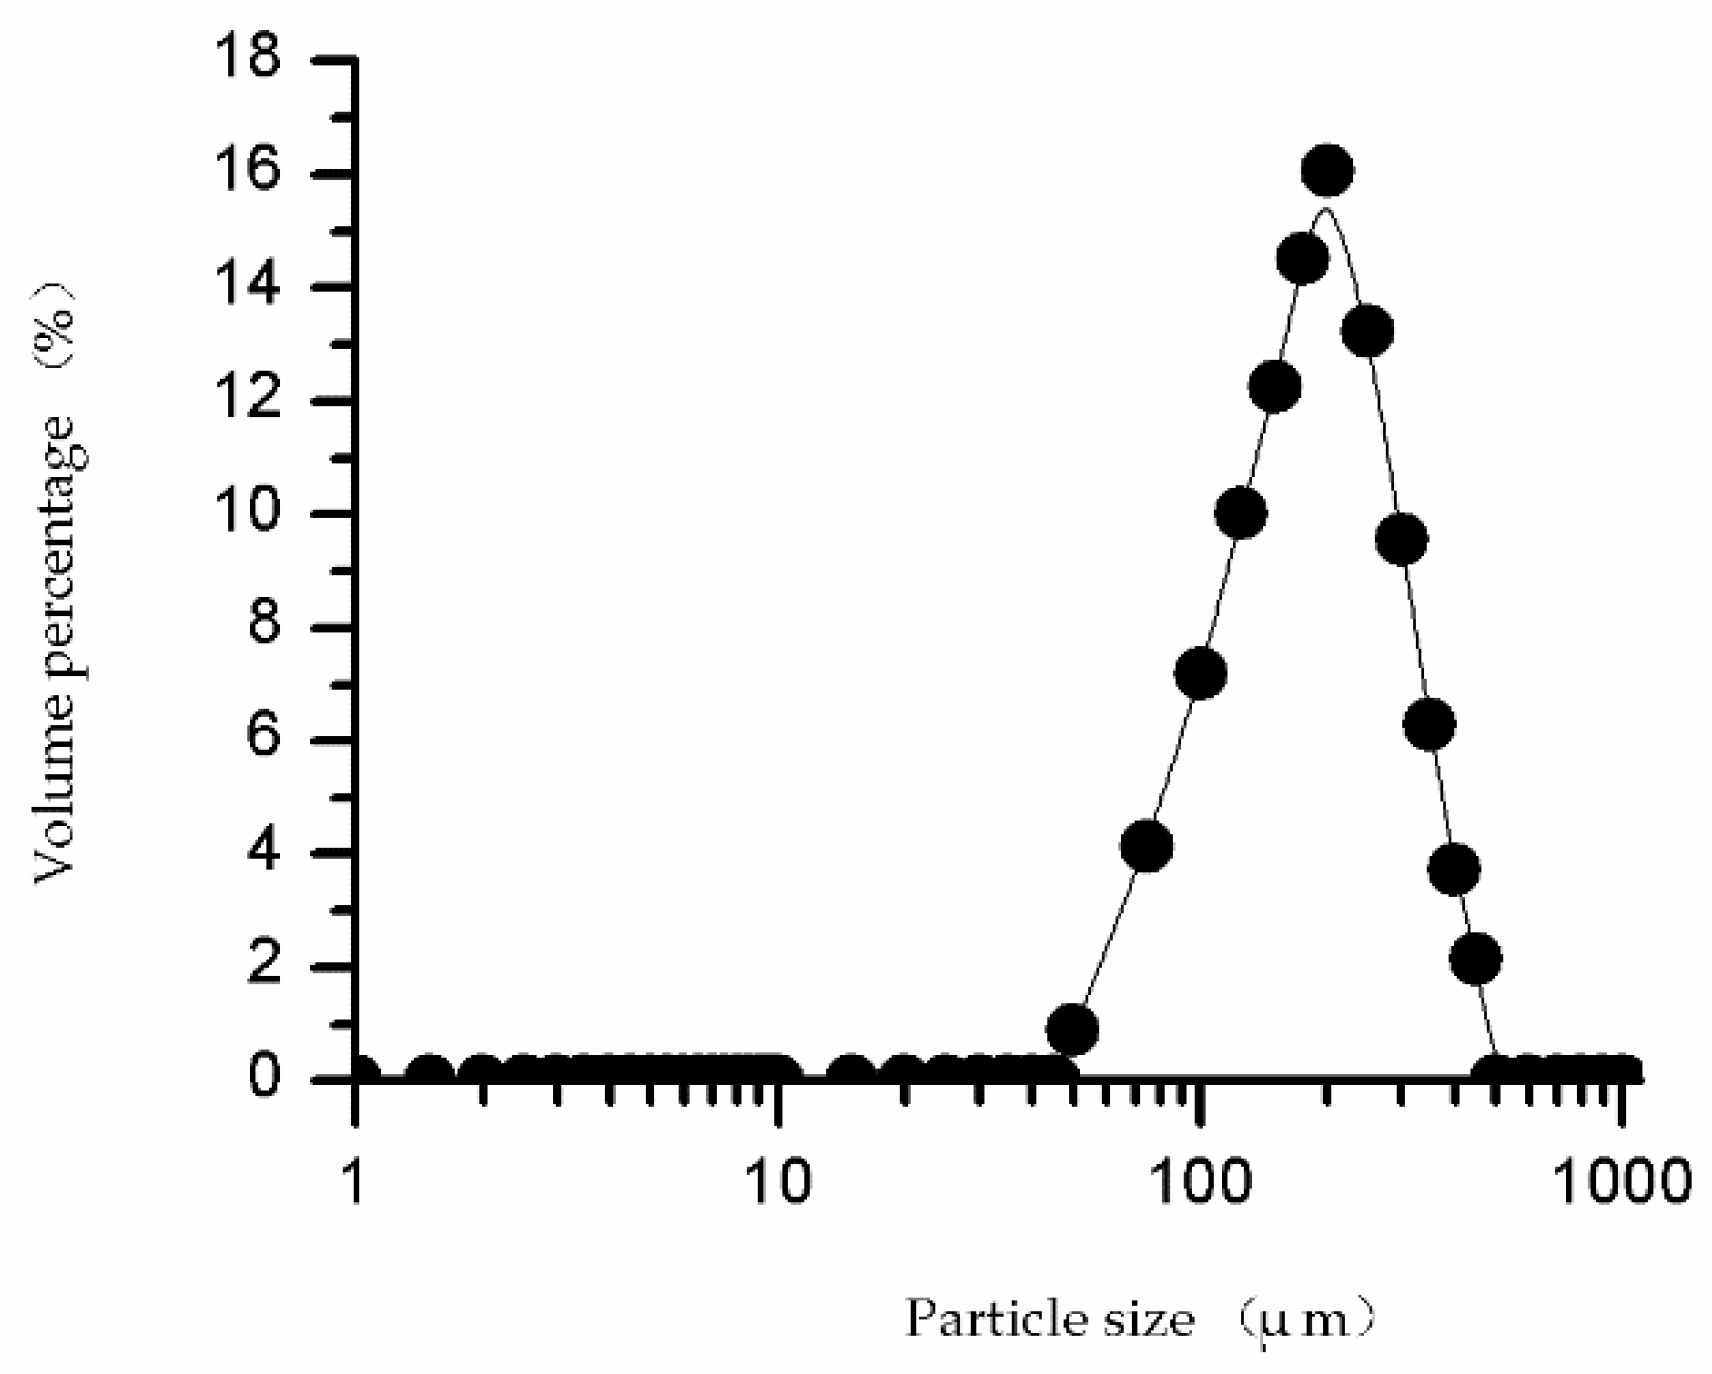
2.9. Particle Size and Pore Volume of SSO-MIPs Detection

SSO-MIPs used for detection were synthesized under optimized conditions. An appropriate amount of SSO-MIPs was dispersed in deionized water, and ultrasonic-assisted dispersion was used for 30 s. Then, the SSO-MIPs particle size was analyzed automatically by a laser particle size analyzer. The SSO-MIPs pore volume determination conditions are as follows: N2 was used as adsorption and desorption gas, SSO-MIPs was heated at 60 °C for 60 min under 3 Torr, the degas temperature was 60 °C, and the degassing time was 4 h. Under the above conditions, the pore volume of SSO-MIPs was detected by a fully automatic gas adsorption and detection system.

3. Results and Discussions

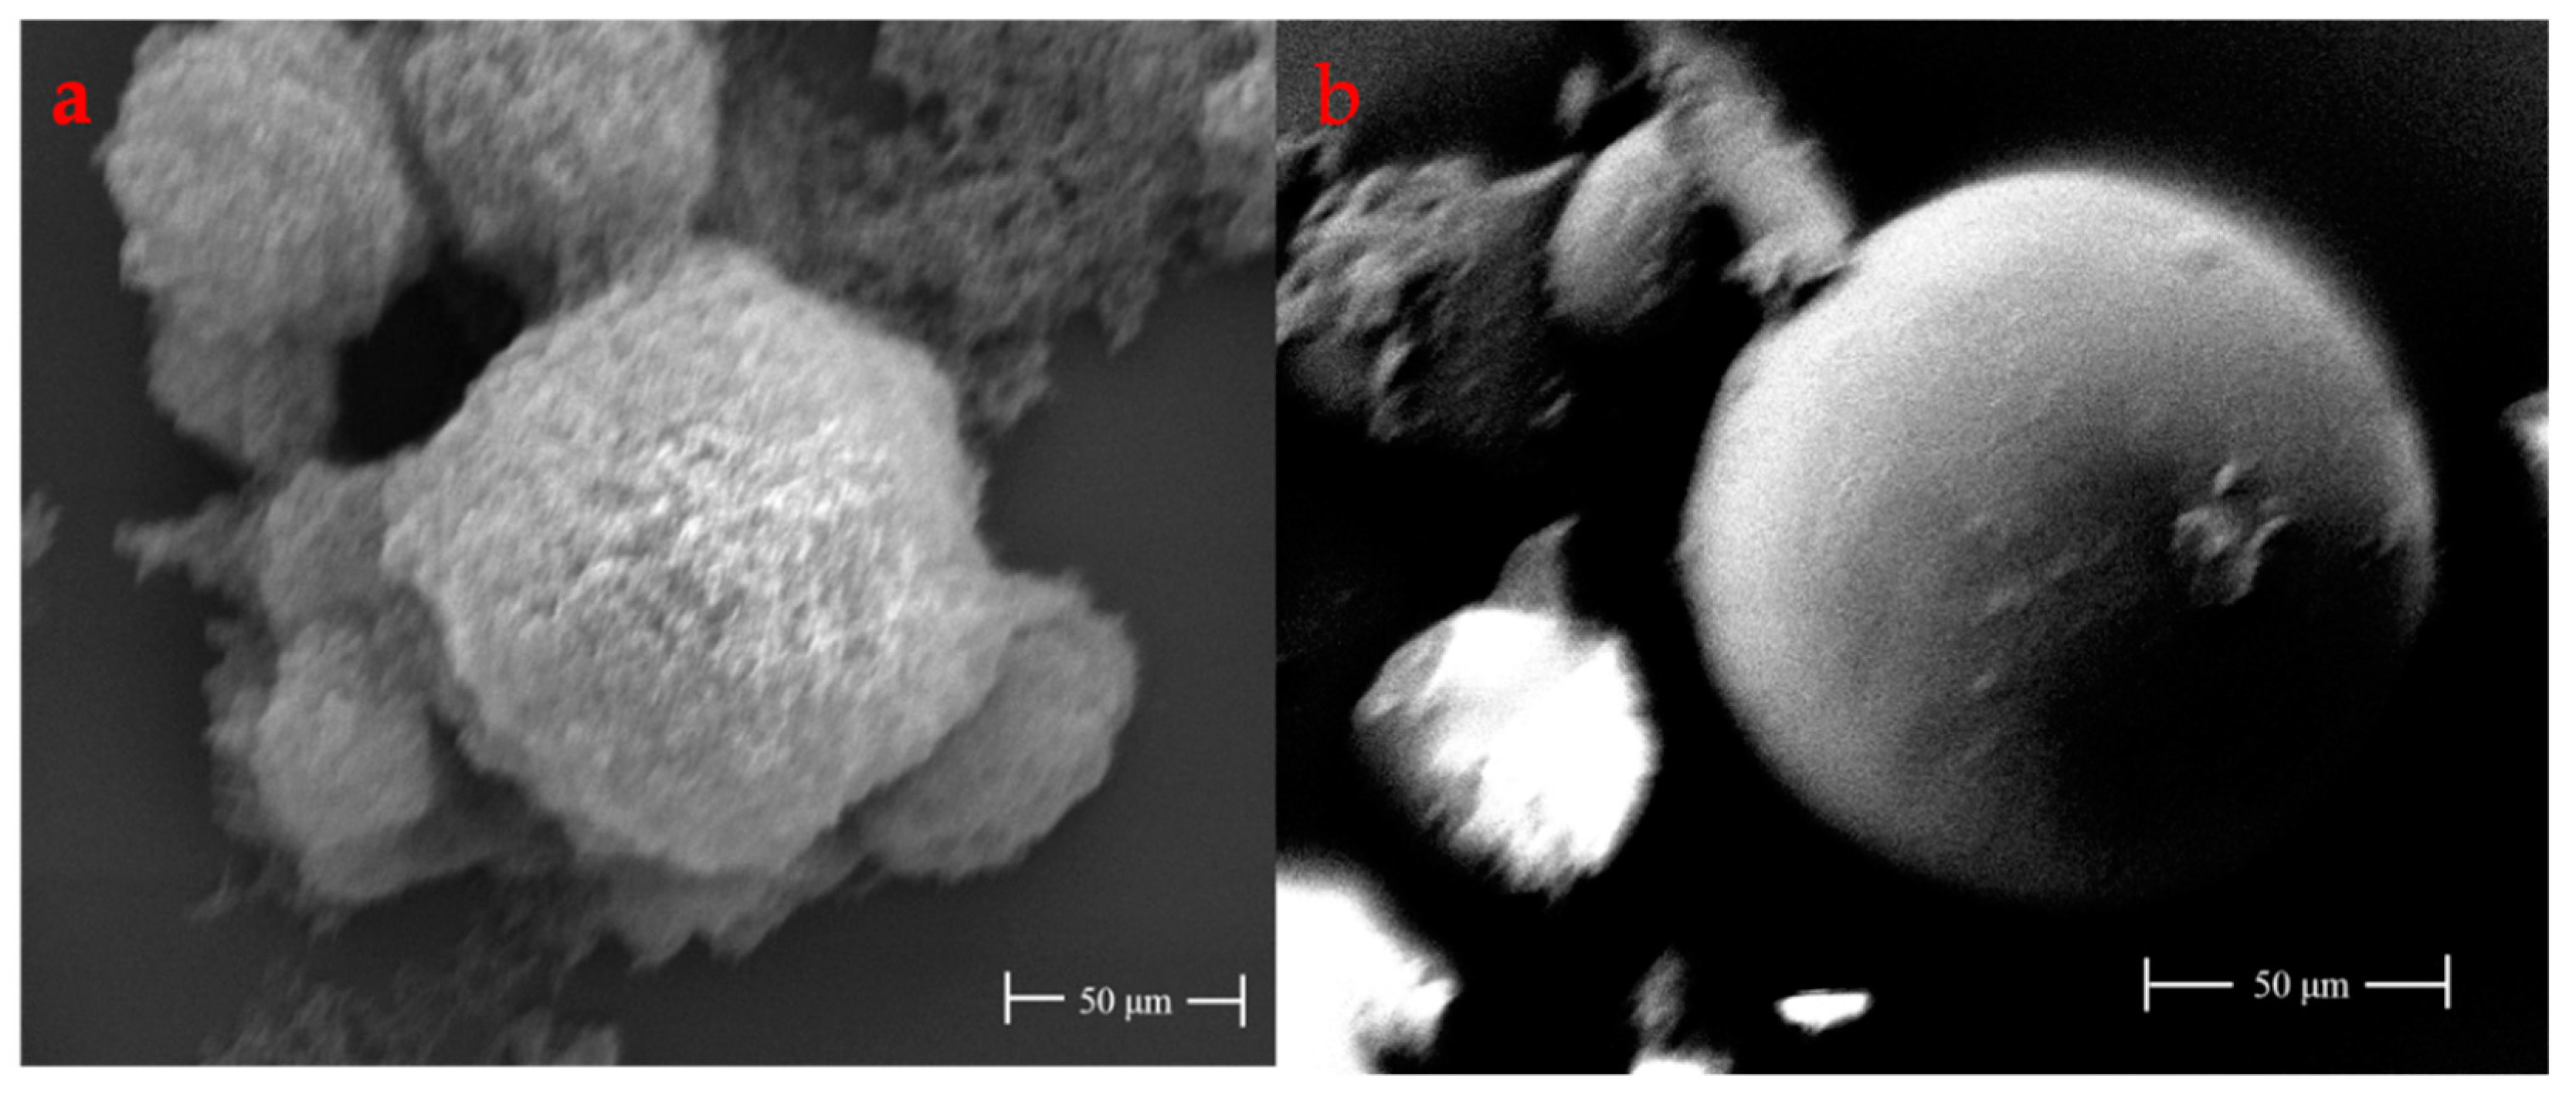
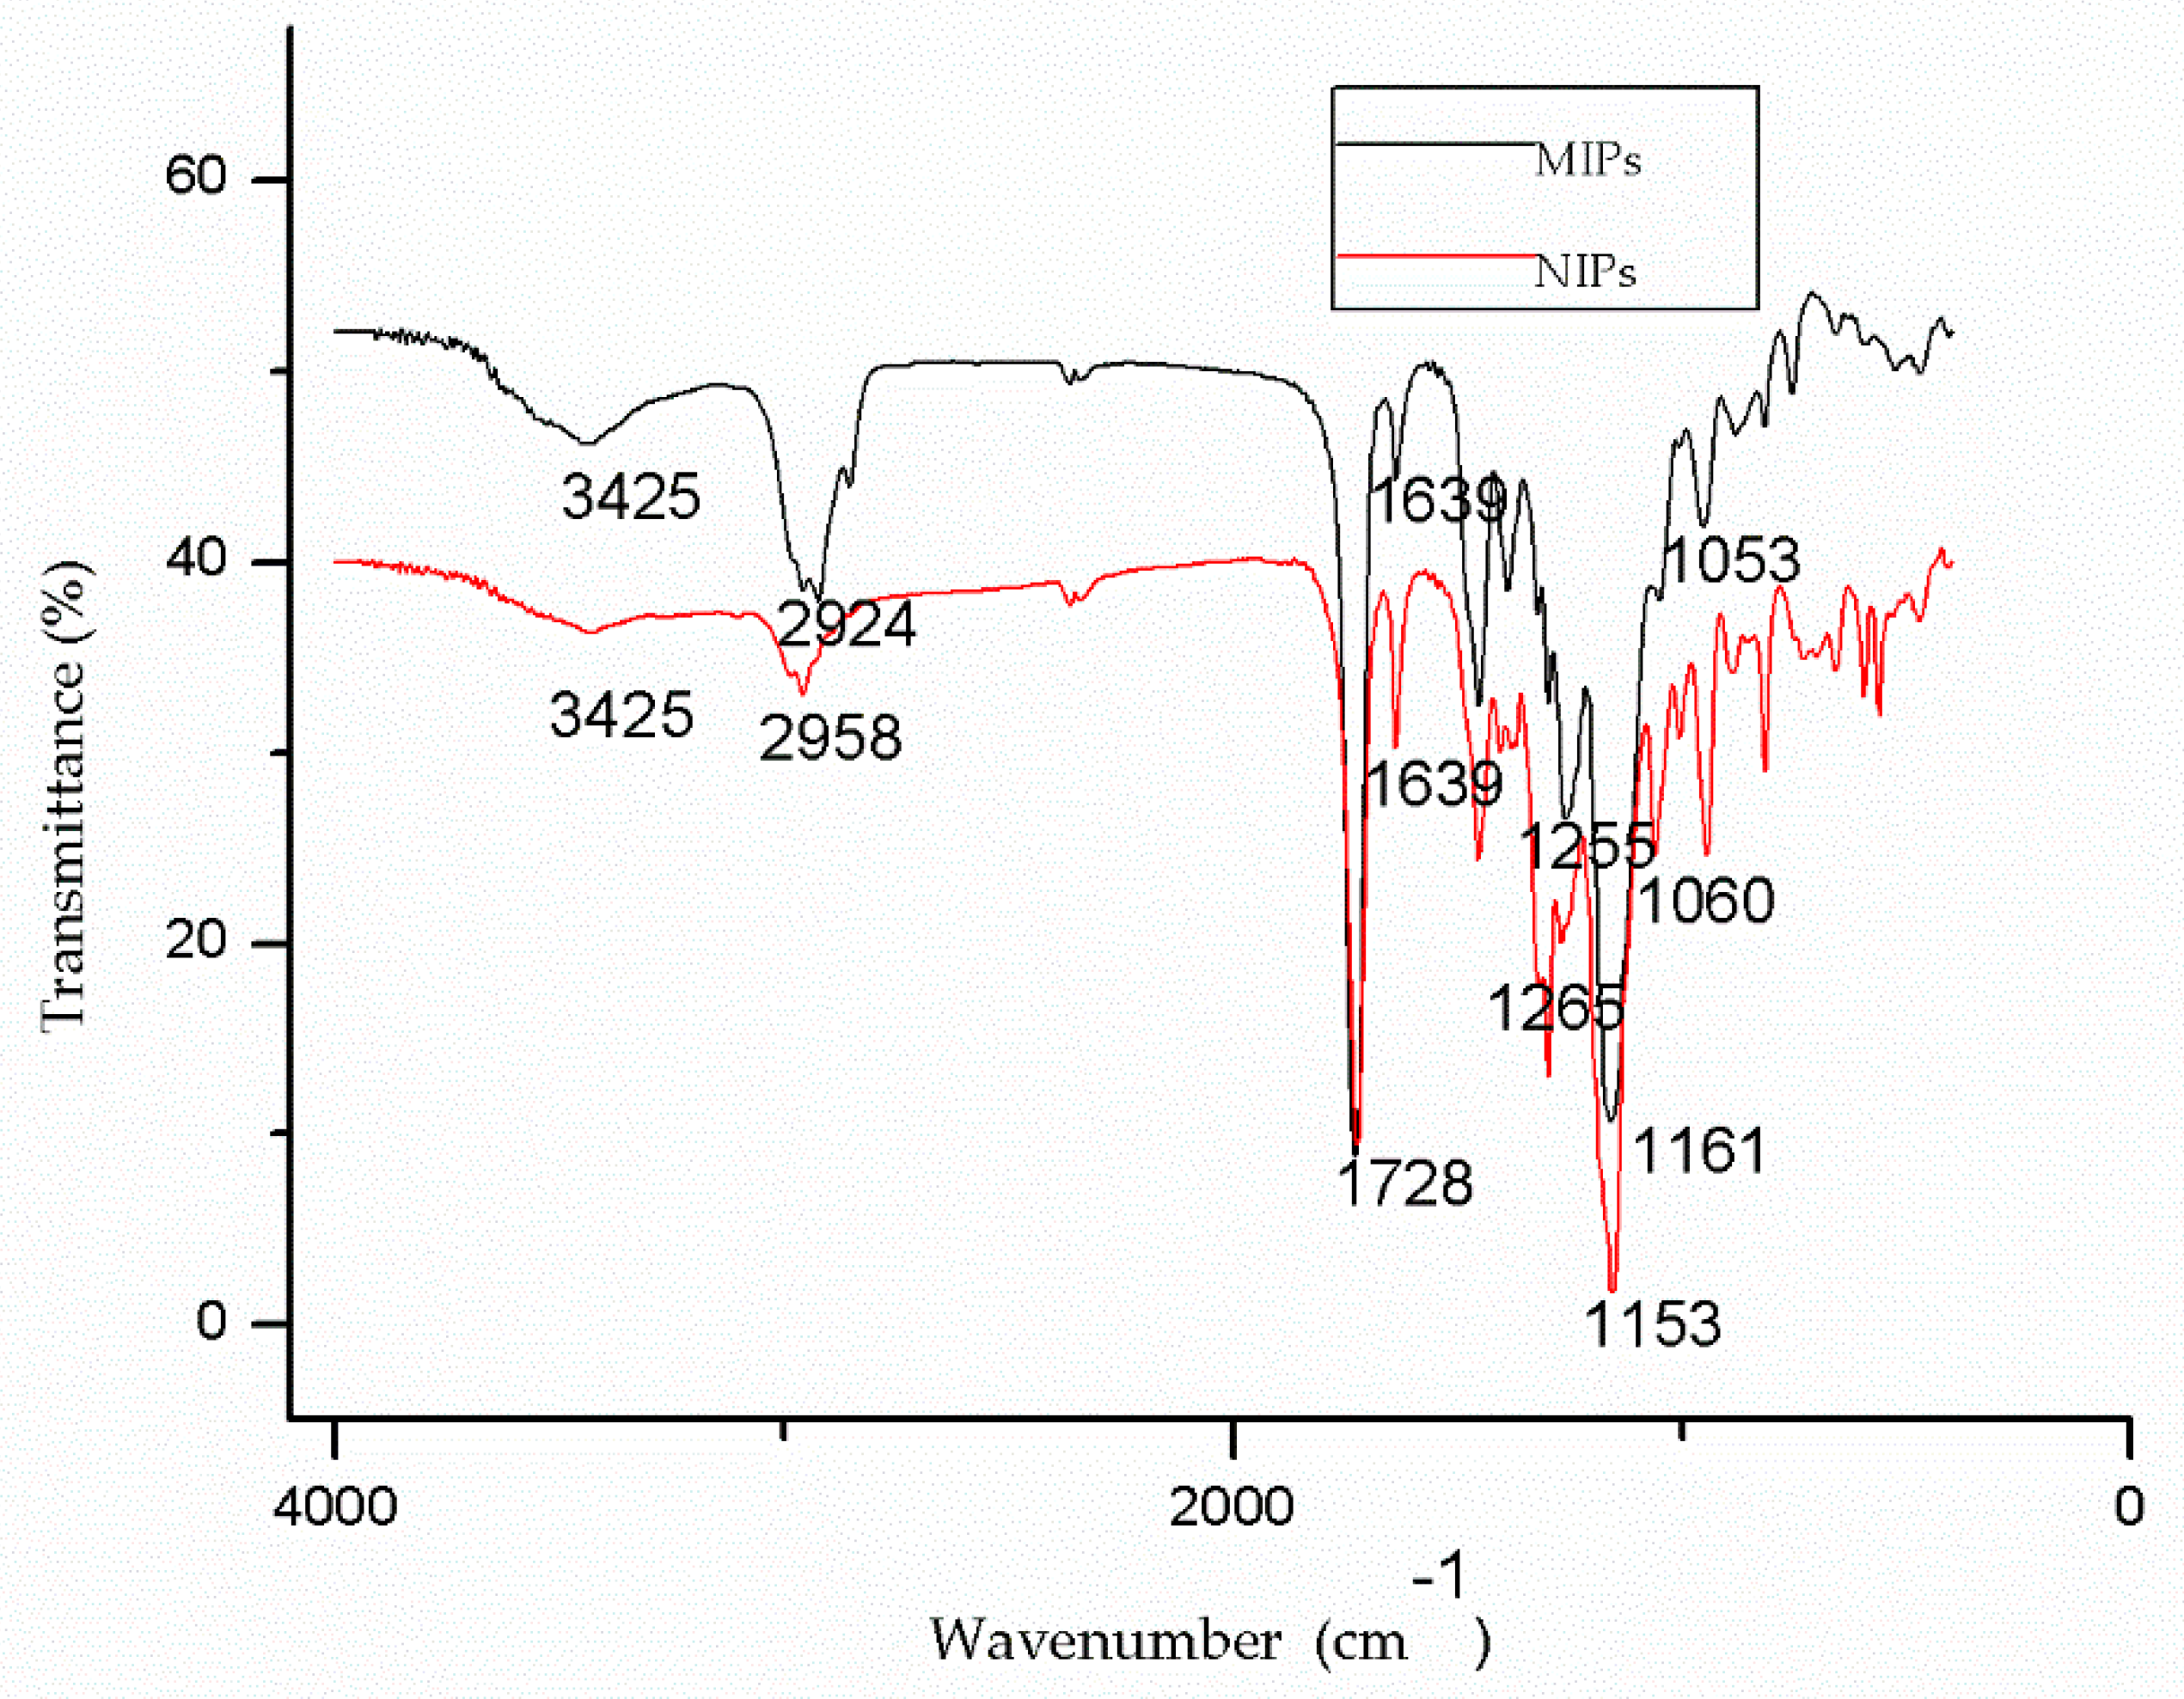
3.1. Characterization of SSO-MIPs and NIPs

The polymers were characterized by field emission gun scanning electron microscopy. As depicted in Figure 3, spherical polymers can be synthesized by the emulsion polymer method. Moreover, MIPs surface are rougher than NIPs, which is due to the template molecules in the MIPs being removed by elution to leave stereo holes. The particle size of the SSO-MIPs was analyzed by a laser particle size analyzer, SSO-MIPs were synthesized under the optimal synthesis conditions, and the results are shown in Figure 4. The figure shows that SSO-MIPs are distributed in 50–500 μm, and SSO-MIPs in 125–300 μm accounts for nearly 76%.
Figure 5 reveals the Fourier transform infrared (FT-IR ) of MIPs and NIPs, the absorption around 1728 cm−1 and 1639 cm−1 corresponded to the stretch vibration of C=O and C=C double bond, respectively [26,27], which indicates the presence of MMA in the MIPs and NIPs. In the NIPs, there was a -CH3 stretch vibration at 2958 cm−1, while in the MIPs, the position of this stretch vibration was shifted to 2924 cm−1. In addition, by comparing the stretch vibration of the MIPs and NIPs, it can be determined that the stretch vibration at 1255 cm−1, 1161 cm−1, and 1053 cm−1 in the MIPs respectively moved to 1265 cm−1, 1153 cm−1, and 1060 cm−1, which indicates that the structures of the MIPs and NIPs were different; this was also reported by Long [21].

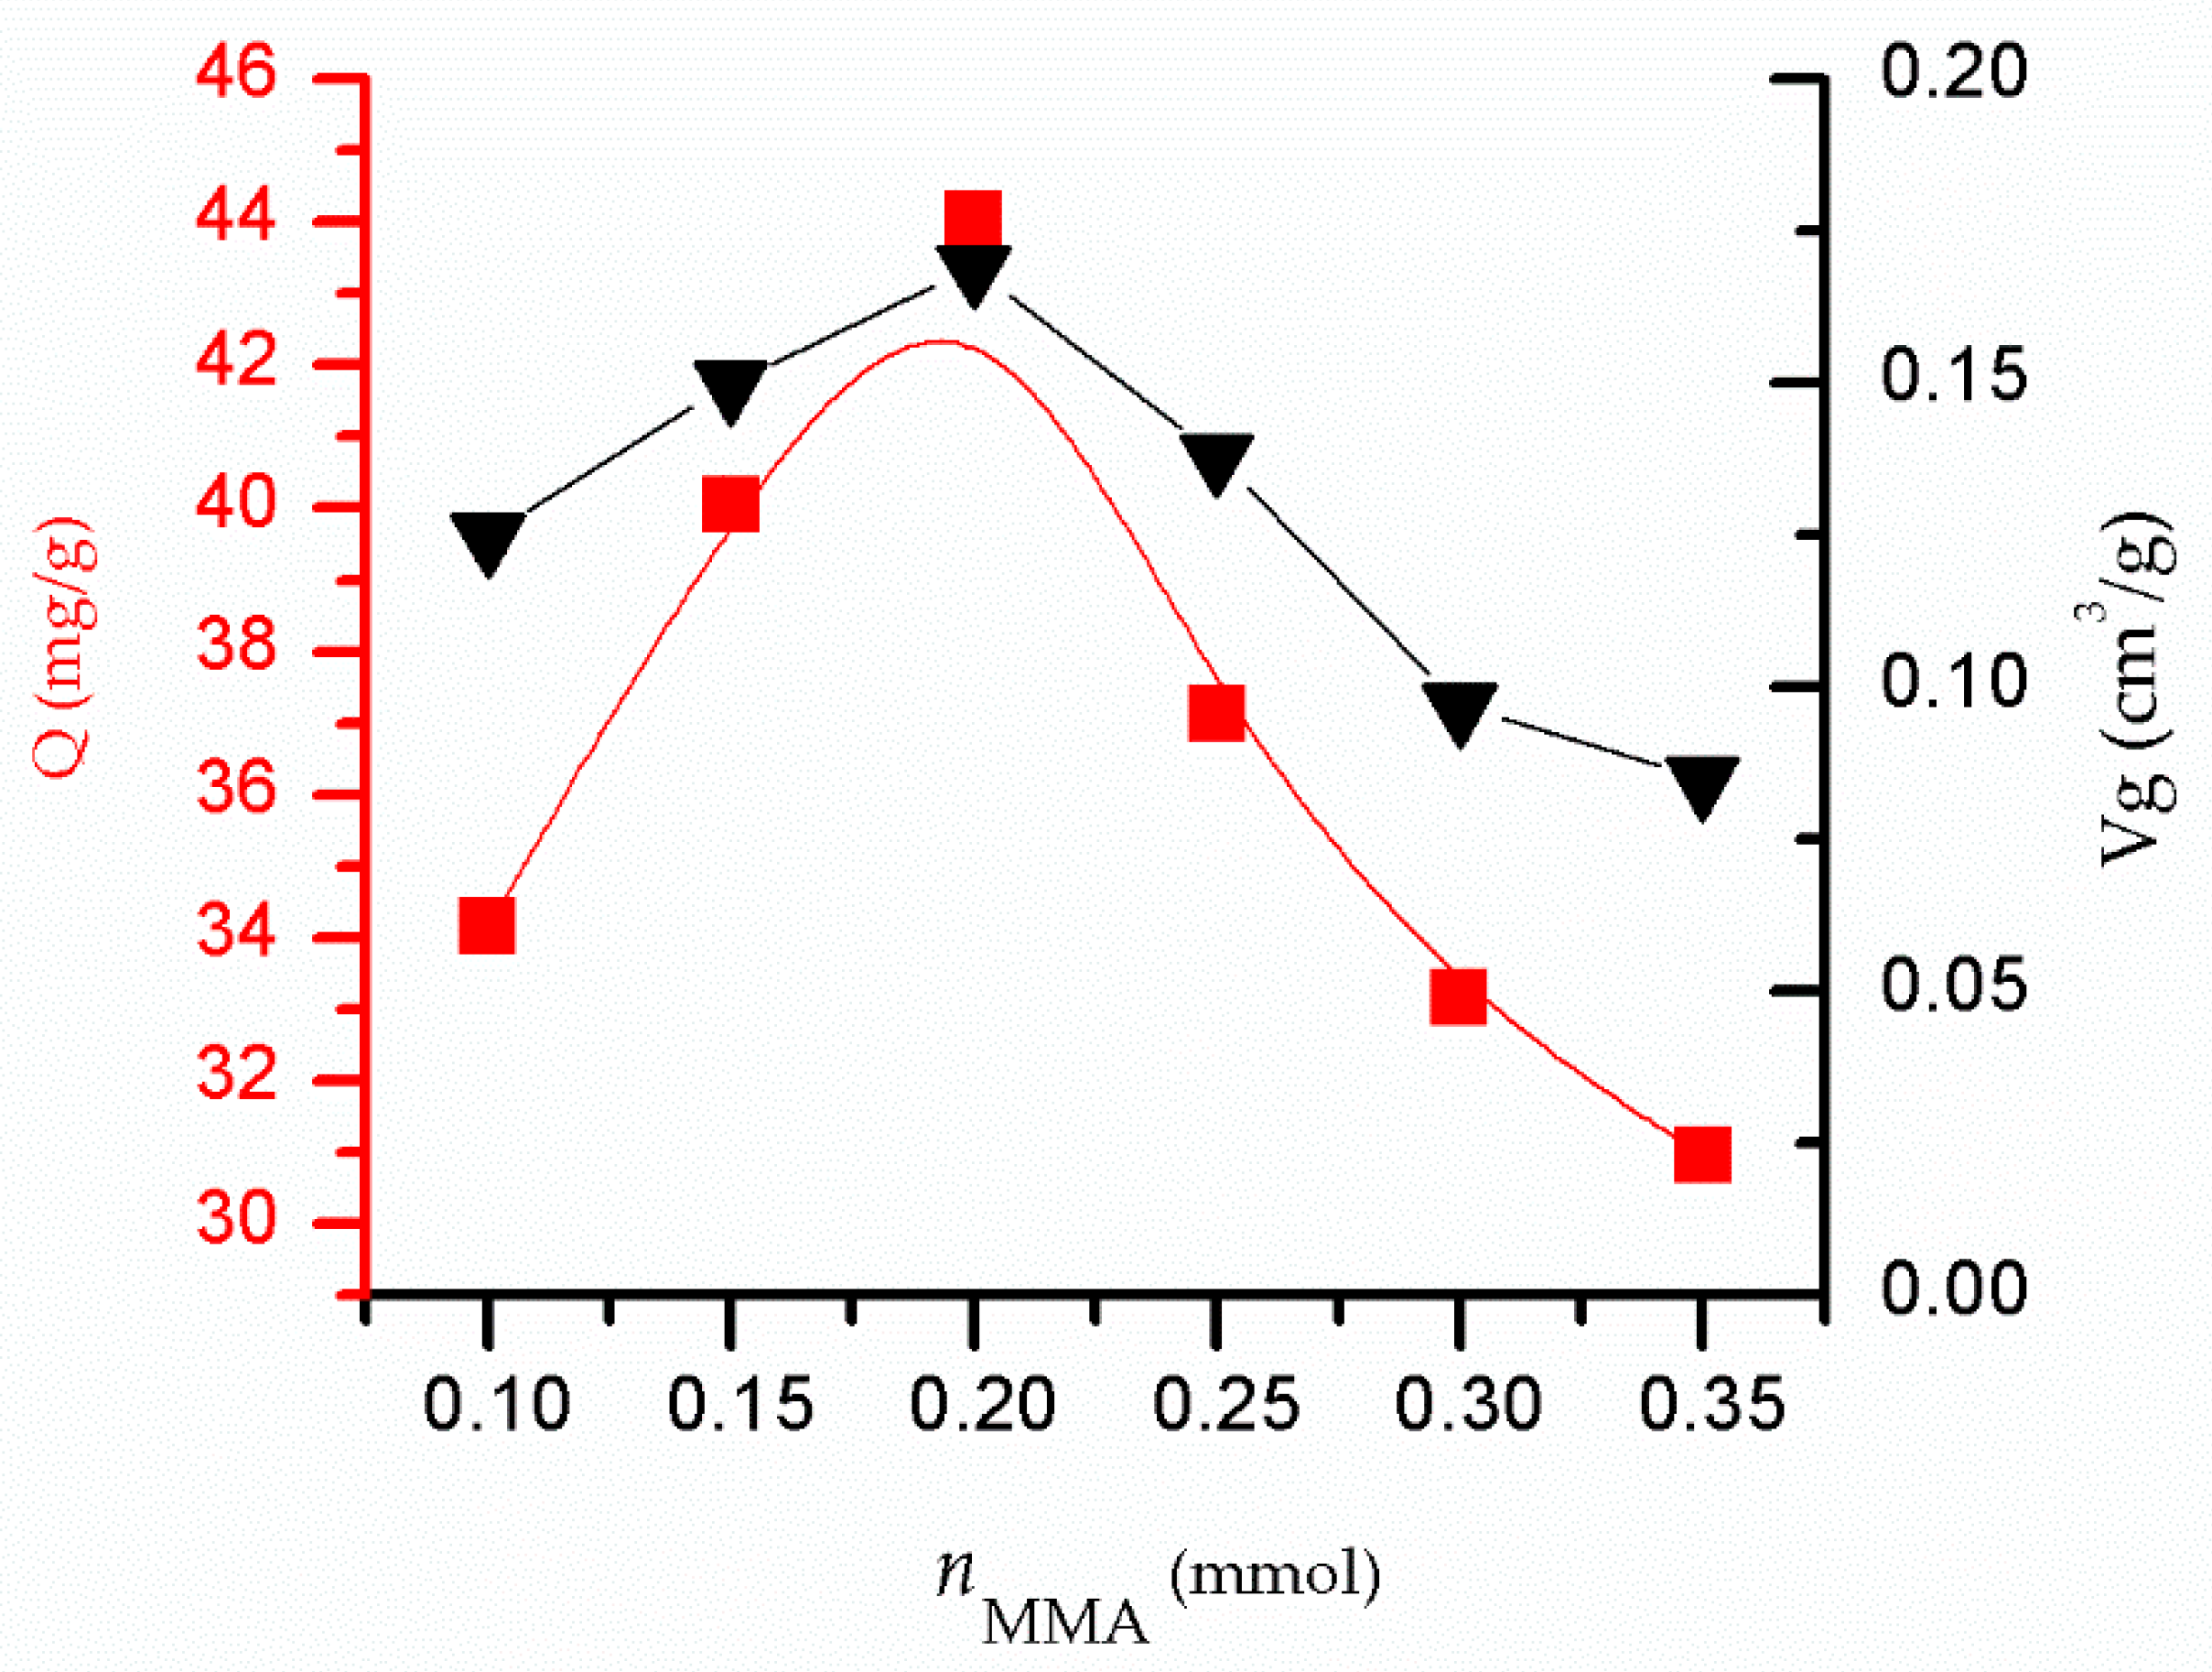
3.2. Influence of nMMA on the Adsorption Performance of MIPs
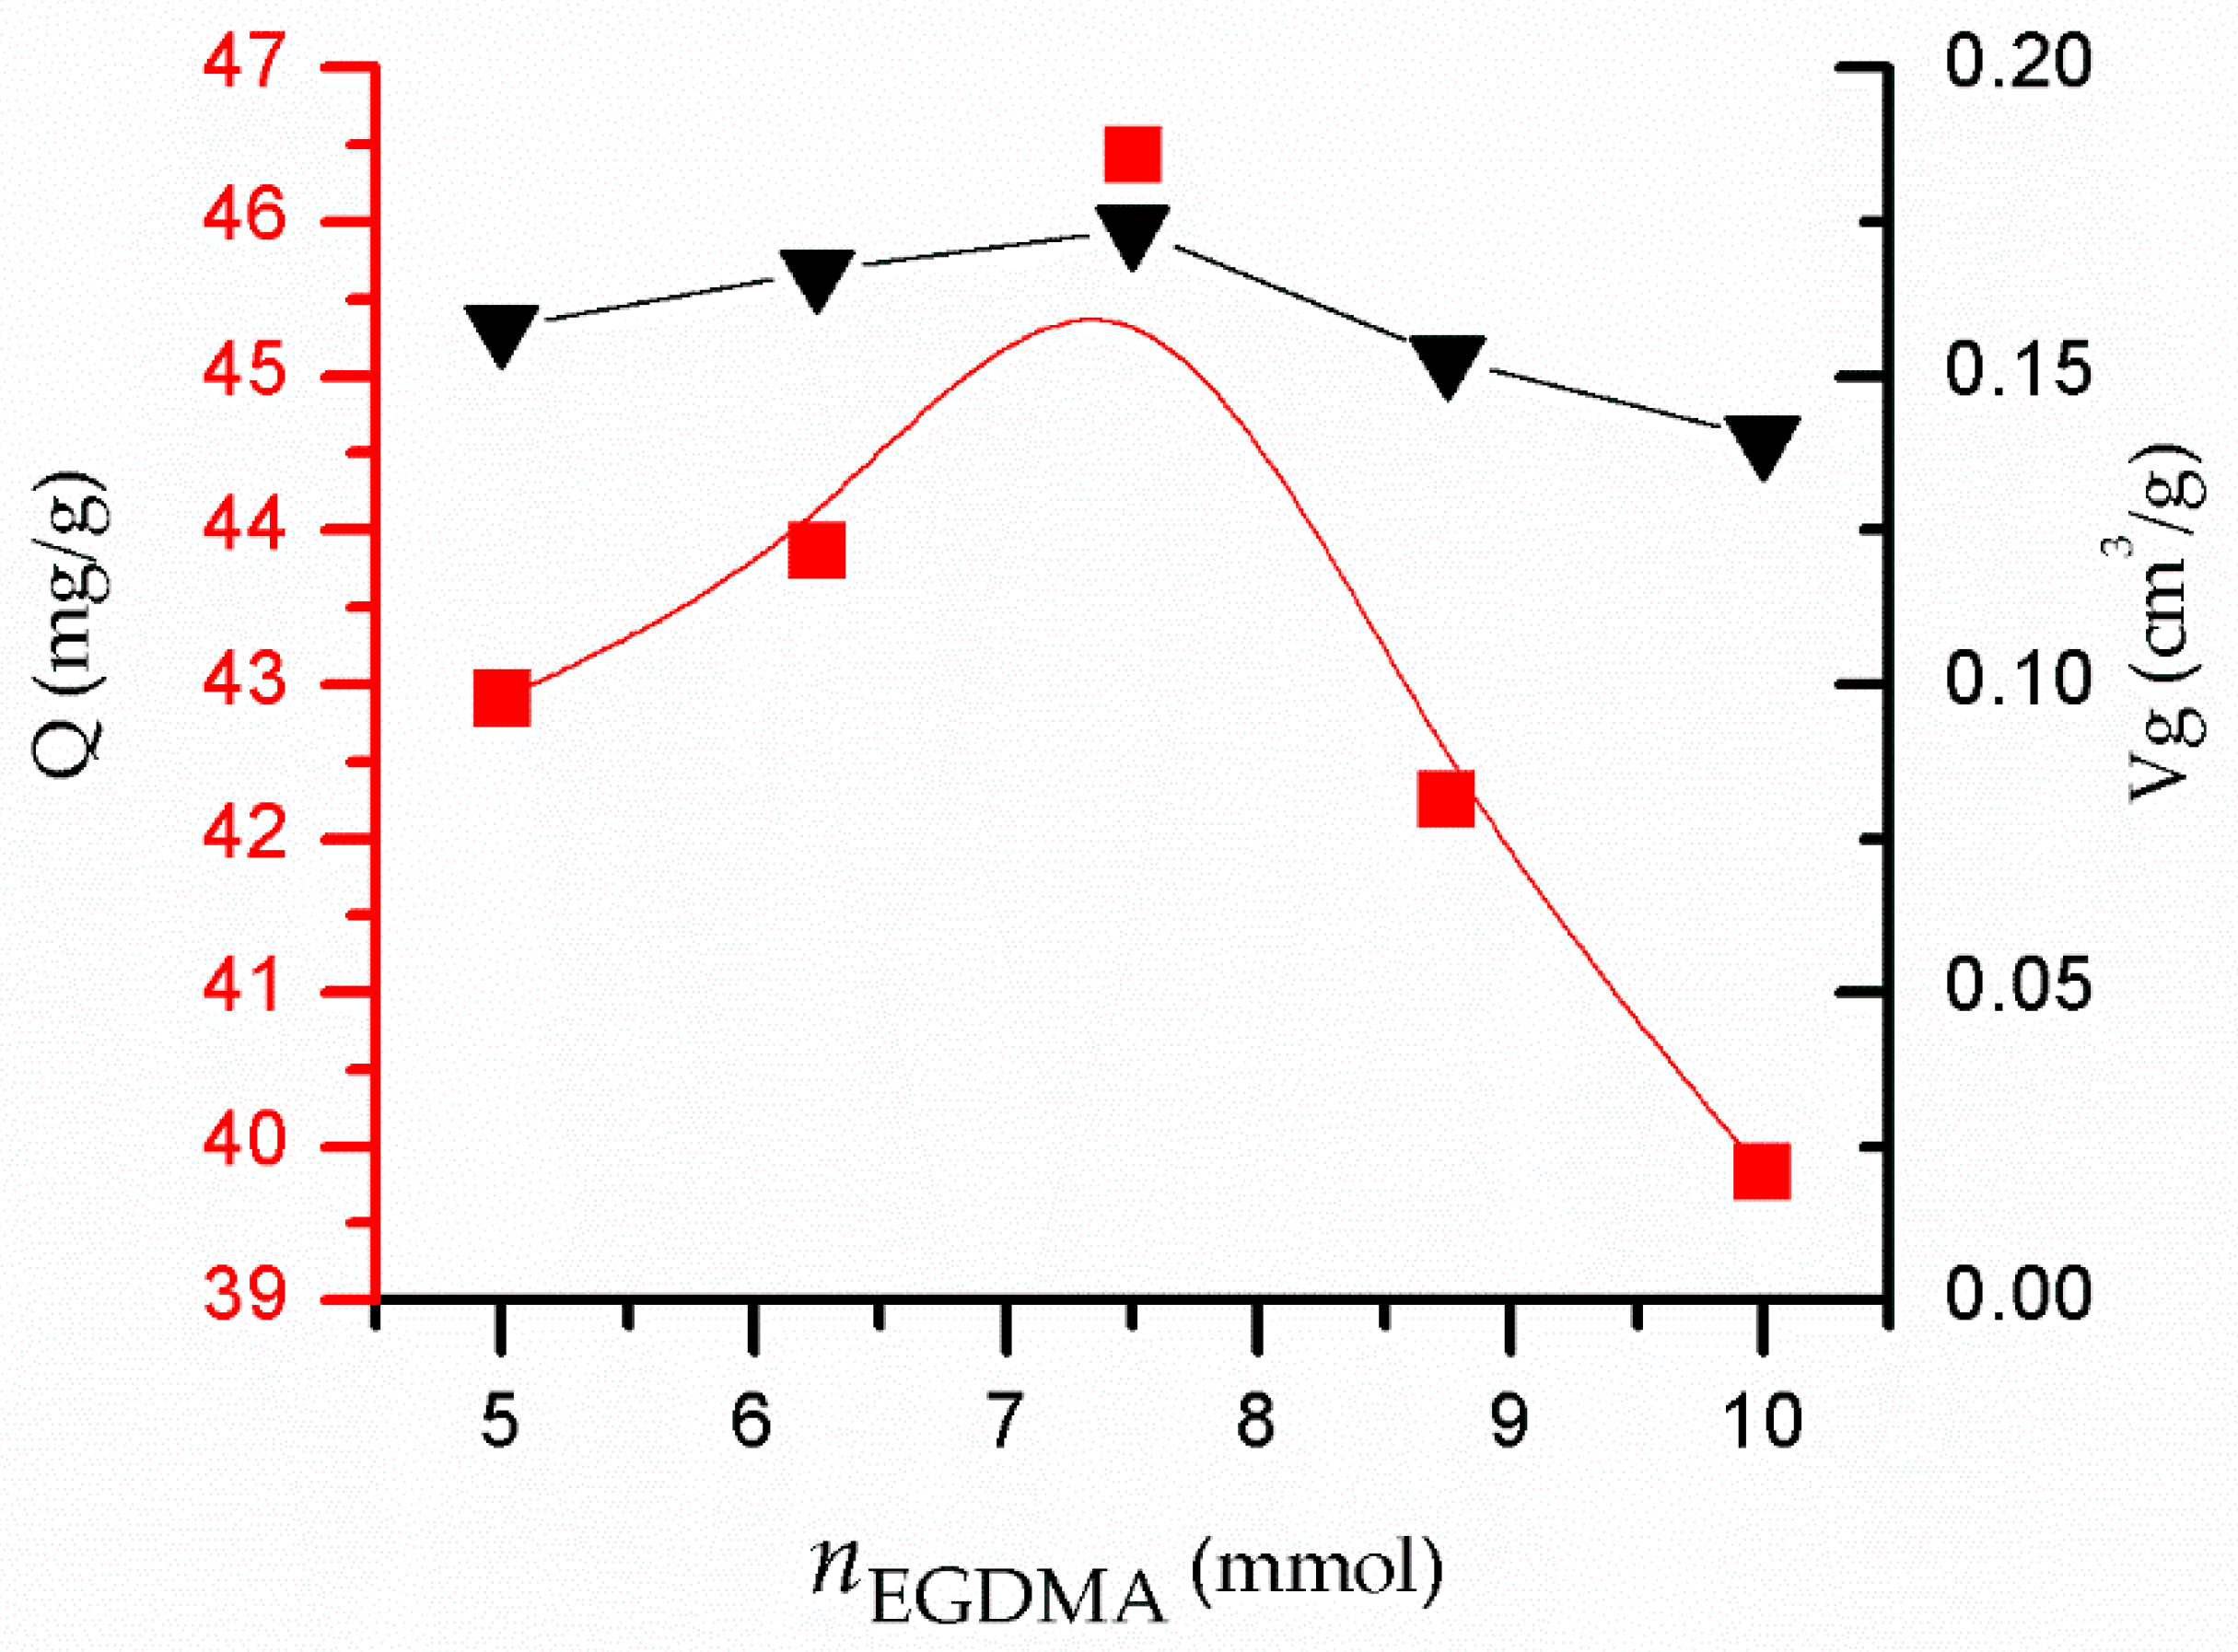
Figure 6 presents a graph that reveals the effect of the variation of the amount of functional monomers on the adsorption performance of the polymer, wherein the amount of solanesol was 0.025 mmol, the amount of cross-linking agent was 6.25 mmol, the amount of KPS was 8 mg, and the synthesis temperature was 65 °C. It is evident that with the increase of the amount of functional monomer from 0.1 mmol to 0.35 mmol, the adsorption capacity of the SSO-MIPs first increased and then decreased. When the amount of functional monomer was 0.20 mmol, the adsorption capacity of the SSO-MIPs reached the maximum. This is because the amount of functional monomers was low, which resulted in the inability of some solanesol to participate in polymer formation; additionally, SSO-MIPs have low adsorption capacity because fewer stereo holes in the formed polymers can coordinate with solanesol. The figure of the pore volume also shows that there are fewer stereo holes. When the amount of the functional monomer increased, more solanesol was combined with the functional monomer to form a large amount of stable SSO-MIPs, thus increasing the adsorption capacity. The continued increase of the amount of functional monomers resulted in the excess of functional monomers, which were randomly arranged in the polymer. Therefore, SSO-MIPs were mixed with a large number of functional monomers, which leads to a decrease in pore volume and a decrease in adsorption effect.

3.3. Influence of n E G D M A on the Adsorption Performance of MIPs

Figure 7 reveals the effect of the variation of the amount of cross-linking agent on the adsorption performance of the polymer, wherein the amount of solanesol was 0.025 mmol, the amount of MMA was 0.2 mmol, the amount of KPS was 8 mg, and the synthesis temperature was 65 °C. It is evident that the adsorption capacity of the SSO-MIPs first increased and then decreased with the increase in the amount of cross-linking agent from 5 to 10 mmol. When the amount of cross-linking agent was 7.5 mmol, the adsorption capacity of the SSO-MIPs reached the maximum. This is because the SSO-MIPs have a lower cross-linking degree when the dosage of the cross-linking agent is low; the stability of the formed cavity structure is poor and can easily deform during the extraction process, thereby reducing the recognition ability and ultimately the adsorption ability. With the increase of the dosage of the cross-linking agent, the cross-linking degree of the polymer increased, the stability of the hole structure was improved, and the adsorption capacity was increased. The further increase of the dosage of the cross-linking agent will cause the difficulty of the template molecule to be eluted [28], which will lead to the decrease of pore volume in SSO-MIPs after elution. Even in the process of elution, the stereo holes deform, thereby decreasing the adsorption capacity. The figure of the pore volume confirms this point.

3.4. Influence of the Initiator Dosage on the Adsorption Performance of SSO-MIPs

Figure 8 presents a graph that reveals the effect of the variation of the dosage of the initiator on the adsorption performance of the polymer, wherein the amount of solanesol was 0.025 mmol, the amount of MMA was 0.2 mmol, the amount of cross-linking agent was 7.5 mmol, and the synthesis temperature was 65 °C. It is evident that with the increase of the initiator dosage from 8 to 16 mg, the adsorption capacity of the SSO-MIPs first increased and then decreased. When the amount of initiator was 10 mg, the adsorption capacity of the SSO-MIPs reached the maximum. This is because when the initiator content is low, fewer free radicals are produced by decomposition, resulting in a low initiation efficiency. When the content of the initiator increases gradually, the initiation efficiency increases. However, when the content of the initiator is too high, the free radical generation rate is too fast, resulting in a high content that will lead to a rapid emulsion polymerization process and ultimately the reduction of the stability of the emulsion [29]. From the pore volume graph, the pore volume is consistent with the adsorption effect trend, which indicates that the initiator may indirectly affect the pore volume or pore structure. The initiator affects the synthesis rate and emulsion stability to a great extent. Increasing the amount of initiator will lead to polymer aggregation, which will lead to difficult elution of template molecules. Therefore, the pore volume of SSO-MIPs decreases and its adsorption capacity decreases.

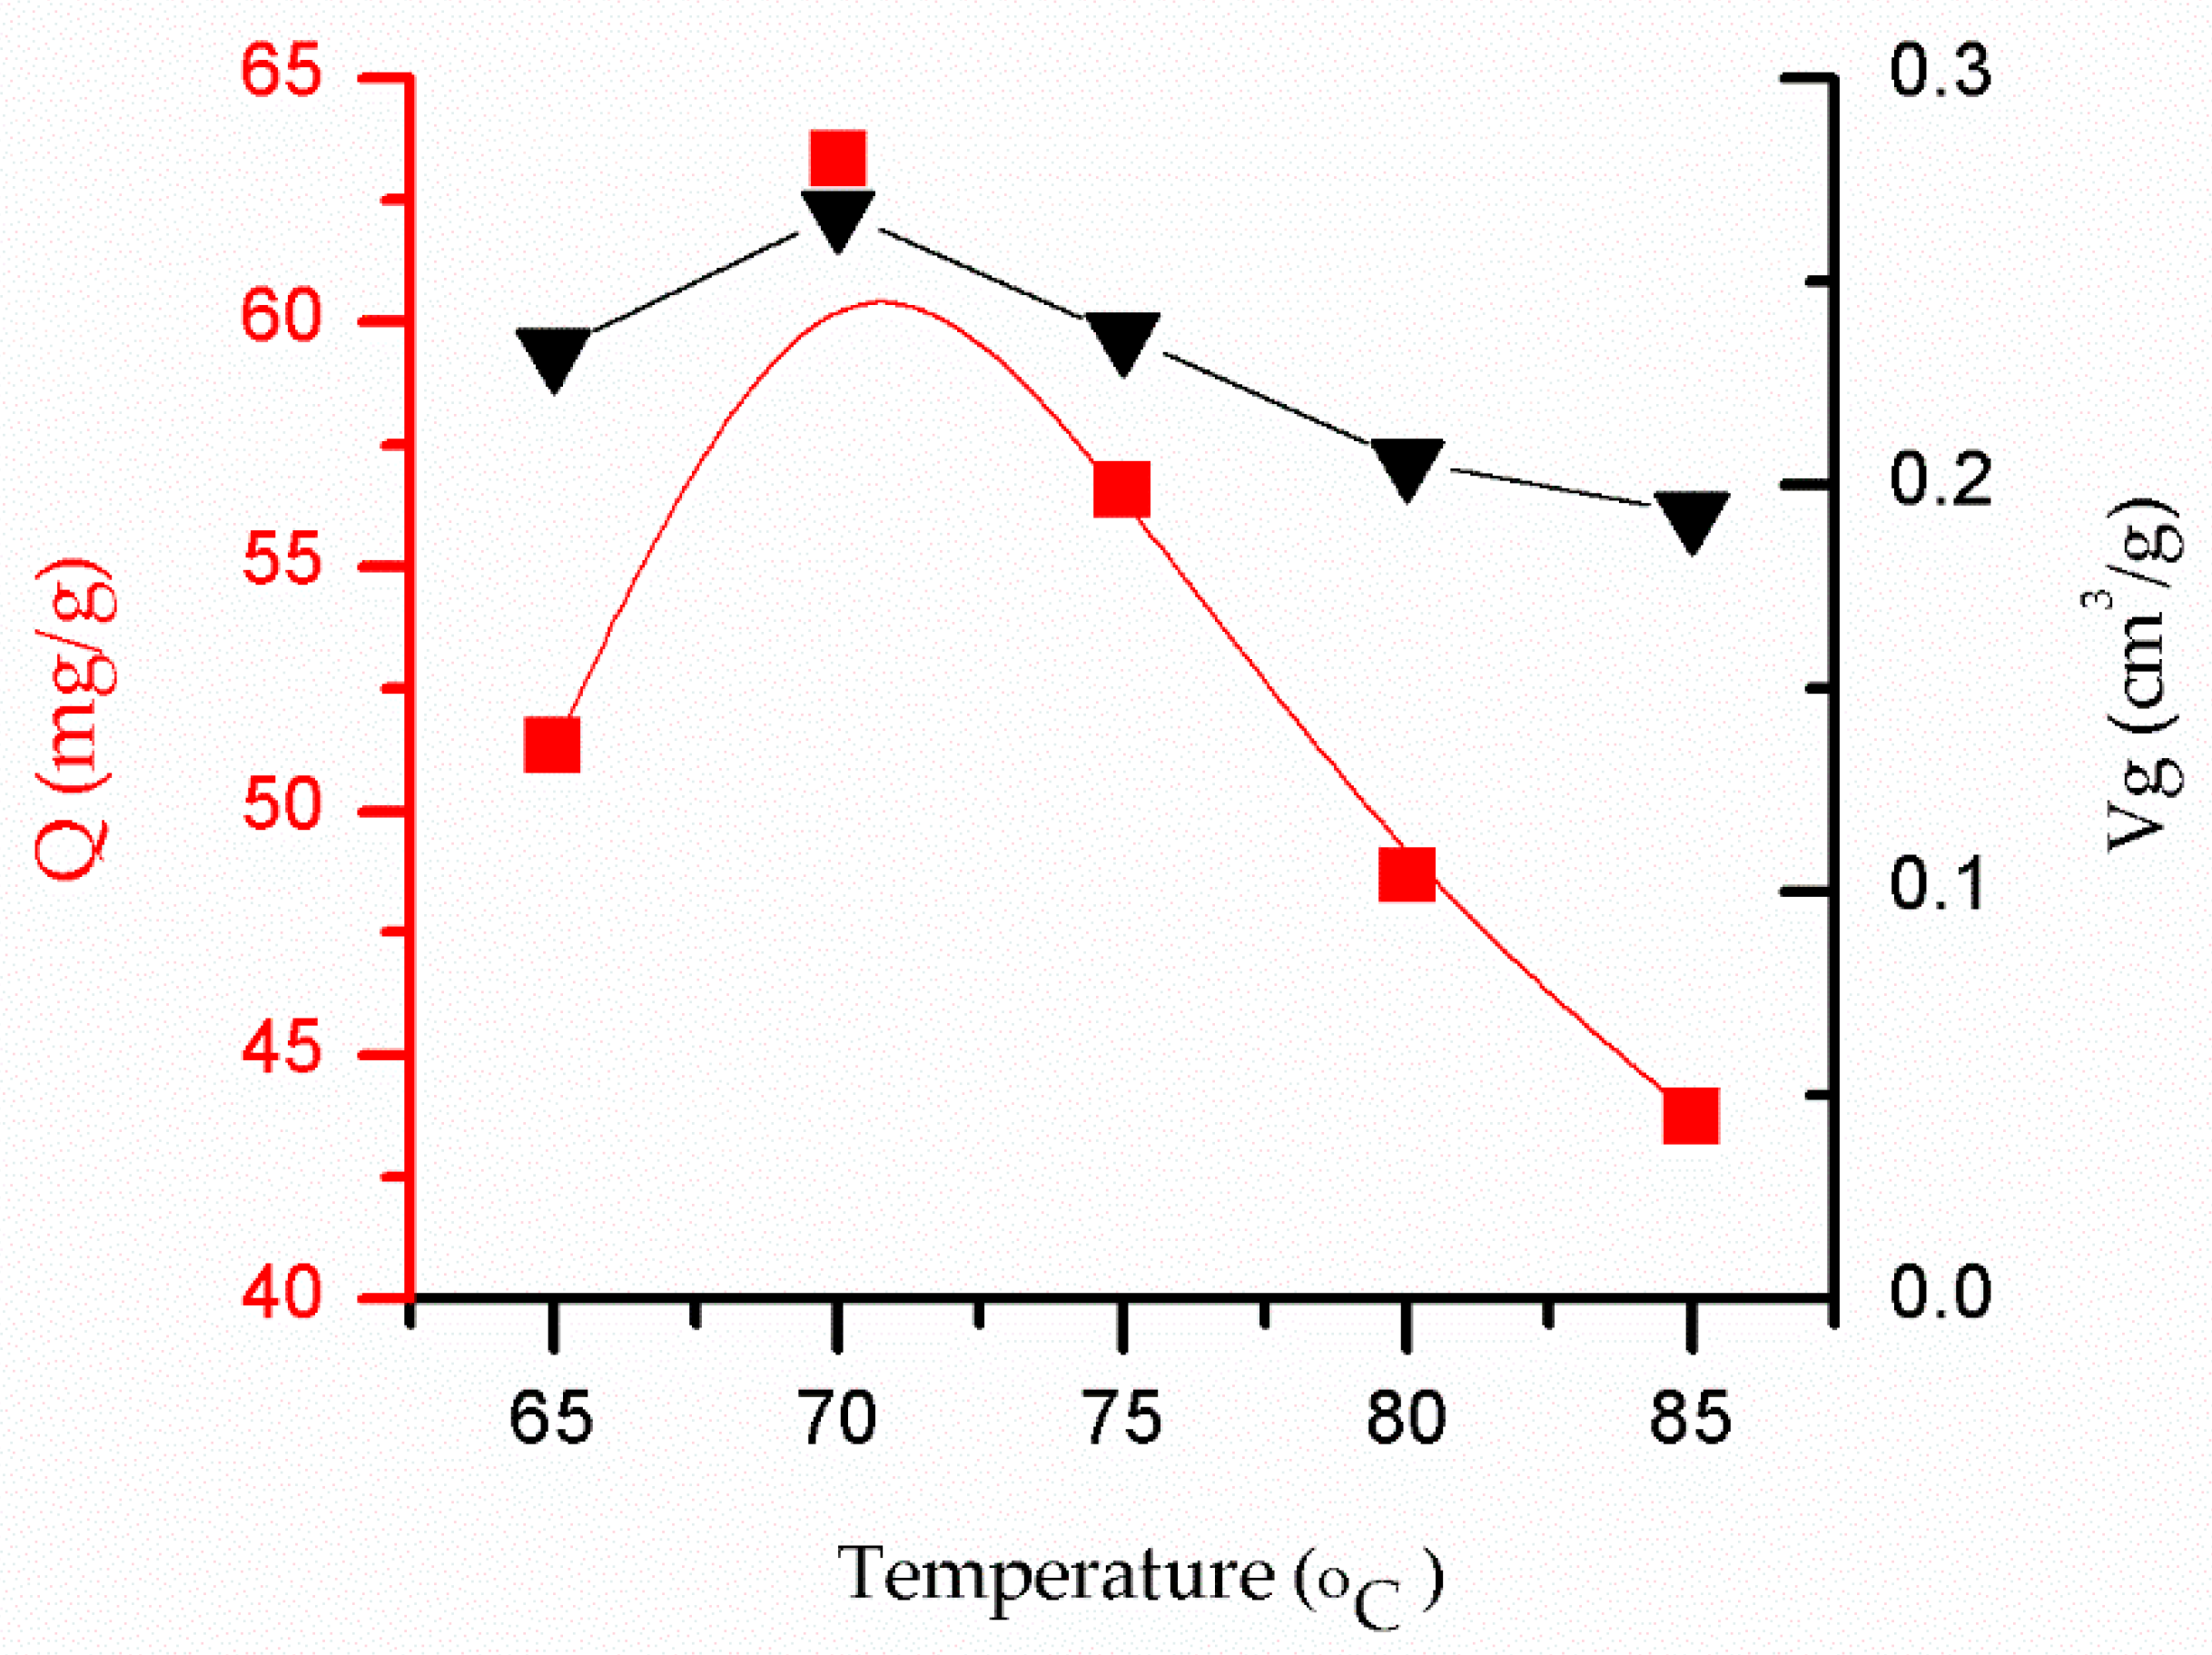
3.5. Influence of the Synthesis Temperature on the Adsorption Performance of SSO-MIPs

Figure 9 presents a graph that shows the effect of the variation of the synthesis temperature on the adsorption performance of the polymer, wherein the amount of solanesol was 0.025 mmol, the amount of MMA was 0.2 mmol, the amount of cross-linking agent was 7.5 mmol, and the amount of KPS was 10 mg. It is evident that the adsorption capacity of the SSO-MIPs first increased and then decreased with the increase of the synthesis temperature from 65 to 85 °C. When the synthesis temperature was 70 °C, the adsorption capacity of the SSO-MIPs reached the maximum. This is because the initiation efficiency of the initiator is low at a lower temperature. When the reaction temperature increases, the Brownian motion of latex particles intensifies; this increases the rate of coalescence caused by the collision between latex particles, ultimately leading to the decrease of emulsion stability. When the reaction temperature increases to be equal to or greater than the cloud point of the emulsifier, the emulsifier will lose its stabilizing effect, which will lead to emulsion breaking. It can be seen from the figure that the effect of temperature on adsorption effect is higher than the pore volume, which may be because the temperature affects the pore structure of SSO-MIPs rather than the pore volume to a large extent. An inappropriate synthesis temperature leads to the increase of incomplete stereo holes; thus, SSO-MIP’s recognition ability for solanesol decreases, resulting in poor adsorption effect.

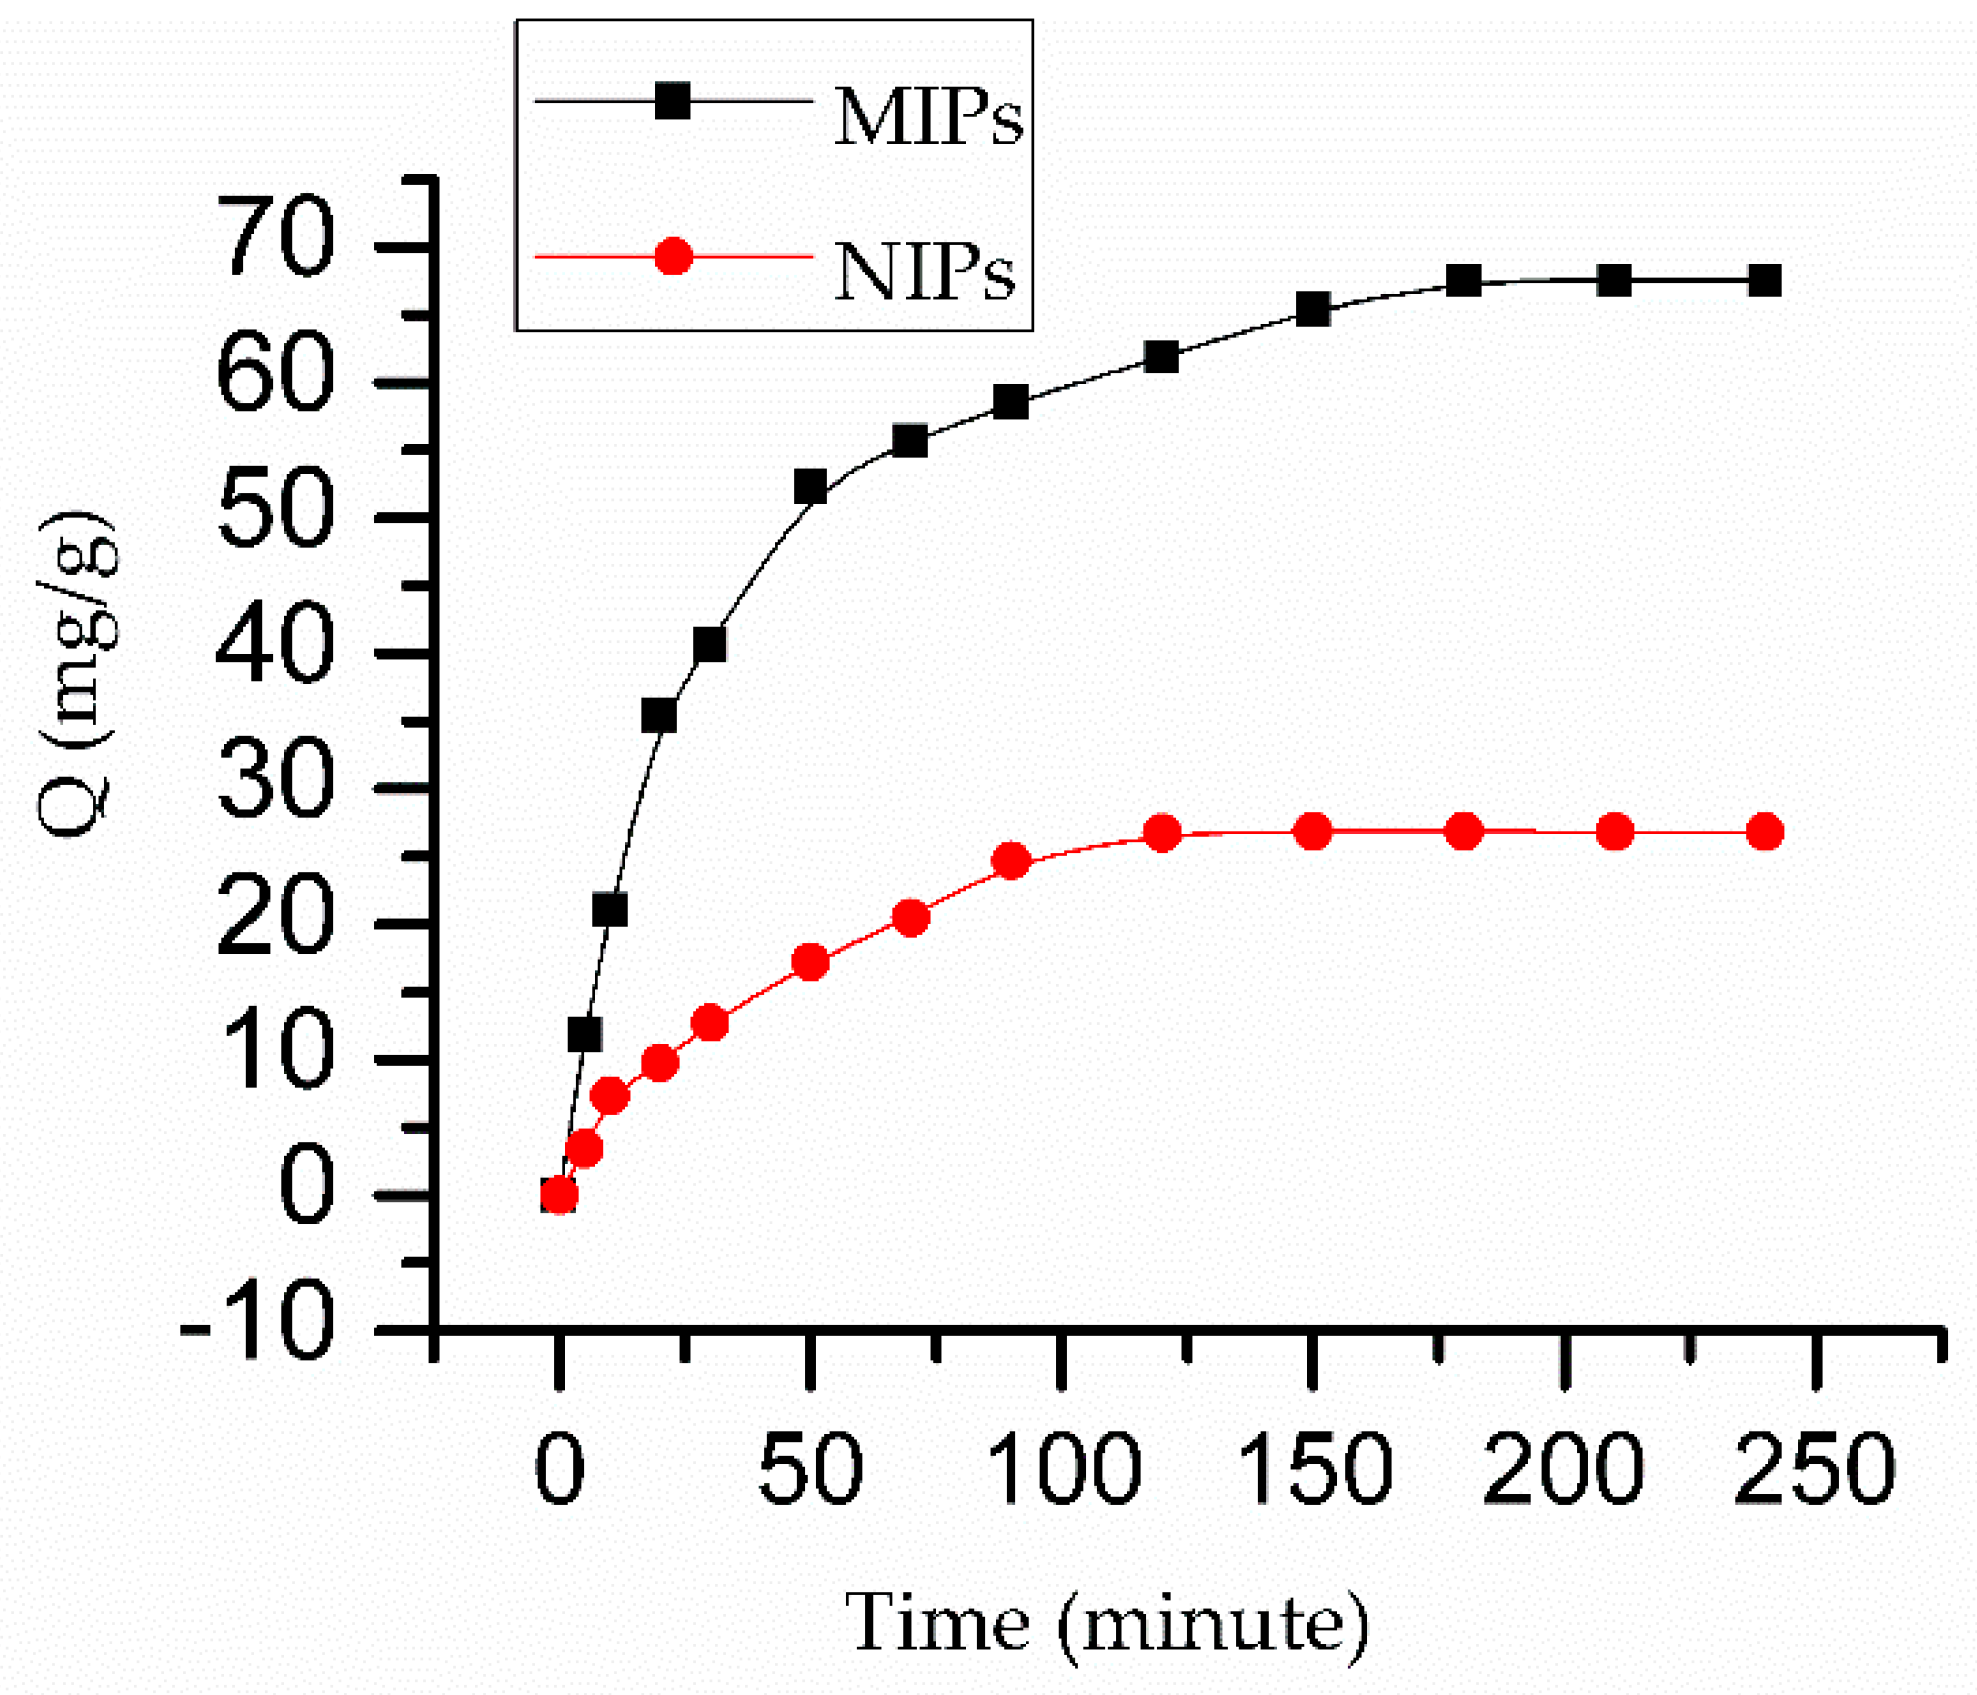
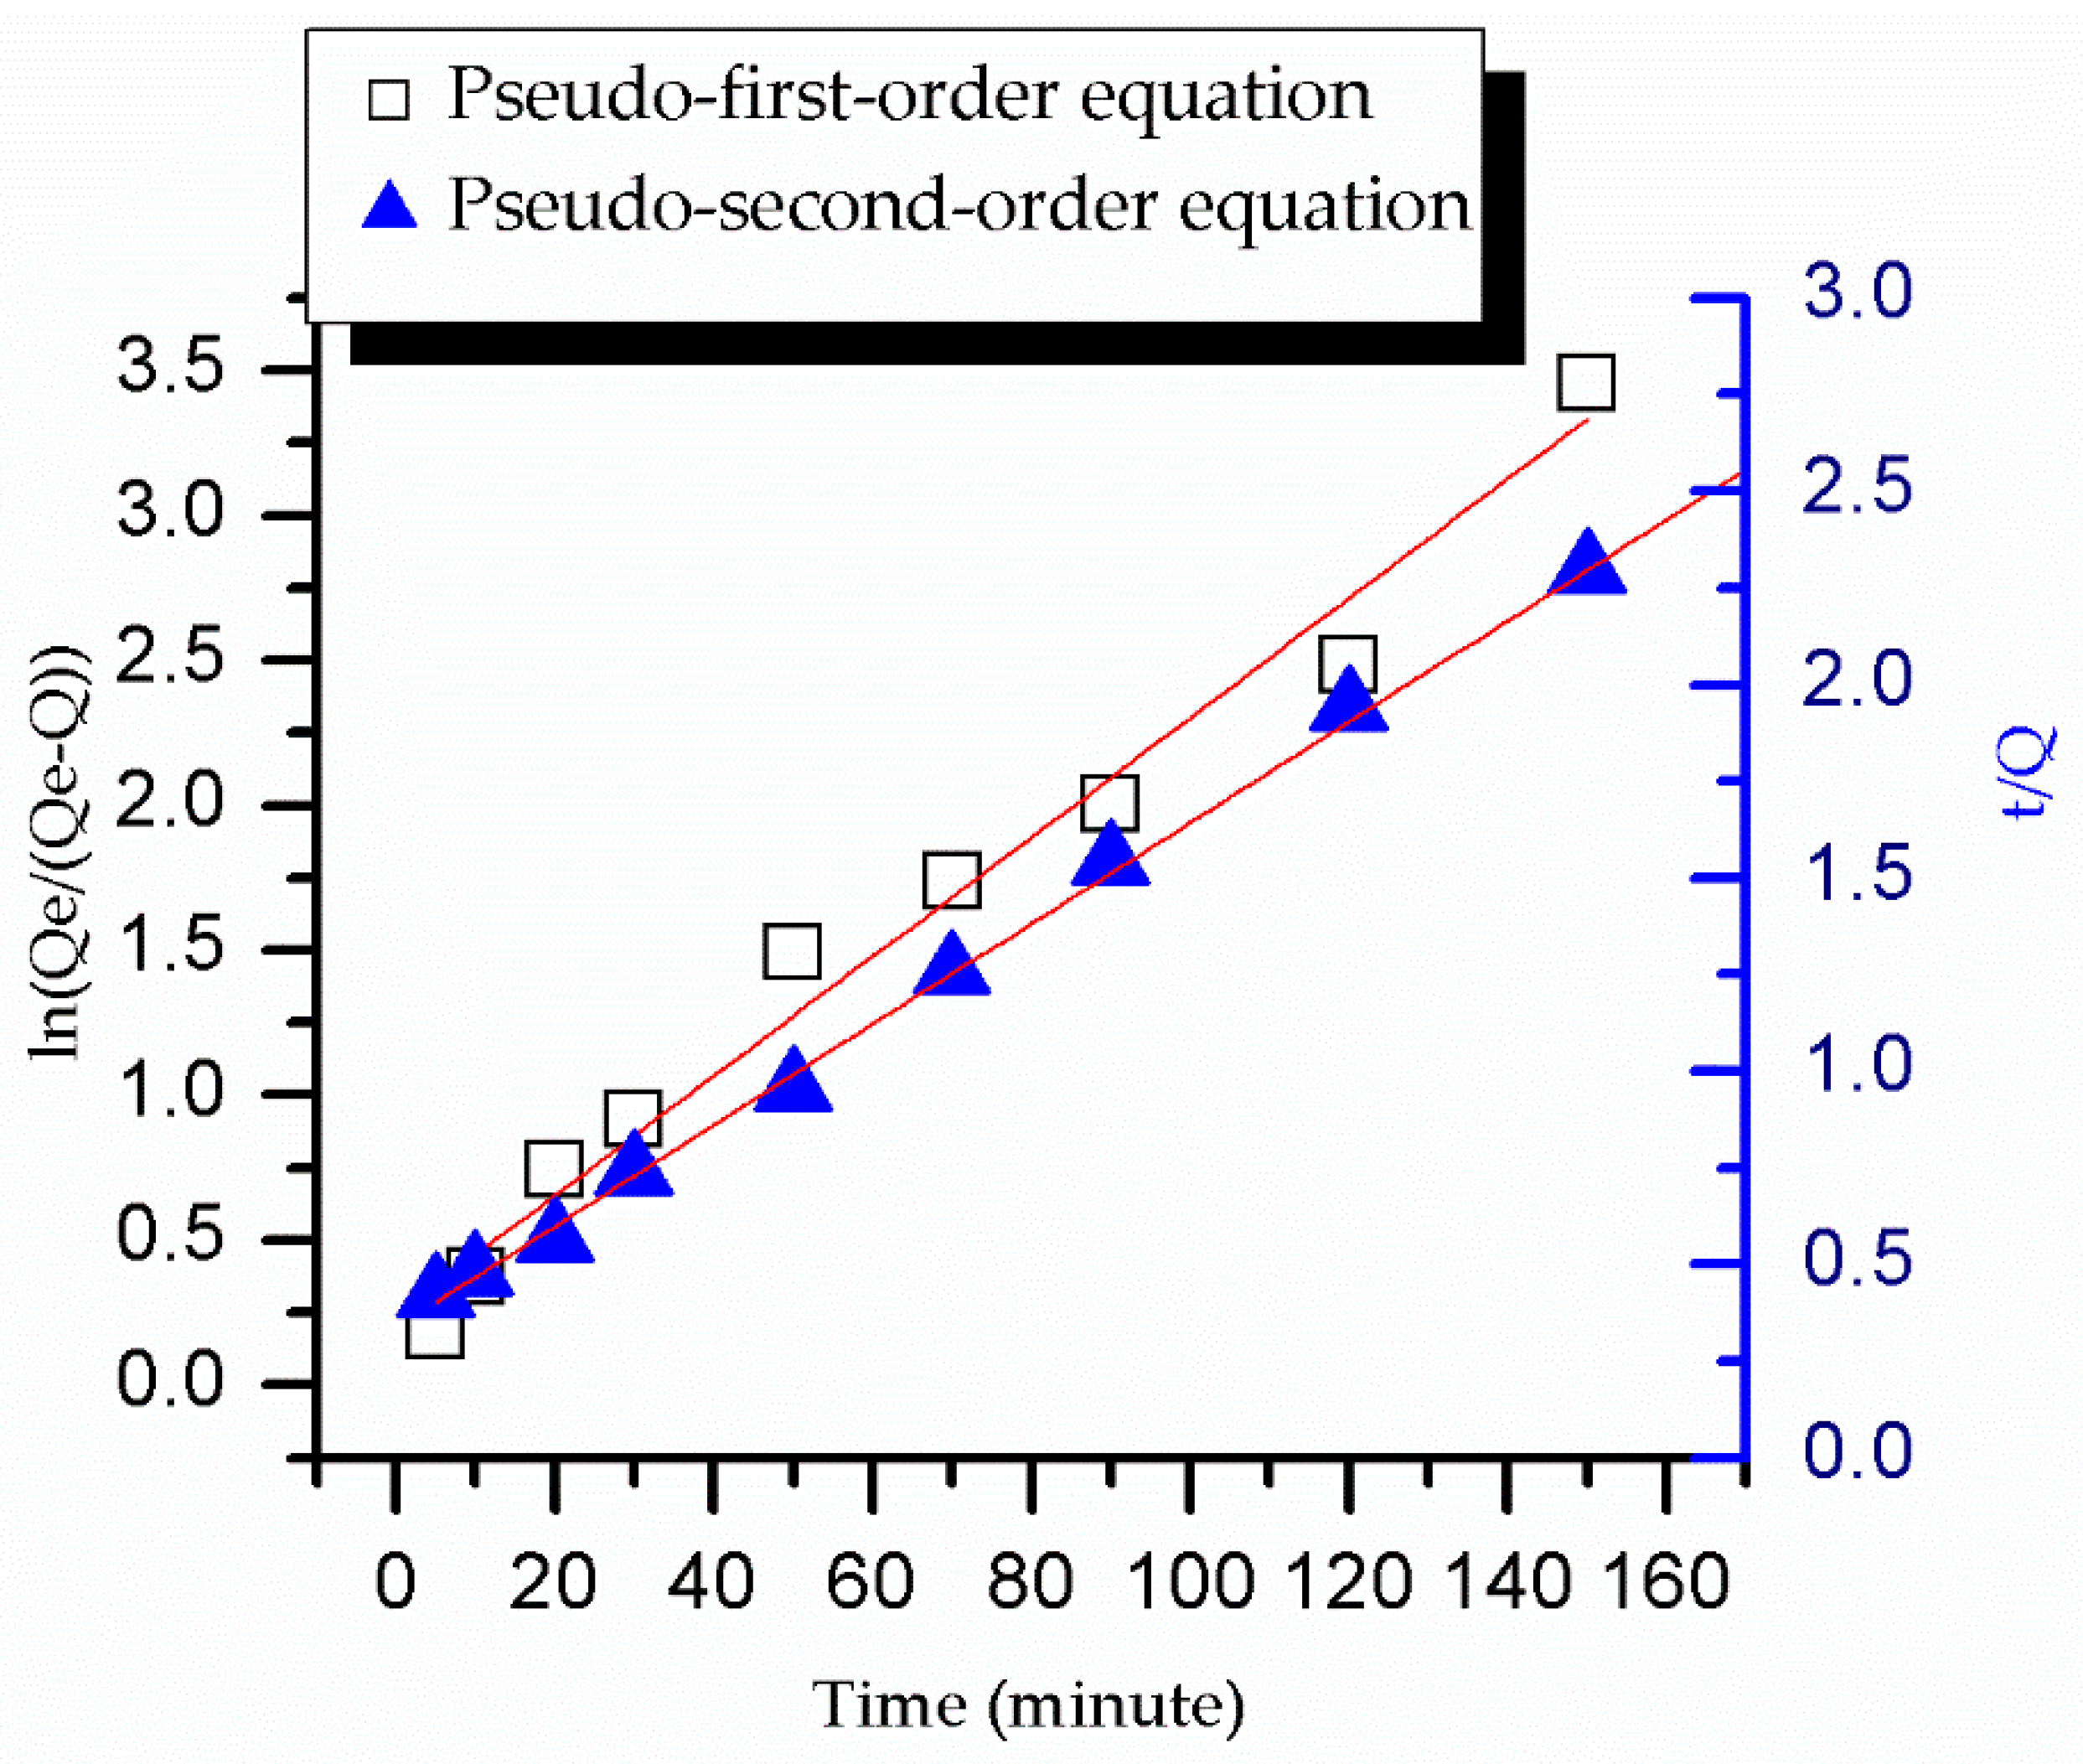
3.6. The Adsorption Kinetics of SSO-MIPs and NIPs

It is clear from Figure 10 that the maximum adsorption capacity of the SSO-MIPs was found to be about 67.55 mg/g, and that of the NIPs was about 26.87 mg/g; therefore, the imprinting factor was 2.51. The adsorption capacity of the SSO-MIPs to solanesol increased rapidly in the first 50 min, and then increased slowly until the adsorption time was 180 min. At this time, the adsorption process reached equilibrium, and the adsorption capacity of the SSO-MIPs reached the maximum and remained stable. This is because there are many holes on the surfaces of SSO-MIPs, and the concentration of solanesol in the adsorption solution was high. The holes on the surfaces of SSO-MIPs could easily bind with solanesol in the solution, and they tended to be saturated with continuous adsorption. Solanesol can bind to the holes only when it diffuses into the deep layer, so the adsorption rate of the polymer decreased until adsorption equilibrium was reached.
Pseudo-first-order and pseudo-second-order kinetic models were used to analyze the adsorption kinetics, and the fitting results are presented in Figure 11, from which it is clear that the fitting effect of the pseudo-second-order kinetic model was better than that of the pseudo-first-order kinetic model. The pseudo-first-order kinetic equation is y = 0.021x + 0.24, and the linear correlation is 0.9785; the pseudo-second-order kinetic equation is y = 0.013x + 0.339, and the linear correlation is 0.99896. This demonstrates that while the pseudo-second-order kinetic model can better describe the adsorption process, the pseudo-first-order kinetic model can better describe the early adsorption process; this indicates that physical adsorption occurs during the early stage of the adsorption process.

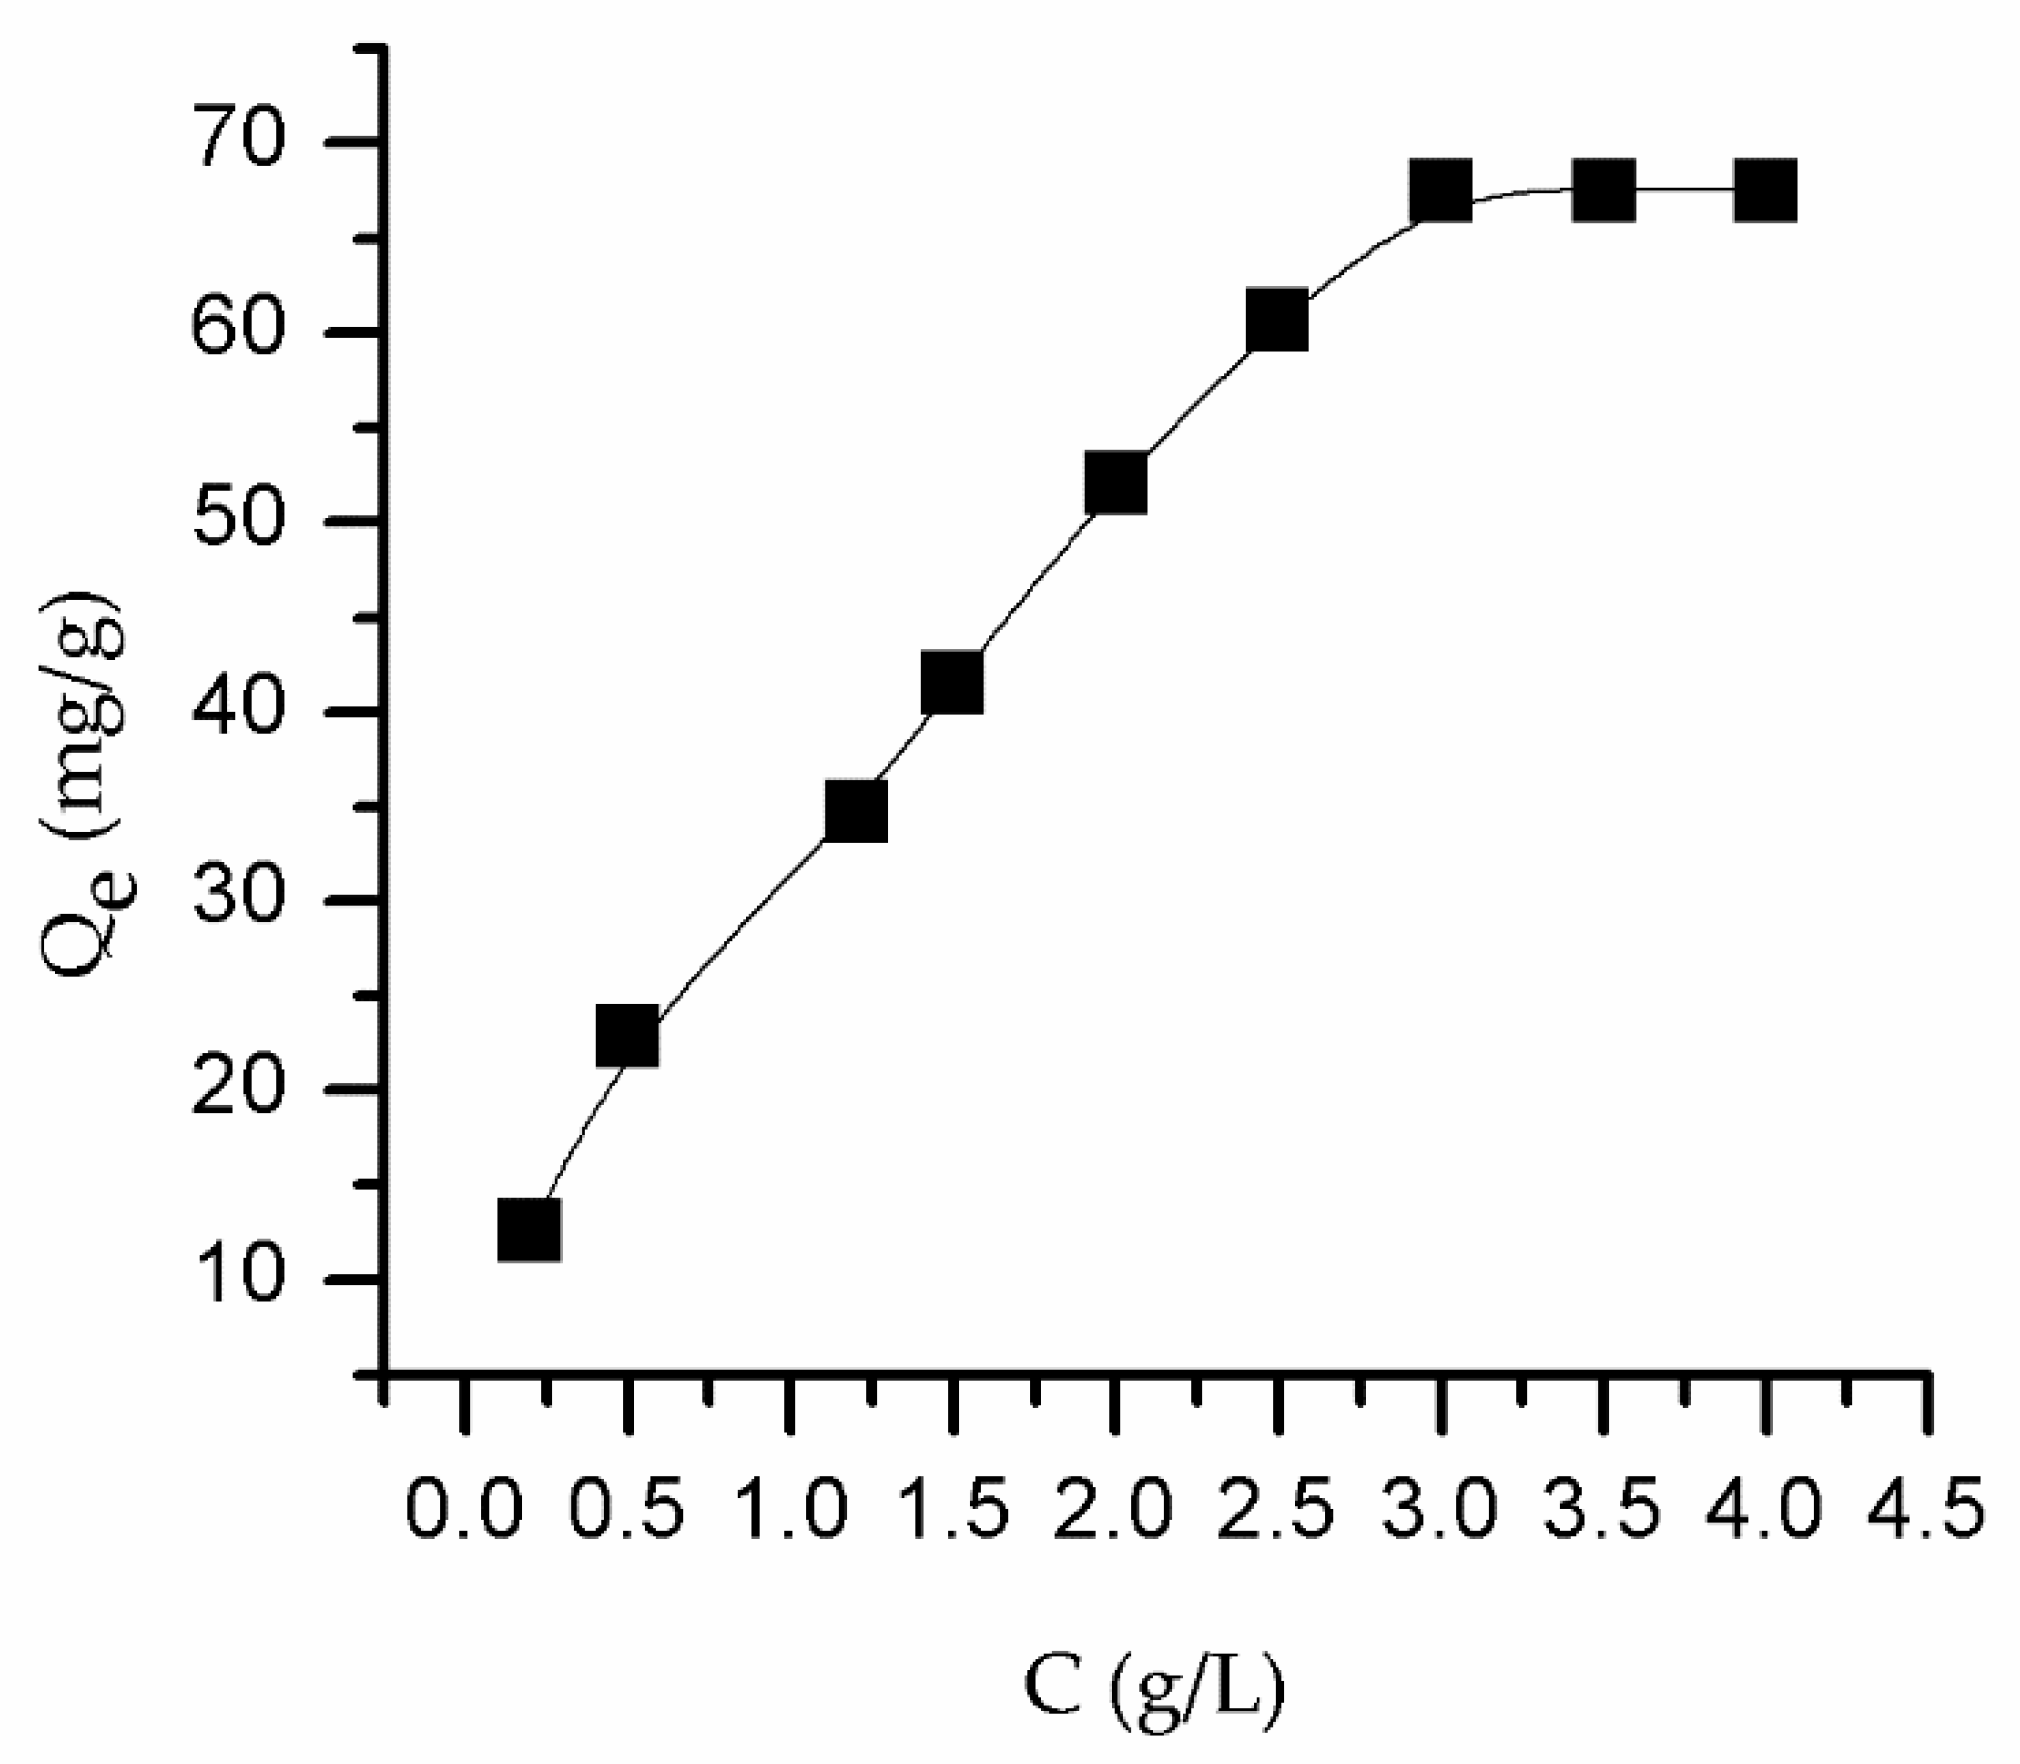
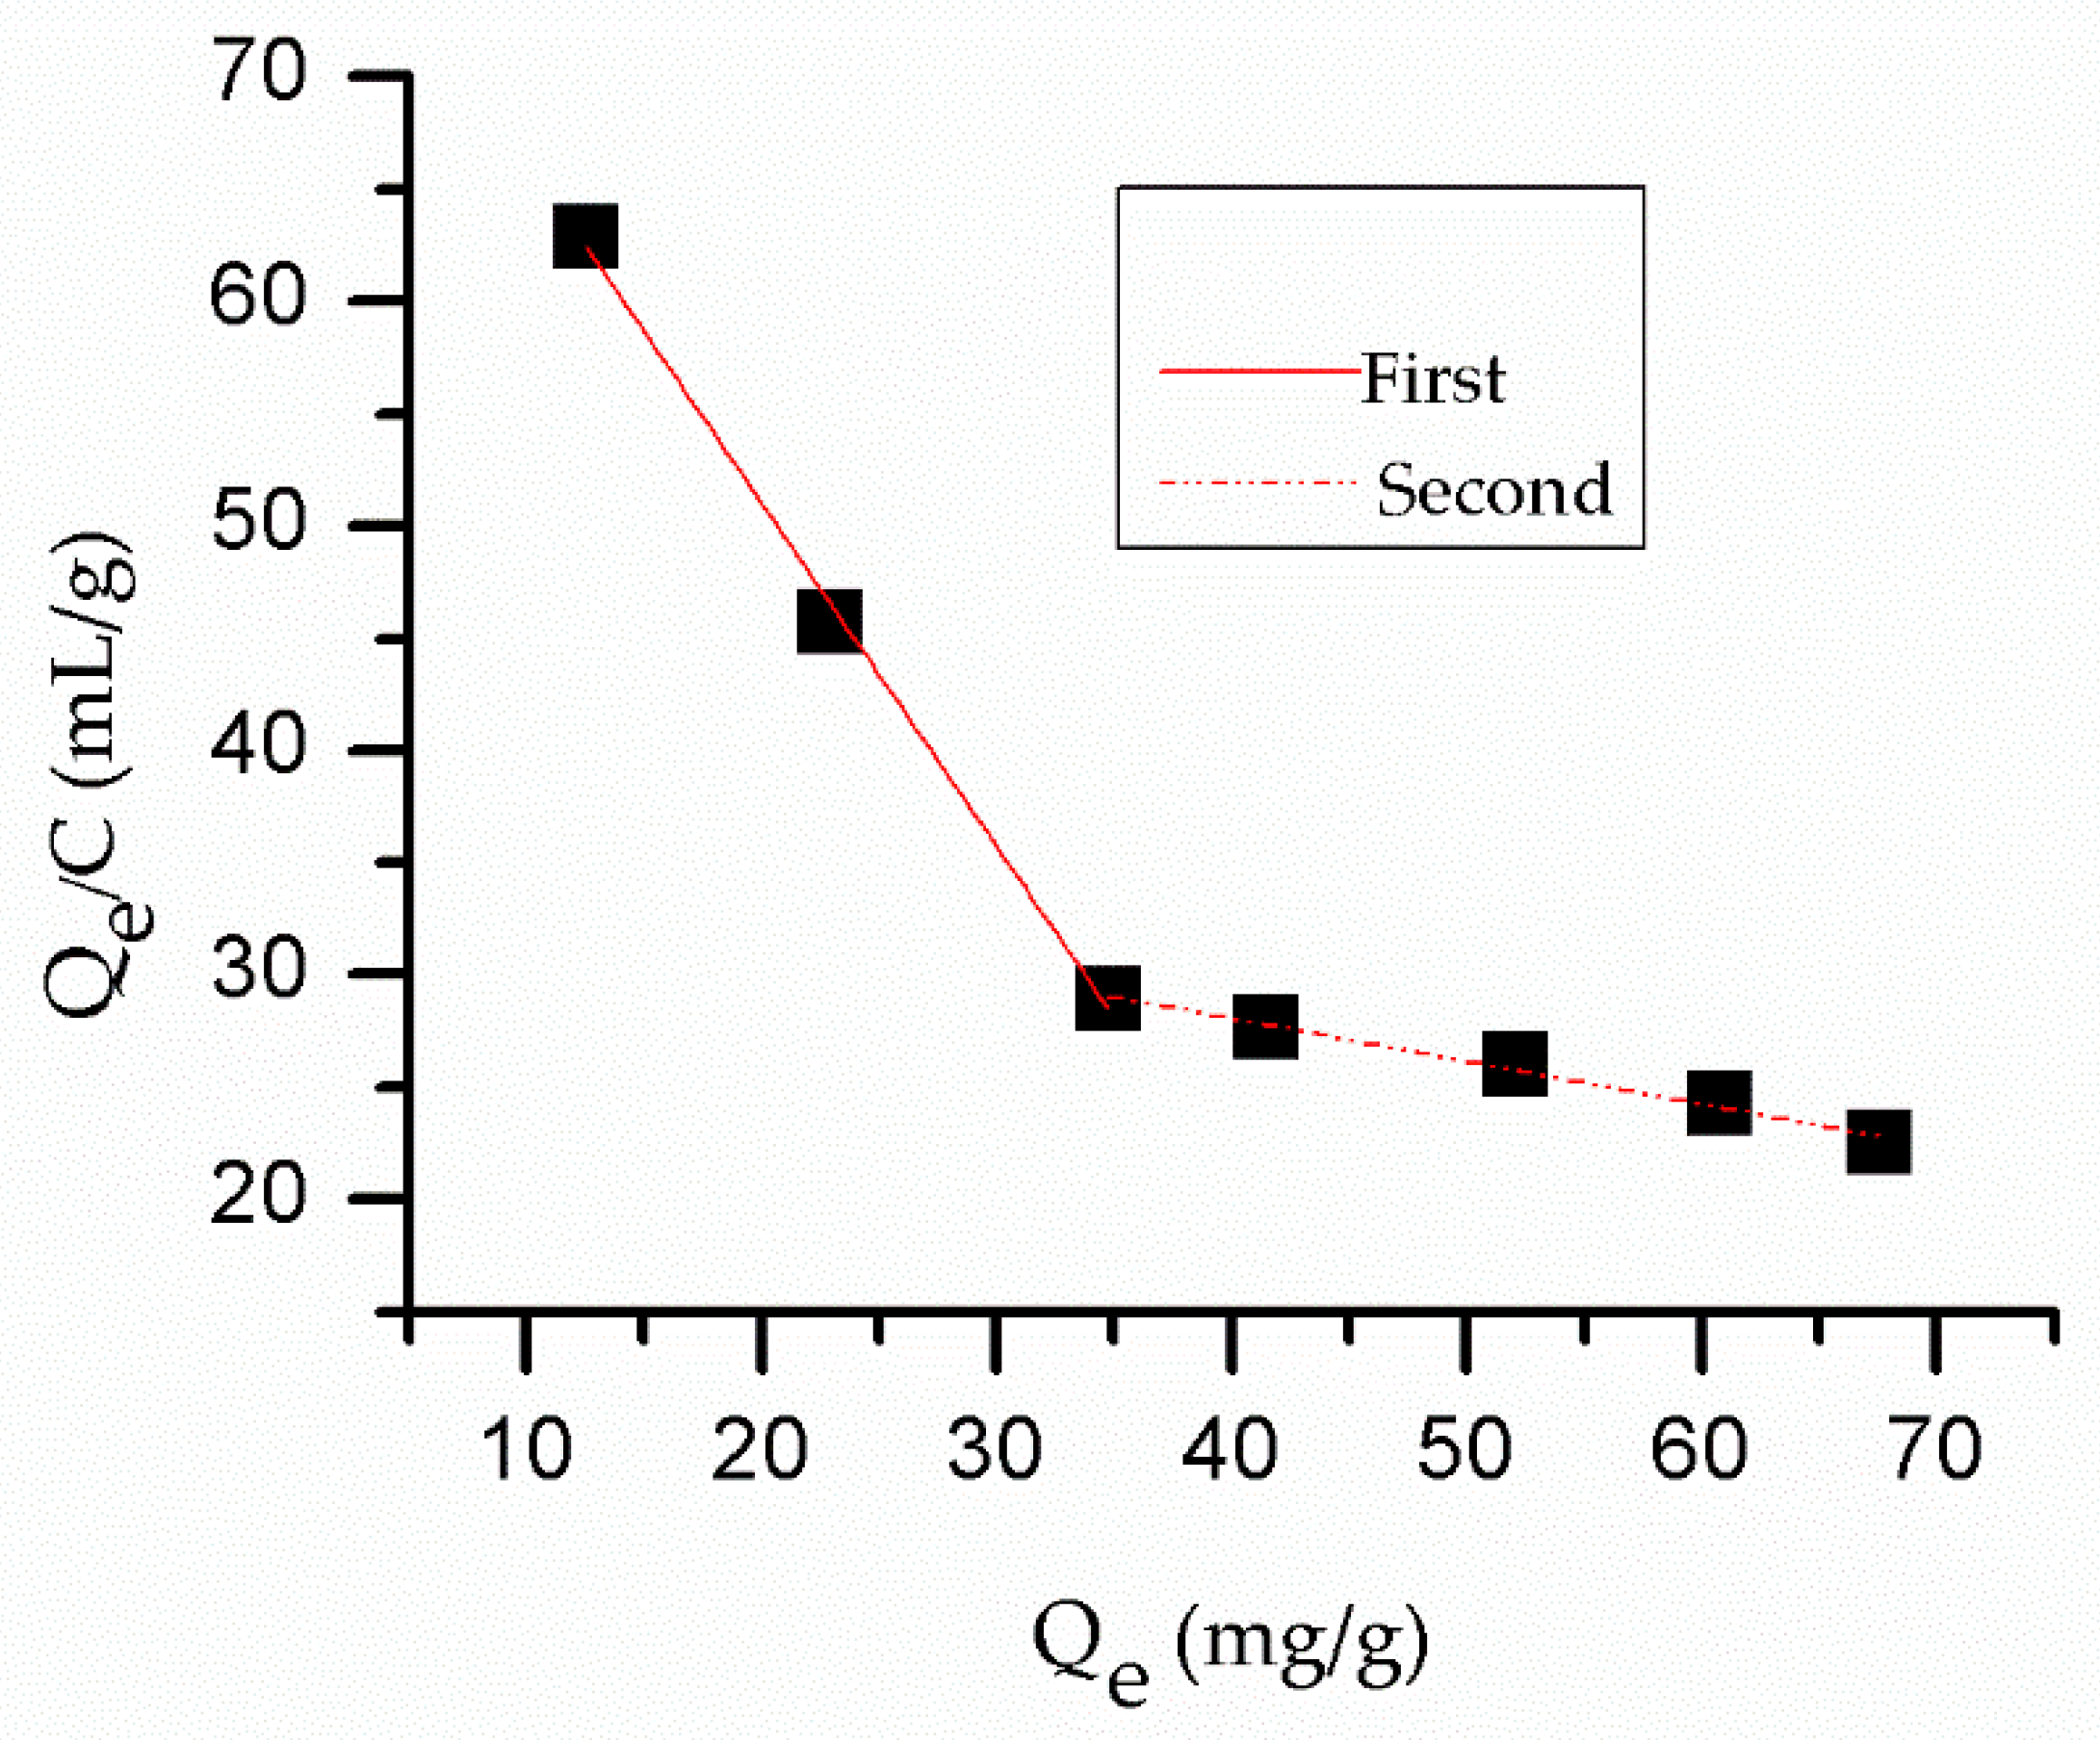
3.7. The Adsorption Isotherm of the SSO-MIPs

Figure 12 presents the thermodynamic curve of the SSO-MIPs, from which it is evident that the adsorption capacity of the SSO-MIPs increased gradually with the increase of the solanesol concentration, but it did not increase when the solanesol concentration was greater than 3 g/L. Figure 13 presents a graph of the Scatchard model, which reveals that the Scatchard model curve is divided into two parts, the linear equations for which are Q e C = 1.53 Q e + 81.63 , R2 = 0.99586 and Q e C = 0.1906 Q e + 35.6734 , R2 = 0.9893, respectively.

3.8. Purification Effect of SSO-MIPs

Figure 14 presents a graph that reveals the results of five parallel experiments. It can be seen from the figure that the percentage of solanesol peak area in desorption solution after SSO-MIPs purification is close to that of solanesol with a purity of 95%. This indicates that the SSO-MIPs synthesized by emulsion polymerization can effectively purify solanesol, and the purity of solanesol is stable. The reason why the SSO-MIPs can selectively adsorb solanesol is that after the template molecules in the polymer are removed by elution, the binding sites with a space size and configuration that matched with solanesol are left in the polymer. These binding sites can combine with solanesol again, and then the adsorbed solanesol is eluted by using a suitable solvent, thereby achieving the purpose of purifying solanesol.

4. Conclusions

SSO-MIPs microspheres with a particle size of about 50–500 μm were synthesized via emulsion polymerization with solanesol as a template molecule, methyl methacrylate as a functional monomer, ethylene glycol dimethacrylate as a cross-linking agent, and potassium persulfate as an initiator. The optimized process conditions were determined to be a molar ratio of the template molecules to the functional monomers to the cross-linking agents of 1:8:30 (mol:mol:mol), a synthesis temperature of 70 °C, and a dosage of the initiator of 10 mg.
The SSO-MIPs were synthesized with the optimal synthesis process condition. Static adsorption experiments were conducted to study the kinetics and adsorption isotherms of the SSO-MIPs. The maximum adsorption capacity of the SSO-MIPs was found to reach 67.55 mg/g, and the imprinting factor reached 2.51. The adsorption of SSO-MIPs to solanesol reached the adsorption equilibrium at 3 h, and the adsorption amount of the SSO-MIPs did not increase when the concentration of solanesol in the adsorption solution was greater than 3 g/L.
In this paper, emulsion polymerization was applied to the synthesis of solanesol molecularly imprinted polymers, and good adsorption effect were obtained, thereby providing the report of a reliable synthesis method. However, there have not been many reports on the synthesis of solanesol molecularly imprinted polymers via emulsion polymerization. Thus, in the future, more research should be that includes, but is not limited to, the following aspects: (1) the investigation of a synthesis method capable of producing a more uniform spherical solanesol molecularly imprinted polymer, (2) the investigation of the specific recognition ability of solanesol molecularly imprinted polymers, and (3) the study of the large-scale application of solanesol molecularly imprinted polymers.

Author Contributions

J.L. (Jing Liu) and M.L.; designed the experiments and provided testing instruments. X.H. and Y.P.; revised the format and language of the article and conducted data analysis. J.L. (Jialei Liu); guided the whole experiment process. S.Z. and L.Y.; reviewed the article and provided comments and suggestions. G.Z. and X.T.; performed the experiments and wrote the paper. All authors have read and agreed to the published version of the manuscript.

Funding

This research was funded by the National Natural Science Foundation of China (No. 51503215) and the Young talent program of Chinese Academy of Agricultural Sciences.

Conflicts of Interest

The authors declare no conflict of interest.

References

  1. Ramelow, U.S.; Pingili, S. Synthesis of ethylene glycol dimethacrylate-methyl methacrylate copolymers, determination of their reactivity ratios, and a study of dopant and temperature effects on their conductivities. Polymers 2010, 2, 265. [Google Scholar] [CrossRef] [Green Version]
  2. Zhao, X.L.; Cui, Y. Preparation of fluorescent molecularly imprinted polymers via pickering emulsion interfaces and the application for visual sensing analysis of listeria monocytogenes. Polymers 2019, 11, 984. [Google Scholar] [CrossRef] [PubMed] [Green Version]
  3. Pauling, L. A theory of the structure and process of formation of antibodies. J. Am. Chem. Soc. 2002, 62, 2643–2657. [Google Scholar] [CrossRef]
  4. Alexander, C.; Andersson, H.S. Molecular imprinting science and technology: A survey of the literature for the years up to and including 2003. J. Mol. Recognit. 2006, 19, 106–180. [Google Scholar] [CrossRef] [PubMed]
  5. Liu, G.Y.; She, Y.X. Development of ELISA-Like fluorescence assay for melamine detection based on magnetic dummy molecularly imprinted polymers. Appl. Sci. 2018, 8, 560. [Google Scholar] [CrossRef] [Green Version]
  6. Martín-Esteban, A. Molecularly imprinted polymers: New molecular recognition materials for selective solid-phase extraction of organic compounds. Fresenius J. Anal. Chem. 2001, 370, 795–802. [Google Scholar] [CrossRef]
  7. Lee, W.C.; Cheng, C.H. Chromatographic characterization of molecularly imprinted polymers. Anal. Bioanal. Chem. 2008, 390, 1101–1109. [Google Scholar] [CrossRef]
  8. Ansell, R.J.; Kuah, J.K.L. Imprinted polymers for chiral resolution of (±)-ephedrine, 4: Packed column supercritical fluid chromatography using molecularly imprinted chiral stationary phases. J. Chromatogr. A 2012, 1264, 117–123. [Google Scholar] [CrossRef]
  9. Li, Y.; Xu, W.K. Molecularly imprinted polymer electrochemical sensor based on Fe3O4/MnO2 doped graphene composites for determination of17β-estradiol in aquatic environment. Chin. J. Anal. Chem. 2018, 46, 1047–1054. [Google Scholar] [CrossRef]
  10. Li, Y.Y.; Zhang, X. preparation and adsorption characteristics of lysozyme-imprinted polymer membrane. Chin. J. Chromatogr. 2019, 37, 392–397. [Google Scholar] [CrossRef]
  11. Liu, H.; Qiao, L. Electro-deposited poly-luminol molecularly imprinted polymer coating on carboxyl graphene for stir bar sorptive extraction of estrogens in milk. J. Chromatogr. B 2016, 1027, 50–56. [Google Scholar] [CrossRef] [PubMed]
  12. Neng, J.; Xu, K.Y. Sensitive and selective detection of new red colorant based on surface-enhanced raman spectroscopy using molecularly imprinted hydrogels. Appl. Sci. 2019, 9, 2672. [Google Scholar] [CrossRef] [Green Version]
  13. Peng, J.; Xiao, D. Molecularly imprinted polymeric stir bar: Preparation and application for the determination of naftopidil in plasma and urine samples. J. Sep. Sci. 2016, 39, 383–390. [Google Scholar] [CrossRef] [PubMed]
  14. Patel, M.; Feith, M. Evaluation of the impact of imprinted polymer particles on morphology and motility of breast cancer cells by using digital holographic cytometry. Appl. Sci. 2020, 10, 750. [Google Scholar] [CrossRef] [Green Version]
  15. Díaz-álvarez, M.; Turiel, E. Molecularly imprinted polymer monolith containing magnetic nanoparticles for the stir-bar sorptive extraction of triazines from environmental soil samples. J. Chromatogr. A 2016, 1469, 1–7. [Google Scholar] [CrossRef]
  16. Barasc, M. Molecularly Imprinted Polymers for the Detection of Caffeine in Water. Master’s Thesis, University of New Hampshire, Durham, NH, USA, 2007. [Google Scholar]
  17. Uezu, K.; Nakamura, H. Metal ion-imprinted polymer prepared by the combination of surface template polymerization with postirradiation by γ-rays. Macromolecules 1997, 30, 3888–3891. [Google Scholar] [CrossRef]
  18. Cao, T.Y.; Liu, Q.P. Synthesis Principle, Performance and Application of Polymer Emulsion; China Chemical Industry Press: Beijing, China, 2007; pp. 7–9. [Google Scholar]
  19. Yan, N.; Liu, Y. Solanesol biosynthesis in plants. Molecules 2017, 22, 510. [Google Scholar] [CrossRef] [Green Version]
  20. Ma, X.Q.; Meng, Z.H. Solanesol extraction from tobacco leaves by Flash chromatography based on molecularly imprinted polymers. J. Chromatogr. B 2016, 1020, 1–5. [Google Scholar] [CrossRef]
  21. Long, J.P.; Chen, Z.B. Preparation and adsorption property of solanesol molecular imprinted polymers. Des. Monomers Polym. 2015, 18, 641–649. [Google Scholar] [CrossRef] [Green Version]
  22. Liu, X.J. Preparation and Adsorption Performance Research of Solenesol Molecularly Imprinted Polymers. Master’s Thesis, Lanzhou University of Technology, Lanzhou, China, 2011. [Google Scholar]
  23. Hameed, B.H.; Daud, F.B.M. Adsorption studies of basic dye on activated carbon derived from agricultural waste: Hevea brasiliensis seed coat. Chem. Eng. J. 2008, 139, 48–55. [Google Scholar] [CrossRef]
  24. Peng, H.; Liu, Z. Adsorption kinetics and isotherm of vanadium with melamine. Water Sci. Technol. 2017, 75, 2316–2321. [Google Scholar] [CrossRef]
  25. Matsui, J.; Miyoshi, Y. A molecularly imprinted synthetic polymer receptor selective for atrazine. Anal. Chem. 1995, 67, 4404–4408. [Google Scholar] [CrossRef]
  26. Zhao, N.; Hu, X.L. Preparation of erythromycin-imprinted polymeric microspheres by emulsion polymerization and their adsorption properties. Acta Phys. Chim. Sin. 2014, 30, 121–128. [Google Scholar] [CrossRef]
  27. Pu, D.; Hu, X.L. Synthesis of glycylglycine imprinted polymer microspheres via emulsion polymerization. Chin. J. Process Eng. 2011, 11, 671–677. [Google Scholar] [CrossRef]
  28. Zhang, W.Y.; Li, Q. Synthesis of salicylic acid imprinted polymer microspheres via emulsion polymerization. J. Chem. Ind. Eng. (China) 2008, 6, 216–220. [Google Scholar]
  29. Fu, H.Q.; Huang, H. Initiator and effect on emulsion polymerization. Synth. Mater. Aging Appl. 2004, 33, 39–42. [Google Scholar] [CrossRef]
Figure 1. Liquid chromatogram of solanesol in methanol solution.
Applsci 10 02868 g001
Figure 2. The standard curve of solanesol in methanol solution.
Applsci 10 02868 g002
Figure 3. SEM images of MIPs (a) and non-molecularly imprinted polymers (NIPs) (b).
Applsci 10 02868 g003
Figure 4. Particle size distribution of SSO-MIPs.
Applsci 10 02868 g004
Figure 5. The FT-IR spectra of the MIPs and NIPs.
Applsci 10 02868 g005
Figure 6. The influence of n M M A on the adsorption performance of MIPs and pore volume.
Applsci 10 02868 g006
Figure 7. The influence of n E G D M A on the adsorption performance of SSO-MIPs and pore volume.
Applsci 10 02868 g007
Figure 8. The influence of the initiator dosage on the adsorption performance of SSO-MIPs and pore volume.
Applsci 10 02868 g008
Figure 9. The influence of the temperature on the adsorption performance of SSO-MIPs and pore volume.
Applsci 10 02868 g009
Figure 10. The adsorption kinetics of SSO-MIPs and NIPs.
Applsci 10 02868 g010
Figure 11. The pseudo-first-order and pseudo-second-order kinetic model diagrams of SSO-MIPs.
Applsci 10 02868 g011
Figure 12. The adsorption thermodynamics of the SSO-MIPs.
Applsci 10 02868 g012
Figure 13. The Scatchard model curve of the SSO-MIPs.
Applsci 10 02868 g013
Figure 14. Percentage of solanesol peak area in desorption solution.
Applsci 10 02868 g014
Table 1. Synthesis information of solanesol molecularly imprinted polymers (SSO-MIPs). EGDMA: ethylene glycol dimethacrylate, MMA: methyl methacrylate, KPS: potassium persulfate, SDS: sodium dodecyl sulfate.
ExperimentMMA
(mmol)
EGDMA
(mmol)
KPS
(mg)
Temperature
(°C)
SDS:H2O
(mg: mL)
10.1~0.356.2586540:15
20.25~1086540:15
30.27.58~166540:15
40.27.51065~8540:15
50.27.5107040:15
6

