Abstract
A novel object rotation hyperspectral imaging system with the wavelength range of 468–950 nm for investigating round-shaped fruits was developed. This system was used to obtain the reflection spectra of jujubes for the application of surface defect detection. Compared to the traditional linear scan system, which can scan about 49% of jujube surface in one scan pass, this novel object rotation scan system can scan 95% of jujube surface in one scan pass. Six types of jujube skin condition, including rusty spots, decay, white fungus, black fungus, cracks, and glare, were classified by using hyperspectral data. Support vector machine (SVM) and artificial neural network (ANN) models were used to differentiate the six jujube skin conditions. Classification effectiveness of models was evaluated based on confusion matrices. The percentage of classification accuracy of SVM and ANN models were 97.3% and 97.4%, respectively. The object rotation scan method developed for this study could be used for other round-shaped fruits and integrated into online hyperspectral investigation systems.
1. Introduction
Appearance is one of the important attributes of fruits which affect their price and consumers’ preferences. Fruits which are unsuitable for sale or storage due to surface defects caused by mechanical injuries, insects, diseases, over-ripeness, under-ripeness, etc. should be sorted out during postharvest processing since the consumers normally prefer to buy fruits with no apparent defects. Furthermore, removing fruits with surface defects from the sound ones can reduce losses by preventing secondary contamination. Sorting out fruits with surface defects is usually carried out by manual operation, which is time-consuming, laborious, and subjective [1,2,3].
Scientific and technological advances have contributed to improve post-harvest processing. For example, computer vision techniques based on red, green, and blue (RGB) images have been developed and applied in fruit sorting and grading systems over the past decades. By using RGB values, Golden Delicious and Jonagold apples were graded into four categories according to European standards and the overall accuracy are 78% and 72% respectively [4]. The color index of citrus fruits was measured by using the average of the CCI value and the average RGB values. And the optimized algorithms for in-line color estimating of citrus were developed for mobile platform [5]. A computer vision model based on RGB image was used to estimate the size and weight of yellow melon [6]. Color moments and color histogram extracted from color images of tomato were used to classify ripeness stages of tomato [7]. A computer vision system with three color cameras was used to separate normal and defective apples with 11% classification error. However, this system could not distinguish different defect types [8].
Although the traditional computer vision systems based on RGB color video cameras are effectively used to measure or detect external quality characteristics such as color, texture, size, shape, and some obvious defects of fruits, it is impossible or difficult to detect or differentiate some other less obvious defects whose colors and texture are similar to the normal skin [9]. Unlike the conventional color camera capturing three monochromatic images centered at 700.0 nm (red, R), 546.1 nm (green, G), and 435.8 nm (blue, B) to imitate the vision of humans, the multispectral computer vision system can capture two or more different waveband monochromatic images in the spectrum as we want by utilizing optical filters. A common multispectral camera approach utilizes a filter-wheel consisting of optical bandpass filters. By shifting the filters sequentially into the optical path, the spectrum image is acquired through the channels [10]. A multi-spectral vision system including four wavelength bands in the visible/NIR range was developed to investigate the defects of Jonagold apples [11]. The used filters were centred at 450, 500, 750, and 800 nm and had, respectively, a bandwidth (full width at half maximum or FWHM) of 80, 40, 80, and 50 nm. No error was made on rejected fruits and high classification rates were reached for apples presenting serious defects and recent bruises. Huang et al. [12] developed a multispectral imaging system with two dichroic beamsplitters, two band-pass filters and three charge-coupled device (CCD) cameras for online detection of bruises on apples. The online image acquisition speed is about three apples per second and the classification accuracy of bruised apples in online tests is 74.6%. Hyperspectral imaging, combining conventional two-dimensional imaging and spectroscopic techniques, produces a three-dimensional image data cube, and records the spatial and spectral information simultaneously [13]. In recent years, many researchers have demonstrated the feasibility of hyperspectral imaging systems in detecting skin defects of fruit [14,15]: bruise on apple and pear [4,16], chilling injury in peaches [17,18], decay in citrus [5,19], fungal infections in strawberry [20], and green mold pathogens on lemons [21] to name a few.
Whole surface inspection is a challenging problem until now that affects the comprehensive and reliability of the grading results of fruits, since information leakage and repetition of fruit surface images or spectral data during color and defect detection could affect successive classification. Although many efforts have been made by worldwide grading engineers for decades, a thorough and practical solution is still not available so far [1]. Capturing images from different views with multiple cameras or with the assistance of mirrors is a common method used in the inspection of fruits to obtain much or whole surface of fruits [1,8,9,22]. Li et al. [1] developed an imaging system with two mirrors on opposite sides of the apple to capture four sides of an apple sitting in a shallow cup by using two cameras mounted above and below the conveyor. This method allows most of the apple surface to be taken, but portions of the apple surface are blocked by the supporting cup. Imou et al. [22] built a vision system with mirrors to measure the three dimensional (3D) shape of the strawberries. Nine mirrors around the object at an angle were used to reflect side views of the object, and the side views were taken simultaneously with a digital camera. The 3D shape was reconstructed from the nine-sided views by the volume intersection method. Reese et al. [9] used computer vision system with mirrors for whole surface imaging of apple suspended by two thin wires. Results revealed that taking one single image using the four or six mirror configurations could catch the image of almost 100% of the surface of apples. However, for testing, an individual apple had to be suspended by two thin wires, which restricts its application in commercial in-line sorting lines. Zou et al. [8] developed a computer controlled system with color cameras for in-line detection of apple defects. In this system, the apples placed on rollers were rotating while moving and three color cameras were placed on the line. Each camera captured three images from each apple. A total of nine images obtained for each apple allowed the entire surface to be scanned. The defects, including the stem-ends and calyxes, called regions of interest (ROIs), were segmented and counted in each of the nine images. Since a calyx and stem-end cannot appear at the same image, an apple is defective if any one of the nine images has two or more ROIs. Good separation between normal and defective apples was obtained; however, different defect types could not be distinguished.
The above-mentioned studies about how to achieve whole surface inspection of fruits are suitable for computer vision with snapshot camera(s), while the techniques for whole surface scan or increasing scannable surface area in one scan pass about fruit are not examined thoroughly for line-scan machine vision system such as push-broom hyperspectral imaging (HSI) system. Sun et al. [23] built a hyperspectral imaging system with rotation unit employed two motor driven rollers to obtain all-round hyperspectral image of the whole peach for the study of decayed on peach surface. Baek et al. [22] developed an optical system for push-broom hyperspectral camera to obtain the whole surface spectral data of a round object. The system uses four mirrors to view a rotating round object from two opposite sides and project a combined two-view image onto the aperture of a push-bloom HSI camera. The image of the whole surface of the round object can be used to detect defects located on any part of that surface. In order to obtain the two side views that include the areas around the poles, the distance from the inside mirrors to the outside mirrors and the inclination angles of the outside mirrors need thoughtful design. In their study, calibration tests showed that the system could detect six simulated defects dispersed evenly over the surface of an apple, without missing or repeating a defect, for 78% of the apple fruits tested. In their study, the rotation of spheroidal or round object was driven by four truncated-cone rollers rotating at a steady speed. However, due to the difference in fruit size and shape, the rotation speed of fruit on the rollers may not be well controlled [1]. Furthermore, bounding or wobbling of the fruit could happen during rotation [22]. Thus, the scan lines might be overlapped or missed in some regions due to the un-uniform rotation of fruit.
The objectives of this study were to (1) investigate the capability of using a rotation stage to increase scannable surface area in one scan pass about a jujube for push-broom HSI camera, and (2) develop efficient data processing procedure and classification models for the surface defect detection of jujubes. The increasing of scannable surface area of this object-rotation scan method, compared with the scannable area of using a linear stage for moving the jujube in one scan pass, was assessed.
2. Materials and Methods
2.1. Jujube Samples
The jujubes used in this study were selected from the jujubes, with clear typical defect(s), screened out during postharvest process in jujube orchard located in Pingtung, Taiwan. The defects of jujube were identified by visual inspection with the assistance from jujube farmers. The samples with normal surfaces and five types of common skin defects (i.e., rusty spots, decay, white fungus, black fungus, and cracks) of Kaohsiung No.11 jujube were collected and stored in inspection laboratory at 25 °C. The hyperspectral images of specimens were acquired within two days after samples obtained. Typical images for each skin condition are shown in Figure 1.
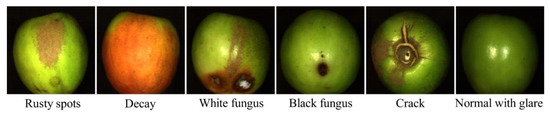
Figure 1.
Common skin defects and glare on normal surface of Kaohsiung No.11 jujube.
2.2. Hyperspectral Imaging System
A prototype hyperspectral imaging system capable of scanning jujube fruit under linear movement or rotation was developed (Figure 2). This line-scan vision system consists of a monochrome camera (acA1920-155 um, Basler AG, Germany), an imaging spectrograph (Inspector V10, Specim Ltd., Oulu, Finland) and a 50 mm focal length VIS-NIR lenses (50 mm/F2.0 67,717 VIS-NIR, Edmund Optics Inc, USA). The complementary metal oxide semiconductor (CMOS) sensor of camera had 1920 × 1200 pixels and the binning function (2 × 2) was used to reduce the resolution and noise of image. The resultant image has resolution of 960 and 600 pixels in special and spectral axes respectively, and the spectral range of this imaging system spanned from 359 nm to 1024 nm. Two 50 W halogen lamps were used to illuminate the sample under investigation. A single axis actuator (KP26, TBI motion, Taiwan) with step motor (ST17-1, National Instruments, Austin, TX, USA) was used for linear motion, and a rotation stage (SGSP-120Yaw, SIGMA KOKI Ltd., Tokyo, Japan) was used for rotation of sample for HSI scan. The rotion stage was attached on top of the stage of linear actuator and jujube sample was placed on the center of rotation stage for scan. The step motors of both stages were driven by a PWM signal generated by counters of general purpose data acquisition devices (NI USB-6210, National Instruments, Austin, TX, USA).
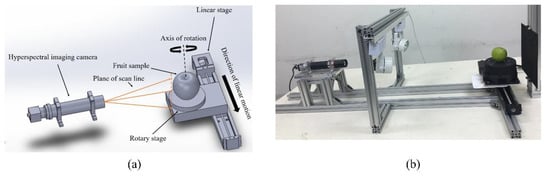
Figure 2.
(a) Schematic of the hyperspectral imaging system and (b) the experimental setup.
As shown in Figure 2, the direction of scan line of camera and rotation axis of stage was perpendicular to direction of linear stage movement. The linear scan was performed by driving the linear stage without actuating the rotation stage while scanning. On the other hand, when performing a rotation scan, the rotation stage was actuated while the linear stage was held still. Before the rotation scan started, the axis of rotation stage was moved into the plane of line scan by adjusting the position of the linear stage so that the panoramic image of the jujube would be like the cylindrical projection image of a globe-like object. The setup of camera parameters, step motor velocity and operation of system are coordinated through a computer program that was developed in Labview (National Instruments, Austin, TX, USA) and the spectral images were collected in a darkroom. The spatial-spectral data of each scan line was saved as an image file in tagged image file format (TIFF). All TIFF images belonged to the same scan pass were combined to form a three-dimensional data cube when performing data pre-processing.
2.3. Data Collection
Hyperspectral data of 80 samples were collected for this study. Most samples had more than one defect. The numbers of samples with rusty spots, decay, white fungus, black fungus, and cracks are 34, 25, 16, 30, and 38 respectively. For each jujube sample, the sample was manually put on the center of the rotation stage with the stem-calyx axis being aligned vertically and went through the linear and rotation scan. Then, the linear and rotation scan was repeated with the sample’s stem-calyx axis being aligned horizontally. A total of 50 samples were randomly selected as training set to evaluate scanning methods and developing the classification models. The remaining samples were used for evaluating the performance of the object rotation HSI system proposed in this work. The white and dark reference images were taken at a regular time interval for the calculation of relative reflectance [11]. A white diffuse reflectance board with 99% reflection efficiency was used to obtain white reference images, and dark reference images were collected by turning off the lamps and covering the lens with a black cap.
2.4. Data Pre-Process
A program with graphic user interface (GUI) developed in Matlab (The MathWorks, Inc.) environment was used to process spectral images (Figure 3). For spectral data of a scan pass, the TIFF images corresponding to each scan line were combined as a three-dimensional data cube (x, y, λ) where x, y, and λ represent spatial and spectral components respectively. Due to the low light output of lamps in the VIS < 468 nm and low quantum efficiency of the CMOS in the NIR > 950 nm, only hyperspectral image data in the wavelength range between 468 nm and 950 nm were used for analysis in this work. A region of interest (ROI) was applied to the data cube to select the relevant subset of data for further process. The locally estimated scatterplot smoothing (LOESS) filter was applied to selected data in the spectral direction, and then the relative reflectance was calculated using white and dark references.
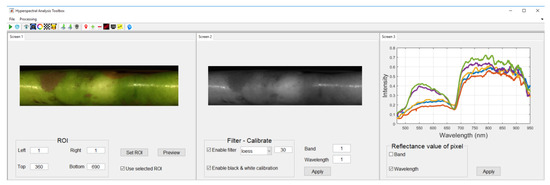
Figure 3.
The graphic user interface for pre-processing hyperspectral image data of jujube specimens.
Pseudo RGB images constructed from calibrated data by combining three wavelengths were used for feature labeling of jujube surface. Due to the smooth and waxy skin of the sphere-like jujube surface, the mirror-like reflection or glare of incident light cannot be completely removed by adjusting the angle of incident light. In HSI, glare alters the spectral fingerprint, which could introduce artifacts and hence deteriorate classification results. Therefore, glare pixels need to be detected and removed before feature extraction and classification [24]. In this study, glare was considered as one type of surface feature and thus pixels of seven types of jujube skin conditions (i.e., normal, rusty spots, decay, white fungus, black fungus, crack, and glare) were visually identified and labeled on the pseudo RGB images for the use of supervised machine learning methods.
2.5. Classification Methods
Support vector machine (SVM) and artificial neural network (ANN) are effective methods for spectral data analysis. SVM, based on the statistical learning theory and structural risk minimization, is a supervised classification method which can deal with both linear and nonlinear data efficiently with good generalization ability [25,26]. Compared with other methods, SVM has such advantages as it does not need a large number of training samples for developing a model and is not affected by the presence of outliers [27] and has been proven as a reliable and efficient method for the spectral data analysis of agricultural products [28,29,30,31,32]. Artificial neural networks have been widely used in agriculture areas, including surface inspection of fruits [17,33,34,35,36,37,38], since regaining their popularity in the early 1980s. By using a 3-layer feedworward backpropagation ANN model, Pan et al. demonstrated the feasibility of hyperspectral reflectance imaging technique for detecting cold injury of peaches [17], and ElMasry et al. differentiated injured apples from normal ones [36].
In this work, SVM and ANN were used for classification experiments performed on the hyperspectral data of the jujubes. The classification accuracy of SVM and ANN models trained by using HSI data obtained by linear and rotation scan were compared respectively. The Radial Basis Function (RBF) was chosen as the kernel function of SVM, and grid search was used to select the optimal penalty parameter C and the kernel function parameter g. Moreover, the three-layer feedworward backpropagation model was adopted as ANN model in this study. The input layer had 435 nodes, representing the spectral responses of each jujube sample point with 435 spectral bands. The hidden layer had 100 nodes and the output layer had 7 nodes defined primarily by number of skin features. A hyperbolic tangent activation function was used as a transfer function between the input and hidden layers, while the transfer function between the hidden and output layers was a softmax function. The training of SVM and ANN models and prediction of skin defects of jujube samples were performed in the Python environment with the use of scikit-learn and Keras packages. Pixels from the linear scan dataset and the rotation scan dataset were selected respectively from the 50 randomly chosen jujube samples. Each skin feature had the same number of data. The classification accuracy of models trained using data obtained from linear scan and rotation scan were compared. The selected data were divided into a training set (70%) and a validation set (30%). The training set was used to establish classification models, while the validation set was used for evaluating the performance of models. Classification models were evaluated based on the confusion matrices of the classification performed on the validation sets.
3. Results and Discussion
3.1. Linear and Rotation Scan Images
Line scan is a convenient way for imaging cylindrical object because an unwrapped image of the entire surface without distortion can be obtained by rotating the cylinder when scanning. Furthermore, line-scan allows the application to adjust the image pixel aspect ratio by controlling the scan line pitch. If the image pixel aspect ratio was greater than one when imaging a cylindrical object by rotation scan, the distance between scan lines would be greater than the width of scan line, and thus the surface between could not be interrogated. In this work, the rotation scan was set up to let the image of a cylinder with a diameter of 60 mm under rotation scan had a 1:1 image pixel aspect ratio. By using this setting, all of the image pixel aspect ratios of jujube specimens (diameter < 60 mm) under rotation scan were less than one. Therefore, the surface feature of specimens would not be missed.
The pseudo color images of typical jujube specimens obtained by using linear and rotation scan are shown in Figure 4. Because the specimen was put on the rotation stage during scan, a part of the jujube surface was blocked by the supporting plate when scanning. The viewable surfaces of specimens using linear and rotation scan methods are about 49% and 95% of the whole fruit surface respectively. By using linear scan, the intensity distortion of the peripheral areas of fruit was severe due to the curved shape of fruit [14], and thus the pixels in peripheral areas were difficult to use for surface defect detection because the intensity of these pixels was too low. To cover the whole surface of fruit without serious distortion by linear scan, the images taken from the six views shown in Figure 4b were required. Figure 4c shows the rectangular images of specimen obtained using rotation scan. These images were similar to the two-dimensional flat surface of Earth’s curved surface obtained by a cylindrical projection. With the experimental setup used for the rotation scan in this work, the distortion of image is minimal in equatorial regions and maximal at the poles. Because surface defect detection is a qualitative analysis, the shape distortion in the images and replicated sampling of some surface regions are not problems. In the fruit images obtained by using rotation scan, the areas with severe intensity distortion were only located near the upper and lower boundaries of fruit images. Thus the percentage of area with severe intensity distortion of images obtained by rotation scan was less than that of images obtained by linear scan. Furthermore, it can be seen from Figure 4c that the areas occupied by the rectangle and circles could cover the whole surface of specimen without severe distortion. Defect detection can be performed on the pixels in these areas only.
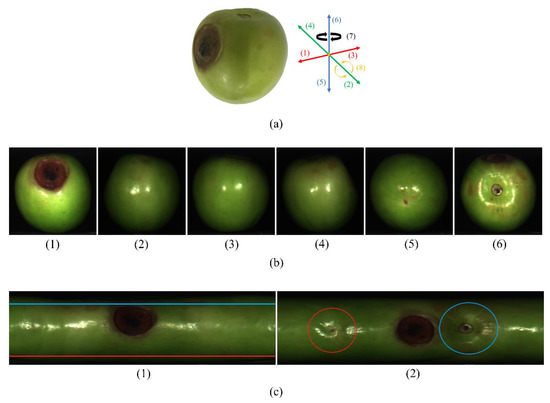
Figure 4.
(a) Left: The photo of a typical jujube specimen. Right: The directions of faces for linear scan and the axes of rotation for rotation scan. (b) The pseudo color images of typical jujube specimen obtained by linear scan. From left to right: front, right, back, left, bottom and top views. (c) The pseudo color images of typical jujube specimen obtained by rotation scan. Left and right: rotation about axis 6 and axis 2.
3.2. Spectral Characteristics
Every pixel of HSI data set used in this study has spectral information. The curves of mean reflectance spectra of different types of jujube skin conditions were shown in Figure 5. The spectral characteristics of normal, decay, cracks and rusty spots were relatively similar in the wavelength range of 680–950 nm. The rapid change in reflectance of vegetation, also known as red edge, in the range of 680–730 nm could be clearly observed. The reflectance of the spectral of glare was higher than those of all other skin types in the whole wavelength range. Moreover, the curve shape of spectral of glare is similar to that of normal surface. The possible reason could be most of the glare pixels in the data set of this study were selected from the glossy normal surface. Spectral characteristics of white and black fungus were similar, and were different from those of other skin conditions. The reflectance curves of the spectral of black and white fungi were lower than those of other skin types. Additionally, there was no rapid change in reflectance in the range of 680–730 nm. This could be due to the spectral signatures of pathogenic fungi of jujubes being different from those of green plant.
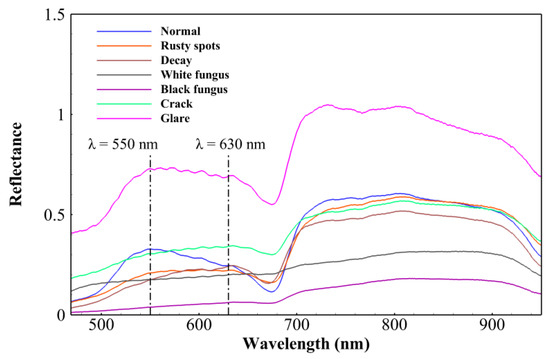
Figure 5.
The averaged reflection spectra of common skin defects and glare of the jujube in the wavelength range of 468–950 nm.
It was found that there was no reflectance of single band in the wavelength region between 468 nm and 700 nm could be used to segment defect surface from normal using simple thresholding. It was also noticed that the reflectance of the spectra of normal skin was higher than those of other skin types in the region between 710 nm and 840 nm. However, the spectra shown in Figure 5 did not account for the non-uniform light intensity distribution on the spherical jujube surface. The reflectance of the spectra, in the above mentioned wavelength range, of normal surface near the edge could be lower than those of defect surface near the center due to intensity distortion. Thus, using simple thresholding for a single band image in this region might be inadequate for discriminating defects from normal skin. It was further noted that the slope of the curve of reflectance of normal surface spectral was negative, and those of defect surface were positive in the range of 550–630 nm. Therefore, the two-band ratio image based on wavelength images at 550 nm and 630 nm, or the first derivative of the curve of reflectance in the range of 550–630 nm could be considered for developing the detection algorithm to segment the skin defects from normal surface of jujubes.
3.3. Classification Models
Table 1 shows the classification accuracy, estimated on the validation set, of SVM and ANN models trained by using HSI data obtained by linear and rotation scan respectively. The classification accuracy was high for all four models and ranged from 96.3% to 97.4%. It can be noted that the accuracy of ANN models was higher than that of SVM models, and the models trained with the use of rotation scan data had higher accuracy than those trained with the use of linear scan data.

Table 1.
Classification results of support vector machine (SVM) and artificial neural network (ANN) models with the use of data set obtained by linear and rotation scan.
To analyze and evaluate the performance of the four tested models for discriminating skin features of the jujube and to show how the pixels with spectral data belonging to different classes were classified by the specific model, the confusion matrices of these models were created and shown in Table 2 and Table 3. The rows of matrix represent actual classes and the columns denote predicted classes. The diagonal entries of the matrixes denote the percentage of pixels of the properly-recognized cases, while each entry outside the diagonal means an error (the percentage of misclassification). The confusion matrixes show that glare was the class from which most correct classification was obtained (higher than 99.16%) for all models. This can be easily explained by the fact that the reflectance of the spectra, in the full spectral range, of glare was much higher than those of other classes (Figure 5). Confusion between decay and rusty spot was higher than that of any other pair of classes, and the second high confusion was between decay and black fungus. One reason of confusion between decay and rusty spot was probably due to the spectral characteristics of decay and rusty spots being relatively similar in the full wavelength range used in this study. Another reason for the confusion between these classes was because decay and rusty were not mutually exclusive. The development of decay could occur on not only normal surface but also rusty surface, thus the pixels selected from decayed rusty surface could pertain to class decay and class rusty. However, in this work, single-output classification models were used so only one label could be assigned to pixels on decayed rusty surface. Therefore, confusion between decay class and rusty surface class could occur. To overcome this problem, multi-label classification models would be required, but this was beyond the scope of this work.
Table 2.
Confusion matrices of the classification models with the use of linear scan dataset.
Table 3.
Confusion matrices of the classification models with the use of linear scan dataset.
The possible reason of confusion between decay and black fungus could be due to the large variation of reflectance of decay surface. Fungal infections that occurred on jujube surface typically caused a rapid decay in the area surrounding the fungal infection spot. As a jujube ripen, the color of skin changes from green to yellowish. The colors of decay or rot were highly dependent on the maturity stages of the jujube. In RGB image, the color of decay on mature green jujubes was much darker than that of ripen jujubes and was close to the color of black fungus. In this work, data labeling was based on visual assessment of surface features in the RGB image. Thus, it was challenging to differentiate dark decay and black fungus on green mature jujube surface by visual assessment of the surface features of the jujube in the RGB images. Therefore, labeling error about decay and black fungus could occur and lead to the confusion between classes of decay and black fungus. To minimize the labeling effort caused by above mentioned reason, spectral information of pixel can be taken into consideration when labeling. Furthermore, although the averaged reflectance values of the spectra of decay and black fungus were distinctly different (Figure 5), the reflectance of the spectra of dark decay on mature green jujube surface was closer to that of black fungus, and might lead to confusion.
3.4. Spatial Region of Interest for Classification
Figure 6 shows the procedure to create the mask of jujube specimen for pixel based defect detection. As the difference between the spectra for jujubes and background could be easily distinguished, a threshold of the reflectance at a single wavelength (760 nm) was used to segment jujube pixels and background pixels and to create a binary image. In a second step, a jujube mask was created by using morphological dilation and erosion to fill the holes inside the mask and remove isolated jujube pixels outside the mask. Due to the intensity distortion [14] caused by the curvature of the jujube, the acquired intensities of jujube pixels near the edge of the mask was too low and these pixels were highly possible to be misclassified as low reflectance classes such as black fungus and decay (Figure 6b). Although commonly used pre-processing technique such as normalization, dividing each spectrum by maximum value, could be used to minimize the intensity variation due to fruit curvature. However, the signal to noise ratio could not be improved by normalization. In this work, a new mask created by eroding approximately 5% of the original mask was used as the spatial region of interest. Defect classification was only performed on jujube pixels in new mask (Figure 6c).
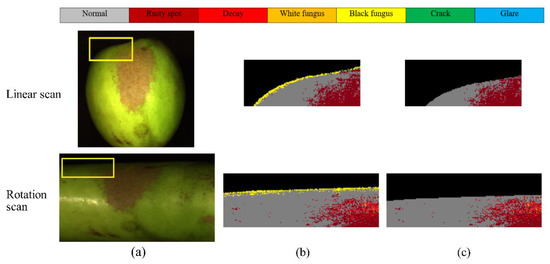
Figure 6.
(a) Red, Green and Blue (RGB) images of jujube specimen, (b) predictive results shown in the original masks and (c) predictive results shown in the new masks created by eroding approximately 5% of the original mask.
3.5. Classification Results of Jujubes
Figure 7 shows the prediction results of four example jujubes using the proposed classification models. These examples included all surface features studied in this work. For each sample, RGB image was shown in the first column, and the classification results of SVM and ANN models were shown in the second and third columns respectively. By using linear scan method, only the image of surface facing camera could be obtained. The surface area, defined by the new mask, suitable for pixel based defect detection was about 43% of the whole jujube surface. By using the rotation scan method, about 91% of pixels of the whole jujube surface area could be used for defect classification.
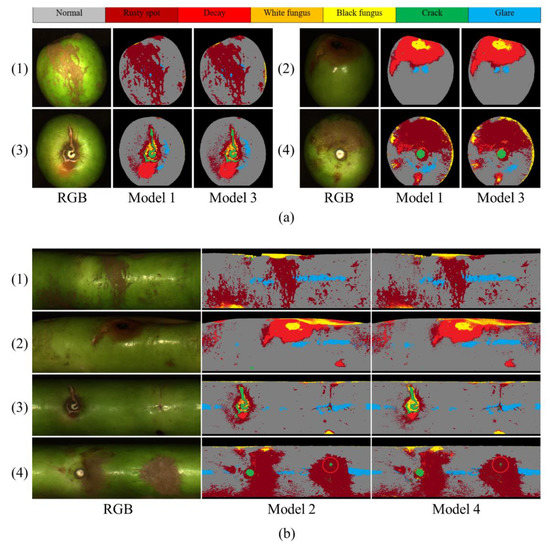
Figure 7.
Classification results of jujube samples by using (a) linear scan and (b) rotation scan methods.
It can be seen from Figure 7 that most of the fruit pixels can be properly classified. However, in Figure 7a, it can be noted that the pixels near the right boundary of the fourth specimen were misclassified as black fungus due to low intensity. Similarly, in the classification results of the third sample shown in Figure 7b, rusty spots near the top of the image misclassified as black fungus could be due to the same reason. It can be noticed that a small region of rusty spots, shown in the circles of Figure 7b, was incorrectly predicted as crack of the fourth jujube sample. By inspecting the color image of this specimen, it can be seen that the rusty area misclassified as crack was brighter than the typical rusty area. The brighter rusty surface could be due to the glare on this rusty area and could be the reason that results in the misclassification. One thing should be pointed out is that jujube surface could have many small rusty spots thus many clusters of pixels classified as rusty spots could be small (only several pixels). Therefore, if image post processing were used to improve accuracy, a particle filter should be used with care to avoid removing small rusty spots by mistake. The Kaohsiung No.11 jujube has smooth calyx; however, the concave feature of stem-end of the Kaohsiung No.11 jujube is similar to that of apple. The color of calyx is similar to that of rusty spot. The color of normal stem-end is the same as that of normal jujube surface; however, the surface of stem-end, compared with other normal surface, could present a relative low intensity due to the curvature of stem-end. Furthermore, during harvesting, the stem of the jujube could remain on the tree and the skin and flesh surrounding the stem could be pulled out of the jujube (Figure 7b (4)). Therefore, it would be necessary to consider methods to recognize stem-end and calyx and to differentiate the normal stem-end and calyx from the real defects in the future work.
The current hyperspectral imaging system had a stable scanning frame rate of 33 frames per second (FPS) and it took about 40 s for rotation scan of one jujube sample. The use of higher frame rate could not guarantee the image data can be taken at stable frame rate with the use of current computer hardware and software. To increase the stable scan rate of this system, a real time vision and motion control system with synchronization features for camera and motors could be used. In this study, we used whole spectral data to train the classification models. In order to improve the classification speed, dimension reduction techniques should be used to reduce data redundancy of the models while retaining important features of the image. Thus, the classification time can be improved and the classification accuracy can be retained.
4. Conclusions
To ensure the inspected fruits are free from defects, images including the whole surface of fruit are necessary for defect detection. Although many efforts have been made by investigators, current solutions provide advantages as well as disadvantages, and a thoroughgoing solution is still not available. Furthermore, most of the whole surface detection methods were developed for area scan imaging systems. The studies about how to inspect the whole surface of the fruits by using line scan imaging system such as a push broom hyperspectral camera are limited. In this study, without using mirrors or multiple cameras, a simple and reliable hyperspectral imaging system for scanning rotating globe-like object was developed. The rotating speed of object could be precisely controlled by using a rotation stage thus the bounding or wobbling of the fruit during rotation on roller could be eliminated. Stable rotation of object is important for line scan imaging systems to obtain high quality images of rotating object. By using this system, about 95% of the whole jujube surface area could be observed in one scan pass. A robotic arm with suction pads could be easily integrated into this imaging system and the second image of the jujube under inspection could be captured after rotating the rotation axis of the jujube about horizontal line 90 degree. The area of whole surface can be covered by these two images and used for defect classification. The comparison of classification accuracy of SVM and ANN models trained by using HSI data obtained by linear and rotation scan respectively showed that the models trained with the use of rotation scan data had higher accuracy than those trained with the use of linear scan data. This line scan HSI system for rotating objects and the defect classification models can be integrated into current automatic jujube grading systems which grades jujubes by weight, and has the potential to be used for the surface defect detection of other fruits, such as peach, pear, and apple. In order to promote the use of hyperspectral imaging for the defect detection of fruits with a glossy surface, further illumination optimization is recommended to reduce the glare.
Author Contributions
Q.T.P., experimental setup, software implementation, data collection and manuscript preparation; N.-S.L., total planning, experimental setup design, sortware design, manuscript revise and correspondence. All authors have read and agreed to the published version of the manuscript.
Funding
This work was supported by the Council of Agriculture (Taiwan) (Grant Number: 109AS-11.3.2-ST-aA).
Conflicts of Interest
The authors declare no conflict of interest.
References
- Li, Q.Z.; Wang, M.H.; Gu, W.K. Computer vision based system for apple surface defect detection. Comput. Electron. Agric. 2002, 36, 215–223. [Google Scholar] [CrossRef]
- Baneh, N.M.; Navid, H.; Kafashan, J. Mechatronic components in apple sorting machines with computer vision. J. Food Meas. Charact. 2018, 12, 1135–1155. [Google Scholar] [CrossRef]
- Pu, Y.Y.; Feng, Y.Z.; Sun, D.W. Recent Progress of Hyperspectral Imaging on Quality and Safety Inspection of Fruits and Vegetables: A Review. Compr. Rev. Food Sci. F 2015, 14, 176–188. [Google Scholar] [CrossRef]
- Leemans, V.; Magein, H.; Destain, M.F. On-line fruit grading according to their external quality using machine vision. Biosyst. Eng. 2002, 83, 397–404. [Google Scholar] [CrossRef]
- Vidal, A.; Talens, P.; Prats-Montalban, J.M.; Cubero, S.; Albert, F.; Blasco, J. In-Line Estimation of the Standard Colour Index of Citrus Fruits Using a Computer Vision System Developed For a Mobile Platform. Food Bioprocess Technol. 2013, 6, 3412–3419. [Google Scholar] [CrossRef]
- Hossain, M.S.; Al-Hammadi, M.; Muhammad, G. Automatic Fruit Classification Using Deep Learning for Industrial Applications. IEEE Trans. Ind. Inform. 2019, 15, 1027–1034. [Google Scholar] [CrossRef]
- El-Bendary, N.; El Hariri, E.; Hassanien, A.E.; Badr, A. Using machine learning techniques for evaluating tomato ripeness. Expert Syst. Appl. 2015, 42, 1892–1905. [Google Scholar] [CrossRef]
- Zou, X.B.; Zhao, J.W.; Li, Y.X.; Holmes, M. In-line detection of apple defects using three color cameras system. Comput. Electron. Agric. 2010, 70, 129–134. [Google Scholar]
- Reese, D.; Lefcourt, A.M.; Kim, M.S.; Lo, Y.M. Using parabolic mirrors for complete imaging of apple surfaces. Bioresour. Technol. 2009, 100, 4499–4506. [Google Scholar] [CrossRef]
- Brauers, J.; Schulte, N.; Aach, T. Multispectral Filter-Wheel Cameras: Geometric Distortion Model and Compensation Algorithms. IEEE Trans. Image Process. 2008, 17, 2368–2380. [Google Scholar] [CrossRef]
- Kleynen, O.; Leemans, V.; Destain, M.F. Development of a multi-spectral vision system for the detection of defects on apples. J. Food Eng. 2005, 69, 41–49. [Google Scholar] [CrossRef]
- Huang, W.Q.; Li, J.B.; Wang, Q.Y.; Chen, L.P. Development of a multispectral imaging system for online detection of bruises on apples. J. Food Eng. 2015, 146, 62–71. [Google Scholar] [CrossRef]
- Wu, D.; Sun, D.W. Advanced applications of hyperspectral imaging technology for food quality and safety analysis and assessment: A review—Part I: Fundamentals. Innov. Food Sci. Emerg. 2013, 19, 1–14. [Google Scholar] [CrossRef]
- Lu, Y.Z.; Huang, Y.P.; Lu, R.F. Innovative Hyperspectral Imaging-Based Techniques for Quality Evaluation of Fruits and Vegetables: A Review. Appl. Sci. 2017, 7, 189. [Google Scholar] [CrossRef]
- Wang, N.N.; Sun, D.W.; Yang, Y.C.; Pu, H.B.; Zhu, Z.W. Recent Advances in the Application of Hyperspectral Imaging for Evaluating Fruit Quality. Food Anal. Methods 2016, 9, 178–191. [Google Scholar] [CrossRef]
- Jiang, H.; Zhang, C.; He, Y.; Chen, X.X.; Liu, F.; Liu, Y.D. Wavelength Selection for Detection of Slight Bruises on Pears Based on Hyperspectral Imaging. Appl. Sci. 2016, 6, 450. [Google Scholar] [CrossRef]
- Pan, L.Q.; Zhang, Q.; Zhang, W.; Sun, Y.; Hu, P.C.; Tu, K. Detection of cold injury in peaches by hyperspectral reflectance imaging and artificial neural network. Food Chem. 2016, 192, 134–141. [Google Scholar] [CrossRef]
- Sun, Y.; Gu, X.Z.; Sun, K.; Hu, H.J.; Xu, M.; Wang, Z.J.; Tu, K.; Pan, L.Q. Hyperspectral reflectance imaging combined with chemometrics and successive projections algorithm for chilling injury classification in peaches. Lwt-Food Sci. Technol. 2017, 75, 557–564. [Google Scholar] [CrossRef]
- Fan, S.X.; Li, C.Y.; Huang, W.Q.; Chen, L.P. Data Fusion of Two Hyperspectral Imaging Systems with Complementary Spectral Sensing Ranges for Blueberry Bruising Detection. Sensors 2018, 18, 4463. [Google Scholar] [CrossRef]
- Siedliska, A.; Baranowski, P.; Zubik, M.; Mazurek, W.; Sosnowska, B. Detection of fungal infections in strawberry fruit by VNIR/SWIR hyperspectral imaging. Postharvest Biol. Technol. 2018, 139, 115–126. [Google Scholar] [CrossRef]
- Vashpanov, Y.; Heo, G.; Kim, Y.; Venkel, T.; Son, J.-Y. Detecting Green Mold Pathogens on Lemons Using Hyperspectral Images. Appl. Sci. 2020, 10, 1209. [Google Scholar] [CrossRef]
- Imou, K.; Kaizu, Y.; Morita, M.; Yokoyama, S. Three-dimensional shape measurement of strawberries by volume intersection method. T Asabe 2006, 49, 449–456. [Google Scholar] [CrossRef]
- Sun, Y.; Xiao, H.; Tu, S.; Sun, K.; Pan, L.; Tu, K. Detecting decayed peach using a rotating hyperspectral imaging testbed. Lwt-Food Sci. Technol. 2018, 87, 326–332. [Google Scholar] [CrossRef]
- Lu, G.L.; Wang, D.S.; Qin, X.L.; Halig, L.; Muller, S.; Zhang, H.Z.; Chen, A.; Pogue, B.W.; Chen, Z.G.; Fei, B.W. Framework for hyperspectral image processing and quantification for cancer detection during animal tumor surgery. J. Biomed. Opt. 2015, 20, 126012. [Google Scholar] [CrossRef] [PubMed]
- Vapnik, V. The Nature of Statistical Learning Theory, 2nd ed.; Springer: New York, NY, USA, 2000. [Google Scholar]
- Vapnik, V. Statistical Learning Theory; Wiley: New York, NY, USA, 1998. [Google Scholar]
- Burges, C.J.C. A tutorial on Support Vector Machines for pattern recognition. Data Min. Knowl. Discov. 1998, 2, 121–167. [Google Scholar] [CrossRef]
- Zhang, C.; Guo, C.T.; Liu, F.; Kong, W.W.; He, Y.; Lou, B.G. Hyperspectral imaging analysis for ripeness evaluation of strawberry with support vector machine. J. Food Eng. 2016, 179, 11–18. [Google Scholar] [CrossRef]
- Weng, S.Z.; Yu, S.; Dong, R.L.; Pan, F.F.; Liang, D. Nondestructive detection of storage time of strawberries using visible/near-infrared hyperspectral imaging. Int. J. Food Prop. 2020, 23, 269–281. [Google Scholar] [CrossRef]
- Siedliska, A.; Baranowski, P.; Mazurek, W. Classification models of bruise and cultivar detection on the basis of hyperspectral imaging data. Comput. Electron. Agric. 2014, 106, 66–74. [Google Scholar] [CrossRef]
- Ji, Y.; Sun, L.; Li, Y.; Li, J.; Liu, S.; Xie, X.; Xu, Y. Non-destructive classification of defective potatoes based on hyperspectral imaging and support vector machine. Infrared Phys. Technol. 2019, 99, 71–79. [Google Scholar] [CrossRef]
- Hong, Z.; He, Y. Rapid and Nondestructive Discrimination of Geographical Origins of Longjing Tea using Hyperspectral Imaging at Two Spectral Ranges Coupled with Machine Learning Methods. Appl. Sci. 2020, 10, 1173. [Google Scholar] [CrossRef]
- Kavdir, I.; Guyer, D.E. Apple sorting using artificial neural networks and spectral imaging. T Asae 2002, 45, 1995–2005. [Google Scholar] [CrossRef]
- Yang, Q. Classification of apple surface features using machine vision and neural networks. Comput. Electron. Agric. 1993, 9, 1–12. [Google Scholar] [CrossRef]
- Miller, W.M.; Throop, J.A.; Upchurch, B.L. Pattern recognition models for spectral reflectance evaluation of apple blemishes. Postharvest Biol. Technol. 1998, 14, 11–20. [Google Scholar] [CrossRef]
- ElMasry, G.; Wang, N.; Vigneault, C. Detecting chilling injury in Red Delicious apple using hyperspectral imaging and neural networks. Postharvest Biol. Technol. 2009, 52, 1–8. [Google Scholar] [CrossRef]
- Steinbrener, J.; Posch, K.; Leitner, R. Hyperspectral fruit and vegetable classification using convolutional neural networks. Comput. Electron. Agric. 2019, 162, 364–372. [Google Scholar] [CrossRef]
- Bennedsen, B.S.; Peterson, D.L.; Tabb, A. Identifying apple surface defects using principal components analysis and artificial neural networks. T Asabe 2007, 50, 2257–2265. [Google Scholar]
© 2020 by the authors. Licensee MDPI, Basel, Switzerland. This article is an open access article distributed under the terms and conditions of the Creative Commons Attribution (CC BY) license (http://creativecommons.org/licenses/by/4.0/).