Article

Fabrication of Edge Rounded Polylactic Acid Biomedical Stents by the Multi-Axis Micro-Milling Process

Department of Mechanical Engineering, National Taiwan University of Science and Technology, No. 43, Keelung Rd., Sec. 4, Taipei 10607, Taiwan
*
Author to whom correspondence should be addressed.
Appl. Sci. 2020, 10(8), 2809; https://doi.org/10.3390/app10082809
Submission received: 30 March 2020 / Revised: 12 April 2020 / Accepted: 16 April 2020 / Published: 18 April 2020
(This article belongs to the Section Mechanical Engineering)

Abstract

:
This paper presents the first try to fabricate degradable polylactic acid (PLA) biomedical stents with round edges by the multi-axis micro-milling process. Conventionally biomedical stents are produced by laser processing. Post-processing operations are usually required to handle sharp edges and thermal defects of the stent due to laser processing. A computer graphics software package was used to design the strut structures with round corners of the PLA stent. A PLA tube was first created using injection molding, and a degradable biomedical stent was then fabricated through micro-milling by using a five-axis computer numerical control (CNC) machine tool. This study investigated the error in the rotation center that can occur during five-axis micro-milling. Data obtained from experiments on center-of-rotation errors were substituted into homogeneous coordinate conversion formulas. Center-of-rotation errors in the five-axis machine tool were compensated for improving the milling precision (A and C axes) to be within 5 μ m. Furthermore, milling parameter optimization experiments were conducted, which determined the optimal conditions for milling PLA to be a spindle speed of 60,000 rpm, feed per tooth of 0.005 mm, and feed rate of 600 mm/min, and achieved the minimum burr 0.01 mm and the average surface roughness (Ra) 0.4 μ m. These optimal cutting parameters will be used in the following actual stent processing experiments. Finally, the error compensation and optimal parameters were combined in a CAM software package and layered spiral micromilling to machine the actual stent. The experimental results revealed that the combination of five-axis micro-milling led to the successful fabrication of a degradable biomedical stent (stent diameter = 6 mm, strut width = 0.3 mm, and radius at round corners = 0.1 mm). The machined actual stent had cross-section height and width errors within 0.01 mm, and arc depth of cut variation within 6 μ m. In addition, the PLA stent machining results indicated a rebound of approximately 33% at the strut round edge machining. This work may also open up future possibilities for complex three-dimensionally structured biomedical stents for better performance and special functionality.

1. Introduction

Traditional biomedical stents are made from stainless steel and nickel–titanium alloy [1,2], and their grid structure is fabricated through laser processing [3], which, however, often results in problems including residual thermal stress, poor surface roughness, and sharp corners of the structure. Scholars have employed femtosecond laser processing to round the sharp corners and reduce the size of the melted zone on the surface; however, many problems remain [4,5]. Postprocessing is thus required after laser processing to improve the quality of the stent surface and round the corners of the stent structure. Common postprocessing methods include sandblasting, chemical etching, and electropolishing [6]. Although these methods can produce high-quality surfaces and round corners, they require considerable work and time and have a high associated cost. In addition, the postprocessing operations may cause the loss of stent struts’ width and shape accuracy [3,4,5,6]. Moreover, because metal (stainless steel or nickel–titanium alloy) stents are not human body tissues, the body often rejects them, and the stents may have to be placed in the body permanently, making removal difficult. These factors all increase the risk of unpredictable body damage. Therefore, studies in which new stents have been developed have tended to use materials that are degradable by the body, such as PLA. PLA is a type of polymer material and is obtained from natural cellulose or starch. Because it is biodegradable and has satisfactory processing characteristics and mechanical properties [7], PLA is widely applied in packaging, vessels, and bioengineering devices such as bone screws, bone plates, surgical sutures, and carriers for drug release [8,9,10].
In the current industrial manufacturing, five-axis machine tools have been employed in the manufacturing of numerous products. The merits of these machines include that they overcome the limitation of cutter length, solve the problem of static cutting, are highly efficient at bevel processing, can process complex geometric shapes, reduce the number of times that workpiece installment is required, increase the size precision, and simplify the form of cutters [11]. Coordinate conversion formulas and computer-aided design or manufacturing tools can be employed to prevent interference during cutting and obtain the optimal cutting path [12,13,14]. The precision error of five-axis machine tools results from the static positioning error and dynamic tracking error. The static positioning error affects the processing precision between two points [15], whereas the dynamic tracking error affects the difference between the actual cutting path and instruction path. In practice, a linear variable differential transformer, which is a built-in retractable component for measuring displacement, can be used in the telescoping magnetic double ballbar testing to measure the error of circular motion of the feed axes and to compensate for the error [16]. For the eccentric error that refers to the cutter deviation from the rotation axis because of the geometric imperfection of the cutter, surface milling is performed using a ball end mill inclined at 45 . The cusp height and pick feed on the surface are then measured and incorporated into the derived ball end mill radius compensation equation to obtain the correct outer diameter of the cutter [17].
Performing cutting at the microscale easily results in errors of the minimum cutting depth and material springback. For example, when aluminum is cut, the minimum cutting thickness and cutter radius are of the same order. If the cutting thickness is 0.2–0.3 times the cutter radius, the residual stress and roughness of the surface after processing are increased [18]. In addition, when the cutting depth is smaller than the critical cutting depth, material deformation may occur [19]. In a study on the relationship between material resilience and hardness, a scraping experiment was conducted, and the results revealed the relationship equation between theoretical cutting depth and real cutting depth. The study verified that the equation can be applied to the cutting of both metal and polymer materials [20]. Bang et al. [21] performed cutting using a micro milling cutter with a diameter of 0.2 mm to fabricate a copper column with a size of 30 × 30 × 320 μ m 3 (aspect ratio of 10.6) and then used scraping to investigate the relationship between the feed rate and amount of springback. Islam et al. [22] conducted a test on copper materials with different crystallization directions and discovered that the scraping speed of 333 nm/s achieved the highest cutting depth and lowest springback. The springback was also dependent on the crystallization direction.
Eckman et al. [23] investigated the resilience of polymer materials, using a micro-end mill (the edge of which had a radius of 48 μ m) to conduct an undercut experiment on acrylic materials. They discovered that, under various cutting depths, when the springback direction was vertical to the cutting tool feed direction and the cutting depth was smaller than 15 μ m, the springback rate was 100% and almost no chips were produced. When the cutting depth was larger than the cutter edge radius, the springback rate was approximately 30%. Carr et al. [24] performed cutting on polymer materials with different glass transition temperatures by using a diamond cutter and different feed speeds. When the feed speed was increased in the early cutting period, the surface roughness was improved considerably. However, as the feed speed was increased further, the chips were removed though breaking; removal of the original material resulted in poor surface roughness. Xiao et al. [25] conducted a cutting experiment on injection-molded high-density and low-density polyethylene by using a grinding machine and various cutting speeds. The results revealed that, when the cutting speed was increased by 30,000 mm/min, the high-density polyethylene had higher mechanical strength and surface quality than the low-density polyethylene. However, even higher cutting speed resulted in chip breaking, which in turn caused lower surface quality. The temperature elevation during cutting also led to softening of the polymer material.
In a study using PLA to produce biomedical stents, a CO 2 laser was employed to fabricate poly-l-lactic acid (PLLA) and PLLA/polycaprolactone/triethyl citrate stents. The simulation prediction and mechanical property testing results revealed that the stents produced using PLLA had the mechanical properties required for degradable stents [26]. Stepak et al. [27] used a CO 2 laser to produce poly (lactic acid-co-glycolic acid) and PLLA stents. They discovered that, by using the CO 2 laser, they could obtain small conicity of the side wall of the stents. Regarding the mechanical property, because a large heat-affected zone existed during CO 2 laser processing, the Young’s modulus of the stents was 37% larger than that of the stents produced using excimer laser machining. Using electrospinning, Wang [28] created artificial blood vessel cell growth stents with different directions of fiber arrangement at various collection speeds by using solutions of different proportions of PLA and polycaprolactone. The inner diameter, outer diameter, and wall thickness of the stents were 4.1, 5, and 0.45 mm, respectively. In addition, Teng [29] employed circular heat transfer technology to fabricate PLA into a plate shape, which was then rolled into a round tube. The round tube was subsequently used in a circular transfer system to produce cardiovascular stents with a diameter of 10 mm and thickness of 0.7 mm.
In this study, PLA, a biodegradable polymer material, was employed as a stent material to develop a degradable biomedical stent through micromilling using a five-axis machine tool. After making a round PLA tube through injection molding, a computer graphics software package (SolidWorks 2013) was used to design a three-dimensional PLA stent, with grid patterns on the outer surface of the PLA tube and an edge rounded fan-shaped cross-section. Subsequently, a five-axis machine tool was employed to fabricate the designed PLA biomedical stent through micromilling. To prevent a rotation center error, which can be produced through five-axis machining, this study performed an error measurement experiment and used the homogeneous coordinate conversion formula to compensate for the rotation center error resulting from five-axis machining. Finally, on the basis of the aforementioned error compensation and optimal cutting condition, CAM software was employed in the layered circular milling method to process the stent. The five-axis machining-based milling process proposed in this study, which is a continual and one-time process, can achieve the fabrication of degradable PLA stents with high surface quality and smooth geometric shape (i.e., no sharp corners in the stent structure), thereby overcoming the numerous problems with biomedical stents that are produced through laser processing.

2. Experimental

2.1. Material and Design of the PLA Biomedical Stent

This study used injection molding to fabricate biodegradable tube with polylactic acid (Nature Works ® PLA Polymer 3001D, Minnetonka, MN, USA) as the raw material. A computer graphics software package (SolidWorks 2013, Dassault Systèmes SolidWorks Corporation, Waltham, MA, USA) was used to design a stent with 9 × 6 horizontal and vertical array struts, a fan-shaped cross section with top round corners (radius 0.1 mm), and a cylindrical diameter and wall thickness of 6 mm and 0.3 mm, respectively. The stent’s strut width is 0.3 mm typically. The design can achieve mechanical specifications for biliary stent application according to the finite element analysis [30].

2.2. Experiment on PLA Cutting Parameter Optimization

This study used a five-axis machine tool (UX300, Quaser) combined with a high speed spindle (HES810, maximum speed of rotation = 80,000 rpm) to perform micromilling on the PLA stents. Cutting PLA tends to cause poor surface quality and burrs. Therefore, this study referenced a cutting parameter optimization experiment devised by Carr et al. [24] and used end mills (0.3 mm in diameter) and a fixed cutting depth of 0.03 mm. Three cutting experiments were performed with varying parameters, such as feed rate, feed per tooth, and spindle speed. The surface quality and burrs of the specimens were observed to determine the optimal cutting parameters. The cutting parameters of Experiment 1 were as follows: the feed rate was fixed at 600 mm/min with varying feed per tooth at 0.05, 0.03, 0.01, 0.005, and 0.003 mm. The cutting formula was as follows [31]:
F = f t N
where F is the feed rate; f is the feed per tooth; t is the number of flutes; and N is the spindle speed. Through calculating, the corresponding spindle speeds were 6000, 10,000, 30,000, 60,000, and 80,000 rpm, which are equal to the cutting speed 339, 565, 1696, 3391, and 4522 m / s , based on the aforementioned parameter settings. The optimal feed per tooth would be obtained according to the experimental results of Experiment 1. Parameter settings of Experiment 2 used the optimal feed per tooth as a fixed value and the varying spindle speeds used in Experiment 1 (6000, 10,000, 30,000, 60,000, and 80,000 rpm). Subsequently, (1) was used to calculate the feed rates (F) corresponding to the varying speeds, and the Experiment 2 results would determine the optimal spindle speed. Parameter settings of Experiment 3 used a fixed optimal spindle speed and varying feed per tooth (0.05, 0.03, 0.01, 0.005, and 0.003 mm). Again, (1) was used to calculate the feed rates (F) corresponding to the varying feed per tooth, and the results would determine the optimal cutting parameters for minimum burrs.

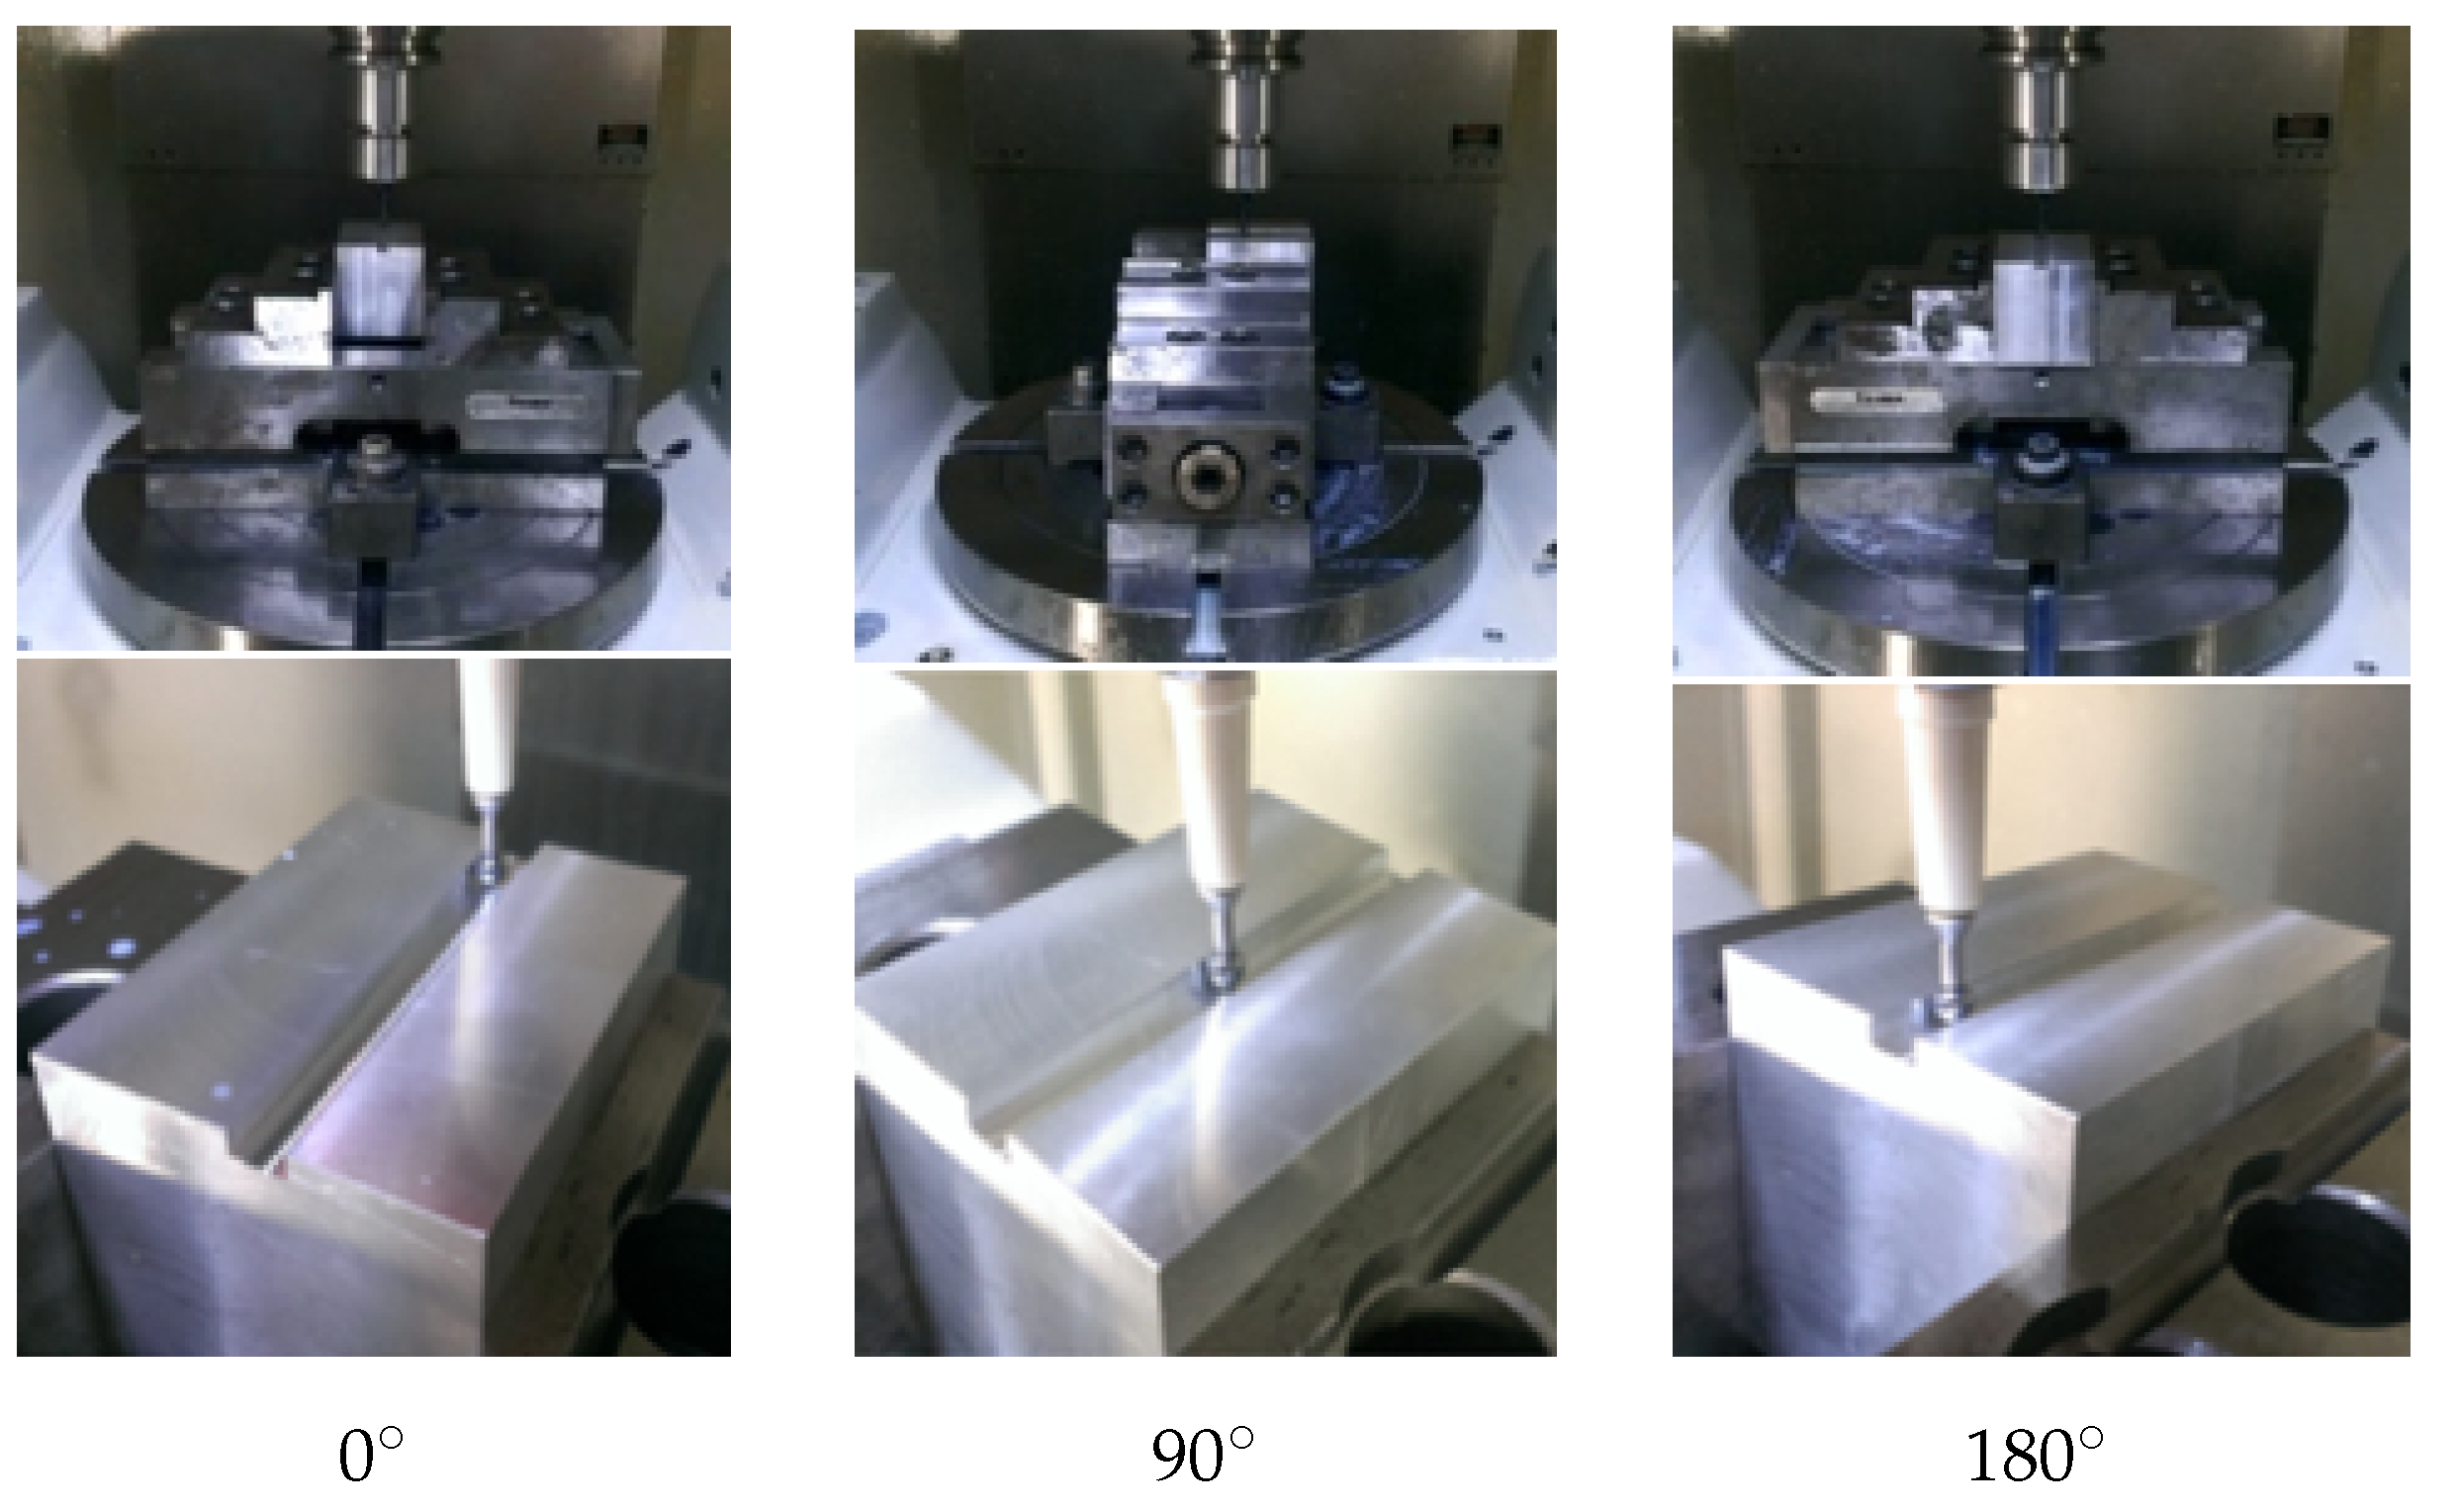
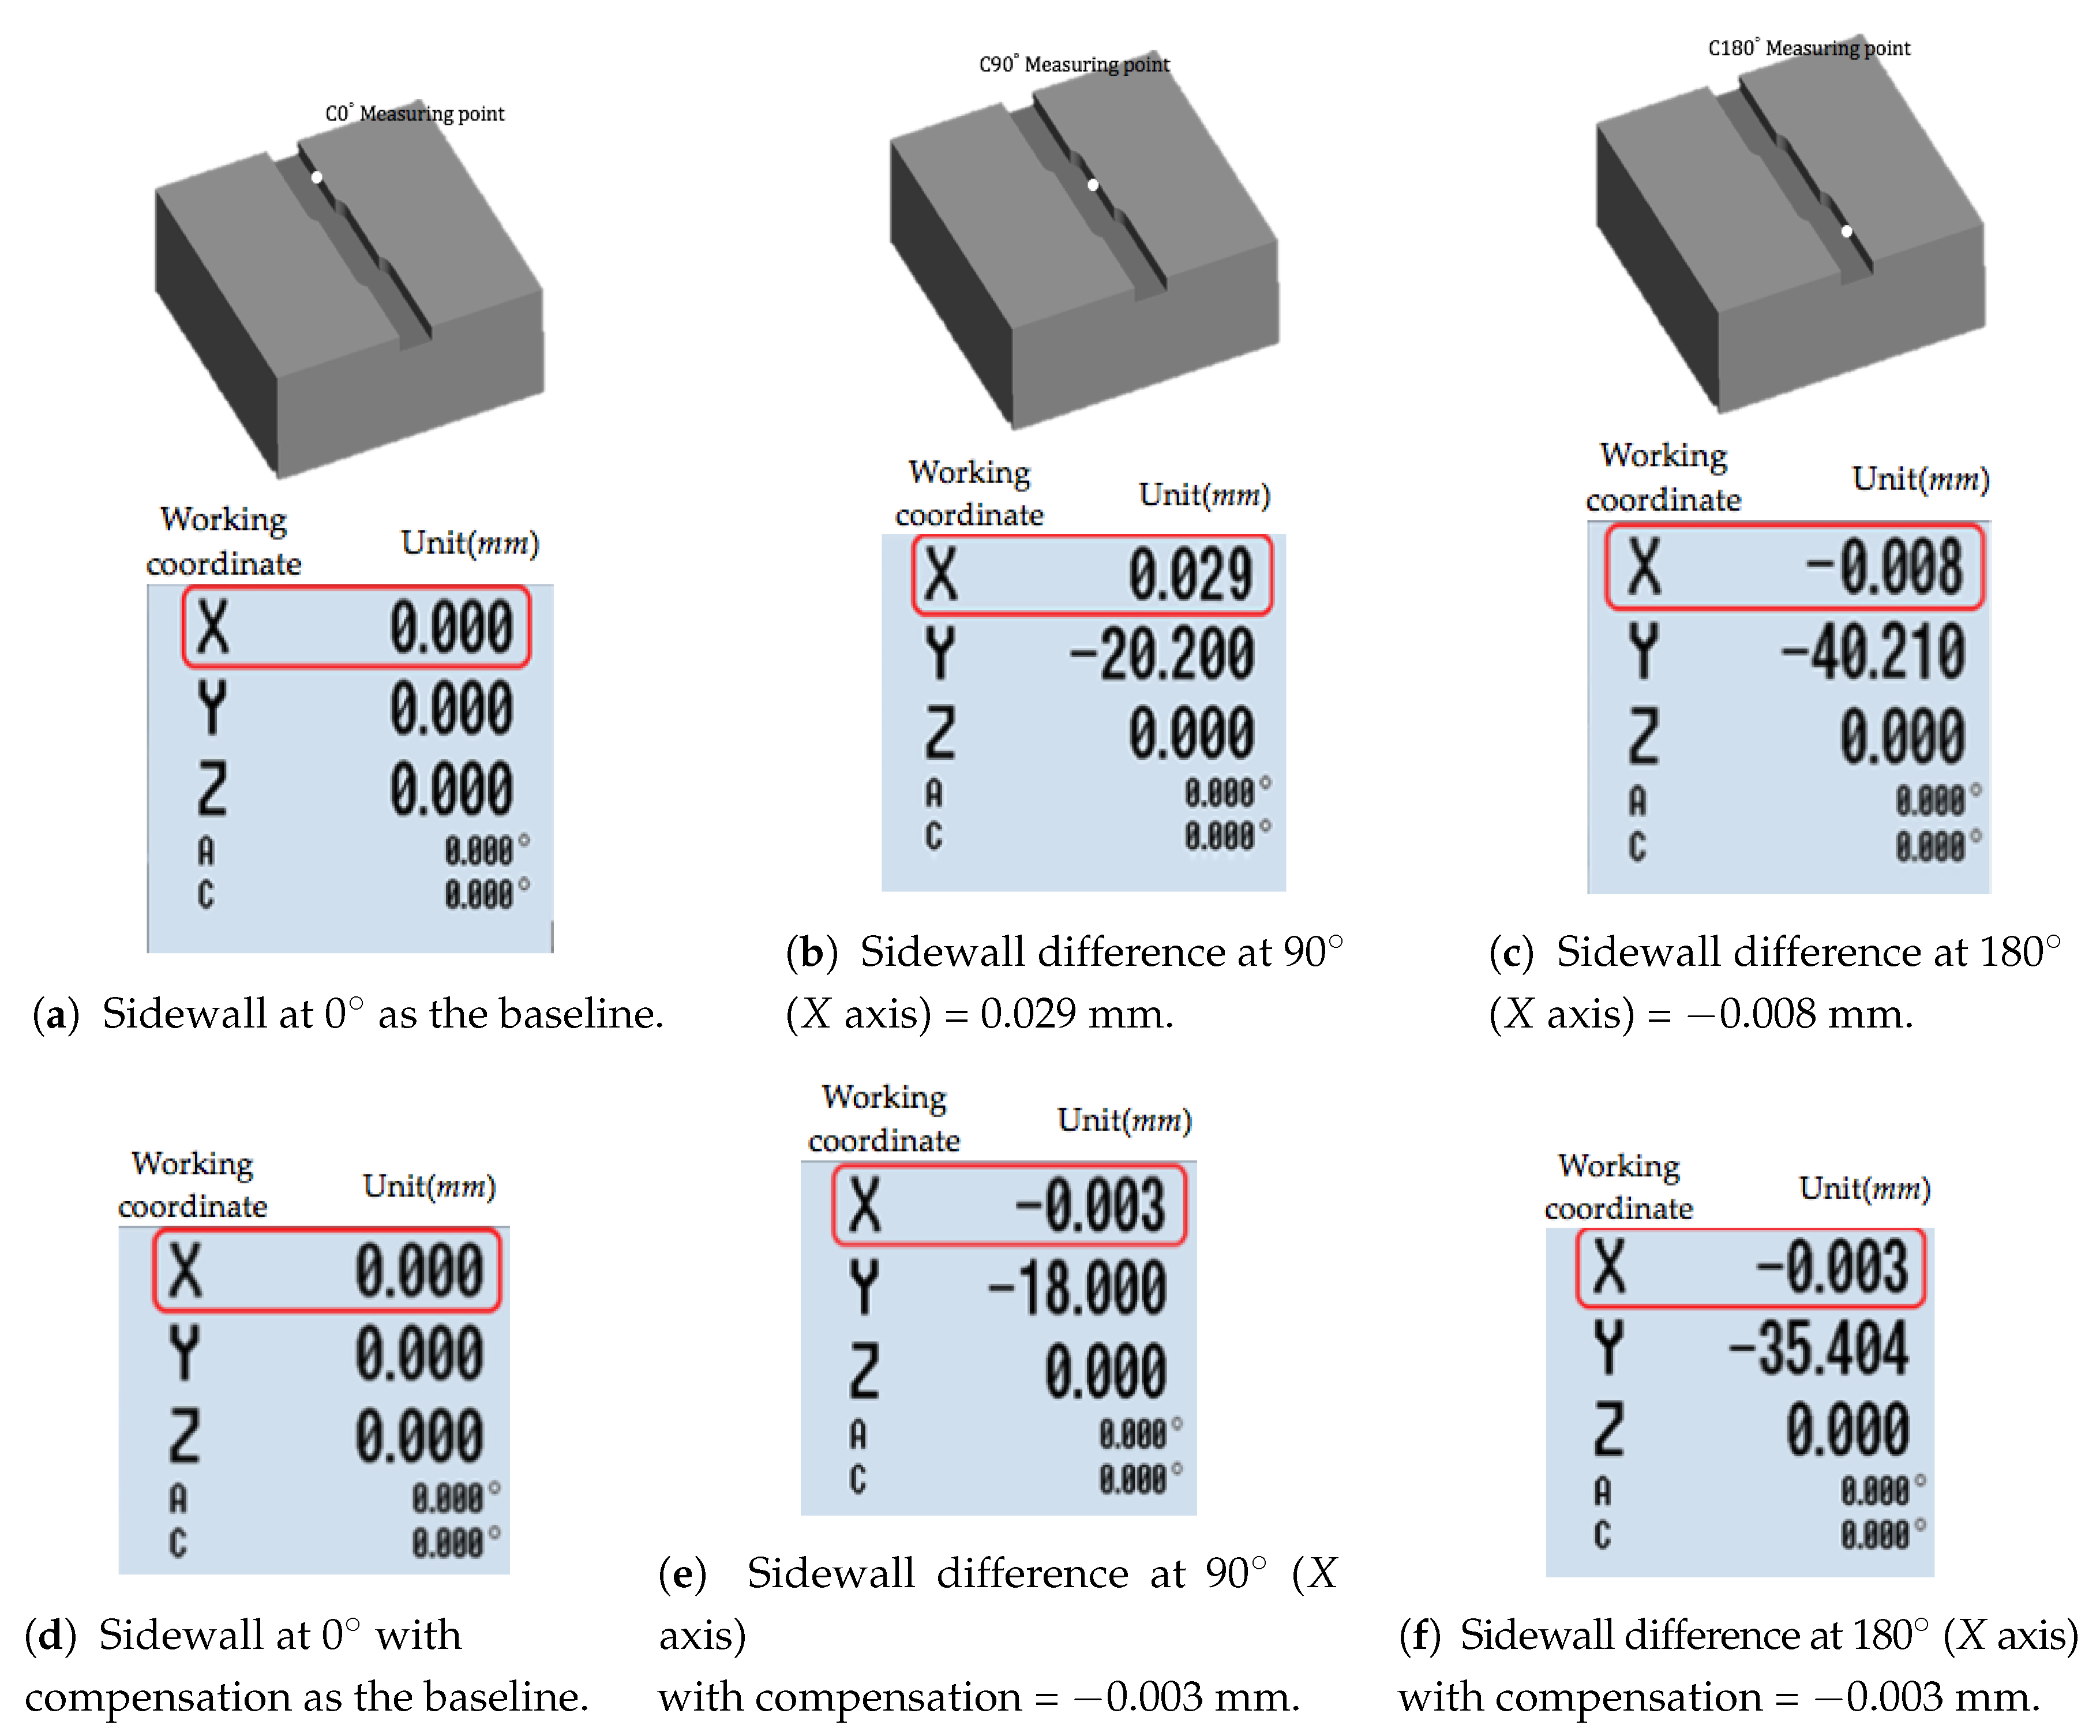
2.3. Center-of-Rotation Error Compensation

Figure 1 presents the horizontal motion or rotation directions of each axis of the five-axis machine tool. Before the five-axis machine tool was used for machining, its center of rotation had to be corrected. If the center of rotation was inaccurate, errors could occur because of the cutting table’s center-of-rotation positions recorded on the control system and the actual positions being different; such errors would divert the cutting track and affect machine precision of workpiece dimensions. Therefore, this study referenced the homogeneous transformation matrix proposed by Litvin et al. [32] to create formulas for calculating center-of-rotation errors, as well as to compensate errors in center-of-rotation positions along the A and C axes to mitigate the errors’ effect on the precision of workpiece dimensions. During simultaneous machining using the five-axis machine tool, the center-of-rotation error along the A axis most directly affected the tool length. To simplify formula calculations, d y A and d z A were defined as the error values of Y and Z components of the center of rotation of the five-axis machine tool’s A axis, respectively; in Figure 2, θ A is the angle of rotation of the A axis.
In Figure 2, the circular dotted line with a circular center O(0,0) on the Y Z plane represents a cutting track without any center-of-rotation errors along the A axis; by contrast, the solid line represents a cutting track with d y A and d z A errors along the A axis. The inferred formulas for compensating center-of-rotation errors along the A axis are presented in (2) and (3):
Error along the y-axis:
Δ Y = d y A + c o s [ θ A ] d y A + s i n [ θ A ] d z A
Error along the Z axis:
Δ Z = s i n [ θ A ] d y A d z A + c o s [ θ A ] d z A
The measured depth of cut differences D 1 and D 2 and two known angles of rotation, 45 and 90 , were substituted into (3), where D 1 and D 2 had identical physical meanings to that of the error along the Z axis ( Δ Z), to determine the center-of-rotation error values along the A axis ( d y A and d z A ).
This study used a 5 mm ball end mill and set the table’s angles of rotation along the A axis at 0 , 45 , and 90 to cut a groove on the workpiece surface. If the center of rotation of the A axis presented no error, the cut groove generated no difference in the depth of cut, as shown in Figure 3a,b. The depth of cut differences of the cut grooves were measured using 3D-Probe (Haff&Schneidr, Analogue). The depth of cut at 0 was used as the base point (no error occurred at 0 along the A axis). The depth of cut values at 45 and 90 were measured ( D 1 and D 2 , respectively), as shown in Figure 3c.
In addition, during the five-axis machine tool’s cutting process, any center-of-rotation error along the C axis directly affects the eccentric state of machined workpieces. To simplify the calculation of the inferred formula, d x c and d y c were defined as center-of-rotation errors along the C axis and θ c was the angle of rotation along the C axis, as shown in Figure 4.
In Figure 4, the circular dotted line with a circular center O(0,0) on the X Y plane represents a cutting track without any center-of-rotation errors along the C axis; by contrast, the solid line represents a cutting track with center-of-rotation errors of d x c and d y c along the C axis. The inferred formulas for compensating center-of-rotation errors along the C axis are presented in (4) and (5):
Error along the X axis:
Δ X = D 4 = d x c + c o s [ θ c ] d x c + s i n [ θ c ] d y c
Error along the Y axis:
Δ Y = D 3 = s i n [ θ c ] d x c d y c + c o s [ θ c ] d y c
The measured differences of side walls D 3 and D 4 and two known angles of rotation, 90 and 180 , were substituted into (4) and (5), where D 3 and D 4 had identical physical meanings to Δ X and Δ Y ), to determine the center-of-rotation errors along the C axis, d x c and d y c .
In the experiment on center-of-rotation errors along the C axis, a 5 mm end mill was used in combination with varying angles of rotation of the table along the C axis ( 0 , 90 , and 180 ) to cut a groove on the workpiece surface. If no center-of-rotation error occurred along the C axis, the cut groove would not form “step difference,” as shown in Figure 5a,b. Subsequently, 3D-Probe was used to measure the differences in sidewalls of the cut groove (measurement faces had to be on the same side), and groove sidewalls cut at the rotation angle of 0 were used as the baseline (no error at 0 of rotation). The groove depth values at 90 and 180 were measured ( D 3 and D 4 , respectively), as shown in Figure 5c.
After the experiments to identify center-of-rotation error values along the A and C axes ( d y A , d z A , d x c , and d y c ), the point coordinates P( X 0 , Y 0 , Z 0 ) in a numerical control (NC) program was rotated against the origins on the X Y and Y Z planes (the angles of rotation were calculated according to steps in corresponding sections) to obtain the machining point Q( X 1 , Y 1 , Z 1 ). Subsequently, the machining point Q( X 1 , Y 1 , Z 1 ) was counter-rotated against the origin ( d x c , d y c ) on the X Y plane and the origin ( d y A , d z A ) on the YZ plane to obtain the compensated NC point coordinates R( X 2 , Y 2 , Z 2 ), which was the correct machining point. The coordinates of the compensated R( X 2 , Y 2 , Z 2 ) were calculated using (6)–(8):
X 2 = X 0 ( 1 + c o s [ θ c ] ) d x c + s i n [ θ c ] ( ( 1 + c o s [ θ A ] ) d y A + d y c s i n [ θ A ] d z A )
Y 2 = Y 0 s i n [ θ c ] d x c + d y c c o s [ θ c ] ( ( 1 + c o s [ θ A ] ) d y A + d y c s i n [ θ A ] d z A )
Z 2 = Z 0 s i n [ θ A ] d y A ( 1 + c o s [ θ A ] ) d z A

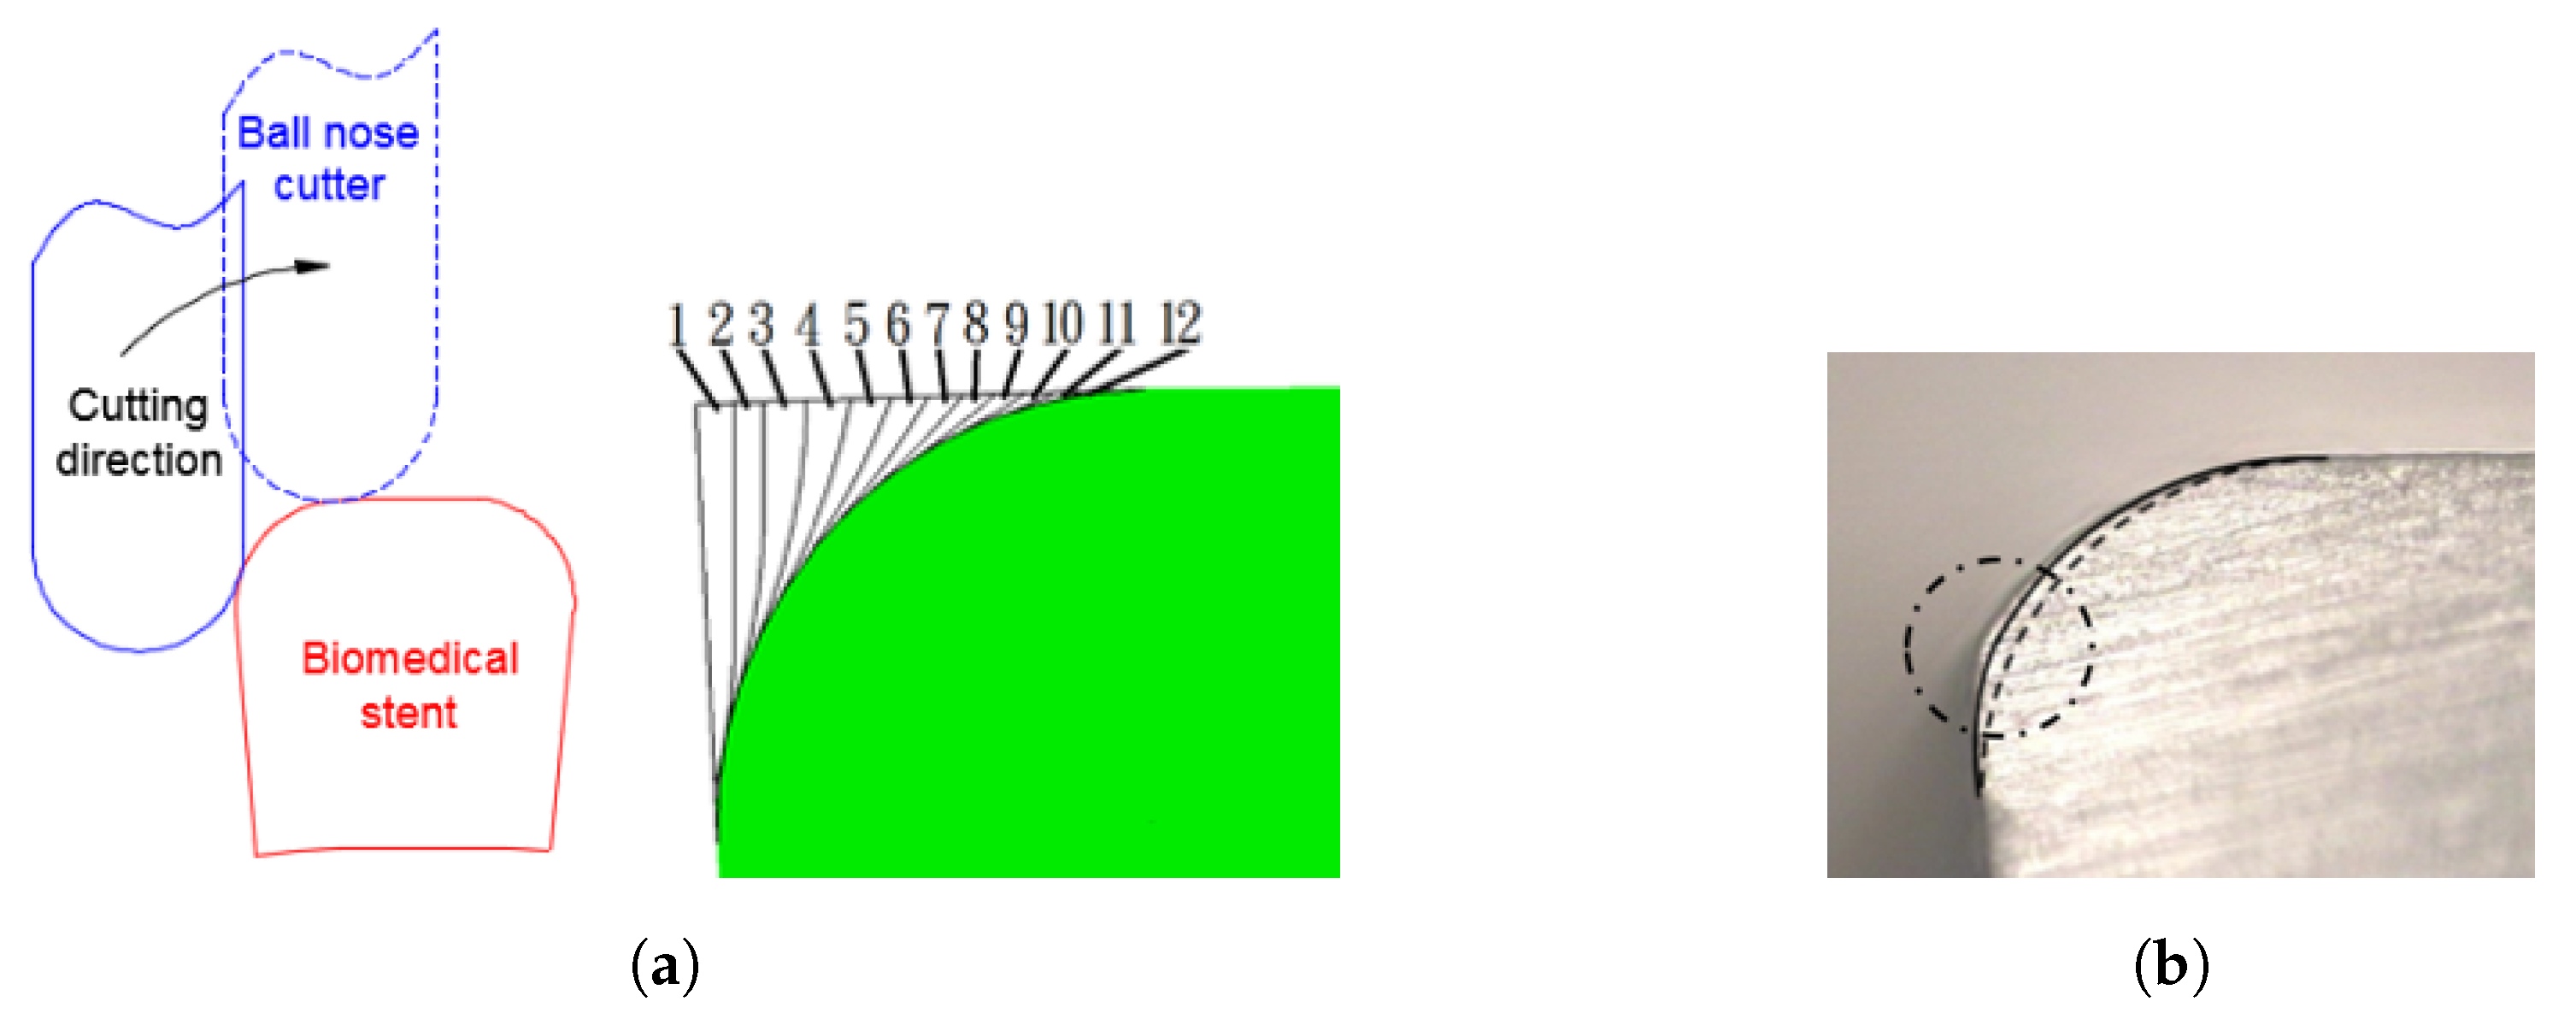
2.4. Cutting Path Planning in Five-Axis Computer-Aided Manufacturing (CAM) of Stents and Actual Stent Machining

The degradable PLA biomedical stent developed in this study is compact in size, has relatively low strength, and a glass transition temperature of approximately 60 C; thus, it has numerous machining constraints. This study used a CAM software package (PowerMILL) as well as applied layered spiral machining methods and results of the cutting parameter optimization experiment to plan the cutting parameters and paths of cutting tools. The edge of the cutting tool was used to cut downward layer by layer along the stent profile. The depth of cut for each layer was 0.03 mm (total depth of cut = 0.36 mm), as shown in Figure 6a. In the axial control of the cutting tool, the tool axis was defined to always point to the center of the cylinder during machining. Figure 6b illustrates a simulation of layered spiral machining. Next, fillet machining of the vertical edge of stents was performed to form a round corner of a quarter-round with a radius of 0.1 mm. The round corner was produced using layered spiral machining to perform 12 cuts along the arc length (0.157 mm), with the spacing of each cut being 0.0134 mm, as shown in Figure 6c. Figure 6d illustrates the simulated workpiece finished with fillet machining.
This study used the five-axis machine tool combined with a high speed spindle to perform micromilling on the actual biomedical stent. The main cutting tools used were a micro ball end mill (arc with 0.3 mm diameter and 0.15 R radius) and a micromiller (diameter = 0.3 mm). After the stent was machined, local positions segmented by a 120 interval at the top, center, and bottom of the stent structure with and without compensation were cross-sectioned (see Positions 1–9 in Figure 7); the depth of cut of the stent’s round corners, cross-sectional width, and removed thickness on the arc structure were used for error analysis. Figure 8 depicts a cross-section of the stent structure with the cross-sectional height, width, and arc depth of cut labeled.

3. Results and Discussion

3.1. Experiment on PLA Cutting Parameter Optimization

In the cutting parameter optimization experiment, three groups of cutting parameters were planned, including spindle speed, feed per tooth, and feed rate. An end mill with a diameter of 0.3 mm was used to perform path experiments with a fixed 0.03 mm depth of cut. Figure 9 presents the PLA cutting experiment results under the feed rate 600 mm/min, which revealed that a feed per tooth of 0.005 mm, corresponding to the spindle speed 6000 rpm, attained the minimum burr production (0.02 mm).
Subsequently, the optimal feed per tooth (0.005 mm) was fixed and the varying spindle speeds used in Experiment 1 were adopted (6000, 10,000, 30,000, 60,000, and 80,000 rpm). Next, (1) was used to calculate the feed rates (F) corresponding to the varying spindle speeds for Experiment 2; Figure 10 presents the results. When the feed per tooth, spindle speed, and feed rate were 0.005 mm, 60,000 rpm, and 600 mm/min, respectively, the minimum burr production after cutting (0.012 mm) was attained. Experiment 3 employed the optimal spindle speed of 60,000 rpm from Experiment 2 and used varying feed per tooth of 0.05, 0.03, 0.01, 0.005, and 0.003 mm. Then, (1) was used to calculate the feed rates (F) corresponding to the varying feed per tooth; Figure 11 shows the results. Therefore, a spindle speed, feed per tooth, and feed rate of 60,000 rpm, 0.005 mm, and 600 mm/min, respectively, yield the minimum burr production after cutting (0.01 mm). In addition, the surface roughness measurement was performed on the milled sample with the best cutting parameters, and it was found that the average surface roughness (Ra) was 0.4 μ m. These optimal cutting parameters will be used in the following actual stent processing experiments.

3.2. Compensation for Center-of-Rotation Errors

Error compensation for the center-of-rotation was an experiment for center-of-location calibration of the five-axis machine tool. A 5 mm ball end mill was used on the A axis with table angles of rotation of 0 , 45 , and 90 to cut three grooves, as shown in Figure 12. The grooves’ depth of cut differences on the Z axis were measured using 3D-Probe, as shown in Figure 13a–c. The angle of rotation at 0 along the A axis was used as the baseline for the groove depth of cut. The depth of cut differences of angles of rotation at 45 and 90 were D 1 = 0.126 mm and D 2 = 0.206 mm, respectively. The measured depth of cut differences were substituted into (2) and (3) to determine the center-of-rotation errors along the A axis; the deviations were d y A = −0.047 mm and d z A = 0.159 mm on the Y and Z axes, respectively. These values suggested that the actual center of rotation of the machine tool was located at the lower right side of the center of rotation defined by the controller.
A 5 mm end mill was used on the C axis with table angles of rotation at 0 , 90 , and 180 to cut three grooves, as shown in Figure 14. The cut grooves were measured using 3D-Probe. Side walls with 0 angle of rotation along the C axis were used as the baseline to measure the wall differences at 90 and 180 on the X axis, and the differences were determined to be D 3 = 0.029 mm and D 4 = −0.008 mm, respectively, as shown in Figure 15a–c. The side wall differences measured at 90 and 180 angles of rotation along the C axis were substituted into (4) and (5) to determine the center-of-rotation error along the C axis. The deviations on the X and Y axes were d x c = 0.004 mm and d y c = −0.033 mm, respectively.
The errors on the A and C axes ( d y A , d z A , d x c , and d y c ) obtained during the experiments were substituted into (6)–(8) to calculate the compensated errors of the NC program. Subsequently, cutting experiments on the A and C axes were conducted according to the compensated NC program to verify whether the compensation effect was observable. Figure 13d–f depict the actual depth of cut differences on the Z axis for the three grooves cut on the table rotated along the A axis with compensation. The groove depth of cut at 0 of rotation along the A axis was used as the baseline. At 45 and 90 of rotation with compensation, the depth of cut differences were 0.001 and 0.003 mm, respectively. In addition, when the sidewall at 0 of rotation along the C axis was used as the baseline, the sidewall differences on the X axis at 90 and 180 of rotation with compensation were −0.003 and −0.003 mm, respectively, as shown in Figure 15d–f. The experimental results revealed that the compensated differences in cutting were within 5 μ m on both the A and C axes.

3.3. Cutting-Path Planning in Five-Axis CAM of Stents and Actual Stent Machining

Using CAM software PowerMILL, layered spiral machining was adopted to plan the cutting paths of the tools. Actual stent machining was performed after errors were compensated for. After completion of the actual stent, distinct differences between stent structures finished with and without fillet machining were observed, as shown in Figure 16. Figure 16a is similar to the typical cross-section of a stent, with sharp edges, made by laser processing. The cross-section of the stent without fillet machining shows the width 0.309 mm, the height 0.297 mm, and without significant round corner. The cross-section of the stent with fillet machining shows the width 0.302 mm, the height 0.306 mm, and the round corners (the left arch depth 0.073 mm and the right arch depth 0.073 mm).
Figure 17 presents cross-sectional images of Positions 1–9 at the front end, central part, and rear end of the stent (segmented by an interval of a 120 arc) with and without compensation. The cross-section height and width, arc homogeneity, and errors in arc dimensions were analyzed as follows:

3.3.1. Cross-Section Height of the Stent

This study used injection molding to form the tubal structure. During injection molding, heterogeneous internal and external diameters resulted in different cross-section heights of the stent without reaming. The error range was between 0.01 and 0.038 mm and the mean height error was 0.017 mm. Therefore, higher homogeneity in internal and external diameters is necessary. Lathing was used to machine the external diameter of the tubal material to 6 mm; next, reamers (diameter = 5.4 mm) were used for reaming the internal diameter of the tube from 5.2 mm to 5.4 mm. The error range of the cross-section height of the reamed stent was 0.002 to 0.009 mm and the mean height error was 0.004 mm. These results verified that the sidewall thickness of the tube after reaming approached an identical value, thereby increasing the homogeneity of stent heights.

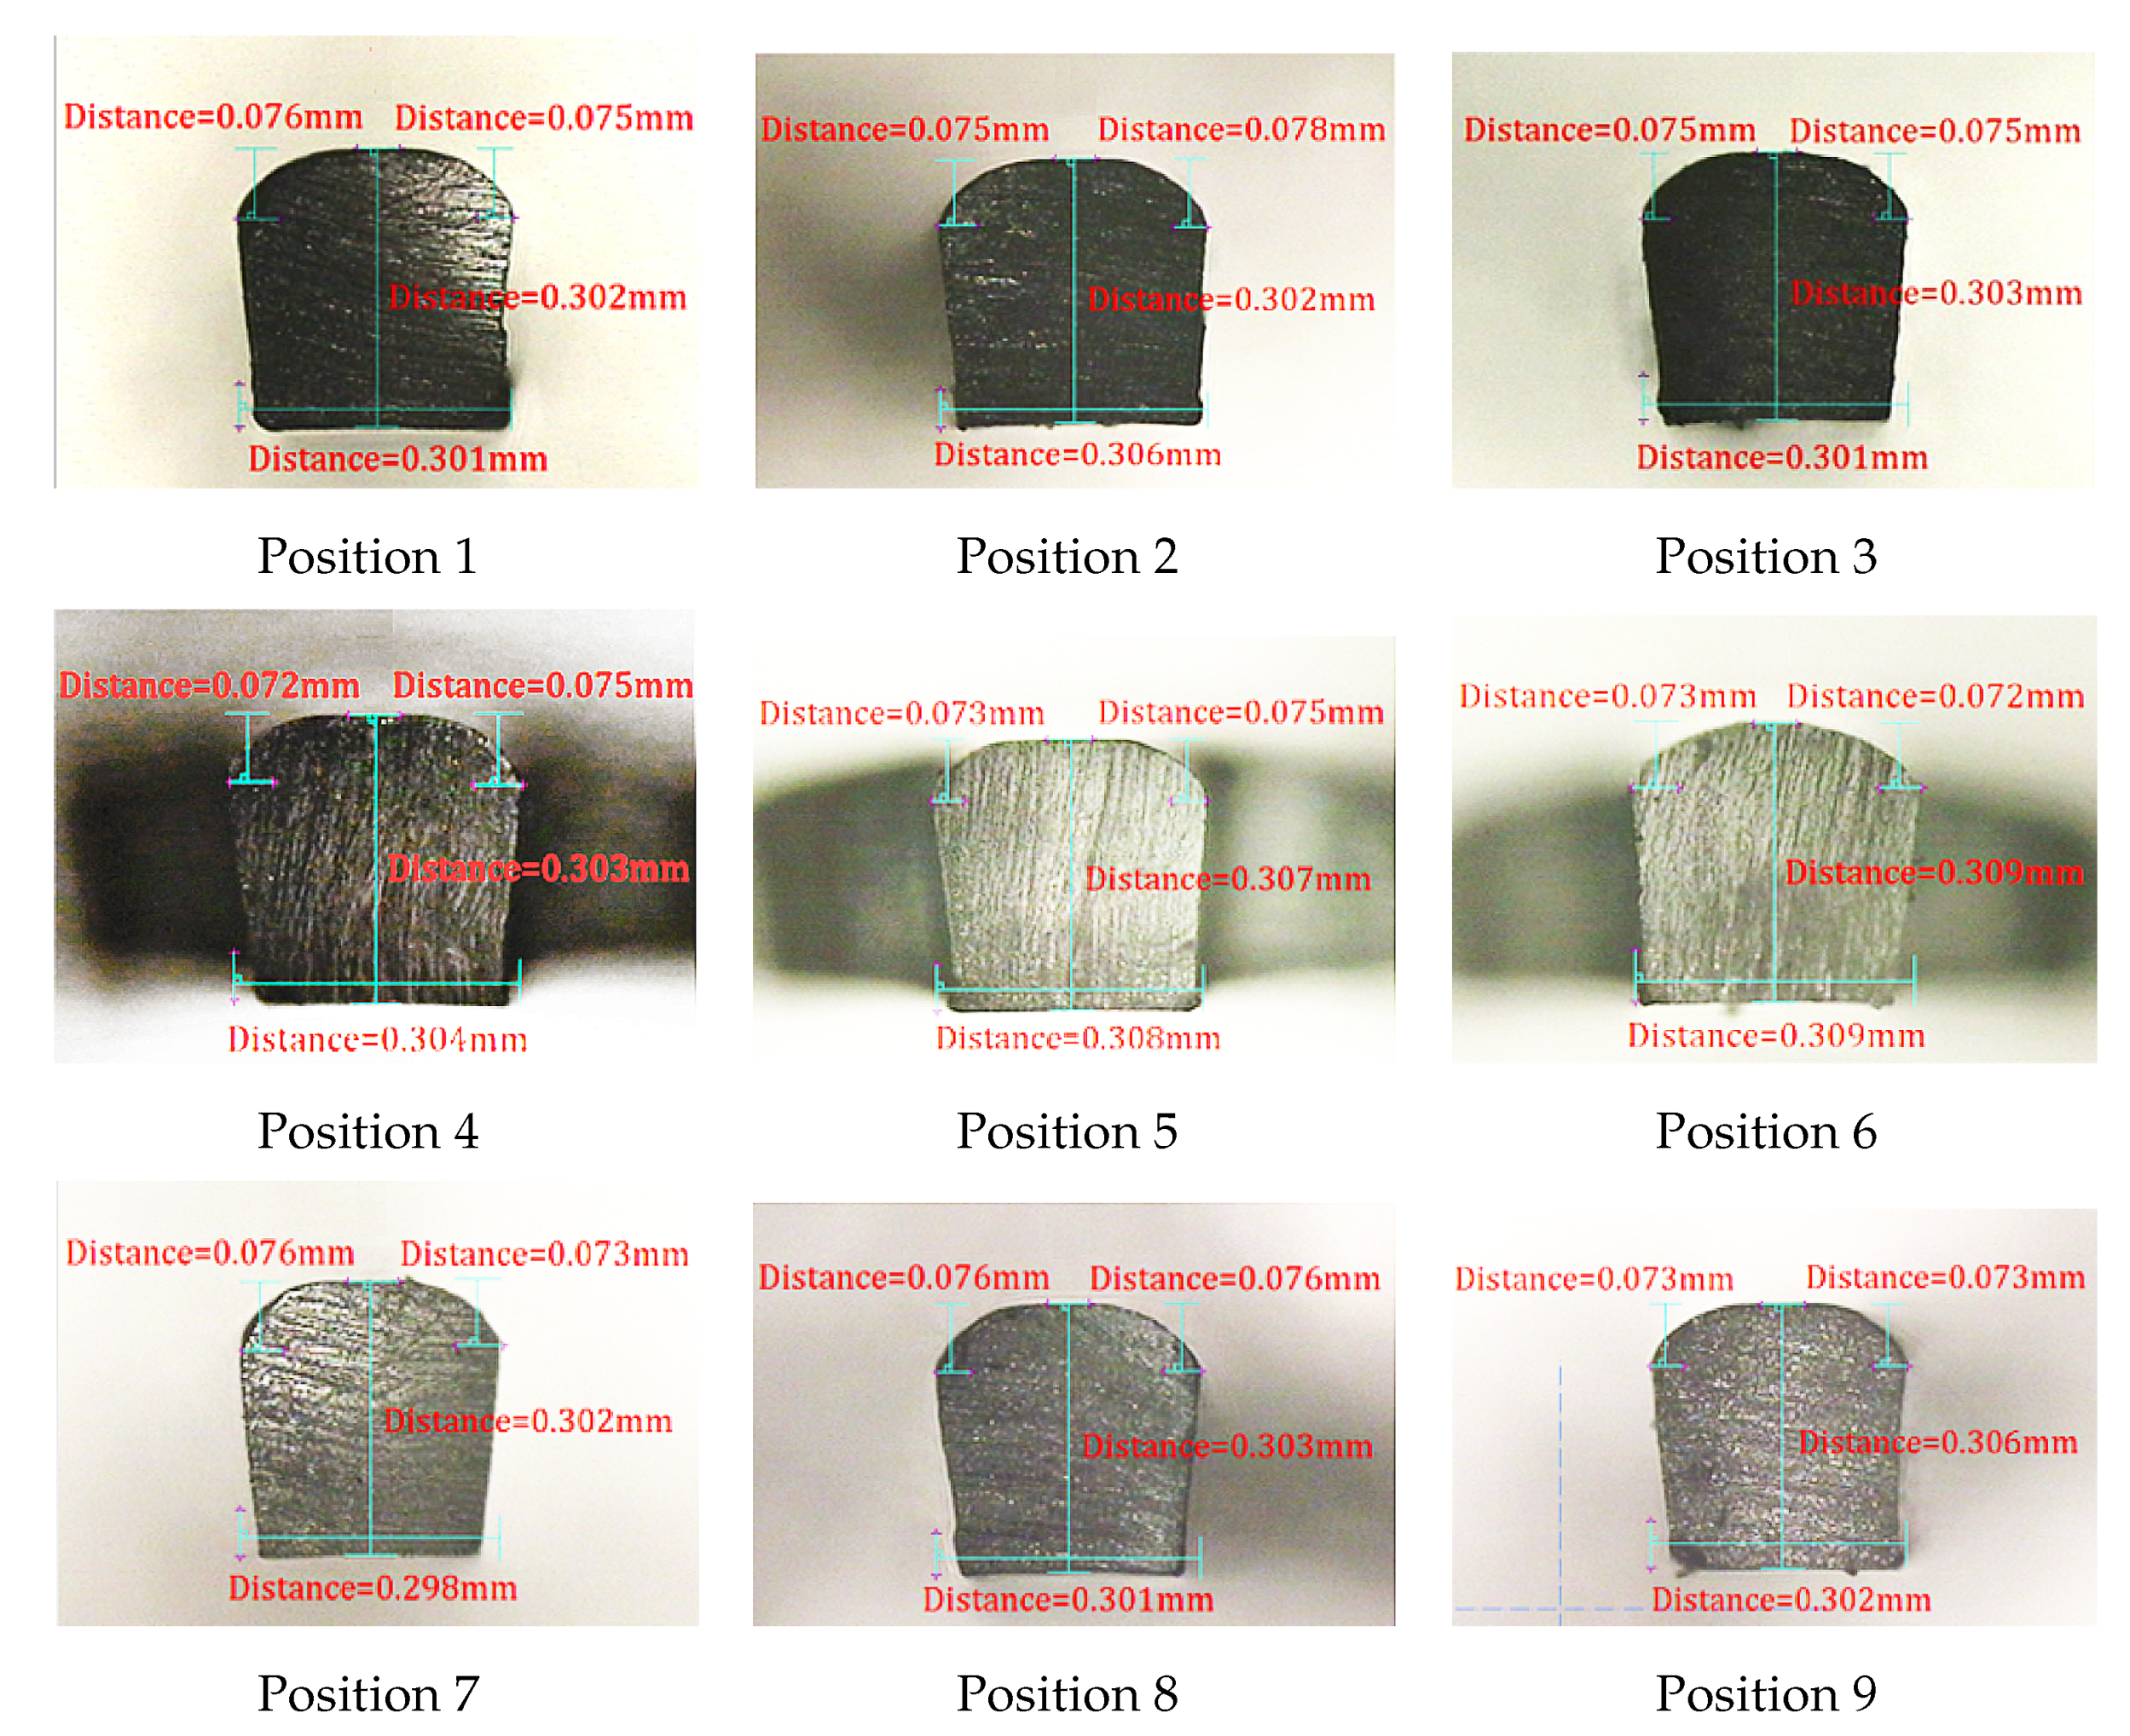
3.3.2. Cross-Section Width of the Stent

The UX300 was employed with the following parameters: a single linear axis positioning precision of 8 μ m, repeatability precision of 4 μ m, and rotation axis precision of 4 s. The cross-section width of the cut stent structure was determined using the simultaneous motion of the Y, Z, and C axes combined with layer-by-layer milling. Errors of dimensions were caused by machine positioning errors, repeatability precision, and screw backlash, and were less affected by the table’s center-of-rotation errors. Table 1 presents the cross-section width errors of the stent with and without compensation; the errors with compensation were within 0.01 mm, and thus within an acceptable range of machining errors.

3.3.3. Stent Arc Homogeneity

The homogeneity of stent arcs was analyzed using the round corner depth of cut and errors with and without compensation, as shown in Table 2. A target round corner depth of cut of 0.1 mm was set as the baseline to observe and measure the depths of cuts on the arcs of the cut stent structures. The results revealed that the mean depth of cut of the arc without compensation was 0.074 mm, and the error variation at the nine positions was 0.044 mm (maximum = 0.046 mm and minimum = 0.002 mm). It was considered that the variation of the arc depth of cut was caused by center-of-rotation errors. To validate the cause, the errors obtained in the experiment were used. The actual arc depths of cut with compensation were compared with the target arc height values. The variation in depth of cut at the nine positions was 6 μ m (maximum = 0.027 mm, minimum = 0.021 mm), which was then compared with the variation in arc depth of cut without compensation (0.044 mm). The comparison results revealed that the homogeneity improved by approximately 86% with compensation. This suggested that, during machining without compensation, the distance of cutting track deviation was the center-of-rotation error, and the round corner arc homogeneity is highly correlated with center-of-rotation errors. However, the experimental results with compensation revealed that the mean actual arc depth of cut was approximately 0.075 mm, shorter than the theoretical value 0.1 mm.

3.3.4. Arc Dimension Errors

It was considered that the arc profile errors of the stent were inferred to be caused by PLA material rebound. PLA is a polymer material that exhibits elastic deformation under micromachining and may cause cutting errors [23,24,25]. Cutting at a microscopic scale further causes the rebound phenomenon of materials to manifest. Therefore, arc profile errors of the stent were inferred to be caused by PLA material rebound. To verify this inference, the Young’s modulus E (2.8 GPa) and hardness H (0.2 GPa) of the PLA used in this study were substituted into the material rebound formula proposed by Jardret et al. [20], as depicted in (9) (where h is the theoretical depth of cut and h a is the actual depth of cut) to calculate the rebound of PLA and compare the rationality of the arc shape:
h a / h = 0.41498 l o g E / H 0.4224 = 0.41498 l o g 2.8 / 0.2 0.4224 = 67 %
The calculation results revealed that the actual to theoretical depth of cut ratio was 67%, implying a material rebound rate of 33%. However, because a ball end mill was used to cut the arc structure with 12 cuts, as shown in Figure 18a, the removed thickness values were inconsistent; thus, the thickest part was used for the rebound calculation. The rebound of the first cut was added to the second cut. For example, the removed thickness of the first cut was 6.64 μ m, which was multiplied by 33% and produced a rebound of 2.19 μ m; accordingly, the actual removed thickness was 4.45 μ m, and the profile of the first cut was moved horizontally 2.19 μ m (rebound) to the left. According to the first cut’s rebound profile, the rebound profile of the second cut was calculated by multiplying its removed thickness of 10.28 μ m by 33% to produce a rebound of 3.39 μ m. Therefore, the removed thickness of each cutting must be summed to determine the ultimate arc shape with rebound considered. Table 3 presents the calculation results.
Figure 18b presents an optical microscope (OM) image of the actual stent’s cross-section after cutting. The dotted line represents the imagined profile without rebound and the solid line represents the imagined profile mapped according to the 33% rebound. The real stent arc profile after cutting was approximately close to the imagined profile with 33% rebound. This result confirmed that rebound occurred during cutting. The chain-dotted circle marked the thickest removed part during the cutting, where the greatest rebound and the deepest cutting depth occurred. However, the profile with 33% rebound considered was nearly identical to the actual arc profile of the stent. Figure 19 shows images of the completed stent product; the external diameter and tube wall thickness were 6 mm and 0.3 mm, respectively.

4. Conclusions

This study successfully produced a degradable PLA biomedical stent. A computer graphics software package (SolidWorks 2013) was used to design the edge rounded struts of the stent. Data obtained from experiments on center-of-rotation errors were substituted into homogeneous coordinate conversion formulas. Center-of-rotation errors in the five-axis machine tool were compensated for to improve the cutting precision (A and C axes) to be within 5 μ m. Furthermore, cutting parameter optimization experiments were conducted, which determined the optimal conditions for cutting to be a spindle speed of 60,000 rpm, feed per tooth of 0.005 mm, and feed rate of 600 mm/min. Finally, the error compensation and optimal cutting parameters were combined in a CAM software package and layered spiral micromilling to machine the actual stent. The machined actual stent had a cross-section height error range of less than 0.01 mm, maximum height error of 7 μ m, cross-section width error of approximately 0.01 mm, and arc depth of cut variation of approximately 6 μ m. The arc profile errors of machined PLA stent suggested a rebound of 33%. Overall, the experimental results revealed that the combination of five-axis machine tools with micromilling led to the successful fabrication of a degradable biomedical stent (diameter = 6 mm, strut width = 0.3 mm, wall thickness = 0.3 mm, and radius at round corners = 0.1 mm). The work developed in this research may open up future possibilities for complex three-dimensionally structured biomedical stents with better performance and functionality, which are currently limited by laser processing capabilities.

Author Contributions

Conceptualization, F.-Y.C. and Y.-C.C.; methodology, F.-Y.C., Y.-C.C., T.-H.L., Z.-Y.C.; investigation, Y.-C.C., T.-H.L., Z.-Y.C.; writing draft, F.-Y.C., Y.-C.C., T.-H.L., Z.-Y.C.; review and editing, F.-Y.C., T.-H.L.; supervision, F.-Y.C. All authors have read and agreed to the published version of the manuscript.

Acknowledgments

This research was supported by the Ministry of Science and Technology, Taiwan, Republic of China under grant MOST 106-2221-E-011-071-MY2 and MOST 108-2221-E-011-128.

Conflicts of Interest

The authors declare no conflicts of interest.

References

  1. Shabalovskaya, S. On the nature of the biocompatibility and on medical applications of NiTi shape memory and superelastic alloys. Biomed. Mater. Eng. 1996, 6, 267–289. [Google Scholar] [CrossRef] [PubMed]
  2. Hodgson, D.E.; Ming, W.H.; Biermann, R.J. Shape memory alloys. In Metals Handbook, 10th ed.; ASM International: Cleveland, OH, USA, 1990; Volume 2, pp. 897–902. [Google Scholar]
  3. Stoeckel, D.; Bonsignore, C.; Duda, S. A survey of stent designs. Minim. Invasive Therapy Allied Technol. 2002, 11, 137–147. [Google Scholar] [CrossRef] [PubMed]
  4. Hung, C.H.; Chang, F.Y.; Chang, T.L. Micromachining NiTi tubes for use in medical devices by using a femtosecond laser. Opt. Laser Eng. 2015, 66, 34–40. [Google Scholar] [CrossRef]
  5. Hung, C.H.; Chang, F.Y. Curve micromachining on the edges of nitinol biliary stent by ultrashort pulses laser. Opt. Laser Technol. 2017, 90, 1–6. [Google Scholar] [CrossRef]
  6. Liu, Z.W. Development of Post Treatment for Biomedical Nitinol Stents. Master’s Thesis, National Taiwan University of Science and Technology, Taipei, Taiwan, 2015. [Google Scholar]
  7. Bax, B.; Müssig, J. Impact and tensile properties of PLA/Cordenka and PLA/flax composites. Compos. Sci. Technol. 2008, 68, 1601–1607. [Google Scholar] [CrossRef] [Green Version]
  8. Auras, R.; Harte, B.; Selke, S. An overview of polylactides as packaging materials. Macromol. Biosci. 2004, 4, 835–864. [Google Scholar] [CrossRef]
  9. Lim, L.T.; Auras, R.; Rubino, M. Processing technologies for poly (lactic acid). Prog. Polym. Sci. 2008, 33, 820–852. [Google Scholar] [CrossRef]
  10. Nampoothiri, K.M.; Nair, N.R.; John, R.P. An overview of the recent developments in polylactide (PLA) research. Bioresour. Technol. 2010, 101, 8493–8501. [Google Scholar] [CrossRef]
  11. Wang, J.S. A Geometry Driven Approach to Improving the Cutting Performance of Five-Axis Tool Paths. Master’s Thesis, National Taiwan University of Science and Technology, Taipei, Taiwan, 2013. [Google Scholar]
  12. Jung, Y.H.; Lee, D.W.; Kim, J.S.; Mok, H.S. NC post-processor for 5-axis milling machine of table-rotating/ tilting type. J. Mater. Process. Technol. 2002, 130–131, 641–646. [Google Scholar] [CrossRef]
  13. She, C.H.; Huang, Z.T. Postprocessor development of a five-axis machine tool with nutating head and table configuration. Int. J. Adv. Manuf. Technol. 2007, 38, 728–740. [Google Scholar] [CrossRef]
  14. She, C.H.; Chang, C.C. Development of a five-axis postprocessor system with a nutating head. J. Mater. Process. Technol. 2007, 187–188, 60–64. [Google Scholar] [CrossRef]
  15. Liao, M.Y. Using DBB for Measuring and Calibrating Gemetric Errors of 5-Axis CNC Machine Tools. Master’s Thesis, National Tsing Hua University, Hsinchu, Taiwan, 2005. [Google Scholar]
  16. Bryan, J.B. A simple method for testing measuring machines and machine tools. Precis. Eng. 1982, 4, 61–69. [Google Scholar] [CrossRef]
  17. Sono, M.; Sakaida, Y.; Kawai, T.; Takeuchi, Y. Development of tool setting error compensation method for 5-axis control ultraprecision machining. In Proceedings of the 20th Annual ASPE Meeting, Norfolk, VA, USA, 9–14 October 2005; p. 435. [Google Scholar]
  18. Yuan, Z.J.; Zhou, M.; Dong, S. Effect of diamond tool sharpness on minimum cutting thickness and cutting surface integrity in ultraprecision machining. J. Mater. Process. Technol. 1996, 62, 327–330. [Google Scholar] [CrossRef]
  19. Chae, J.; Park, S.S.; Freiheit, T. Investigation of micro-cutting operations. Int. J. Mach. Tools Manuf. 2006, 46, 313–333. [Google Scholar] [CrossRef]
  20. Jardret, V.; Zahouani, H.; Loubeta, J.L.; Mathia, T.G. Understanding and quantification of elastic and plastic deformation during a scratch test. Wear 1998, 218, 8–14. [Google Scholar] [CrossRef]
  21. Bang, Y.B.; Lee, K.M.; Oh, S. 5-axis micro milling machine for machining micro parts. Int. J. Adv. Manuf. Technol. 2005, 25, 888–894. [Google Scholar] [CrossRef]
  22. Islam, S.; Ibrahim, R.; Khondoker, N. Effect of machining velocity in nanoscale machining operations. Mater. Sci. Eng. 2015, 78, 012030. [Google Scholar] [CrossRef] [Green Version]
  23. Eckman, N.; Saigal, A.; James, T.P. Determination of cutting edge separation point during micromachining of highly elastic materials. In Proceedings of the 15th International Conference on Experimental Mechanics, Porto, Portugal, 22–27 July 2012. [Google Scholar]
  24. Carr, J.W.; Feger, C. Ultraprecision machining of polymers. Precis. Eng. 1993, 15, 221–237. [Google Scholar] [CrossRef]
  25. Xiao, K.Q.; Zhang, L.C. The role of viscous deformation in the machining of polymers. Int. J. Mech. Sci. 2002, 44, 2317–2336. [Google Scholar] [CrossRef]
  26. Grabow, N.; Bunger, C.M.; Sternberg, K.; Mews, S.; Schmohl, K.; Schmitz, K.P. Mechanical Properties of a Biodegradable Balloon-expandable Stent from Poly(l-lactide) for Peripheral Vascular Applications. J. Med. Device 2007, 1, 84–88. [Google Scholar] [CrossRef]
  27. Stepak, B.; Antonczak, A.J.; Bartkowiak-Jowsa, M.; Filipiak, J.; Pezowicz, C.; Abramski, K.M. Fabrication of a polymer-based biodeg-radable stent using a CO2 laser. Arch. Civ. Mech. Eng. 2014, 14, 317–326. [Google Scholar] [CrossRef]
  28. Wang, C.H. Study of Properties and Cell Culture of Small-Diameter Synthetic PLA/PCL Vascular Scaffold via Electrospinning. Master’s Thesis, National Chiao Tung University, Hsinchu, Taiwan, 2002. [Google Scholar]
  29. Teng, P.T. Development of Biodegradable Polylactide Graft Stent Using Circular Thermal Imprint. Ph.D. Thesis, National Taiwan University of Science and Technology, Taipei, Taiwan, 2014. [Google Scholar]
  30. Kao, C.L. Development of 5-French Nitinol Biliary Stents. Master’s Thesis, National Taiwan University of Science and Technology, Taipei, Taiwan, 2017. [Google Scholar]
  31. Sheikh-Ahmad, J.Y. Machining of Polymer Composites; Springer: Boston, MA, USA, 2009. [Google Scholar]
  32. Litvin, F.L.; Fuentes, A. Gear Geometry and Applied Theory; Cambridge University Press: Cambridge, UK, 2004; pp. 1–32. [Google Scholar]
Figure 1. Direction of each axis of the five-axis machine tool (UX300).
Applsci 10 02809 g001
Figure 2. Center-of-rotation errors of the A axis.
Applsci 10 02809 g002
Figure 3. Cut groove and depth of cut difference measurements of rotation along the A axis.
Applsci 10 02809 g003
Figure 4. Center-of-rotation errors along the C axis.
Applsci 10 02809 g004
Figure 5. Groove produced through rotation along the C axis and measurement of sidewall differences.
Applsci 10 02809 g005
Figure 6. Layered spiral and fillet machining of a quarter-round with a radius of 0.1 mm.
Applsci 10 02809 g006
Figure 7. Cross-sections at nine positions at the top, center, and bottom (Positions 1–9).
Applsci 10 02809 g007
Figure 8. Local cross-section of the stent structure.
Applsci 10 02809 g008
Figure 9. PLA cutting experiment (feed rate 600 mm/min).
Applsci 10 02809 g009
Figure 10. PLA cutting experiment (feed per tooth 0.005 mm).
Applsci 10 02809 g010
Figure 11. PLA cutting experiment (spindle speed 60,000 rpm).
Applsci 10 02809 g011
Figure 12. Three grooves cut on a table rotated along the A axis ( 0 , 45 , and 90 ).
Applsci 10 02809 g012
Figure 13. (ac) actual Z axis depth of cut differences of the three grooves cut on a table rotated along the A axis measured using 3D-Probe; (df) actual Z axis depths of cut with compensation.
Applsci 10 02809 g013
Figure 14. Three grooves cut on the table rotated along the C axis ( 0 , 90 , and 180 ).
Applsci 10 02809 g014
Figure 15. Three grooves cut on a table rotated along the C axis measured using 3D-Probe and sidewalls at 0 as the baseline to determine: (ac) the differences on the X axis; and (df) actual differences on the X axis with compensation.
Applsci 10 02809 g015
Figure 16. Differences in the stent structures with and without fillet machining. The height, width, and arc depth are as defined in Figure 8.
Applsci 10 02809 g016
Figure 17. Cross-sectional images of Positions 1–9 at the front end, central part, and rear end of the stent machined with compensation. The height, width, and arc depth are as defined in Figure 8.
Applsci 10 02809 g017
Figure 18. (a) Arc cutting performed with 12 cuts using a ball end mill; (b) comparison of imagined profile with 33% rebound and the actual cutting profile.
Applsci 10 02809 g018
Figure 19. Completed stent product.
Applsci 10 02809 g019
Table 1. Cross-section width errors of the stent with and without compensation.
PositionWidthSection WidthSection Width ErrorsSection WidthSection Width Errors
(No.)(Theoretical Value)without Compensationwithout Compensationwith Compensationwith Compensation
10.30.3010.0010.3010.001
20.30.3010.0010.3060.006
30.30.3050.0050.3010.001
40.30.3050.0050.3040.004
50.30.3120.0120.3080.008
60.30.3130.0130.3090.009
70.30.3030.0030.2980.002
80.30.3070.0070.3010.001
90.30.3030.0030.3020.002
Unit: mm.
Table 2. Round corner depth of cut and errors with and without compensation.
PositionArc DepthArc Depth withoutArc Depth ErrorsArc Depth withArc Depth Errors
(No.)(Theoretical Value) ACompensation BA–BCompensation DA–D
10.10.1060.0060.0770.023
20.10.0630.0370.0740.026
30.10.0550.0450.0760.024
40.10.0980.0020.0750.025
50.10.0590.0410.0730.027
60.10.0640.0360.0760.024
70.10.1040.0040.0790.021
80.10.0630.0370.0740.026
90.10.0540.0460.0740.026
Unit: mm.
Table 3. Removed thickness on the stent arc structure (12 cuts).
NumberTheoretical RemovedActual RemovedRemoved Thickness with
of CuttingThicknessThicknessConsidering 33% Rebound
16.644.452.19
210.286.883.40
315.0510.084.97
415.4510.355.10
513.378.964.41
611.337.593.74
710.006.703.30
87.635.112.52
95.753.851.90
104.082.731.35
112.541.700.84
120.830.560.27
Unit: μ m.

