Article

The Effect of Moisture Content on the Tar Characteristic of Wood Pellet Feedstock in a Downdraft Gasifier

1
Division of Mechanical Science and Engineering, Graduate School of Natural Science and Technology, Kanazawa University, Natural Science Research Building 3, Kakuma-machi, Kanazawa 920-1192, Japan
2
Department of Mechanical Engineering, Engineering Faculty, Universitas Negeri Semarang, Sekaran Gunung Pati, Semarang 50229, Indonesia
3
Department of Mechanical Engineering, University of Agriculture and Forestry, Hue University, Hue City 49100, Vietnam
4
Department of Computer and Informatics Engineering, Politeknik Negeri Jakarta, Depok 16425, Indonesia
5
Division of Environmental Engineering Science, Graduate School of Science and Technology, Gunma University, Tenjin-cho, Kiryu-shi, Gunma 376-0011, Japan
*
Author to whom correspondence should be addressed.
Appl. Sci. 2020, 10(8), 2760; https://doi.org/10.3390/app10082760
Submission received: 12 March 2020 / Revised: 28 March 2020 / Accepted: 13 April 2020 / Published: 16 April 2020
(This article belongs to the Section Energy Science and Technology)

Abstract

:
This study examined the tar characteristic of wood pellet using a downdraft gasifier system. The wood pellet was used as a feedstock with a variation of moisture content between 2 to 6 wt. %. Tar sample was taken using the JP 2009-40885 method. Gas chromatography mass spectrometry and gravimetric analysis were used to identify and to analyze the tar sample, respectively. The results show that an increase in moisture content slightly decreased the total concentration of tar formation on the nine tar compounds of the biomass. Additionally, the lowest moisture content produced the highest amount of light tar on tar classification. The amount of light tar indicates the ease of ignition in the gasifier. Therefore, this condition will minimize the failure-of-equipment problem because of no clogs in the gasifier equipment. The lowest moisture content had the lowest tar density, and this minimized the deposit of tar in the gasifier. Therefore, the lowest moisture content had low tar production in the biomass gasification process using wood pellets.

1. Introduction

The low availability and high demand of fossil fuel has led to an increase in its prices. Therefore, biomass can be used to solve this issue. It might replace the demand for electricity, especially in villages with limited access to power. It can also be used for other purposes, such as driving internal combustion or turbine engines. Gasification and combustion are a thermochemical conversion that uses pressure, steam, and high temperature to change biomass feedstock into gas called syngas/synthetic gas. The main components of syngas include CO, N2, H2, CO2, and other hydrocarbons such as CH4, C2H6, and C2H4, and tar compounds.
Thermochemical conversion such as biomass gasification has many advantages compared to the combustion and pyrolysis process. This is because it has a lower tar production. In this research the downdraft gasification system with 10 kW on a laboratory scale was used. The feedstock was divided into non-woody and woody feedstock. Non-woody feedstock has limitations such as producing higher ash, N2, and sulfur content. Woody biomass is an organic material derived from a living organism that is used as fuel in energy generation. Therefore, wood pellet was chosen since it is readily available and cheap. The particle size of feedstock affects the gasification process. The proportional size particle of the wood pellet is below 6.3 mm and has a mass fraction lower than 25% [1,2]. According to Oveisi et.al., 12% of steam can be easily generated if the moisture content is reduced from 35% to 20% on a wet basis (wb) [3]. For this reason, the experiment was carried out on a 6 mm diameter wood pellet feedstock with a bulk density of 790 kg/m3 and moisture content variation of 2 wt. %, 4 wt. %, and 6 wt. % respectively.
The composition of the syngas yielded from the gasification process depends on the contents of the oxidizer such as oxygen in the air. Additionally, the amount of tar composition in the syngas interferes with the effectiveness of the syngas [4,5]. Naryanto et al. stated that various chemical compounds exist in tar formation and this is affected by moisture content of the feedstock [6,7]. Tar can be defined as oxygenated and hydrocarbon compounds in the combustible gas as good as polycyclic aromatic hydrocarbon (PAH) and higher than the molecular weight of benzene [8]. Three international organizations have agreed with this definition of tar, including the Energy Department of the United States, the International Energy Agency (IEA), and The Directorate-General for Energy European Commission (DG XVII) [9,10].
Tar is an unnecessary product in biomass gasification since it makes the equipment challenging to operate during combustion. The catalyst cannot overcome the tar problem for a long operation in the biomass gasification [11]. For this reason, varying the moisture content of feedstock must be done [12]. This variable affects tar characteristics such as tar formation, classification, and density. Limited studies have examined the influence of moisture content on the tar characteristics. Accordingly, this study aims to verify the effect of moisture content on the tar characteristics of the wood pellet on the downdraft gasifier. The experiments were conducted with a variation of moisture content of 2 wt. %, 4 wt. %, and 6 wt. % with a fixed air-flow rate of 80 L/min. The process used a tar-sampling method with patent number JP 2009-40885 from the Japan Patent Office [13].

2. Materials and Methods

2.1. Wood Pellet Feedstock

In this experiment, pellet from cedar wood was chosen because it contains higher lignin than other feedstock. It has around 25% lignin and serves as a bonding agent for the production of hydrocarbon [14]. The size of the wood pellet was approximately 12 mm in length and 6 mm in diameter, and the bulk density was 790 kg/m3, as shown in Table 1. In this research, the initial moisture content was around 7 wt. % and was varied to 2 wt. %, 4 wt. %, and 6 wt. %. In order to reduce it, the drying machine TTM-440N was used. Also, the moisture analyzer machine (AND MF-50) was used to measure the wetness of the wood pellet feedstock.
Based on the Japan industrial standard (JIS), the ultimate analysis (UA) contained O, N, S, H, and C as shown in Table 2. Proximate analysis (PA) as quantitative data of volatile matter, ash, fixed carbon, and the low heating value is shown in Table 3. The low heating value is calculated according to equation 1 as shown below [15]:
q p , n e t , m = q p , n e t , d × 100 M a r 100 0.02443 × M a r
where q p , n e t , m is the low heating value (at constant pressure) as received (MJ/kg), q p , n e t , d is the low heating value (at constant pressure) in dry basis (MJ/kg), M a r is the moisture content as received (wt. %), 0.02443 is the correction factor of the enthalpy of vaporization (constant pressure) for water (moisture) (MJ/kg per 1 wt. % of moisture).
With regards to low heating values, the softwoods range from 15.62971 to 16.93572 MJ/kg and hardwoods range from 14.41154 to 17.90785 MJ/kg. In this experiment, we used cedar wood as feedstock, which is included in softwoods with low heating values of 15.37 MJ/kg. This statement is in line with Telmo et al. [15].

2.2. Downdraft Gasifier System

This experiment utilized the downdraft gasifier in the gasification process to minimize tar production. The gasifier was a reactor connected to the continuous stirred tank reactor (CSTR) with continuous-process feeding of the wood pellet. The pellet holder was used to continuously fill the wood pellet feeder for ignition in the gasifier. During continuous operation, the biomass was moved into the gasifier using a screw in the feeder that was connected to a motor. The gasifier had dimensions of 120 mm for the inner diameter and 500 mm for length. The screw for mixing the wood pellet in the gasifier was installed and made the temperature uniform. The air was used as an oxidizer with a fixed air-flow rate of 80 L/min, and it was controlled by the gas-flow-rate meter (Azbil CMS200, made by Azbil Corporation, Tokyo, Japan). Additionally, the air supply was controlled by programmable logic control (PLC). The soot remover was adopted to reduce the tar formation because if the process only used the activated carbon as charcoal, it would not be enough to minimize tar production. The principle of separation is to use small-sized silica stone to filter the heavy tar in the syngas. The cooler with circulating water was used to reduce the temperature of the syngas from the gasifier. This syngas was sucked using a suction pump before being delivered to the buffer tank. The operating condition of these experiments included a uniform temperature between 400–600 °C. All data was saved in a data-logger product from National Instrument, USA. The yielded syngas from the biomass gasification process was quantified for the tar compound using gas chromatography (GC-MS, Agilent, 490 Micro GC, TDC, Ar carrier). The block diagram of the biomass gasification system is shown in Figure 1.

2.3. Tar Sampling

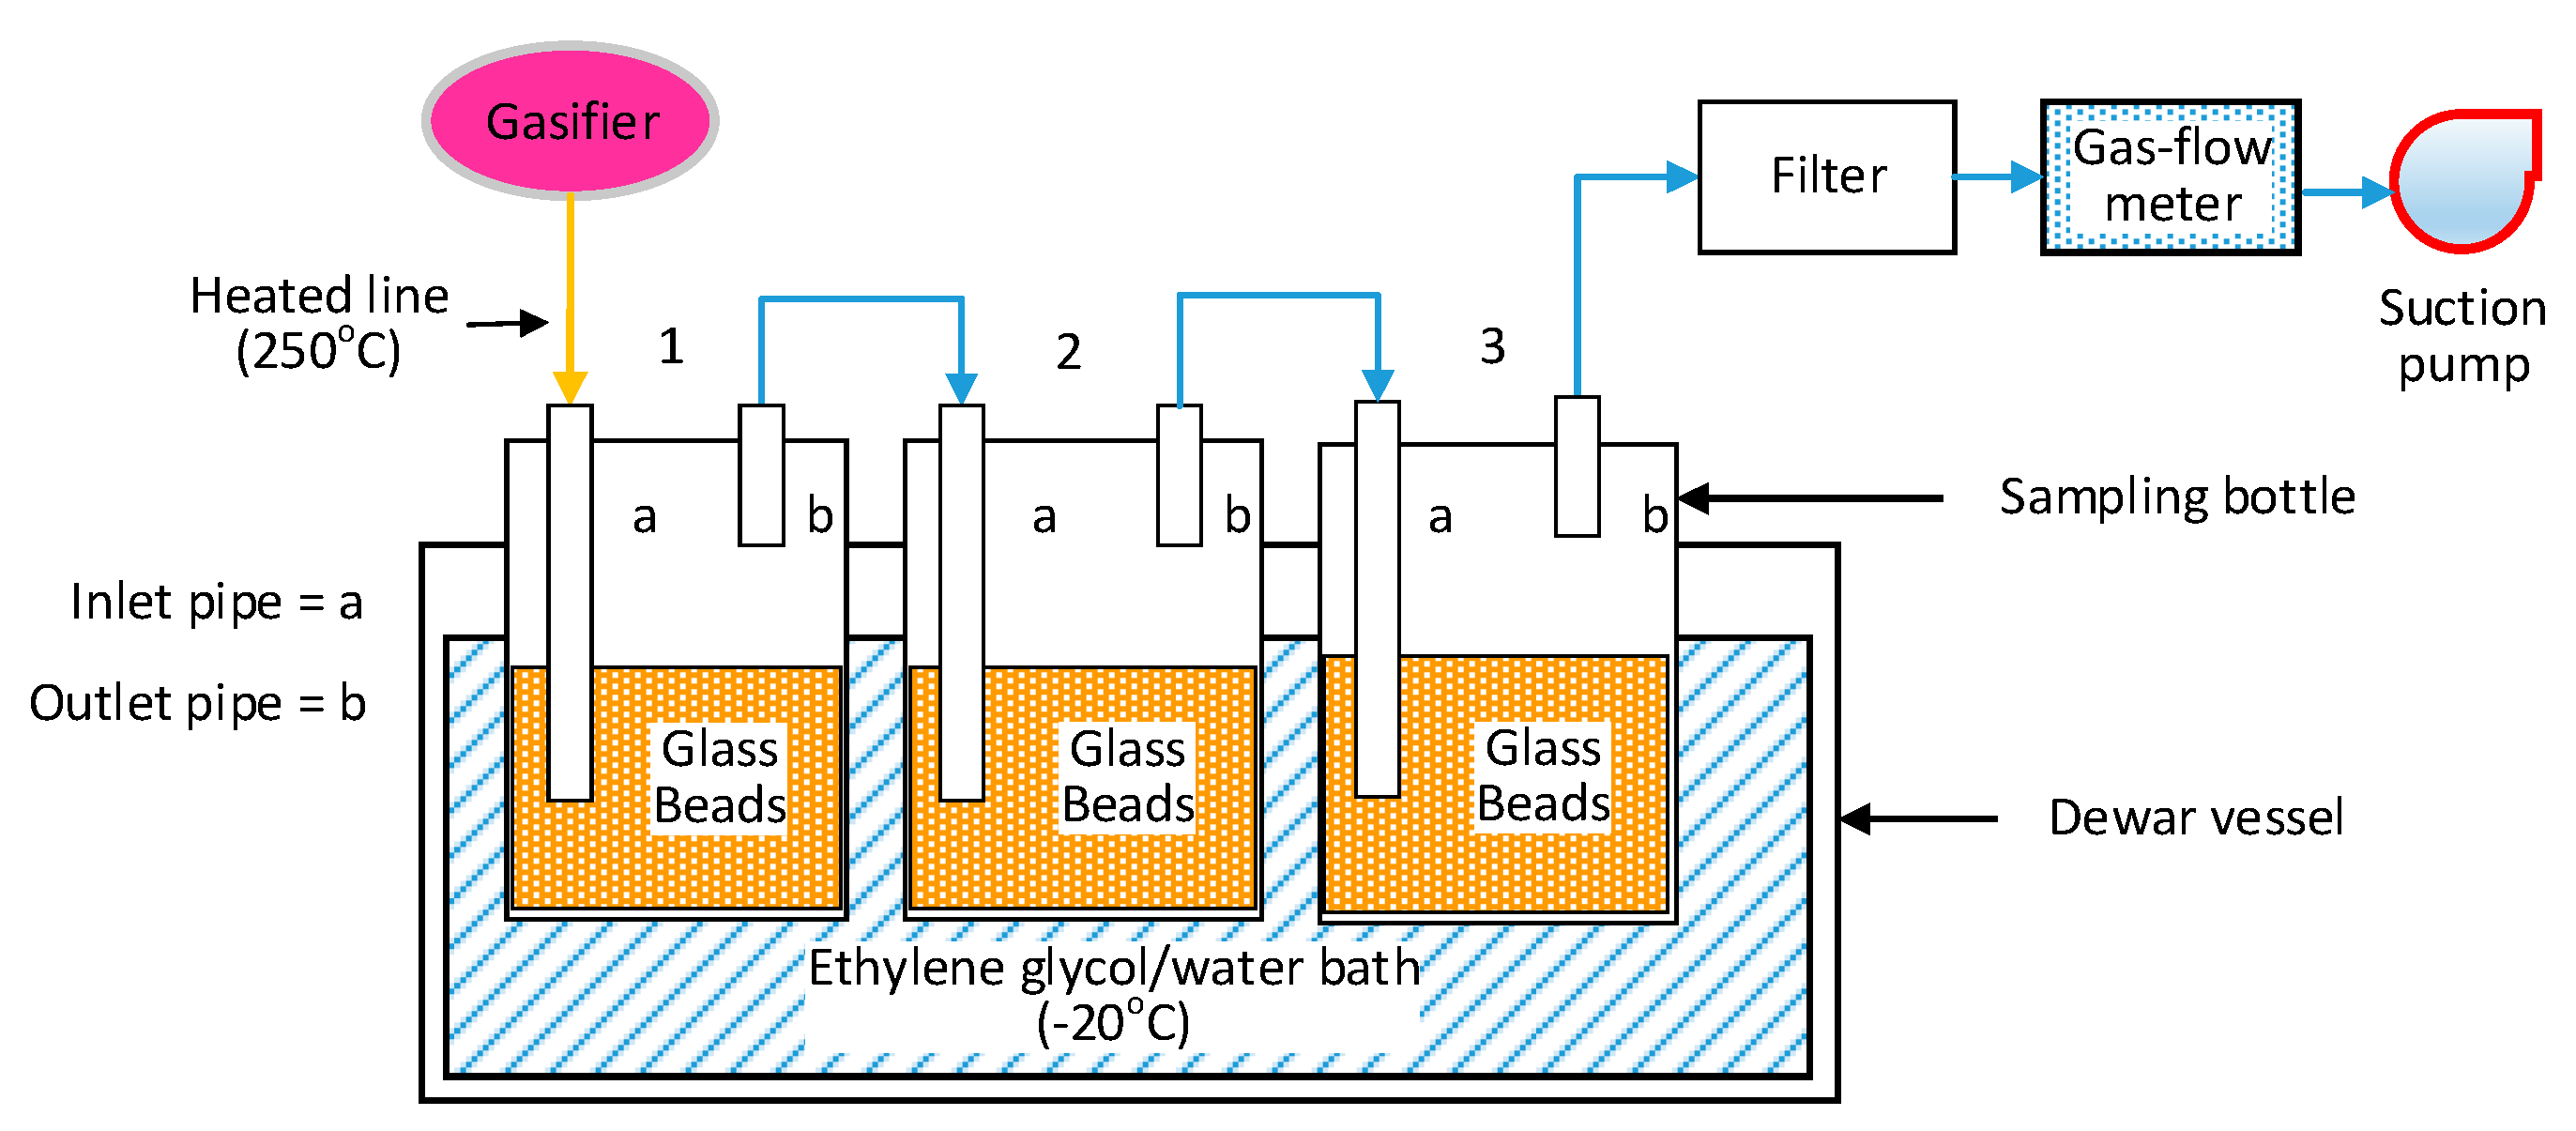
Some tar-sampling methods that have been improved in recent years are associated with the advantages and disadvantages of the system [16]. The famous method for getting tar sampling was executed in the liquid-cooled-solvent method using isopropanol [17]. In this experiment, tar sampling was carried out between the gasifier and soot remover, and the sampling line was shielded from the gasifier at 250 °C to avoid many impurities, including ash, dust, and soot. The heating process was executed before inserting the tar-sampling bottle. Ethylene glycol was used as an antifreeze to keep the tar cool in a Dewar vessel at −20 °C. The experiment equipment is shown in Figure 2. Three tar-sampling impinger bottles with a 300 mm length and 24 mm inner diameter respectively were used to collect tar in the syngas through a surface-contact method with 30 mL of glass beads (AS ONE BZ-2, diameter 1.5–2.5 mm). The syngas-flow rate was set to 8 L/min for 20 min for the intention of collecting 160 L of syngas with the tar-sampling equipment. The collection process was based on the standard tar sampling system conducted by tar protocol. The standard tar protocol used CEN/TS 143:2005 with modification to the number of impinger bottles and without liquid inside them. The following method was used: “Method and Apparatus for Collecting Tar” which has the patent number JP 2009-40885 since 2007 from the Japan Patent Office. This method was developed by Hiroaki Ohara and Katsuaki Matsumura [13,18]. The syngas from the gasifier was passed on the heated line and through the inlet pipe at the impinger bottles and the tar in the syngas was caught by making contact with the surface with 30 mL of glass beads. In the next process step, the syngas passed from the impinger bottle through the outlet pipe and this process occured continuously in impinger bottle numbers 1, 2, and 3. Then, the syngas was filtered using filter apparatus with a porosity diameter of 0.45 µm. This filtering was executed in order to avoid impurities. When the impinger bottle was filled with syngas, the flow rate was set up to 8 L/min for 20 min for controlling the amount of syngas in the tar-sampling equipment. The flow rate was measured by the gas-flow meter which was metrologically tested.
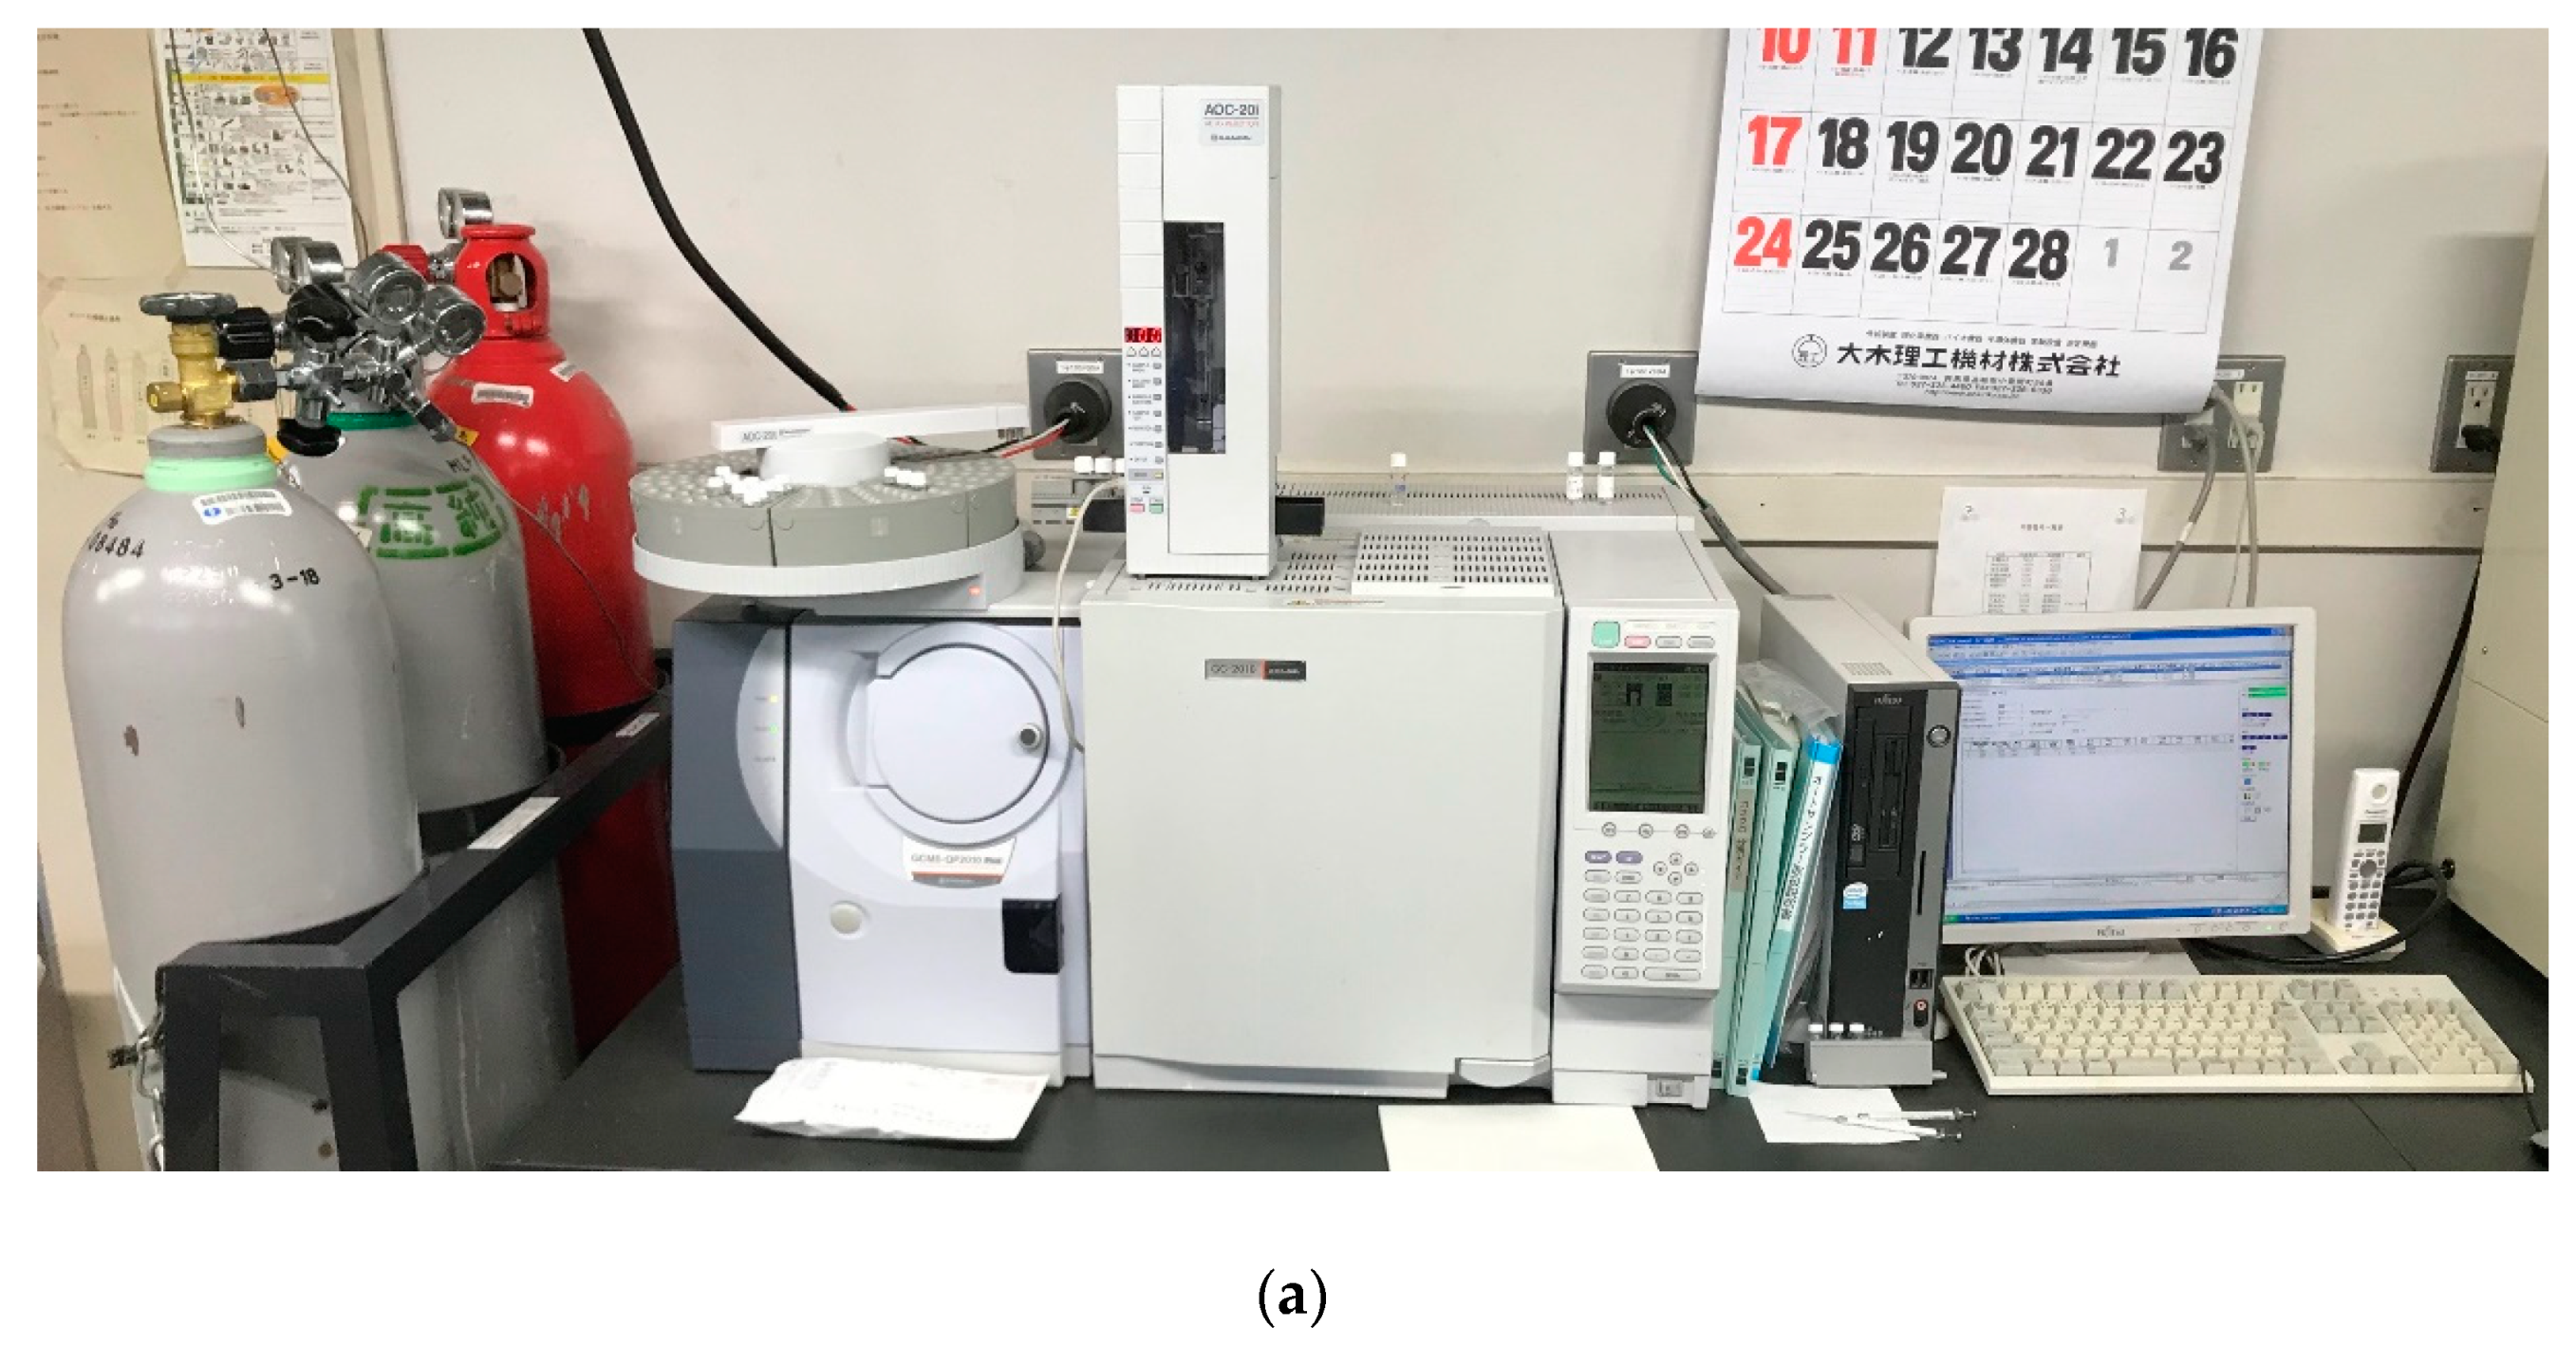
The tar in the syngas was extracted using acetone with 99.5% purity in 50 mL through surface contact with the glass beads. Pure acetone was injected into the tar-sampling bottle and was shaken at least fifteen times to ensure that the mixing of the acetone and glass beads was homogenous. A filter (SIMPLEPURE, NY 0.45 µm) was used to remove the impurities such as soot, ash, and dust in the process-extract tar sample. All of the tar sample was kept in a 2 mL vial bottle for the next analysis of the compounds using gas chromatography – mass spectrometry (Shimadzu GC-MS QP2010 Plus, made by Shimadzu Corporation, Tokyo, Japan). Finally, all of the apparatus and the tar sampling bottle were cleaned using fresh acetone and an ultrasonic cleaning machine (AS ONE).

2.4. Test Procedure and Analysis of Tar Sampling

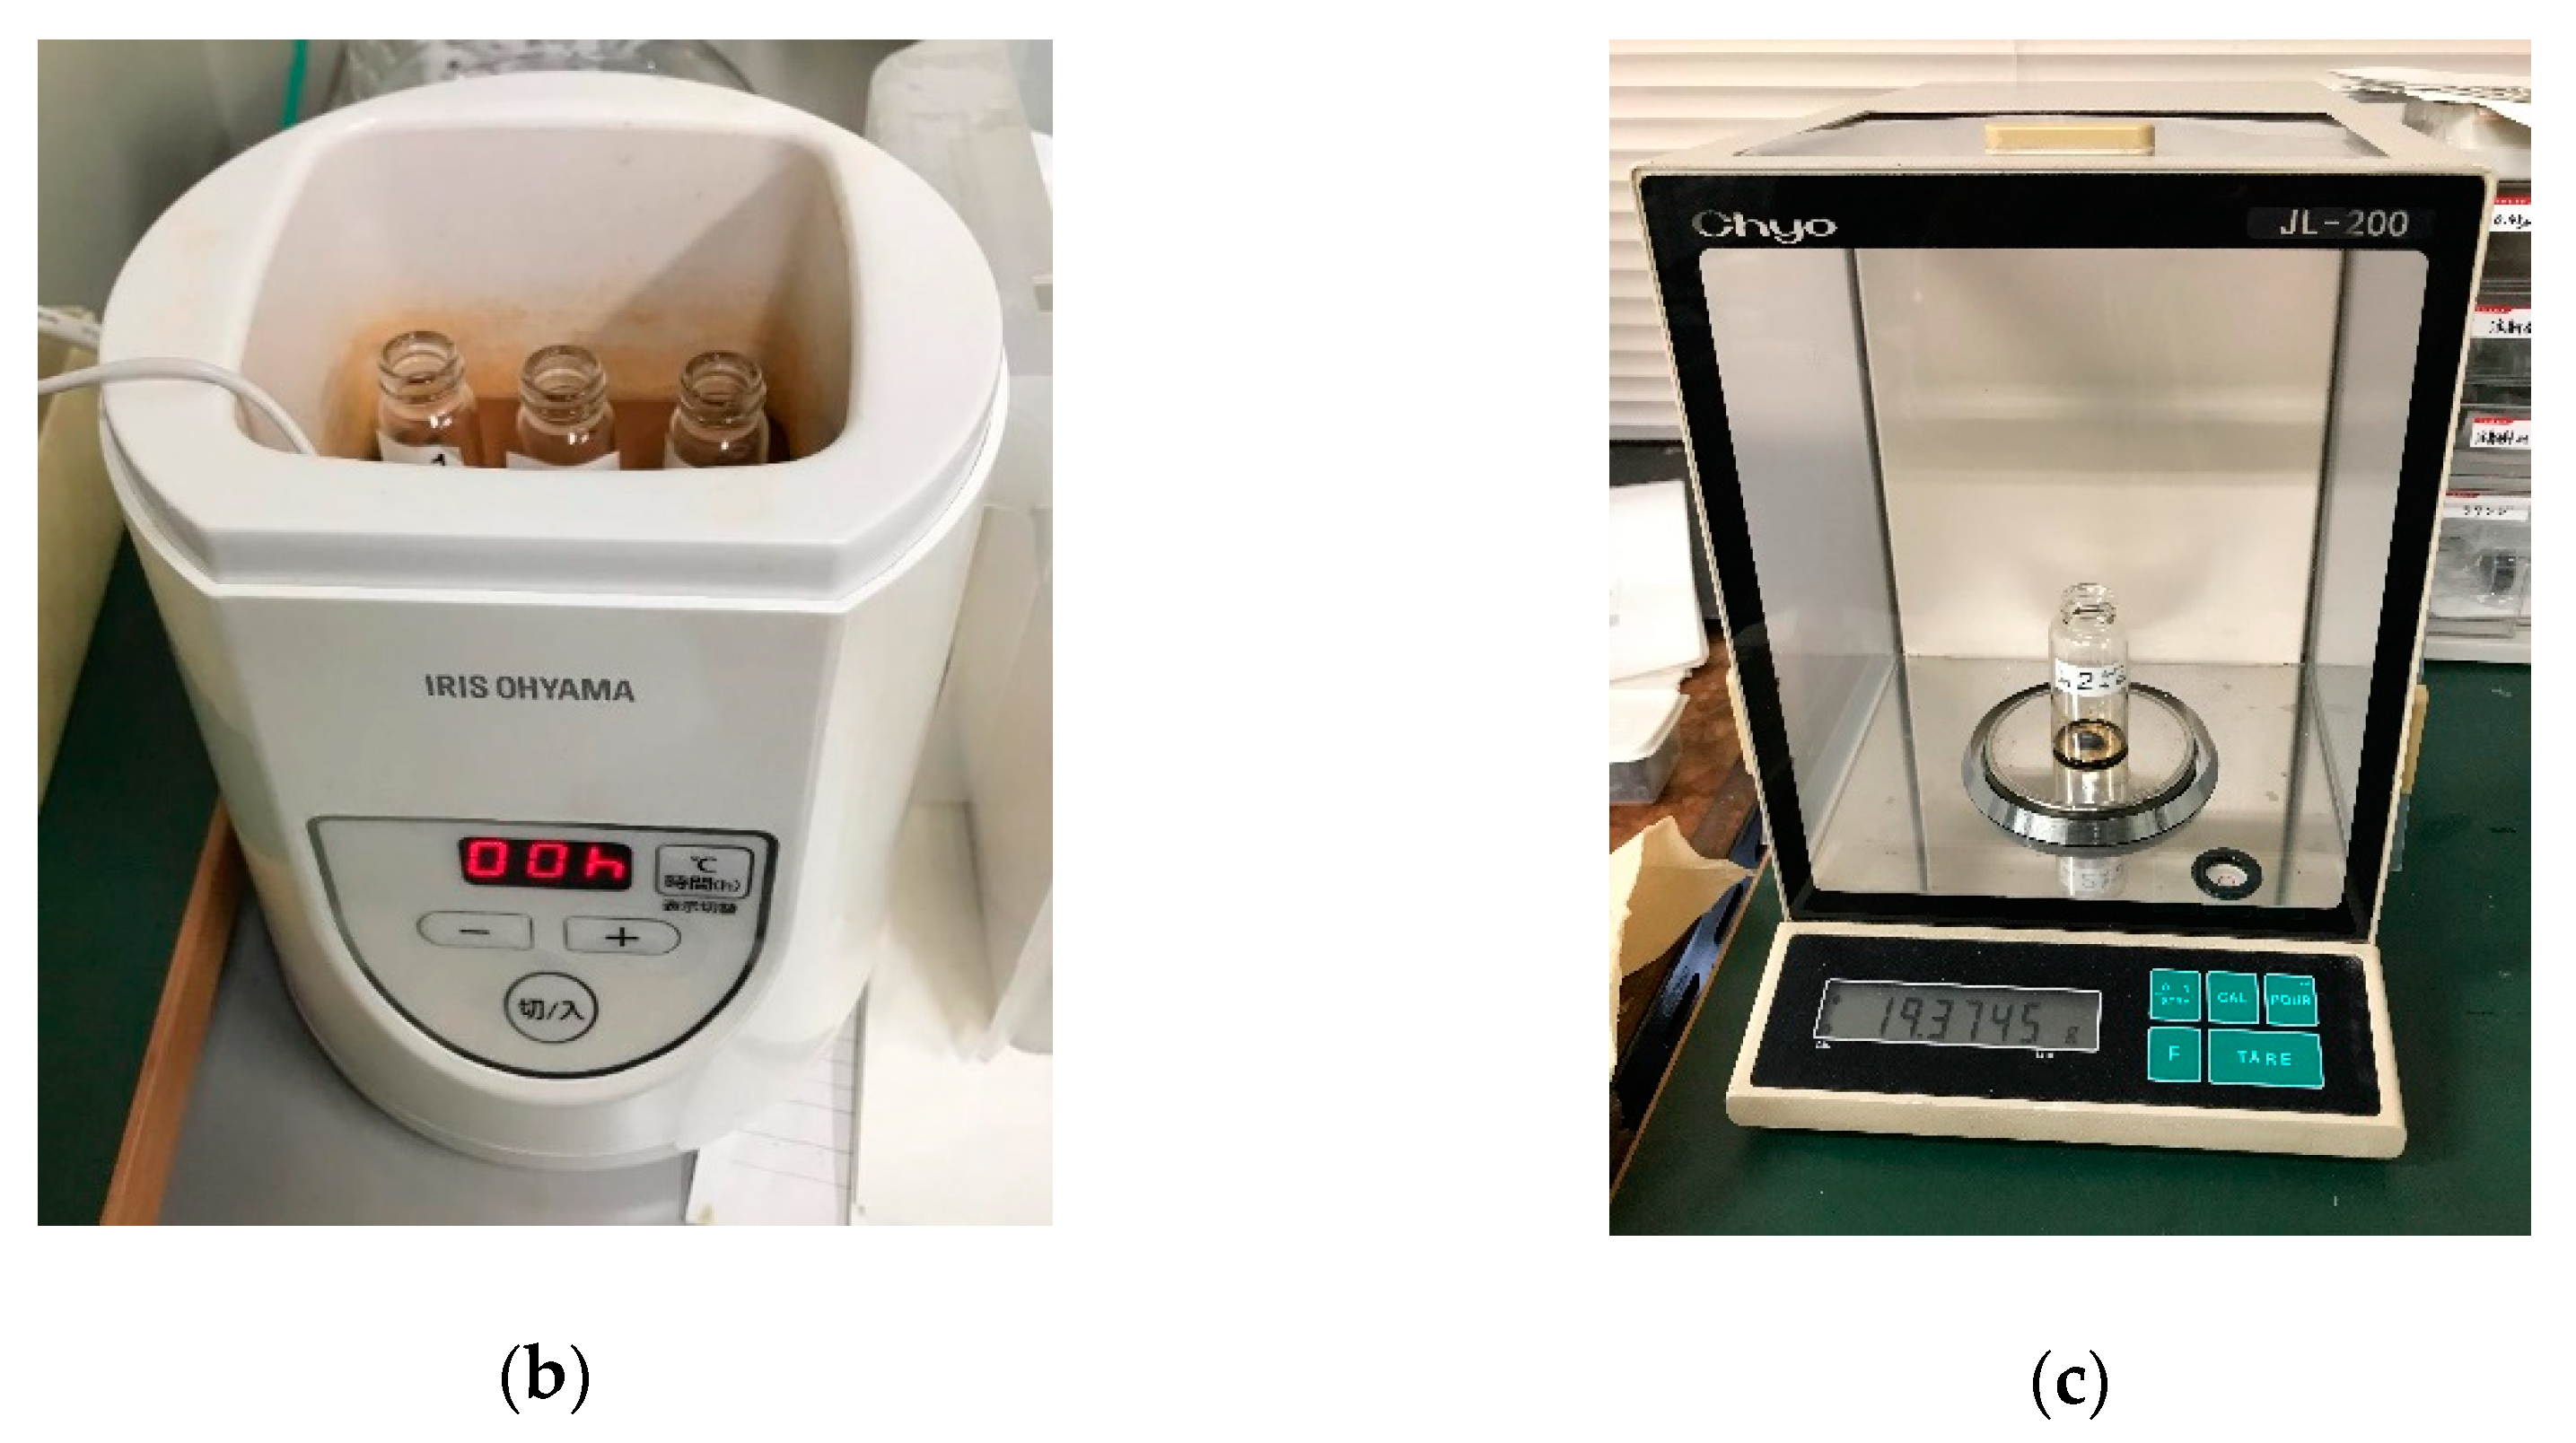
These experiments were conducted offline by collecting the tar sample and extracting it in an appropriate solvent for the next chemical analysis process step. The process used acetone with 99% purity as a solvent to liquefy the tar on the glass beads. The Shimadzu GC-MS QP2010 Plus was used for analyzing the tar compound and for calibrating using a standard reagent with 94% to 99% purity. In every experiment, nine chemical compounds of the tar were always found, as follows: phenol, toluene, styrene, naphthalene, biphenyl, anthracene, indene, fluoranthene, and pyrene, which were used as a tar standard for analyzing the sample. The tar sample in the syngas was quantified with a similarity index higher than 70 on total ion chromatogram (TIC) peak level. The results from the tar compound’s data yielded from gas chromatography – mass spectrometry was analyzed thoroughly by GC Postrun software, and the results are used to identify every compound separately. Another process was conducted to measure the tar density by the gravimetric method, which is a technique of using the number of ions to analyze the density of compounds. In these experiments, a dryer–evaporation machine (IRIS OHYAMA) with the temperature set to 65 °C was used to evaporate the acetone in the tar sample to obtain the pure mass of the tar compounds. Finally, the pure mass of the tar compounds was quantified using a tar-weight measurement machine (Chyo JL-200) with a high-precision measurement balance and a sensitivity to 0.1 mg. All of the experimental equipment is shown in Figure 3a–c below:

3. Results and Discussion

3.1. Impact of Moisture Content on Tar Formation

The drying of biomass is required for thermal gasification to achieve higher efficiency. Drying of the biomass is achieved by using solar energy or waste heat. Moreover, biomass is hygroscopic, and therefore, even after it is dried, it can still absorb moisture from the atmosphere. Yang et al. studied the effect of moisture content level in fuel. The study established that a fixed air-flow rate and drier fuels have higher burning rates in comparison to wetter fuels [19]. When utilizing biomass as fuel, its high moisture content affects tar formation in the syngas. Moreover, steam gasification involves the reaction of steam with solid carbonaceous feedstocks such as wood pellet biomass, or carbon-containing wastes to produce syngas. Syngas is a gas mixture fuel consisting primarily of hydrogen, carbon monoxide, and very often some carbon dioxide. In order to reduce undesired product including tar formation, the steam gasification of biomass is one alternative way to produce syngas with a high flammable gas production [20,21,22].
The gasification process can be classified as an incineration technology. During the process, combustion is the chemical reaction of biomass gasification and tar production. Homogeneous and heterogeneous reactions are displayed in reaction R1 to R16 as shown in Table 4. The distributed air in the oxidation zone moves with the feedstock to the gasifier. All the products are driven to pass through the oxidation zone, resulting in the effect of tar production. In case water (H2O) is present in the reaction, CO2 can be produced by the water gas shift reaction (WGS) to generate more production of the gas H2 (reaction R10). Additionally, the aqueous-phase reforming through bimetallic catalysts can generate the production of the gases CO2 and H2. The steam reforming process needs to be carried out at high temperatures, where the increasing temperature drives the endothermic reaction from hydrocarbons (reaction R13). The temperature increases in the steam reforming process, enhancing tar removal and increasing H2 and CO concentration [23]. The reaction can be seen in the Table 4.
Even though tar problem is lately a primary concern, the terminology of tar is not well defined. According to Maniatis et al., different compounds with a molecular weight more than 78 (benzene) can be found and be defined as tar compounds [9,10]. The tar sample was quantified using gas chromatography analysis and yielded the tar formation. Additionally this research has focused on the nine tar compounds including phenol (C6H5OH), toluene (C7H8), indene (C9H8), naphthalene (C10H8), biphenyl (C12H10), fluorene (C13H10), phenanthrene (C14H10), fluoranthene (C16H10), and pyrene (C16H10). This research focused on the nine tar compounds because all of them appeared in every experiment’s results. These nine tar compounds are shown in Table 5.
All nine compounds were measured through tar concentration using Equation (2) shown below:
C t = W t V s
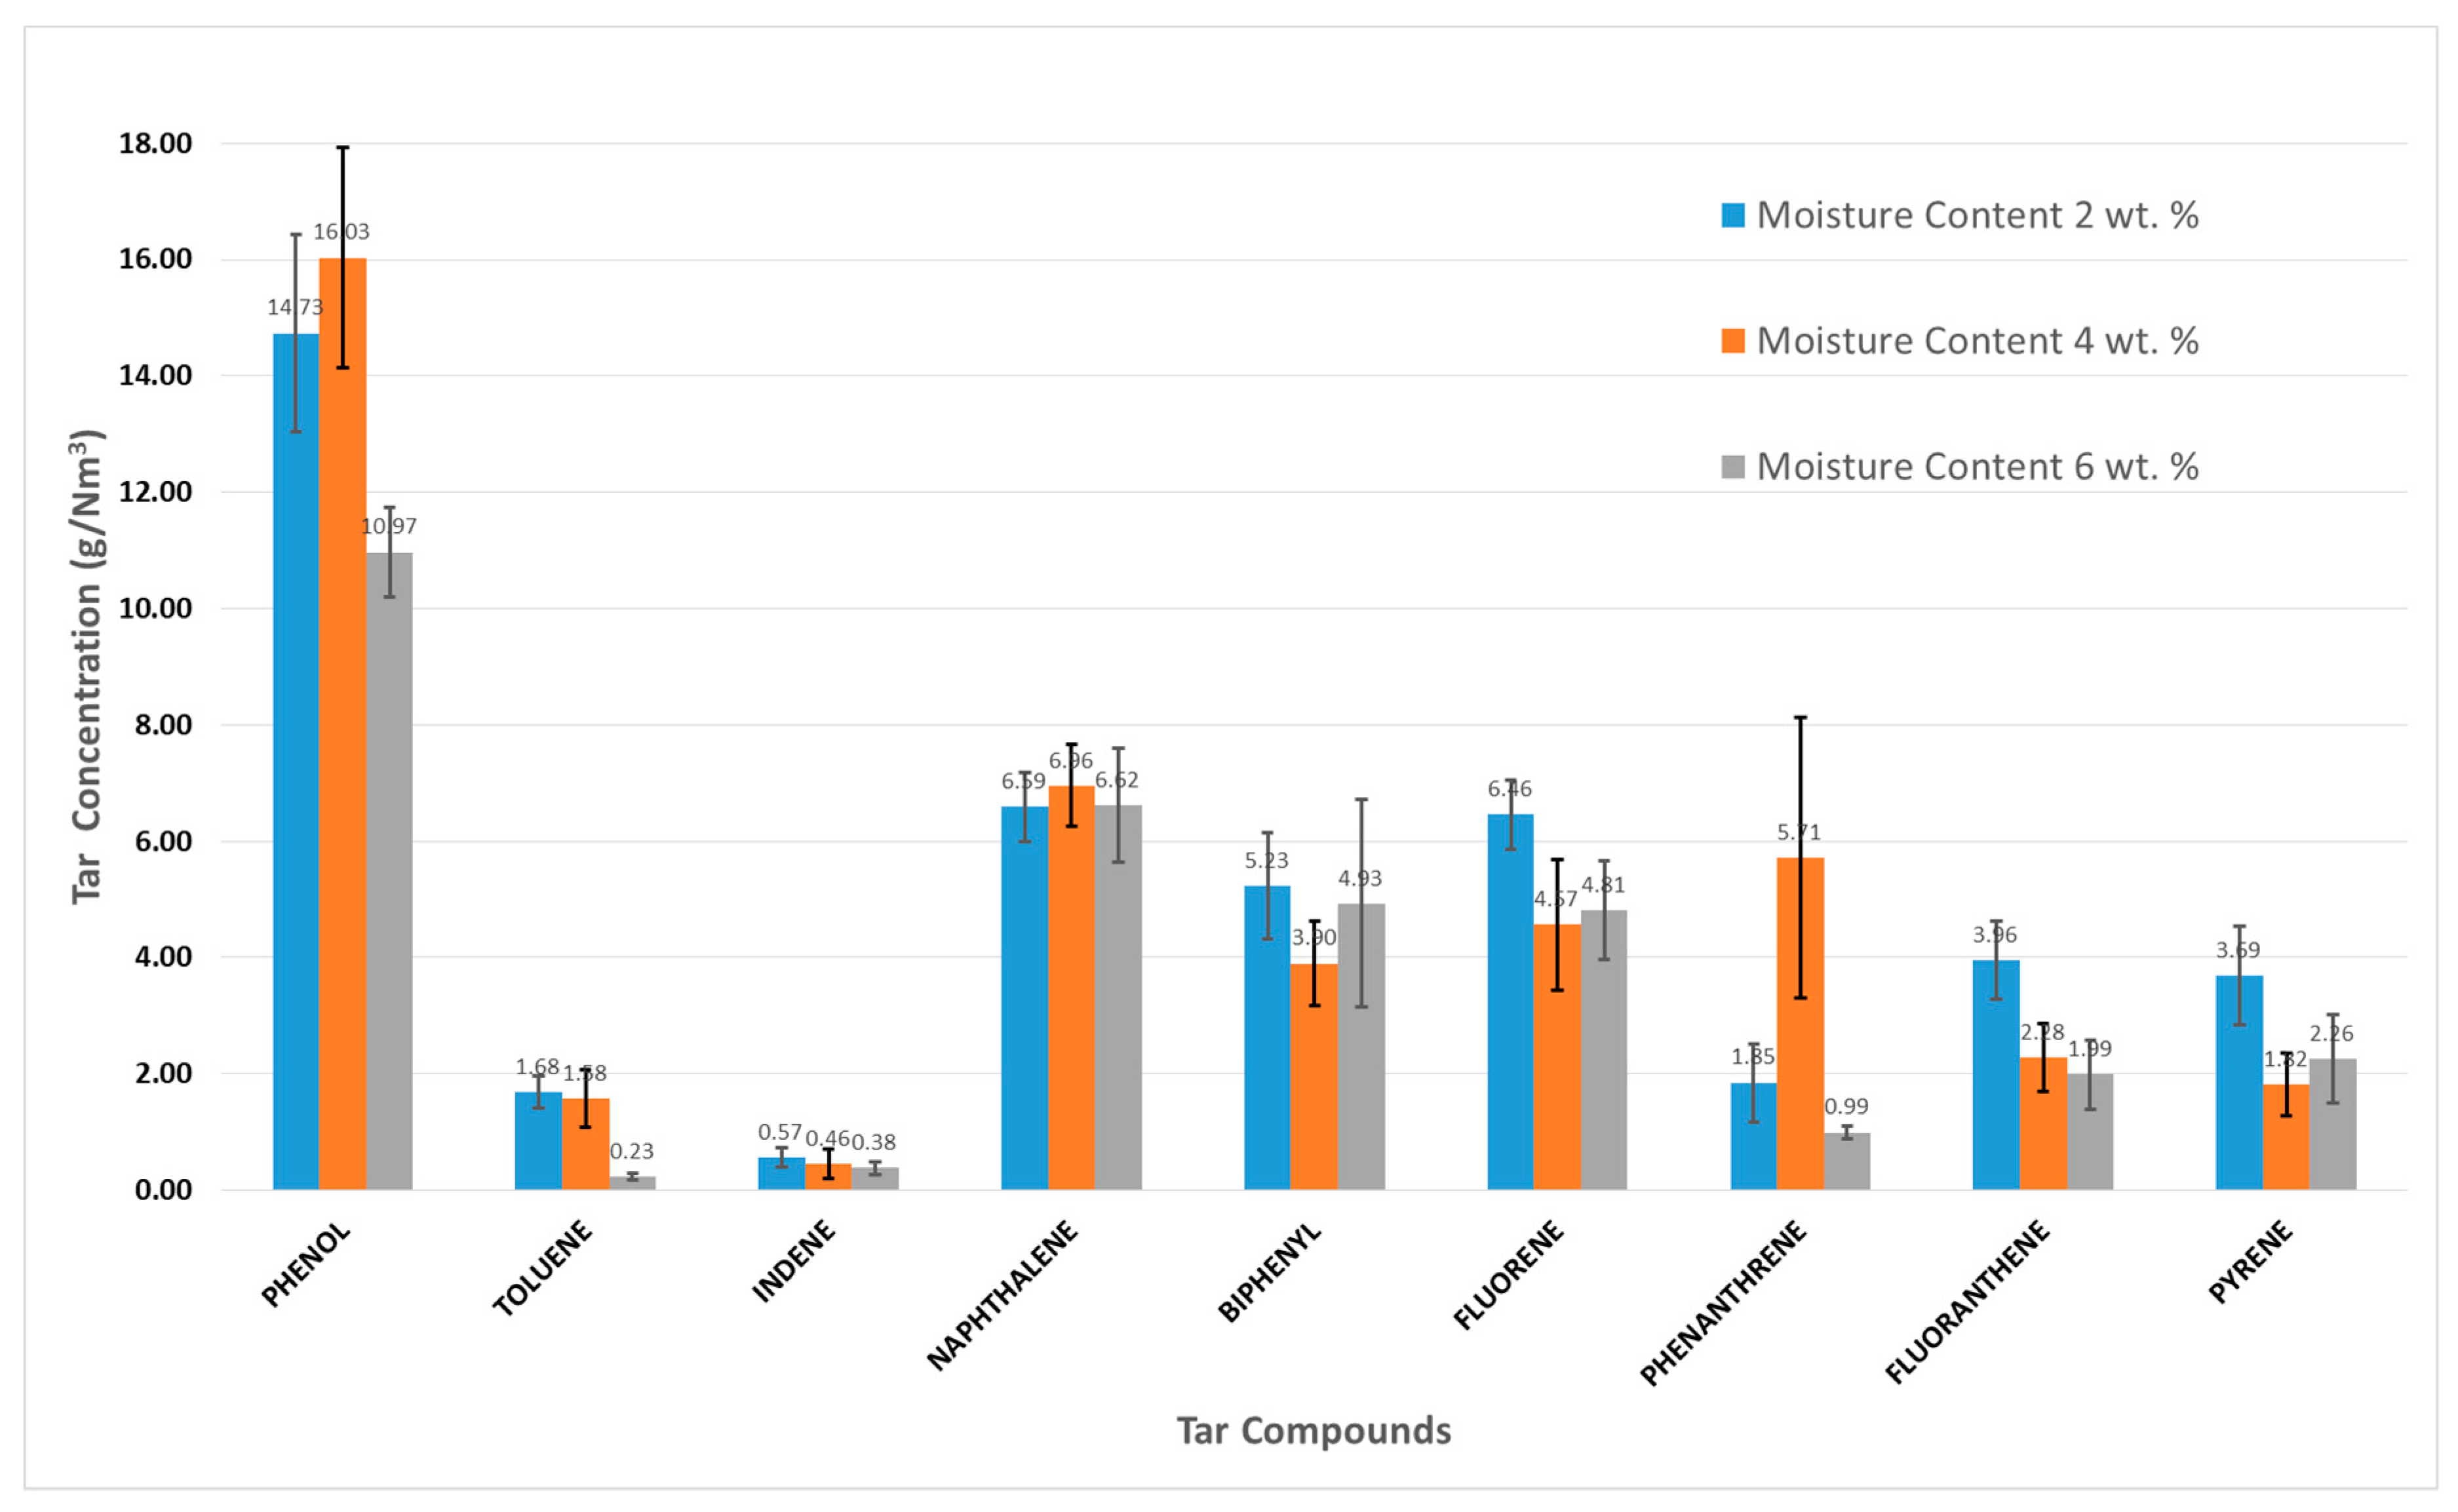
where C t is the concentration of tar in the syngas (g/Nm3), W t is the weight of tar in the syngas (g), and V s is the normal volume of syngas (Nm3). Additionally, the result of tar formation and concentration with a variation of moisture content was calculated, and the results are shown in Figure 4.
Tar formation on air-flow rate 80 L/min with 2 wt. %, 4 wt. %, and 6 wt. % is shown in Figure 4 and the graph is displayed with an error bar chart. The concentration in tar formation in descending order includes phenol, naphthalene, phenanthrene, fluorene, biphenyl, fluoranthene, pyrene, toluene, and indene. Phenol has the highest decreasing value of tar concentration, as the moisture content increased. The standard deviation range corresponds to a 95% confidence interval (CI). For example, phenol compound decreased in tar concentration from 14.73 ± 1.69 g/Nm3 in 2 wt. % moisture content to 10.97 ± 0.76 g/Nm3 in 6 wt. %, including in heterocyclic aromatic compounds. Besides, the minority of the tar formation is toluene and indene, which had declining concentration in the rising of moisture content. Toluene is a light hydrocarbon aromatic compound (1 ring) which does not cause a problem in condensability and solubility. Indene is a light polyaromatic hydrocarbon compound (2–3 rings), which condenses at low temperatures, even at very low concentrations. Toluene had a decreasing value of tar concentration from 1.68 ± 0.28 g/Nm3 in 2 wt. % moisture content to 0.23 ± 0.05 g/Nm3 in 6 wt. %. In indene, the value decreased from 0.57 ± 0.16 g/Nm3 in 2 wt. % to 0.38 ± 0.11 g/Nm3 in 6 wt. %. The decreased value of the tar concentration for both toluene and indene is attributed to wood pellet from lignin, cellulose, and hemicellulose, which contain much oxygen.
The increasing moisture slightly decreased the tar concentration in the nine compounds. Therefore, the result of this study is in line with Gautam et al., which stated that phenol, indene, and toluene existed in the tar compounds from the biomass gasification process with wood pellet as the feedstock. Also, toluene and indene were found to be the majority due to the variation of the biomass-flow rate. However, this study shows that phenol was the majority compound in the variation of moisture content for the biomass gasification process [24].

3.2. Impact of Moisture Content on Tar Classification

A method for analysis of tar classification in syngas from biomass gasification has been actively studied. The purpose of this analysis was to separate the tar classification into two categories, including light and heavy tar. Light tar is mainly composed of volatile and semi-volatile aromatic and phenolic compounds, while heavy tar contains polar non-volatile compounds. Light tar may pass through a capillary gas chromatography (GC) column while heavy tar might damage the operation of the equipment. According to Zhang et al., the differentiation of tar classification based on molecular weight can be determined by gas chromatography [25].
The biomass gasification generated syngas and tar, though the feedstock with higher moisture content was difficult to ignite. Its gasification resulted in low gas yield and higher tar production. In the downdraft gasifier, higher moisture content reduced the temperature of the reaction zone, leading to the deposition of tar in the gasifier. In the experiment, tar was divided as light and heavy, with phenol as the standard parameter. If the compounds have a molecular weight less than that of phenol, they are included as light tar. Otherwise, if the chemical compounds have a molecular weight more than that of phenol, they are included as heavy tar.
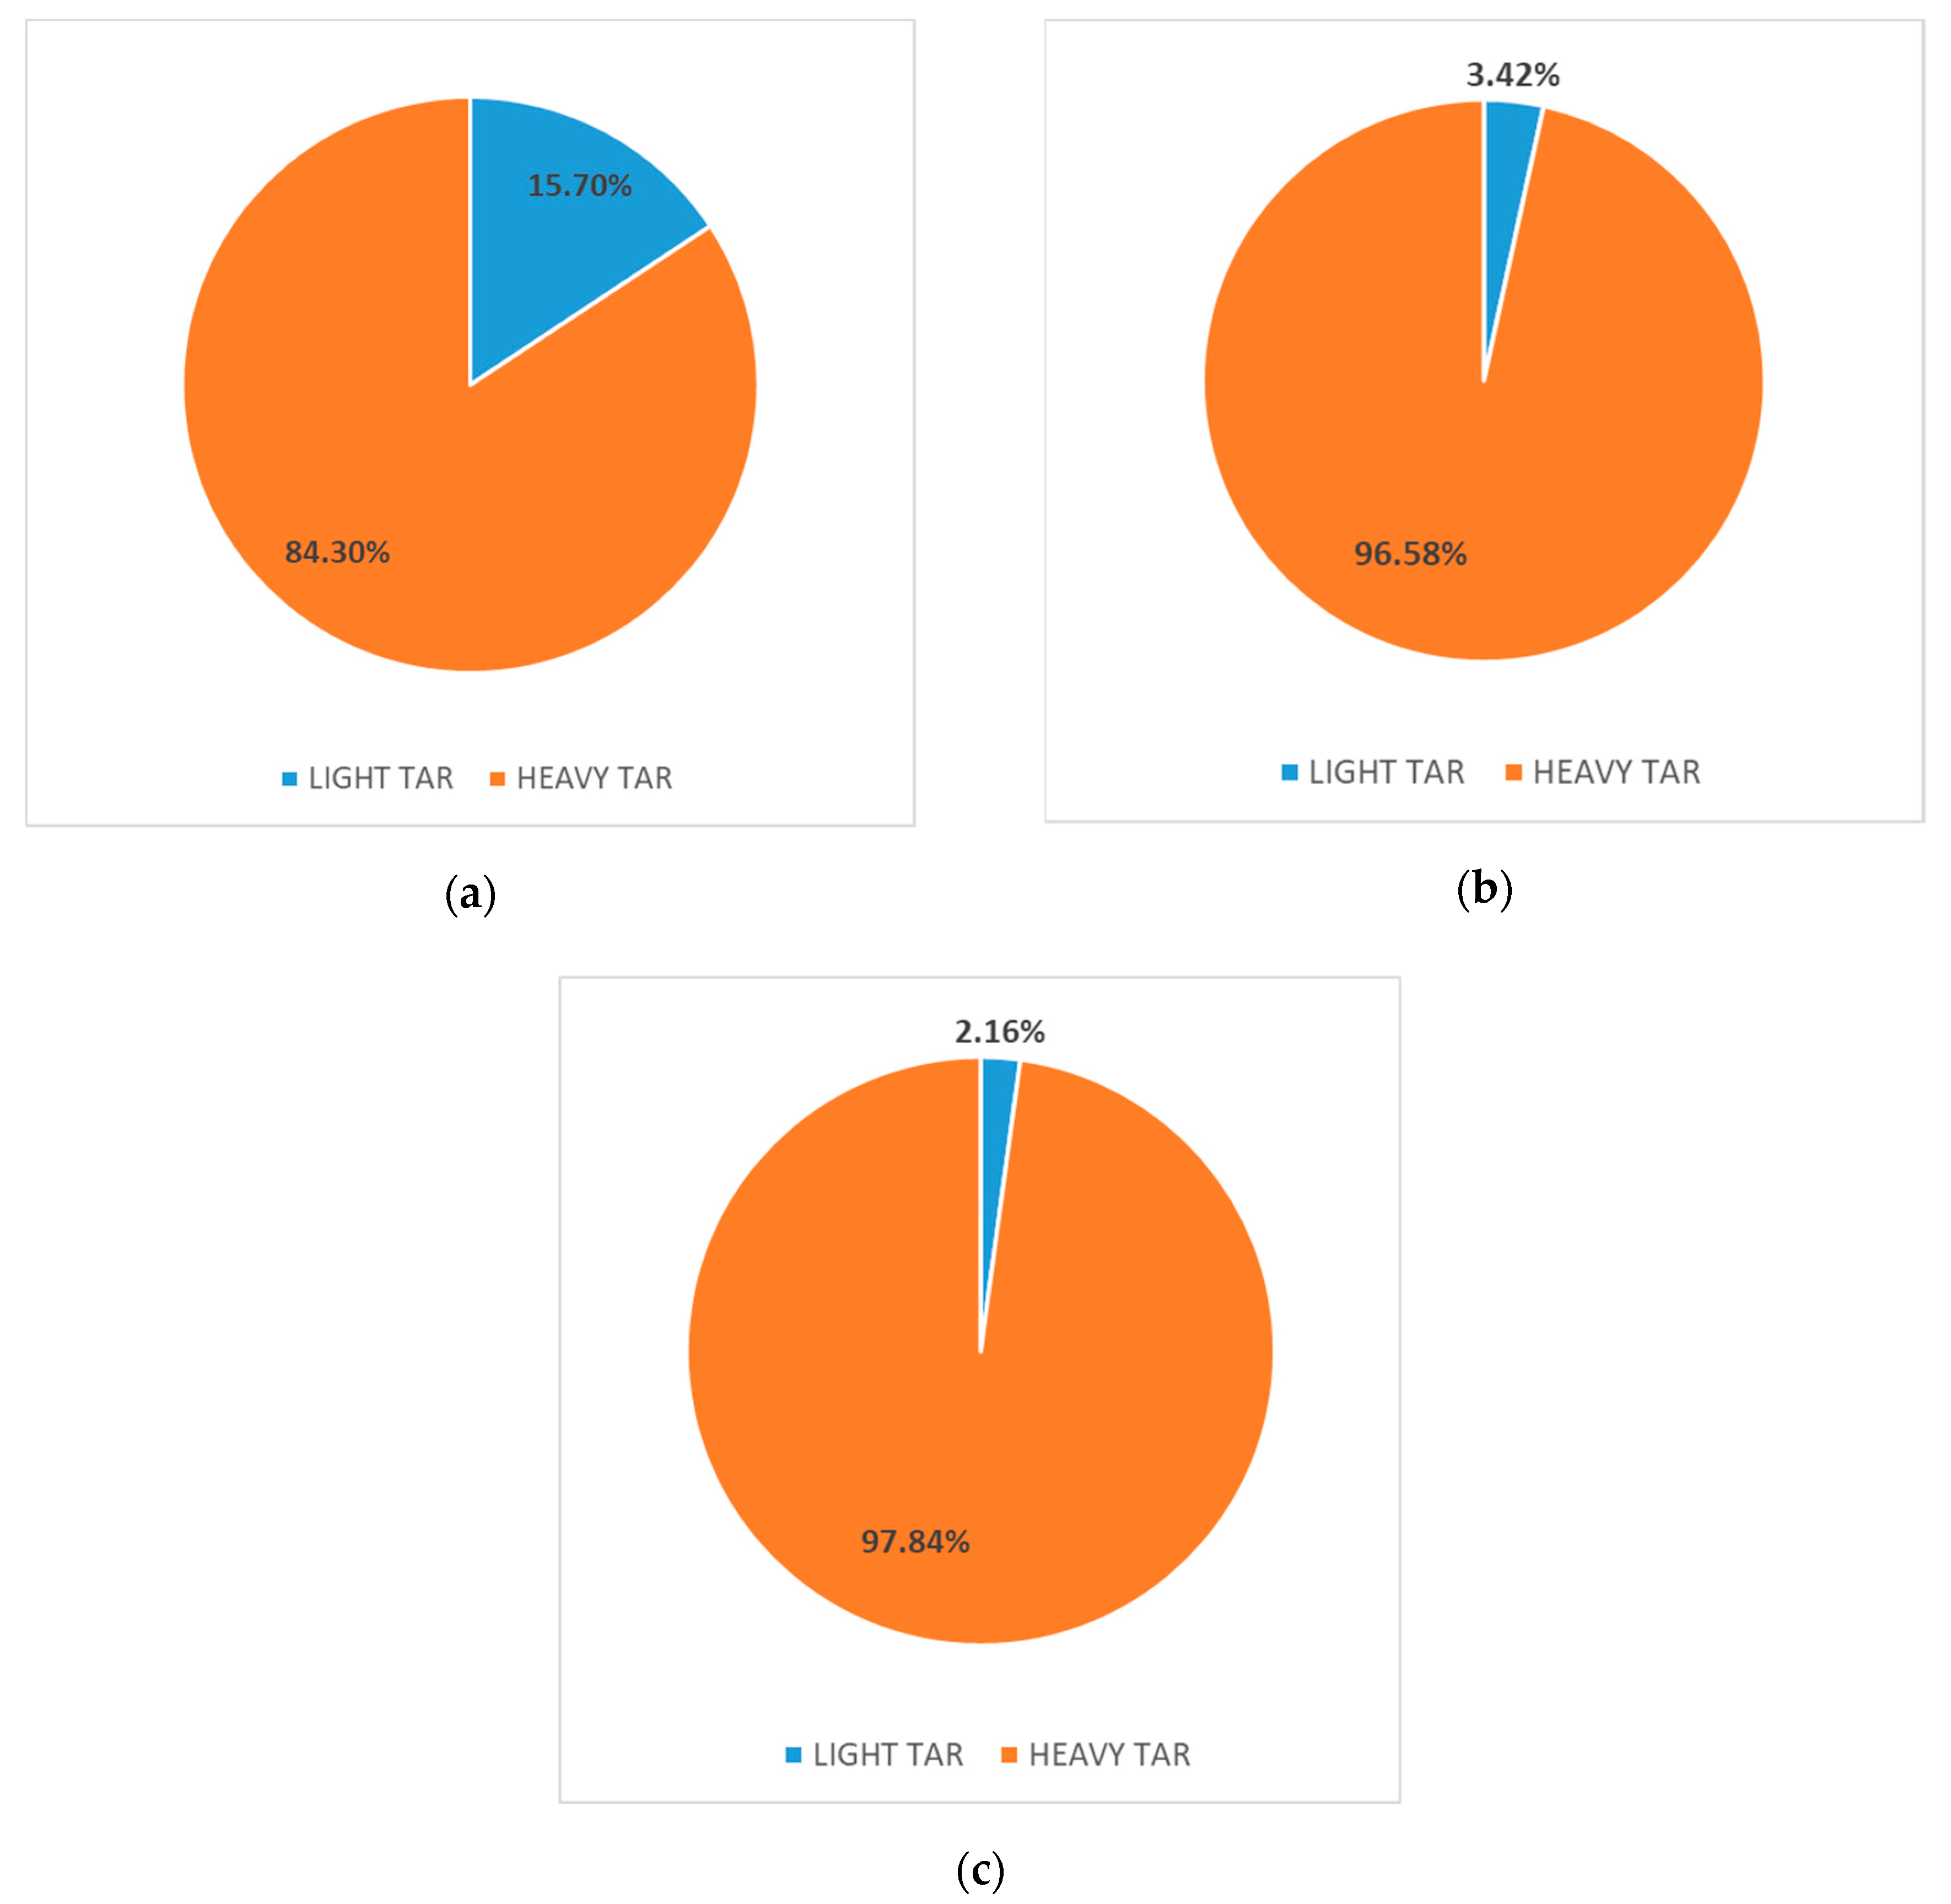
Figure 5 shows the formation of light and heavy tar in the biomass gasification process with variation in moisture content. In Figure 5a, the tar formation in moisture content 2 wt. % with an air-flow rate of 80 L/min shows different results. The tar concentration of light tar is 13.18 g/Nm3, which is equal to 15.70% of the total tar. The heavy tar has a concentration of 70.77 g/Nm3, which is equal to 84.30% of the total of 83.95 g/Nm3. Figure 5b shows the tar classification with a moisture content of 4 wt. % and light tar 2.81 g/Nm3, which is equal to 3.42%. The heavy tar is 79.41 g/Nm3, which is equal to 96.58% of the total concentration of 82.22 g/Nm3. Figure 5c shows the same parameter with the moisture content of 6 wt. %, where the concentration of light tar is 1.55 g/Nm3 or 2.16%, while heavy tar is 70.32 g/Nm3 or 97.84% of the total 71.87 g/Nm3. This result shows that the production of light tar decreased along with an increase in moisture content while the heavy tar increased along with an increase in moisture content. This is the evidence to show that the lowest moisture content of 2 wt. % is better for the biomass gasification process due to a lower yield of heavy tar. More production of heavy tar leads to extensive failure and plugging of the valve and reduces the performance of the biomass operating system. The light tar was much more easily burnt compared to the heavy tar. This was due to the more volatile chemical composition of light tar, such as the hydrocarbon compounds.

3.3. Impact of Moisture Content on Tar Density

The study of tar protocol overcame the tar problem and included standardized methods for sampling and analyzing it from the biomass gasification process. The tar protocol guideline contributes to the alternatives of analyzing tar compounds and tar density. Gas chromatography was used to analyze the tar compounds and this is widely implemented in studying the biomass gasification process. Additionally, to analyze the tar density, the gravimetric method was used alongside the distillation and evaporation processes [26,27]. The study utilized the distillation process to evaporate the solvent with a specific boiling point. In this case, a 3 grams mixture of tar sample and acetone was heated for 5 hours at a temperature of 65 °C until all the acetone evaporated. The boiling point of acetone is 56 °C which allowed the separation of the tar sample, and all of the acetone to be evaporated. A mass of pure tar residue remained, and this was defined as tar density.
The total amount of tar in the syngas was determined using Equation (3) as follows:
v o l t a r = F R s y n g a s · t s y n g a s
where v o l t a r is the volume of tar in the total amount of syngas in the sampling (L), F R   s y n g a s is the flow rate of the syngas in the tar sampling (L/min) and t s y n g a s is the sampling time of the syngas (min).
The tar density in the syngas can be determined using Equation (4):
ρ t a r = m t a r v o l t a r   1000
where ρ t a r is the tar density in the syngas (mg/m3), m t a r is the mass of tar in the syngas in the sampling (mg), and v o l t a r is the volume of tar in the total amount of syngas in the sampling (L).
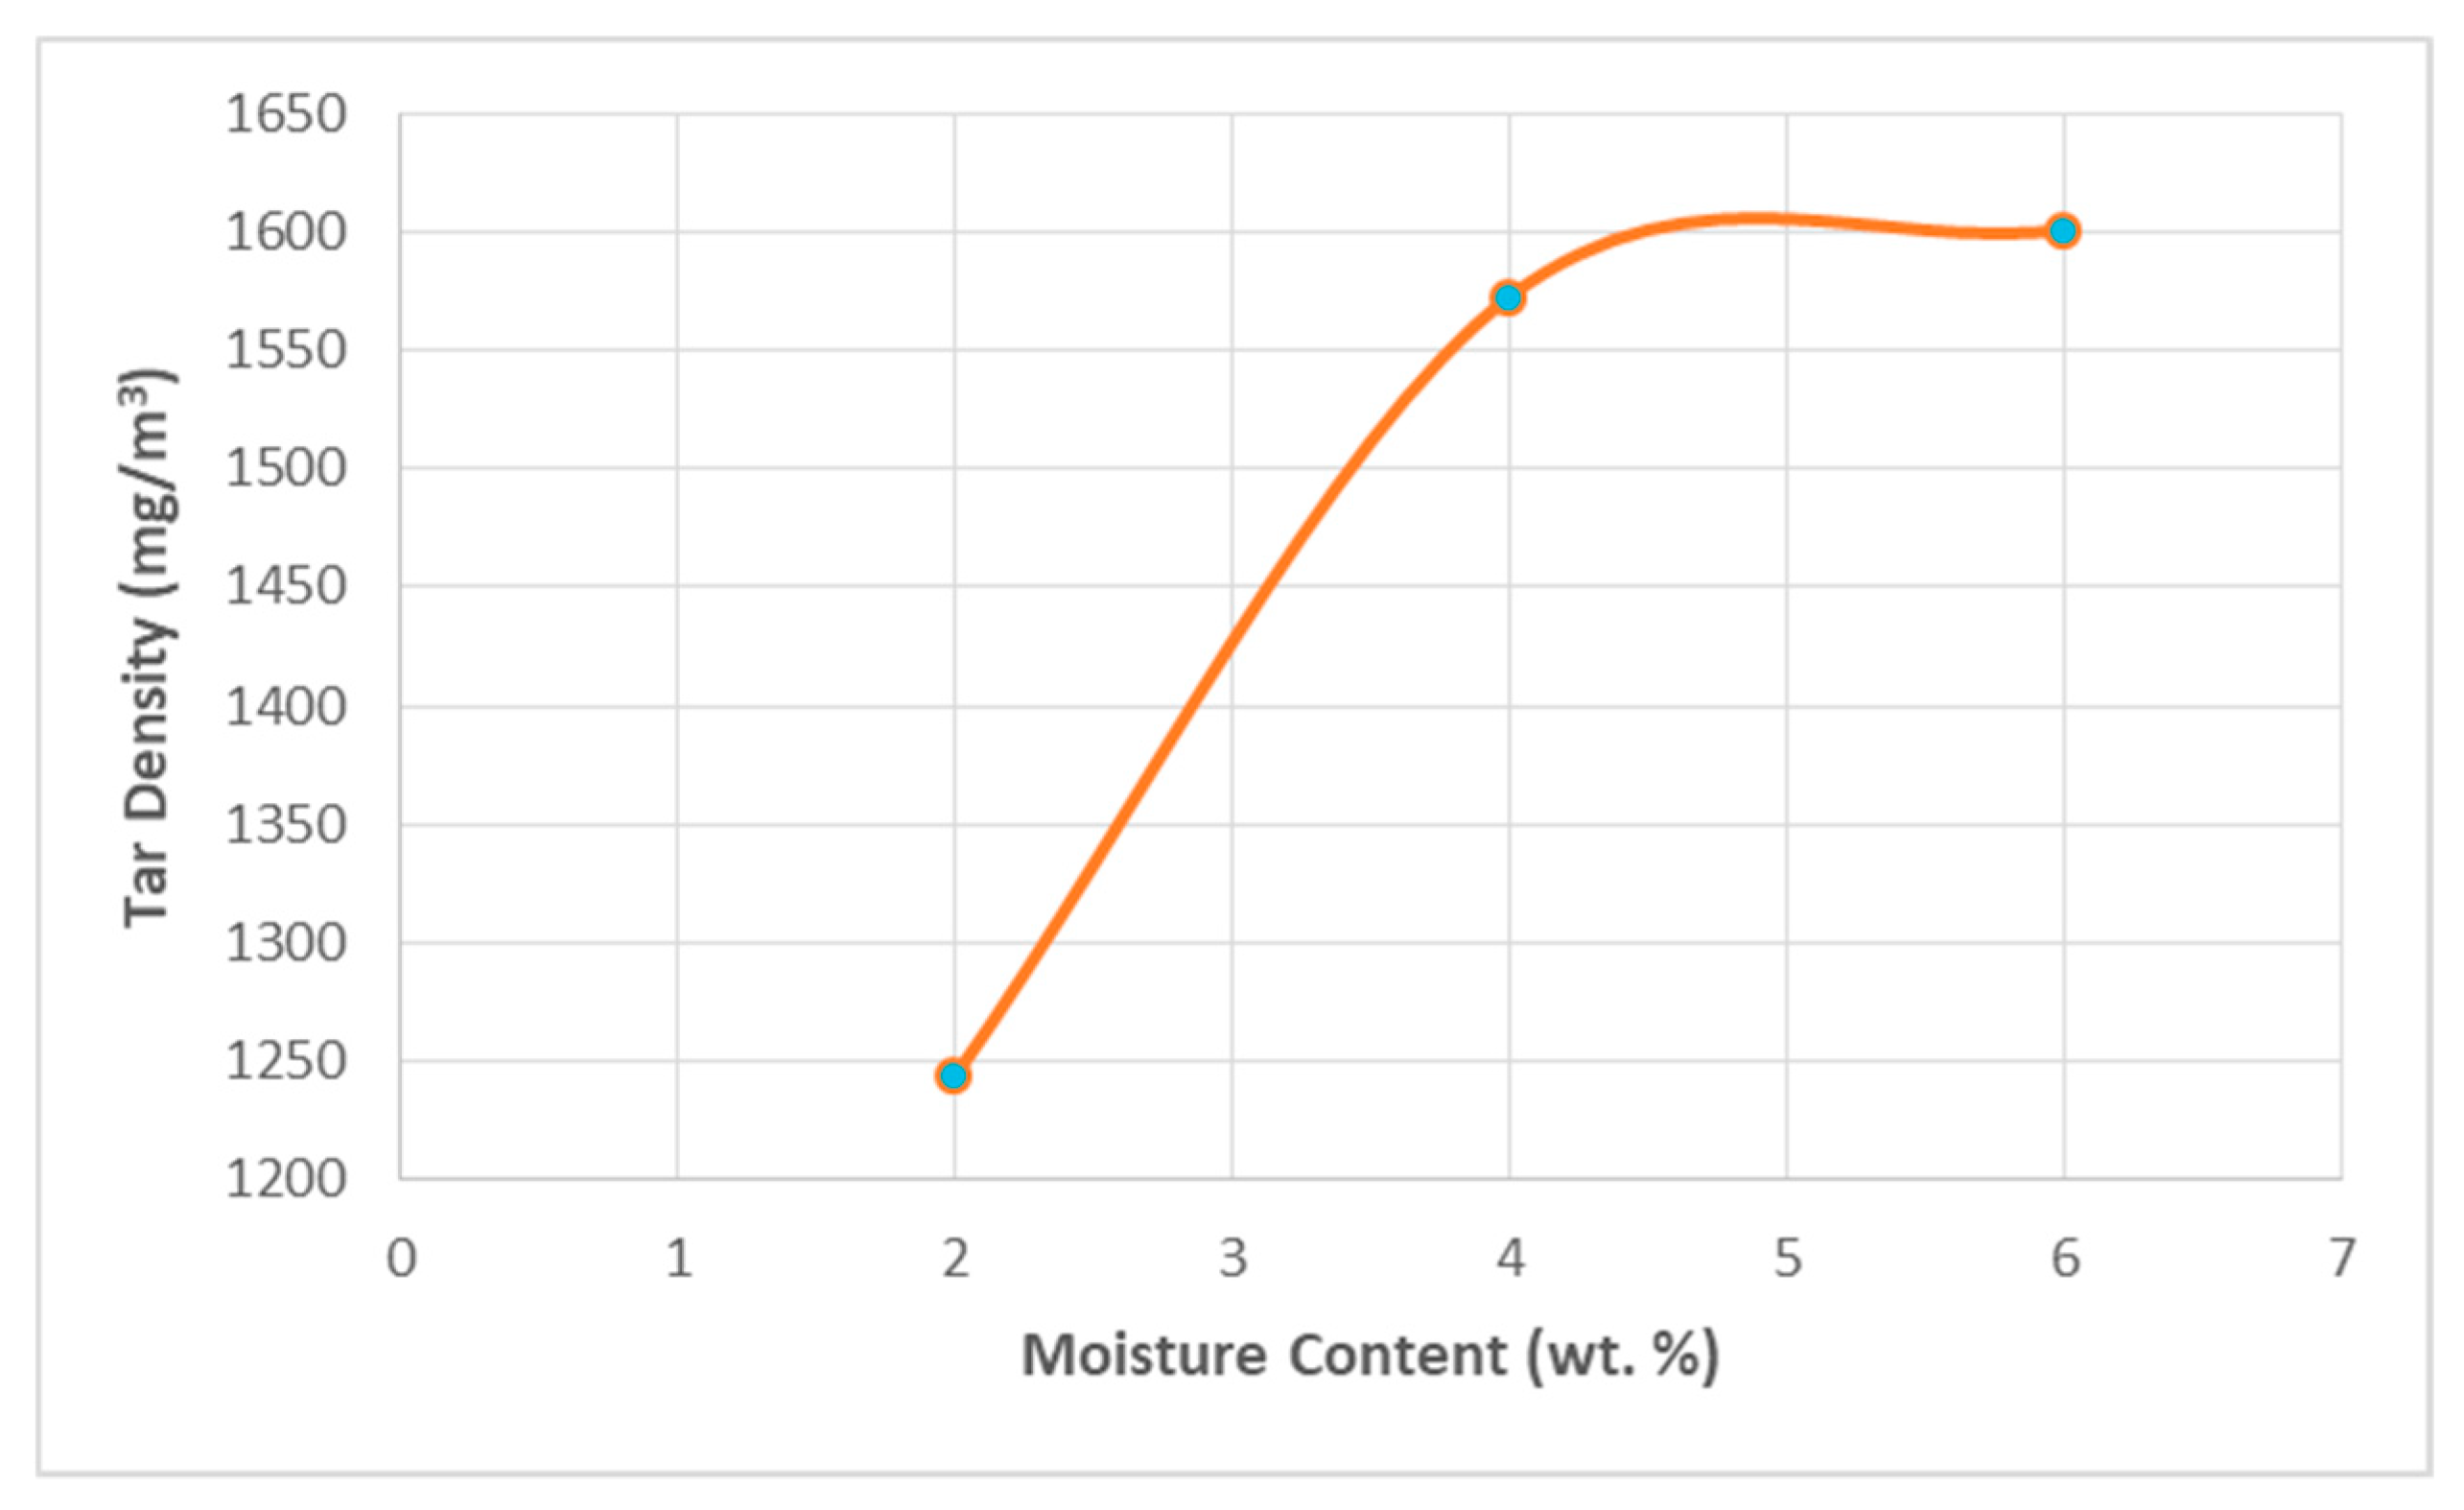
Figure 6 shows the result of gravimetric analysis for wood pellets in the biomass gasification with a variation of moisture content. When the moisture content was 2 wt. %, the tar-density value reached 1243.6 mg/m3. This value gradually increased when it was 4 wt. %, and the tar density in the syngas reached 1572.7 mg/m3. When the moisture content was 6 wt. %, tar density reached 1600.8 mg/m3. The moisture content increases proportionally, raising the tar density. This reduced the reaction zone temperature in the gasifier, leading to the deposition of tar content. Additionally, the lowest moisture content produced the lowest tar density. In contrast, the higher value of tar density influenced and led to the failure of the operation of the biomass gasification process.

4. Conclusions

The gasification process significantly influenced tar characteristics. This study examined the effect of moisture content on tar characteristics. When the moisture content increased, the tar concentration of the phenol compound decreased. The phenol is included in the heterocyclic aromatic compound due to the existence of lignin, cellulose, and hemicellulose in the wood pellet, which contain much oxygen. Moreover, the tar concentration of toluene and indene decreased. The increase in moisture content resulted in heavy tar, which reduced the temperature of the reaction zone and led to the deposition of tar in the gasifier. In consequence, the existence of heavy tar caused extensive failure and plugging of the valve, reducing the performance of the biomass operating system. Furthermore, the increase in moisture content initially increased the tar density, which led to the failure of the gasification process. In contrast, the lowest moisture content produced lower tar density, which is good for the gasification operating process.

Author Contributions

R.F.N. was responsible for the overall experiment, data analysis, arrangement, and manuscript preparation; H.E. was primarily responsible for the data and manuscript confirmations. A.V.C. was responsible for data analysis and software; K.F. was responsible for data analysis; Z.Z. was responsible for data analysis, software and experiment; M.K.D. was responsible for conceptualization, data analysis and manuscript preparation; C.C. was responsible for methodology and data analysis; R.N. was responsible for data and manuscript confirmation. All authors have read and agreed to publish version of the manuscript.

Funding

This research was funded by the Indonesia Endowment Fund for Education (LPDP), grant number PRJ-1621/LPDP.4/2019.

Acknowledgments

This work was supported by the Indonesia Endowment Fund for Education (LPDP), the Ministry of Finance of the Republic of Indonesia (KEMENKEU), the Ministry of Research and Technology of the Republic of Indonesia (KEMENRISTEK), and the Ministry of Education and Culture of the Republic of Indonesia (KEMENDIKBUD) for scholarship and funding, and also Kanazawa University Japan and Gunma University Japan for the data experiment and data analyzing.

Conflicts of Interest

The authors declare no conflict of interest.

References

  1. Oveisi, E.; Sokhansanj, S.; Lau, A.; Lim, J.; Bi, X.; Preto, F.; Mui, C. Characterization of recycled wood chips, syngas yield, and tar formation in an industrial updraft gasifier. Environments 2018, 5, 84. [Google Scholar] [CrossRef] [Green Version]
  2. Rivas, A.M.J.; Yuan, W.; Boyette, M.D. The effect of biomass physical properties on top-lit updraft gasification of woodchips. Energies 2016, 9, 283. [Google Scholar] [CrossRef] [Green Version]
  3. Oveisi, E.; Sokhansanj, S.; Lau, A.; Lim, C.J.; Bi, X.; Ebadian, M.; Preto, F.; Mui, C.; Gill, R. In-depot upgrading the quality of fuel chips for a commercial gasification plant. Biomass Bioenergy 2018, 108, 138–145. [Google Scholar] [CrossRef]
  4. Bridgwater, A.V. The technical and economic feasibility of biomass gasification for power generation. Fuel 1994, 74, 631–653. [Google Scholar] [CrossRef]
  5. Monteiro, E.; Sotton, J.; Bellenoue, M.; Moreira, N.A.; Malheiro, S. Experimental study of syngas combustion at engine-like conditions in a rapid compression machine. Exp. Therm. Fluid Sci. 2011, 35, 1473–1479. [Google Scholar] [CrossRef]
  6. Naryanto, R.F.; Enomoto, H.; Anh, V.C.; Chunti, C.; Noda, R. Effect of tar formation on biomass downdraft gasification reactor of wood pellet with variation of moisture content. In Proceedings of the 14th Biomass Science Conference, Hiroshima, Japan, 16–18 January 2019; pp. 39–40. [Google Scholar]
  7. Naryanto, R.F.; Enomoto, H.; Hieda, N.; Teraoka, Y.; Cunti, C.; Noda, R. The influence of wood pellet feedstock water content on tar component in biomass system using downdraft gasifer. J. Jpn. Inst. Energy 2019, 98, 115–118. [Google Scholar] [CrossRef]
  8. Devi, L.; Ptasinski, K.J.; Janssen, F.J.J.G. A review of the primary measures for tar elimination in biomass gasi cation processes. Biomass Bioenergy 2003, 24, 125–140. [Google Scholar] [CrossRef]
  9. Maniatis, K.; Beenackers, A.A.C.M. Tar protocols. IEA bioenergy gasification task. Biomass Bioenergy 2000, 18, 1–4. [Google Scholar] [CrossRef]
  10. Li, C.; Suzuki, K. Tar property, analysis, reforming mechanism and model for biomass gasification—An overview. Renew. Sustain. Energy Rev. 2009, 13, 594–604. [Google Scholar] [CrossRef]
  11. El-Rub, Z.A.; Bramer, E.A.; Brem, G. Review of catalysts for tar elimination in biomass gasification processes. Ind. Eng. Chem. Res. 2004, 43, 6911–6919. [Google Scholar] [CrossRef]
  12. Rivas, A.M.J.; Yuan, W.; Wang, D.; Wang, D.; Kumar, A. The effect of gasification conditions on the surface properties of biochar produced in a top-lit updraft gasifier. Appl. Sci. 2020, 10, 688. [Google Scholar] [CrossRef] [Green Version]
  13. Ohara, H.; Matsuzawa, K. Method and apparatus for repairing tar JP 2009-40885. Available online: https://www.j-platpat.inpit.go.jp/c1800/PU/JP-2007-207391/F1A915D9A45E9E7DAFCE569F7E33F799406F7C84AFAD38B7774536F153ED103F/10/ja (accessed on 30 August 2018).
  14. Hanaoka, T.; Inoue, S.; Uno, S.; Ogi, T.; Minowa, T. Effect of woody biomass components on air-steam gasification. Biomass Bioenergy 2005, 28, 69–76. [Google Scholar] [CrossRef]
  15. Telmo, C.; Lousada, J. Heating values of wood pellets from different species. Biomass Bioenergy 2011, 35, 2634–2639. [Google Scholar] [CrossRef]
  16. Bronson, B. The Effects of Feedstock Pre-Treatment on the Fluidized Bed Gasification of Biomass; Faculty of Engineering, University of Ottawa: Ottawa, ON, Canada, 2014. [Google Scholar]
  17. Kiel, J.H.A.; van Paasen, S.V.B.; Neeft, J.P.A.; Devi, L.; Ptasinski, K.J.; Janssen, F.J.J.G.; Meijer, R.; Berends, R.H.; Temmink, H.M.G.; Brem, G.; et al. Primary Measures to Reduce Tar Formation in Fluidised-Bed Biomass Gasifiers; ECN Biomass, Energy Research Centre of the Netherlands (ECN): Petten, The Netherlands, 2004; p. 108. [Google Scholar]
  18. Cong, A.V.; Enomoto, H.; Naryanto, R.F.; Fukadu, K.; Zong, Z.; Chunti, C.; Noda, R. Major tar compounds in raw producer gas and deposits from a small downdraft gasifier: Analysis and comparison. BioResources 2020, 15, 1773–1790. [Google Scholar]
  19. Yang, Y.B.; Sharifi, V.N.; Swithenbank, J. Swithenbank. Effect of air flow rate and fuel moisture on the burning behaviours of biomass and simulated municipal solid wastes in packed beds. Fuel 2004, 83, 1553–1562. [Google Scholar] [CrossRef]
  20. Franco, C.; Pinto, F.; Gulyurtlu, I.; Cabrita, I. The study of reactions influencing the biomass steam gasification process. Fuel 2003, 82, 835–842. [Google Scholar] [CrossRef]
  21. Rapagna, S.; Provendier, H.; Petitc, C.; Kiennemannc, A.; Foscoloa, P.U. Development of catalysts suitable for hydrogen or syn-gas production from biomass gasi cation. Biomass Bioenergy 2002, 22, 377–388. [Google Scholar] [CrossRef]
  22. Ross, D.; Noda, R.; Horio, M.; Kosminski, A.; Ashman, P.; Mullinger, P. Axial gas profiles in a bubbling fluidised bed biomass gasifier. Fuel 2007, 86, 1417–1429. [Google Scholar] [CrossRef]
  23. Gómez-Barea, A.; Ollero, P.; Leckner, B. Optimization of char and tar conversion in fluidized bed biomass gasifiers. Fuel 2013, 103, 42–52. [Google Scholar] [CrossRef]
  24. Gautam, G.; Adhikari, S.; Thangalazhy-Gopakumar, S.; Brodbeck, C.; Bhavnani, S.; Taylor, S. Tar analysis in syngas derived from pelletized biomass in a commercial stratified downdraft gasifier. BioResources 2011, 6, 4653–4661. [Google Scholar]
  25. Zhang, Y.; Kajitani, S.; Ashizawa, M.; Miura, K. Peculiarities of rapid pyrolysis of biomass covering medium- and high-temperature ranges. Energy Fuels 2006, 20, 2705–2712. [Google Scholar] [CrossRef]
  26. Kamp, W.V.D.; Wild, P.D.; Zielke, U.; Suomalainen, M.; Knoef, H.; Good, J.; Liliedahl, T.; Unger, C.; Whitehouse, M.; Neeft, J.; et al. Tar measurement standard for sampling and analysis of tars and particles in biomass gasification product gas. In Proceedings of the 14th European Biomass Conference & Exhibition, Paris, France, 17–21 October 2005; pp. 1–8. [Google Scholar]
  27. Vakalis, S.; Patuzzi, F.; Moustakas, K.; Sotiropoulos, A.; Malamis, D.; Baratieri, M. Analysis of tar compounds and quantification of naphthalene from thermal treatment of household biowaste. J. Environ. Manag. 2018, 216, 153–159. [Google Scholar] [CrossRef] [PubMed]
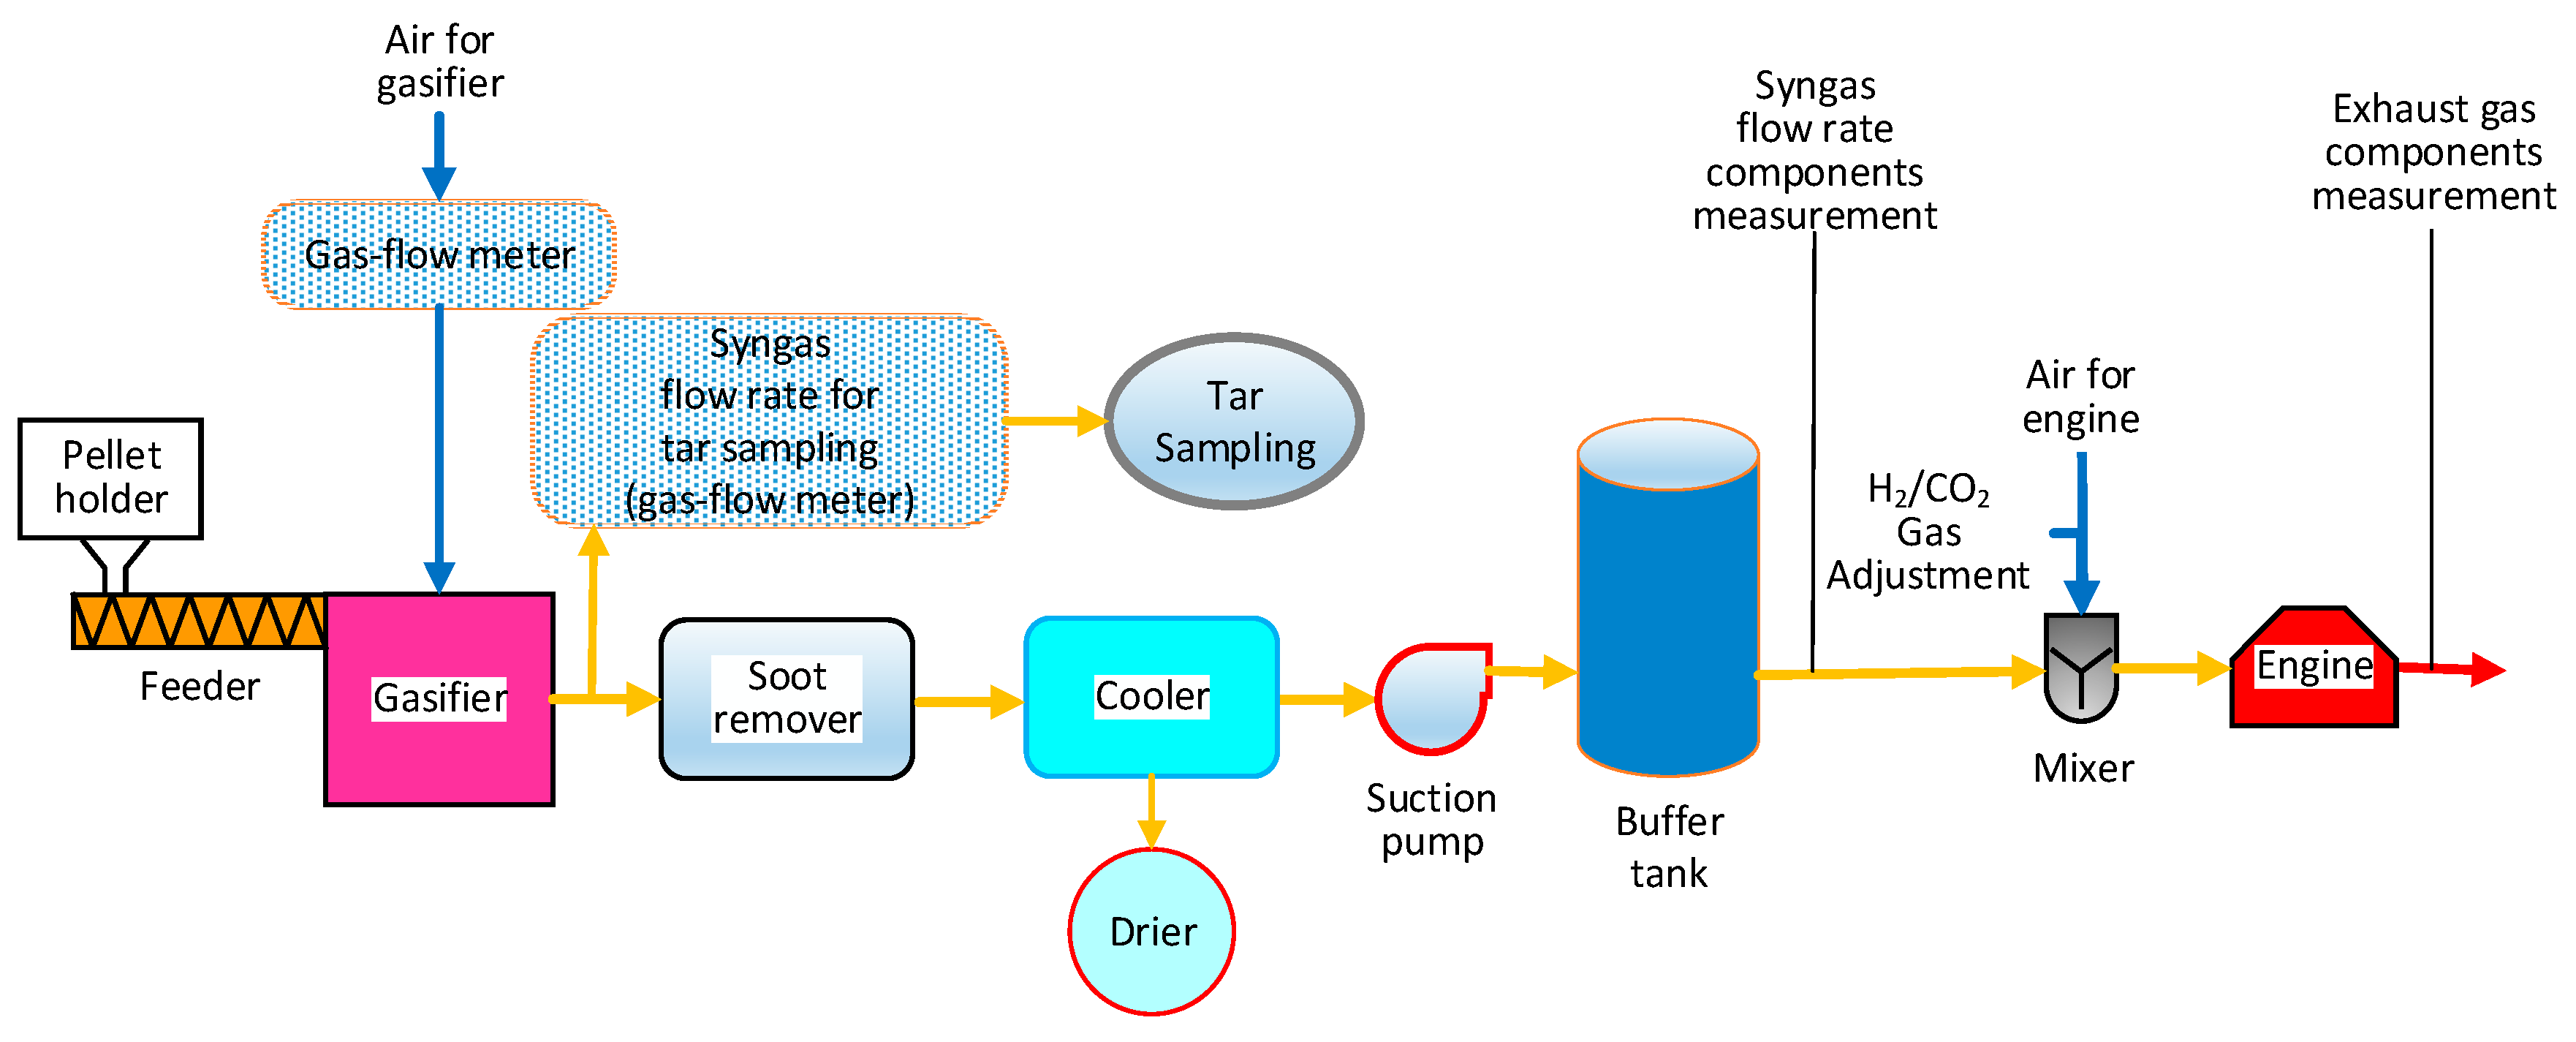
Figure 1. The biomass gasification system.
Applsci 10 02760 g001
Figure 2. Tar-Sampling Equipment.
Applsci 10 02760 g002
Figure 3. (a) Shimadzu GC-MS QP2010 Plus (b) Dryer–evaporation machine (IRIS OHYAMA) (c) Tar-weight measurement machine (Chyo JL-200).
Applsci 10 02760 g003aApplsci 10 02760 g003b
Figure 4. Tar formation on air-flow rate at 80 L/min with variation of moisture content 2 wt. %, 4 wt. %, and 6 wt. %.
Applsci 10 02760 g004
Figure 5. (a) Tar formation in light and heavy tar in moisture content 2 wt. % (b) Tar formation in light and heavy tar in moisture content 4 wt. % (c) Tar formation in light and heavy tar in moisture content 6 wt. %
Applsci 10 02760 g005
Figure 6. Tar density on air-flow rate at 80 L/min with variations of moisture content: 2 wt. %, 4 wt. %, and 6 wt. %.
Applsci 10 02760 g006
Table 1. Property of wood pellet.
Property of Wood Pellet
Length (mm)12
Diameter (mm)6
Bulk density (kg/m3)790
Table 2. Ultimate Analysis (UA) of wood pellet. JIS: Japan industrial standard
Ultimate Analysis (wt. %, Dry Ash-Free) JIS M8813.
O (balance)43.37
N0.09
S0.09
H6.43
C (dry, ash-free)50.02
Table 3. Proximate Analysis (PA) of wood pellet.
Proximate Analysis (wt. %, Dry Basis) JIS M8812
Volatile matter (dry base)81.82
Ash0.53
Fixed carbon17.65
Low heating value (LHV)15.37 MJ/kg—dry
Table 4. Chemical reactions from gasification [23].
StoichiometryStandard Heat of Reaction (kJ/mol)NameNumber
Biomass → char + tar + H2O + light gas
(CO + CO2 + H2 +CH4 + C2 + N2 + …)
EndothermicBiomass de-volatilizationR1
Char combustion
C + 1/2O2 → CO−111Partial combustionR2
C + O2 →CO2−394Complete combustionR3
Char gasification
C + CO2 →2CO+173Boudouard reactionR4
C + H2O → CO +H2+131Steam gasificationR5
C +2H2 →CH4−75Hydrogen gasificationR6
Homogeneous volatile oxidation
CO + 1/2O2 →CO2−283Carbon monoxide oxidationR7
H2 + 1/2O2 →H2O−242Hydrogen oxidationR8
CH4 + 2O2 →CO2 + 2H2O−283Methane oxidationR9
CO + H2O → CO2 + H2−41Water gas-shift reactionR10
CO +3H2 → CH4 + H2O−206MethanationR11
Tar reaction (tar assumed CnHm)
CnHm + (n/2)O2 → nCO + (m/2)H2Endothermic
(except R12)
(200–300)
Partial oxidationR12
CnHm + nH2O → (m/2 + n)H2 +nCO Steam reformingR13
CnHm + nCO2 → 2nCO + (m/2)H2 Dry reformingR14
CnHm +(2n-m/2)H2 → nCH4 HydrogenationR15
CnHm → (m/4)CH4 + (n-m/4)C Thermal crackingR16
Table 5. The nine tar compounds in biomass.
CompoundChemical FormulaMolecular Weight(g/mol)Boiling Point (°C)
PhenolC6H5OH94.11181.7
TolueneC7H892.14110.6
IndeneC9H8116.16181.6
NaphthaleneC10H8128.17218
BiphenylC12H10154.21255
FluoreneC13H10166.22295
PhenanthreneC14H10178.23336
FluorantheneC16H10202,26375
PyreneC16H10202.25404