Article

Study on Penetration Sensing Method Based on Pool Oscillation and Arc Voltage during Pulsed GMAW

1
College of Materials Science and Technology, Nanjing University of Aeronautics and Astronautics, Nanjing 210016, China
2
China Intelligent Equipment Innovation Institute (Ningbo) Co., Ltd., Ningbo 315700, China
*
Author to whom correspondence should be addressed.
Appl. Sci. 2020, 10(8), 2735; https://doi.org/10.3390/app10082735
Submission received: 26 February 2020 / Revised: 7 April 2020 / Accepted: 13 April 2020 / Published: 15 April 2020
(This article belongs to the Section Applied Industrial Technologies)

Abstract

:
The internal relations among the oscillation characteristics of the weld pool, the voltage signal curve and the penetration status of the weld joint in pulsed gas metal arc welding were investigated by using high-speed camera and image analysis system to extract characteristics of weld pool oscillation. The results show that the amplitude of weld pool oscillation decreased with decreasing weld penetration. An abrupt change occurred in the frequency components and amplitude of weld pool oscillation, accompanying the transition from partial to full penetration. The voltage signal curve lost the oscillation frequency characteristic of the pool, due to the curvature of the weld pool surface. While similar to the oscillation amplitude, the fluctuation of the voltage signal caused by the weld pool oscillation reflected the penetration of the weld pool. The abrupt transition in the fluctuation amplitude of the voltage signal in the base duration from partial penetration to full penetration may be used to sense the penetration of the weld pool in real time.

1. Introduction

P-GMAW (pulsed gas metal arc welding) has great advantages in the welding process and weld quality, with a splash-free transition, low heat input and good appearance of the weld bead. In the P-GMAW process, current is periodically modulated between a relatively low base current and a high peak current. By repeatly applying current pulses, a synthetic spray mode of metal transfer is primarily produced at a comparatively low level of heat input. The process has broad application prospects for automatic welding, especially for welding heat-sensitive materials and thin sheets. Weld penetration is one of most important evaluation standards that determine the quality of welding joints. Therefore, it is important to sense weld penetration during automatic P-GMAW. The weld pool dynamic behavior is a direct response to the weld pool state [1]. Therefore, the first condition to control the penetration is to extract the characteristic signal of penetration from the behavior of molten pool.
In recent years, researches on the penetration sensing methods have made significant progress, which can be divided into the visual sensor [2,3,4], the temperature field sensor [5,6] and the characteristic extraction of weld pool oscillation [7,8]. Machine vision is widely used in penetration control of weld pool for which contains sufficient information to estimate weld penetration. Chen et al. used a single camera to obtain two-dimensional images of the weld pool and extract the contour. The weld depth information was estimated through the outline and dimensions of the weld pool [9]. However, due to the limited information contained in 2-dimensional images, various methods for measuring the 3-dimensional surface feature information of weld pool are proposed. Zhang et al. reconstructed the three-dimensional surface of the weld pool in real time in pipe GTAW (gas tungsten arc welding) process by using the structured light illuminating the weld pool surface and capturing the reflected images [10]. Wang et al. proposed a method to obtain 3-dimensional features of the weld pool in GMAW by the binocular vision system. The 980 nm near-infrared filter was used to eliminate the negative interference of arc light on the weld pool image, and the solid circle array 3-dimensional reconstruction algorithm was used to reconstruct the surface morphology of the weld pool [8]. However, the reconstruction algorithm of weld pool surface is complex and time-consuming, which leads to poor real time performance of weld penetration sensing. The weld pool temperature profile can also reflect weld penetration status. Vasudevan et al. found that the relationship between the temperature gradient and penetration depth of the weld pool is inverse linear by using infrared camera [6]. Unfortunately, the welding arc and change of surface slope of weld pool seriously interfered with the measurement accuracy of the temperature field of the weld pool by the infrared camera. And these methods all require additional sensing equipment, which would increase cost and inhibits the applicability.
The weld pool oscillation is one of the feature signals for characterizing penetration status in GTAW. The oscillation frequency had an inverse linear relationship with the penetration status of weld joints, and a cliff descent occurs in oscillation frequency from partial to full penetration in stationary and low welding speed due to different boundary conditions of the pool in GTAW [11]. Shi et al. retrieved the weld pool oscillation frequency in P-GTAW by using the reflected image of structured light which illuminated on the weld pool surface, and similar results were obtained [7]. You Hong Xiao et al. studied the relationship between voltage signal and the oscillation of the weld pool in P-GTAW, and it was found that the frequency and the amplitude of the weld pool oscillation can be exacted from voltage signal [12]. Compared with P-GTAW, the dynamic behavior of weld pool in P-GMAW is more complicated, which increases the difficulty of sensing weld penetration status based on weld pool oscillation and voltage signal. WANG and ZHANG found that the depth of the weld penetration can be determined with adequate accuracy from the change of the weld pool surface depth during the peak current period [8]. Based on this study, Pengfei Bai and WANG established the empirical equation of relation between the penetration status and the fluctuation amplitude in voltage signal at peak current period for stationary welding with different wire feeding speeds [13].
The voltage signal of GTAW can reflect the change of weld pool height in real time because the spatial position of the tungsten electrode is constant and the weld pool is relatively flat [11]. In contrast, in P-GMAW, the droplet growth and oscillation at the tip of the welding wire at peak current period have a significant influence on the arc length, which results in the voltage signal not accurately reflecting the change in the weld pool height [14]. However, there is not a lot of literature that expounds on the internal relationships among the oscillation characteristics of the weld pool, the voltage signal and the penetration status of the traveling welding joint in P-GMAW. Therefore, the researches about the relation among the weld pool oscillation, the penetration status and the voltage signals were of considerable significance to realize P-GMAW weld penetration sensing based on voltage signal with low cost and high reliability.
To study the internal relations between the oscillation characteristics of the weld pool and the penetration status of the weld joint in P-GMAW, a high-speed camera and image analysis system was used to obtain the direct information about the weld pool dynamic behavior in this paper. Generally, the welding parameters cannot be changed during the welding process, and the welders adjust the welding speed to control weld penetration. Based on this, Weld joints with different penetration status were obtained with varying speeds of welding under the same welding parameters in this paper. The relationship between voltage signal and weld pool oscillation was analyzed under different penetration status, and a new method is proposed to sense the penetration status for traveling P-GMAW which was based on the voltage signal during pulse base value phase.

2. Materials and Methods

2.1. Experimental System and Principle of Measurement

The experimental system is shown in Figure 1. A high-speed camera and image analysis system was used in this study with 10,000 fps, synchronized with the monitoring of electrical signals. The background light source was a light-emitting-diode (LED) with a wavelength of 850 nm and a luminous power of 3 W. An 850-nm near-infrared filter was equipped on the camera to obtain clear photos without arc light. Fronius TPS5000 (FRONIUS, Austria) was selected as power sources of the welding system. The welding position was PA (Flat position, as per ISO 6947).
To obtain the coordinate information about the weld pool dynamic behavior in high-speed camera photographs, an image processing program was built based on LabView in this paper. The processing workflow is as follows: (1) To eliminate the noise and extract the contour coordinates of the welding pool surface and wire tip in the picture, the original images obtained should be binarized and median filtering, as shown in Figure 1. (2) To quantitative analysis the weld pool motion, two reference points were defined on the weld pool surface. Point A was on the surface of the pool just below the wire, as shown in Figure 2. The distance between Point A and Point B was 1.8 mm (1.5 times wire diameter). The Y-coordinate of the reference point was measured as a function of time. (3) The vertical distance (LV) and the minimum distance (Lmin) from the end of the wire to the surface of the pool were calculated by the image processing program, as shown in Figure 2.

2.2. Materials and Welding Parameters

In this paper, the S235JR (1.0038) steel plate of size 500 mm × 150 mm × 2 mm was used as welding workpieces. The “I” groove weld joints with no gap were prepared with the filler wire of ER70S-6 (G42) mild steel with a diameter of 1.2 mm. The chemical composition of the welding workpiece and filler wire is given in Table 1. Shielding gas was a mixture of 82% Ar + 18% CO2, with a flow rate of 15 L/min. The contact tip to workpiece distance (CTWD) was 15 mm. Welding parameters are listed in Table 2.

2.3. Penetration Status Definition

In the production process of welding, penetration status cannot be classified by the geometry of the weld cross-section. The shape of the bead on the back of the weld was the main criterion to determine the penetration status. In this paper, penetration status is classified into partial penetration, critical penetration and full penetration, as shown in Figure 3. The shape of the bead on the back of the full penetration weld was stable and uniform, as shown in Figure 3a. The shape of the bead on the back of the critical penetration weld was discontinuous and constructed by discrete fusion points, as shown in Figure 3b. The back of the partial penetration weld was the continuous unfused groove, as shown in Figure 3c. The penetration status of the weld beads in this paper are shown in Table 3.

3. Results and Discussion

3.1. Oscillation Characteristics of Weld Pool in P-GMAW

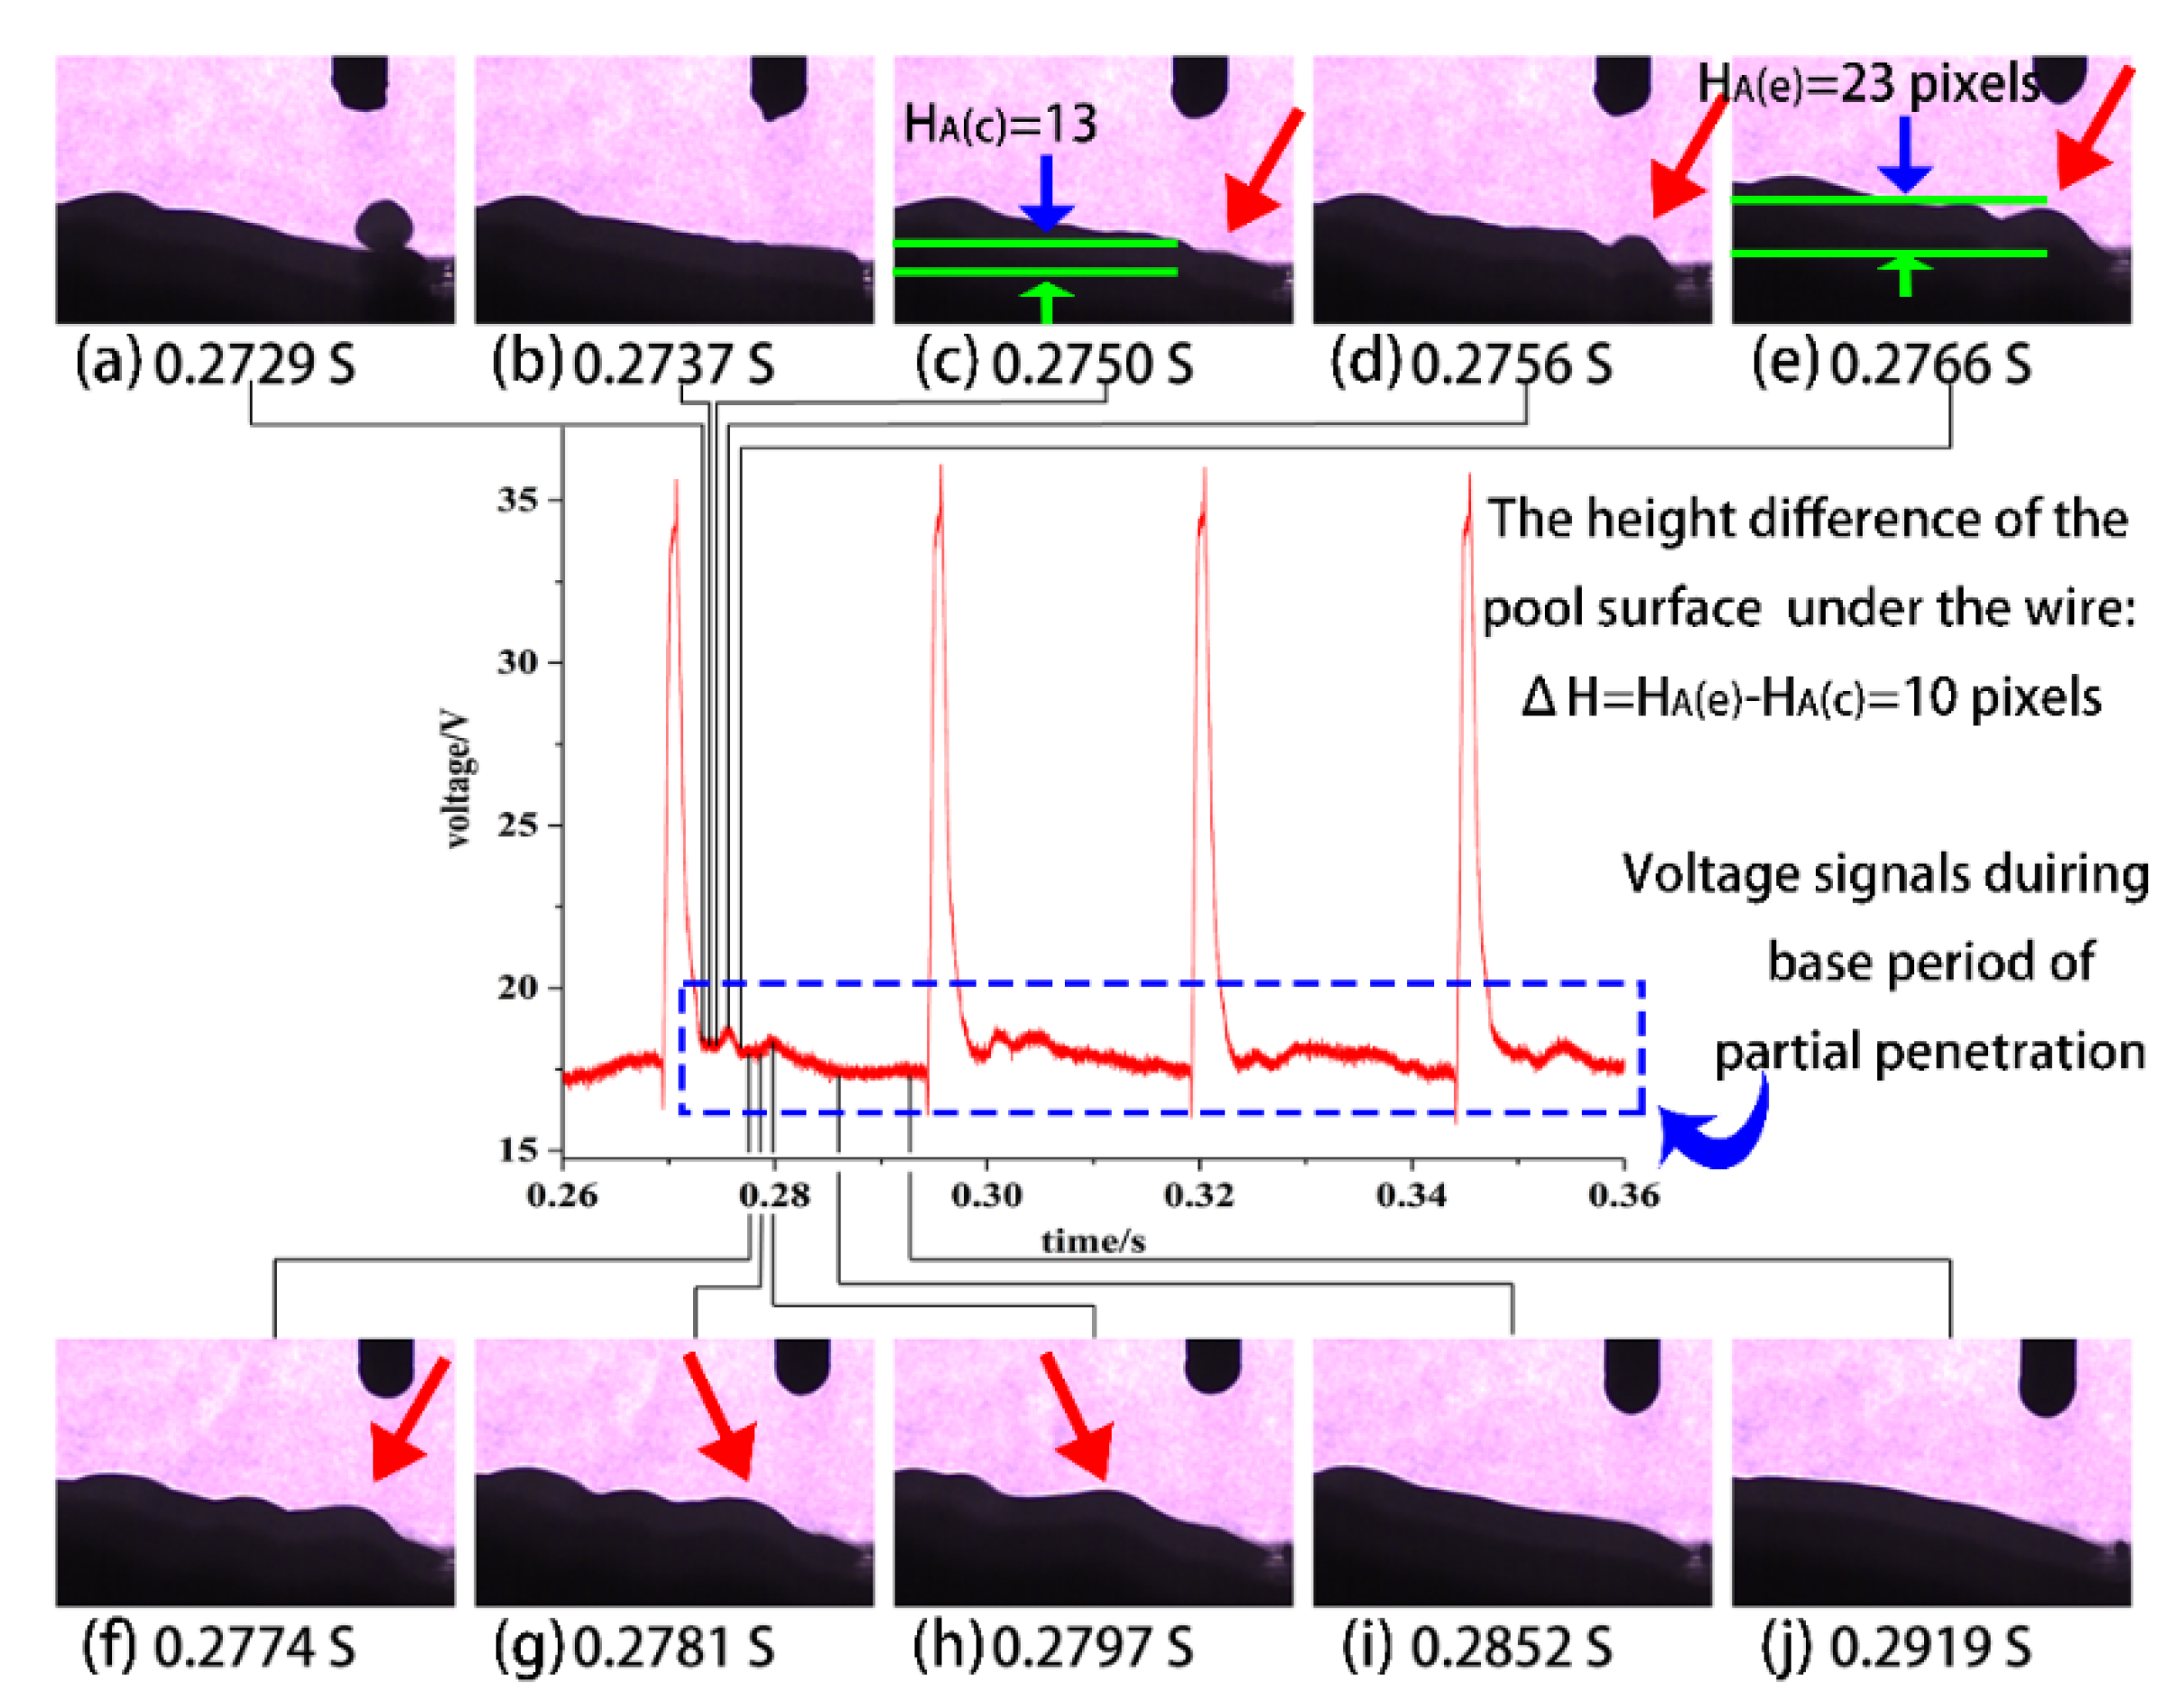
P-GMAW has the advantages of directional metal transfer and no spatter over wide ranges of heat and mass input levels. It uses a low base current to maintain the arc and a high peak current to melt the electrode wire and detach the droplet. The impact force of the droplet was the main factor to trigger the oscillation behavior of the weld pool. Figure 4 and 
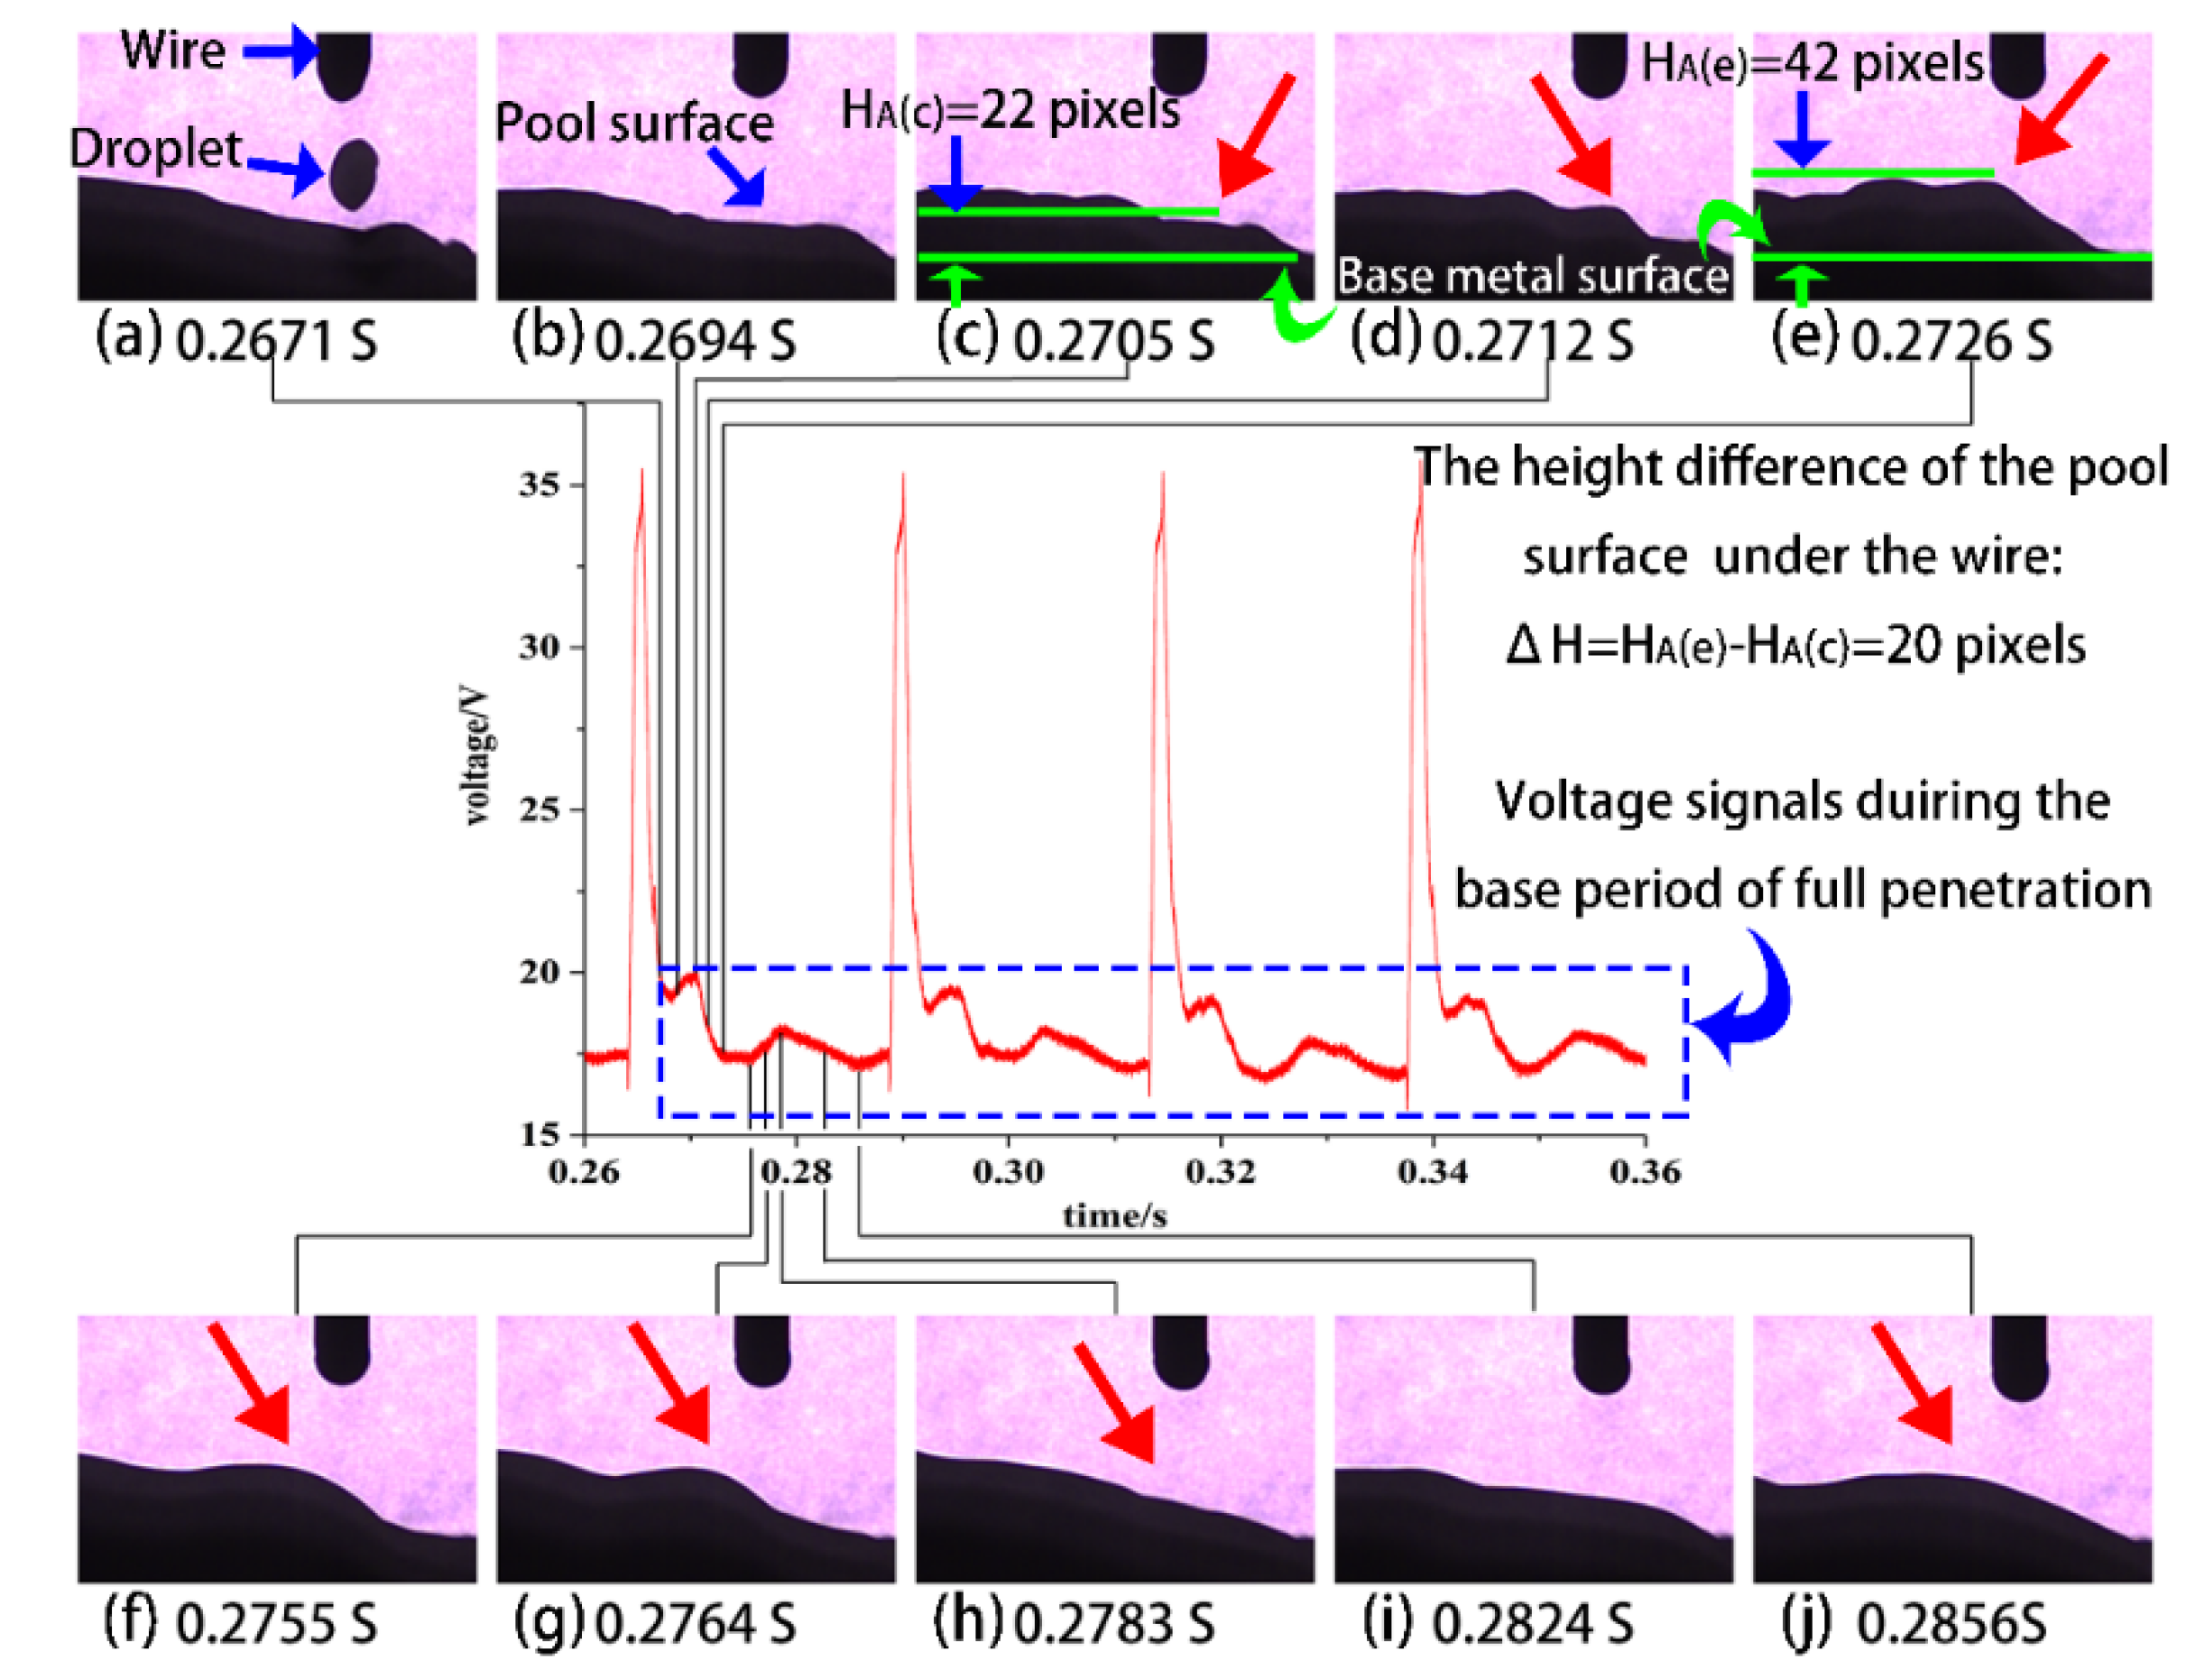
Figure 5 show the dynamic behavior of the weld pool during base current under full and partial penetration.
Figure 4 and Figure 5 show that the weld pool surface below the wire was depressed due to the impact of the droplet, then the surface of the weld pool bounces to form waves. The red arrow of Figure 4 and Figure 5 show the positions of wave peaks on the weld pool surface at different times. Under the same pulse parameters, the impacts of the droplets on the pool were similar [15], while the fully penetrated weld pool and the partly penetrated weld pool have a distinct difference in the oscillation behavior. Compared with the oscillation amplitude of the partial penetrated pool (according to the ΔH = 20 pixels in Figure 4), the oscillation amplitude of the fully penetrated weld pool was larger (according to the ΔH = 10 pixels in Figure 5). The difference in the oscillation behavior of the weld pool leads to the difference in the arc length, which resulted the difference from the voltage signals (as shown from the blue boxes in Figure 4 and Figure 5).
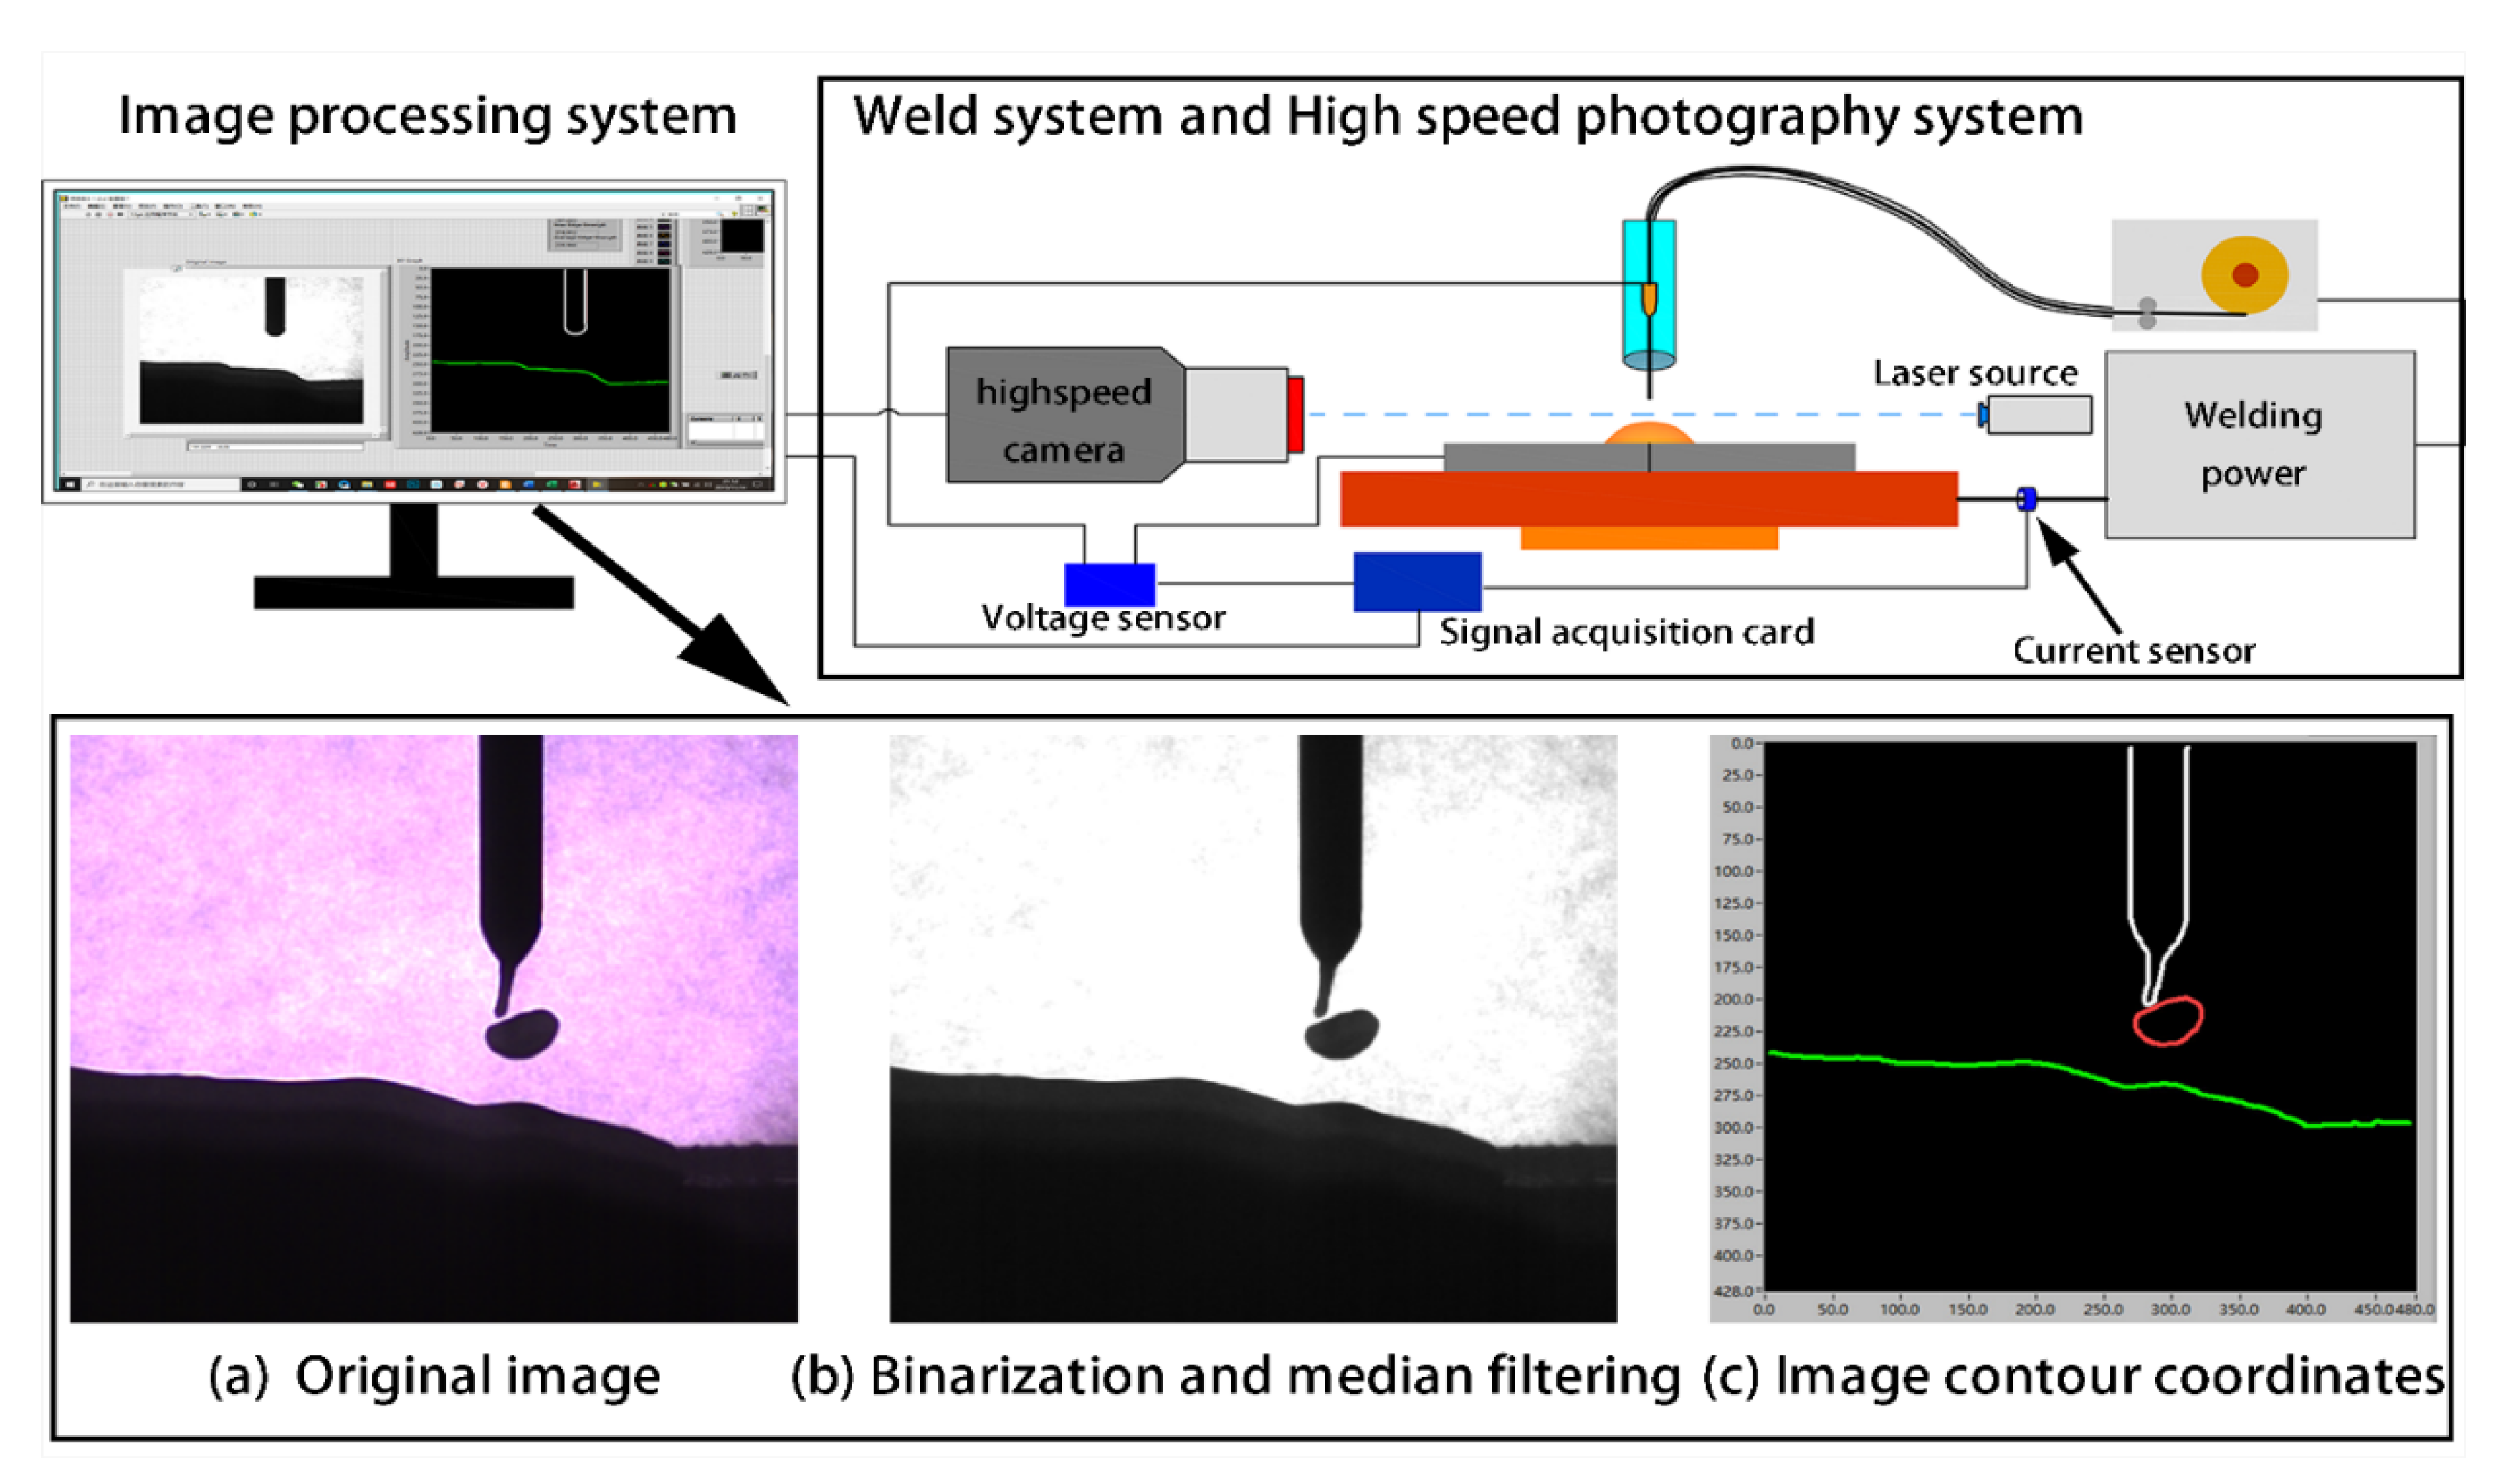
To further study the relationship between penetration status and oscillation behavior of the weld pool, the welding joints with different penetration status were manufactured under different welding travel speeds with the same welding parameters. Analysis of the weld pool dynamics was carried out by measuring the Y-coordinate of the reference point A on the pool surface with time, as described in Section 2.1. The results of the analysis for weld pools with different penetration status are presented in Figure 6a–g respectively.
The start time in Figure 6 is the moment at the droplet entered the pool completely. The test was repeated 3–4 times to verify the repeatability of the weld pool oscillation behavior for each parameter. The weld pool was agitated, and waves were generated due to the impact of the droplets after the droplet impacts the weld pool. In this paper, the first wave peak was called the initial wave peak, the amplitude of each curve was measured in this paper, as shown in Figure 6a. The energy of which was derived from the momentum carried by the droplet. After the liquid surface falls back, the amplitude of the subsequent wave peak was smaller than that of the first wave peak due to the energy loss of the oscillation [11]. The weld pool penetration gradually changed from full penetration to critical penetration with the welding speed increased, and the amplitude of the wave peak decreased gradually while the number of subsequent wave peak increased, as shown in Figure 6a–d. However, only one wave peak occurred on the curves for the partly penetrated weld pools, as shown in Figure 6e–g. In this paper, all weld joints were manufactured under the same parameters, welding speed was the only variable parameters, so the impact force applied to all weld pools were consistent. The geometry and boundary conditions of the weld pool under different penetration status were the main factors causing different motion behaviors. 
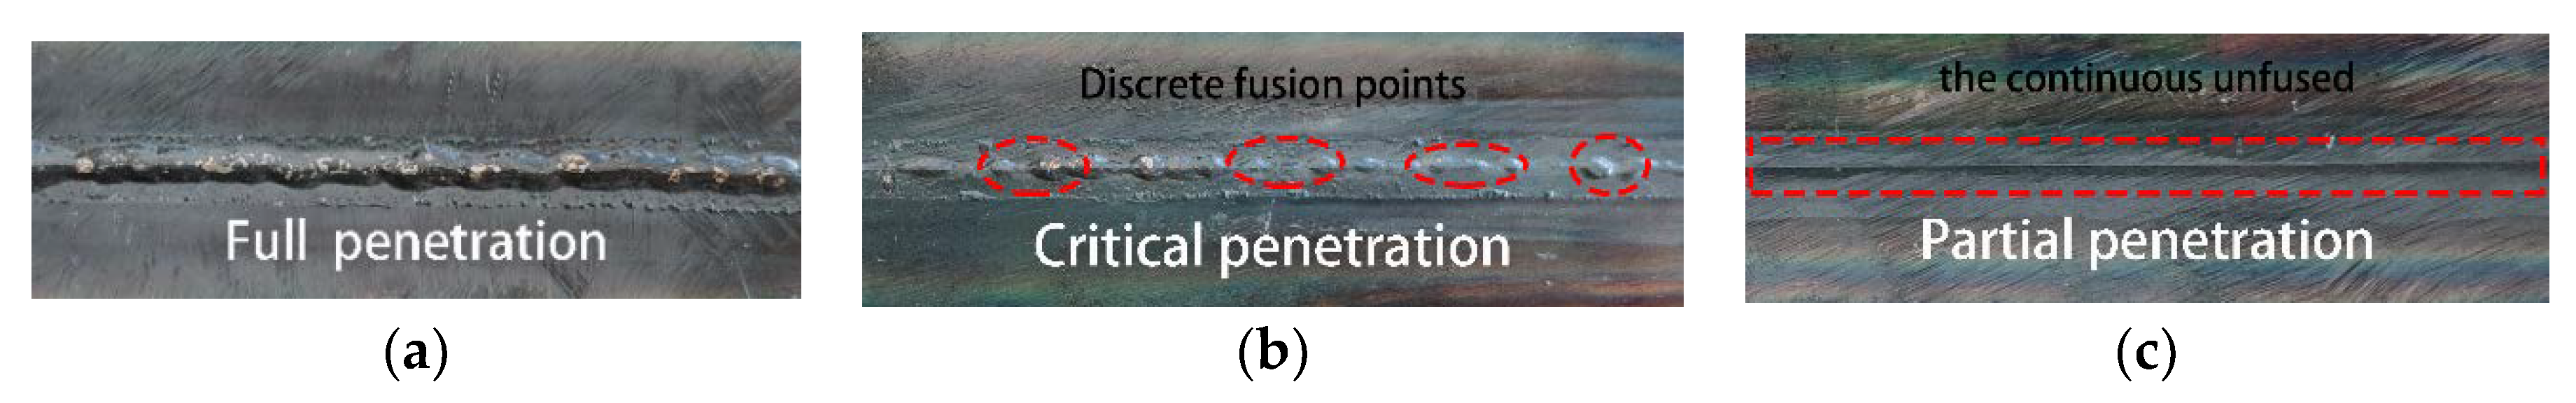
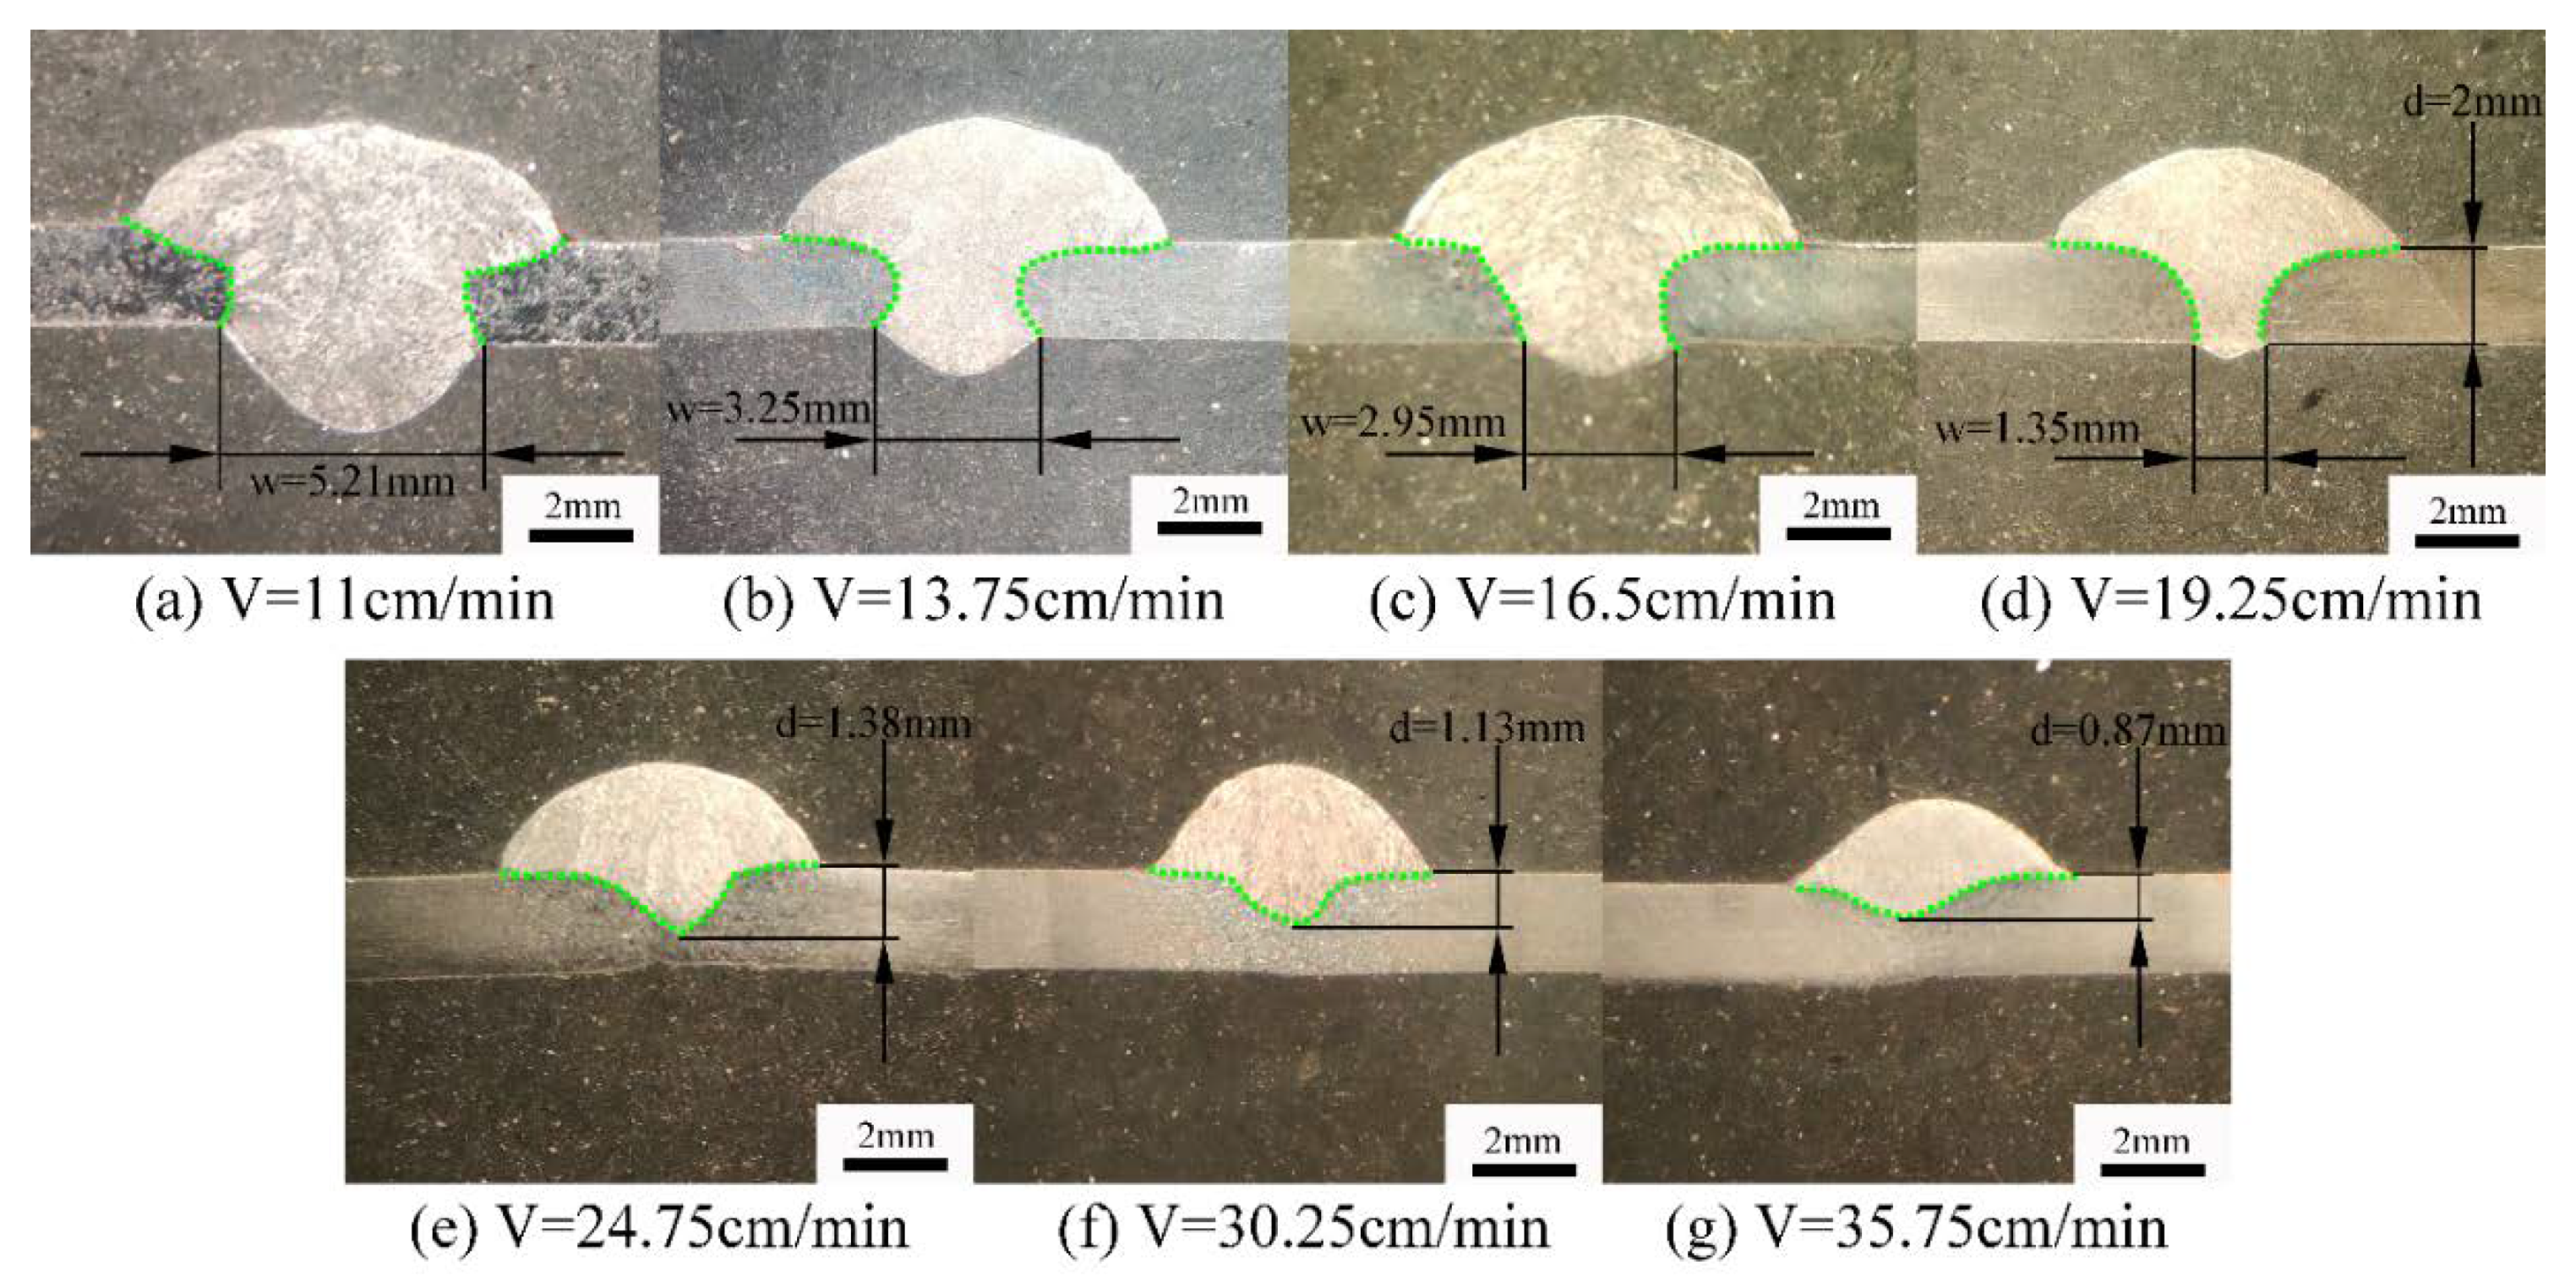
Figure 7 shows the geometry of the weld joints under different penetration status, and the effective throat thickness and the width of the back weld were calibrated according to ISO-17695.
As shown in Figure 7, the cross-sectional area and penetration depth of the weld decreased with the acceleration of the welding speed. As for full penetration status, the effective thickness (d) of the weld was 2 mm, and the width of the back weld (w) decreases with the increase of the welding speed as shown in Figure 7a–c. The effective thickness of the critical penetration was 2 mm, and the width of the back weld (w) was 1.35 mm as shown in Figure 7d. As for partial penetration. Effective weld thickness (d) decreased with the increase of welding speed, as shown in Figure 7e–g. 
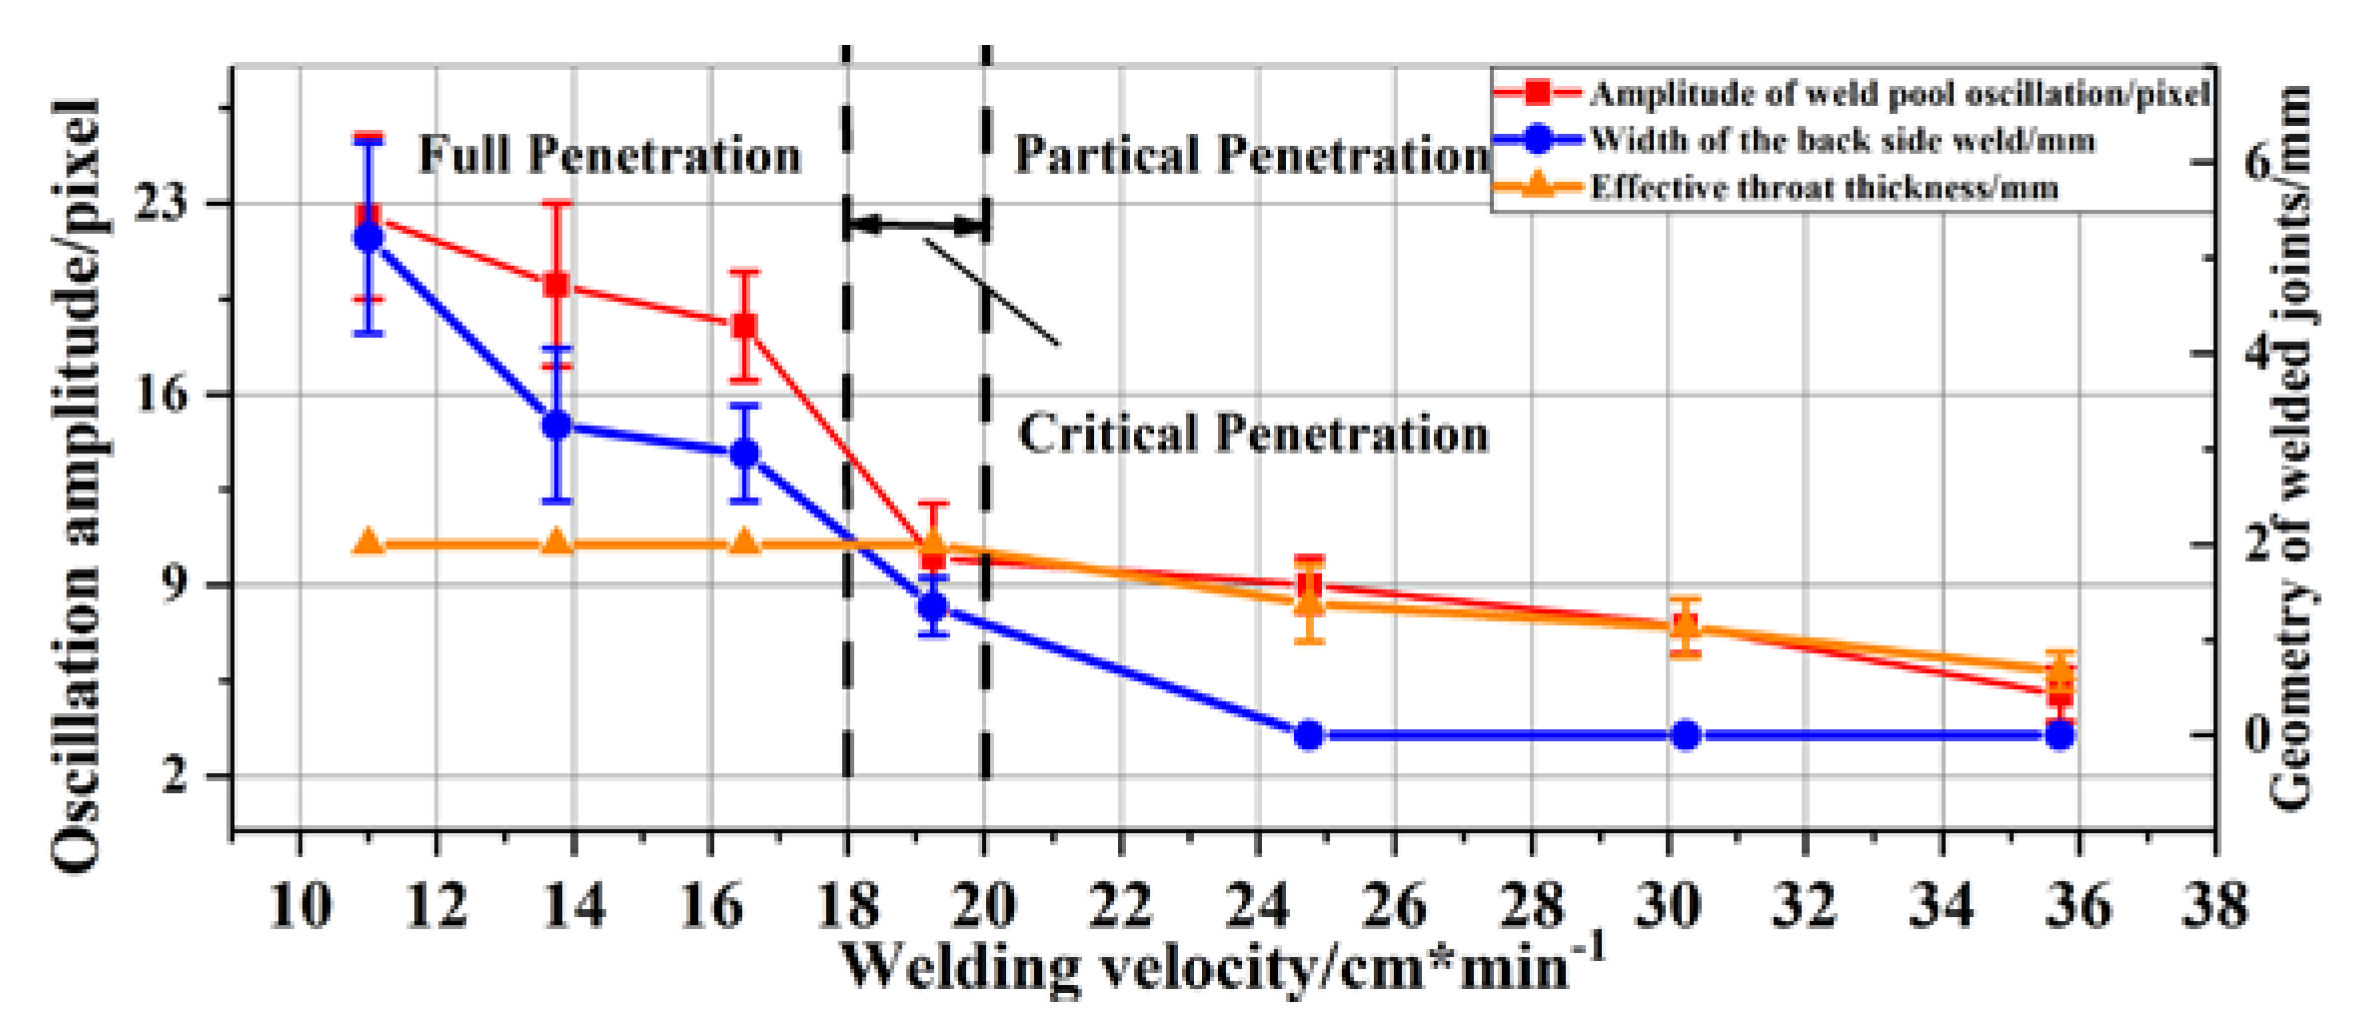
Figure 8 shows the amplitude of the initial oscillation peak and the geometry of the weld joints under different penetration status.
Figure 8 shows the curves of oscillation amplitude and the geometry of weld joints with different welding speeds. The oscillation amplitude decreased with increasing welding speed and an abrupt change occurred in the amplitude of weld pool oscillation with the transition from full to partial penetration status. Different boundary conditions between partly and fully penetrated weld pool led to different oscillation modes and amplitude. 
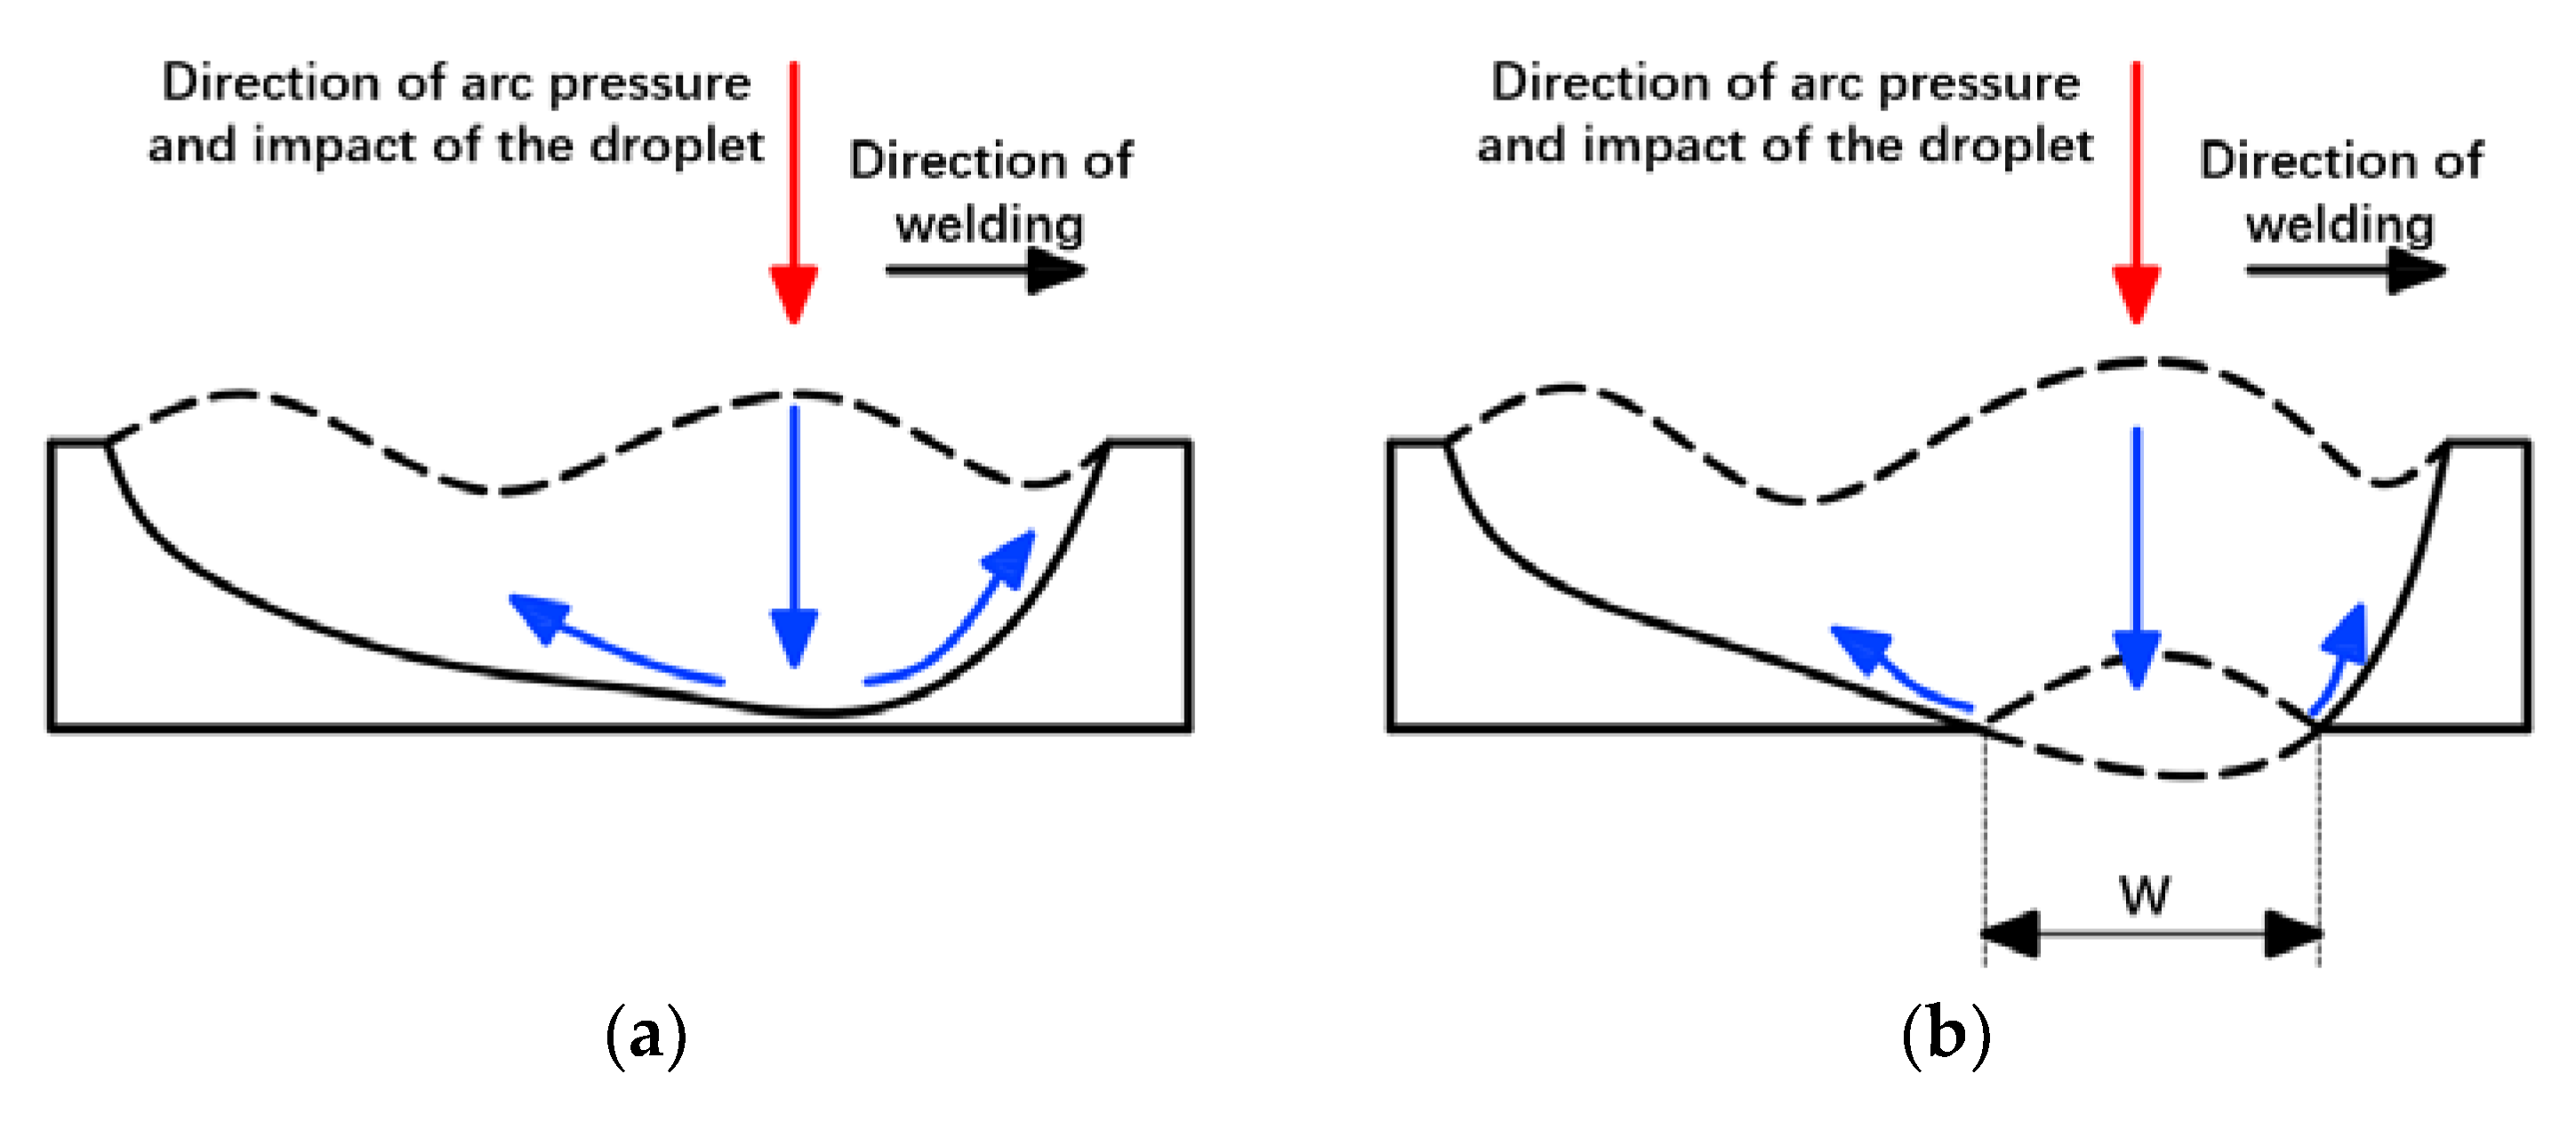
Figure 9 shows the oscillation mode with different penetration status. For partly penetrated weld pool, the bottom of the weld pool was supported by the solid material, which obstructed the downward movement of the molten metal. It led to a greater loss of energy in the process of oscillation, resulting in a lower amplitude. As for critical penetration status, the main part of the pool was supported by the solid metal with relatively small W, leading to the similar oscillation behavior as the partial penetration, as shown in Figure 6d,e. As for full penetration, W was relatively larger. The weld pool was only supported by the surface tension of the molten metal within the range of W. In this case, a new free surface and degree of freedom were generated in the weld pool, which led to a change in the oscillation mode of the weld pool. Zacksenhouse and Hardt established an analytical model based on the theory of stretch membrane and studied the oscillatory behavior of the fully penetrated pool [16]. It was found that the oscillation amplitude of the stationary full penetration pool was more intense than that of the partial and critical penetration due to the lack of solid boundary constraint at the weld pool bottom.
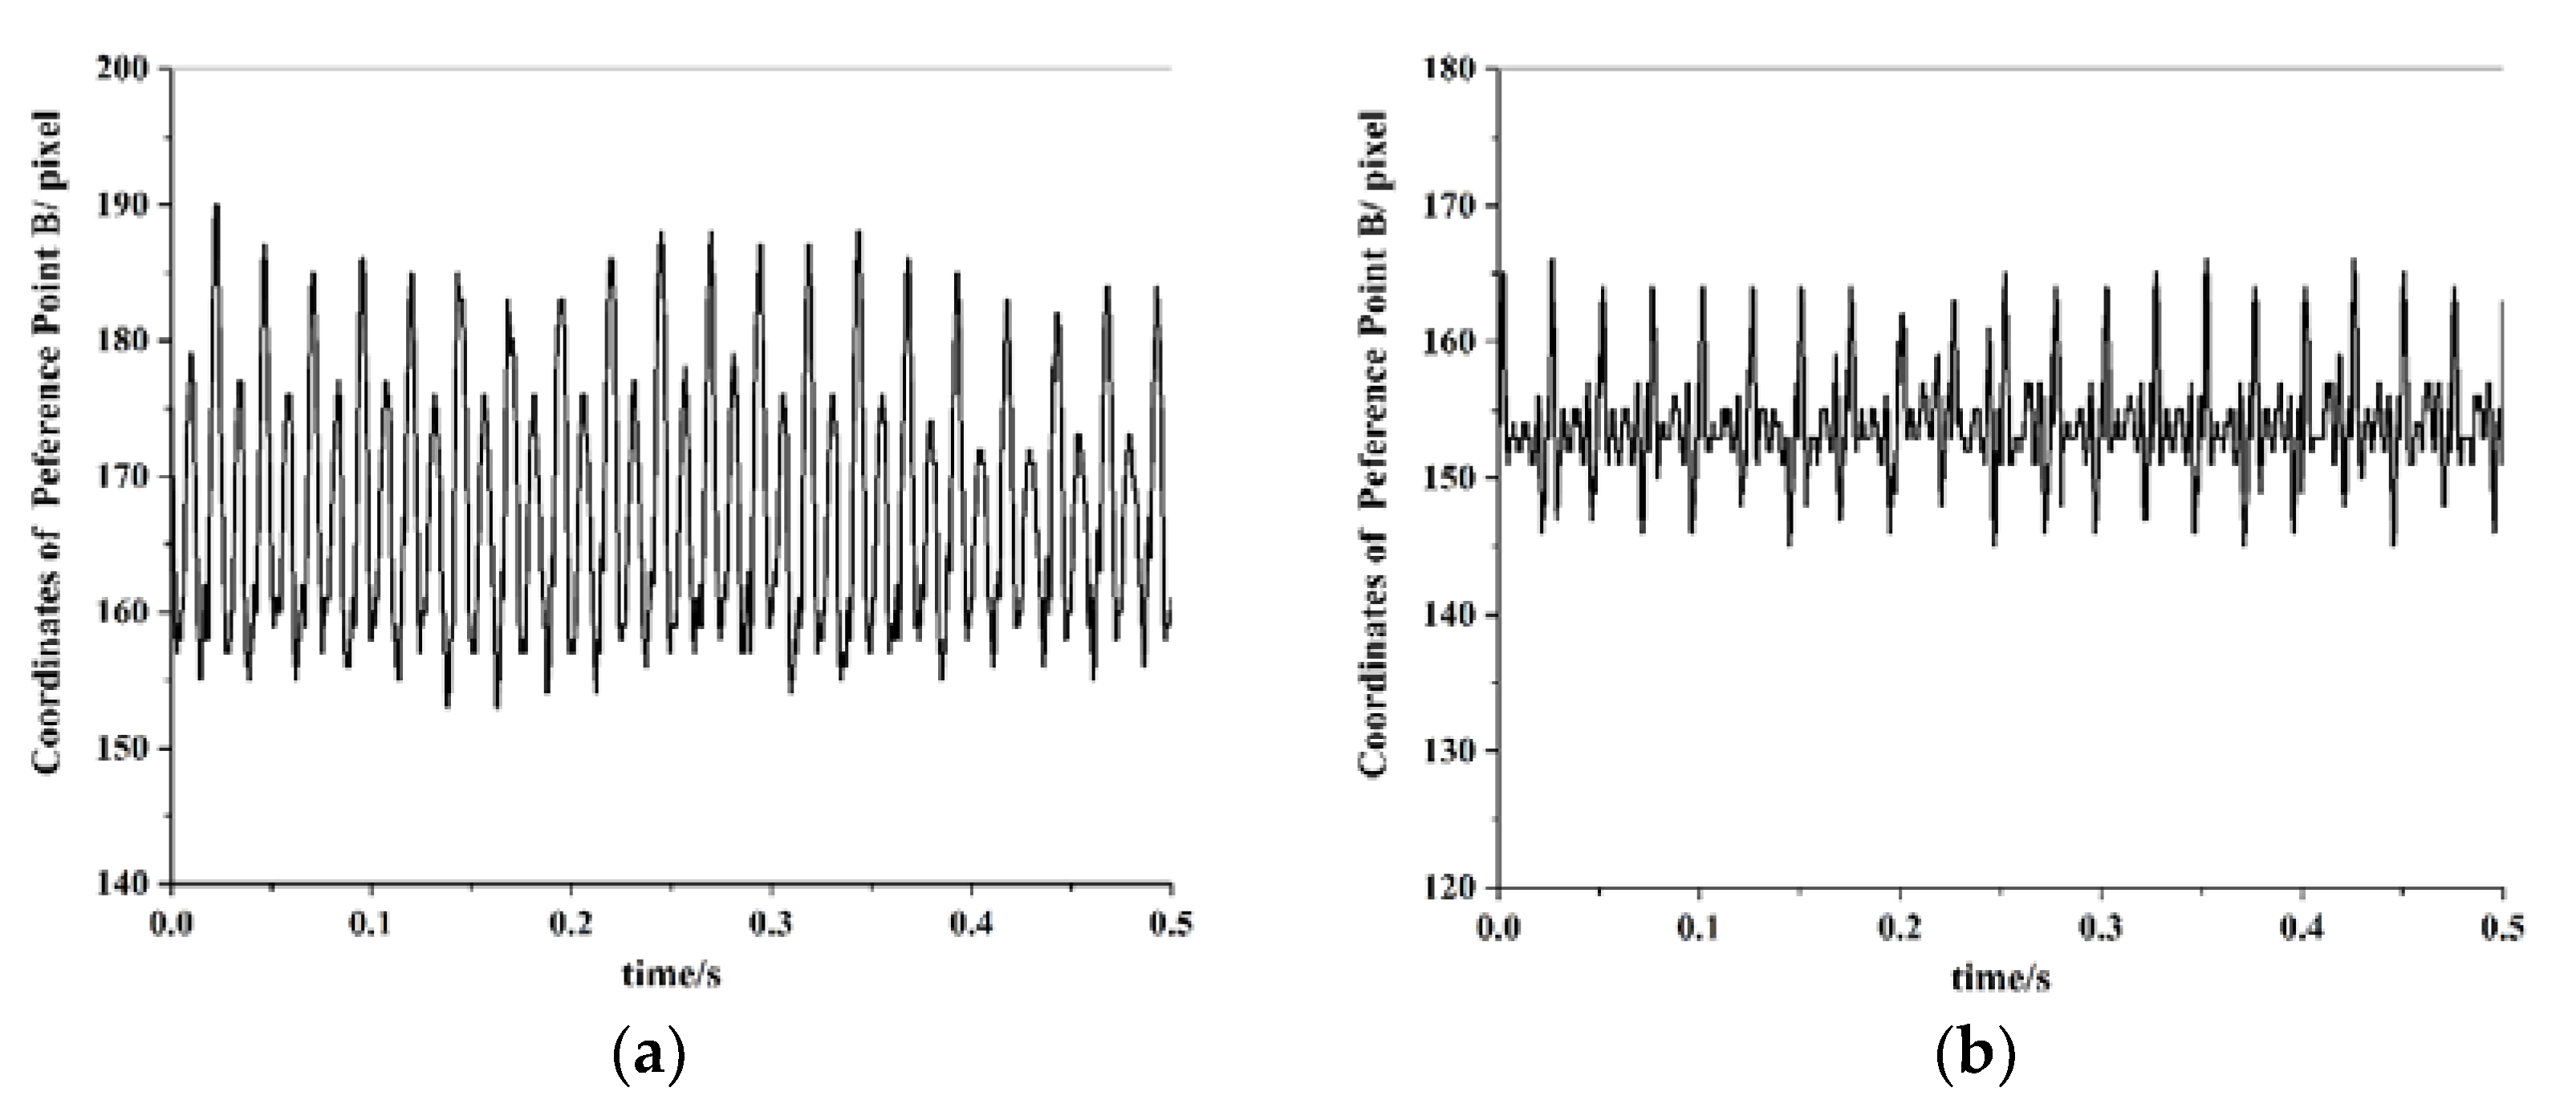
The change of oscillation mode leads to the different oscillation frequency characteristics of the weld pool. The location information of reference point A cannot be continuously extracted because the droplet impinged on the weld pool there. In this experiment, the measured height of reference point B (HB) for partial and full penetration status are plotted as a function of time in Figure 10.
The oscillation signal of the weld pool was a nonlinear time-varying signal. The Continuous Wavelet Transform (CWT) can analyze time-varying signals in the time domain and frequency domain simultaneously. In this paper, Morlet wavelet was used as the square-integrable function of CWT, also known as the wavelet basis function, as shown in Equation (1):
ψ a , b ( t ) = a e x p ( i 2 π f a ( t b ) a ) e x p ( ( t b ) 2 2 a 2 )
In Equation (1), a is the scale vector; b is the translation parameter; f a is the center frequency of the wavelet; The center frequency of the wavelet used in this paper is 0.796. The square of the number modulus of the signal wavelet transform system ( ψ a , b ( t ) ) reflects the energy density distribution of the signal in the timescale plane. The energy of the signal is mainly concentrated around the wavelet ridge curve in the timescale plane, which can determine the instantaneous frequency of the signal. As for the Morlet continuous wavelet transform, the scale vector a at the wavelet ridge has a relationship with the signal frequency and sampling frequency [17], as shown in Equation (2):
f = f a f s / a
In Equation (2), f s is the sampling frequency of the signal: 10,000 Hz. 
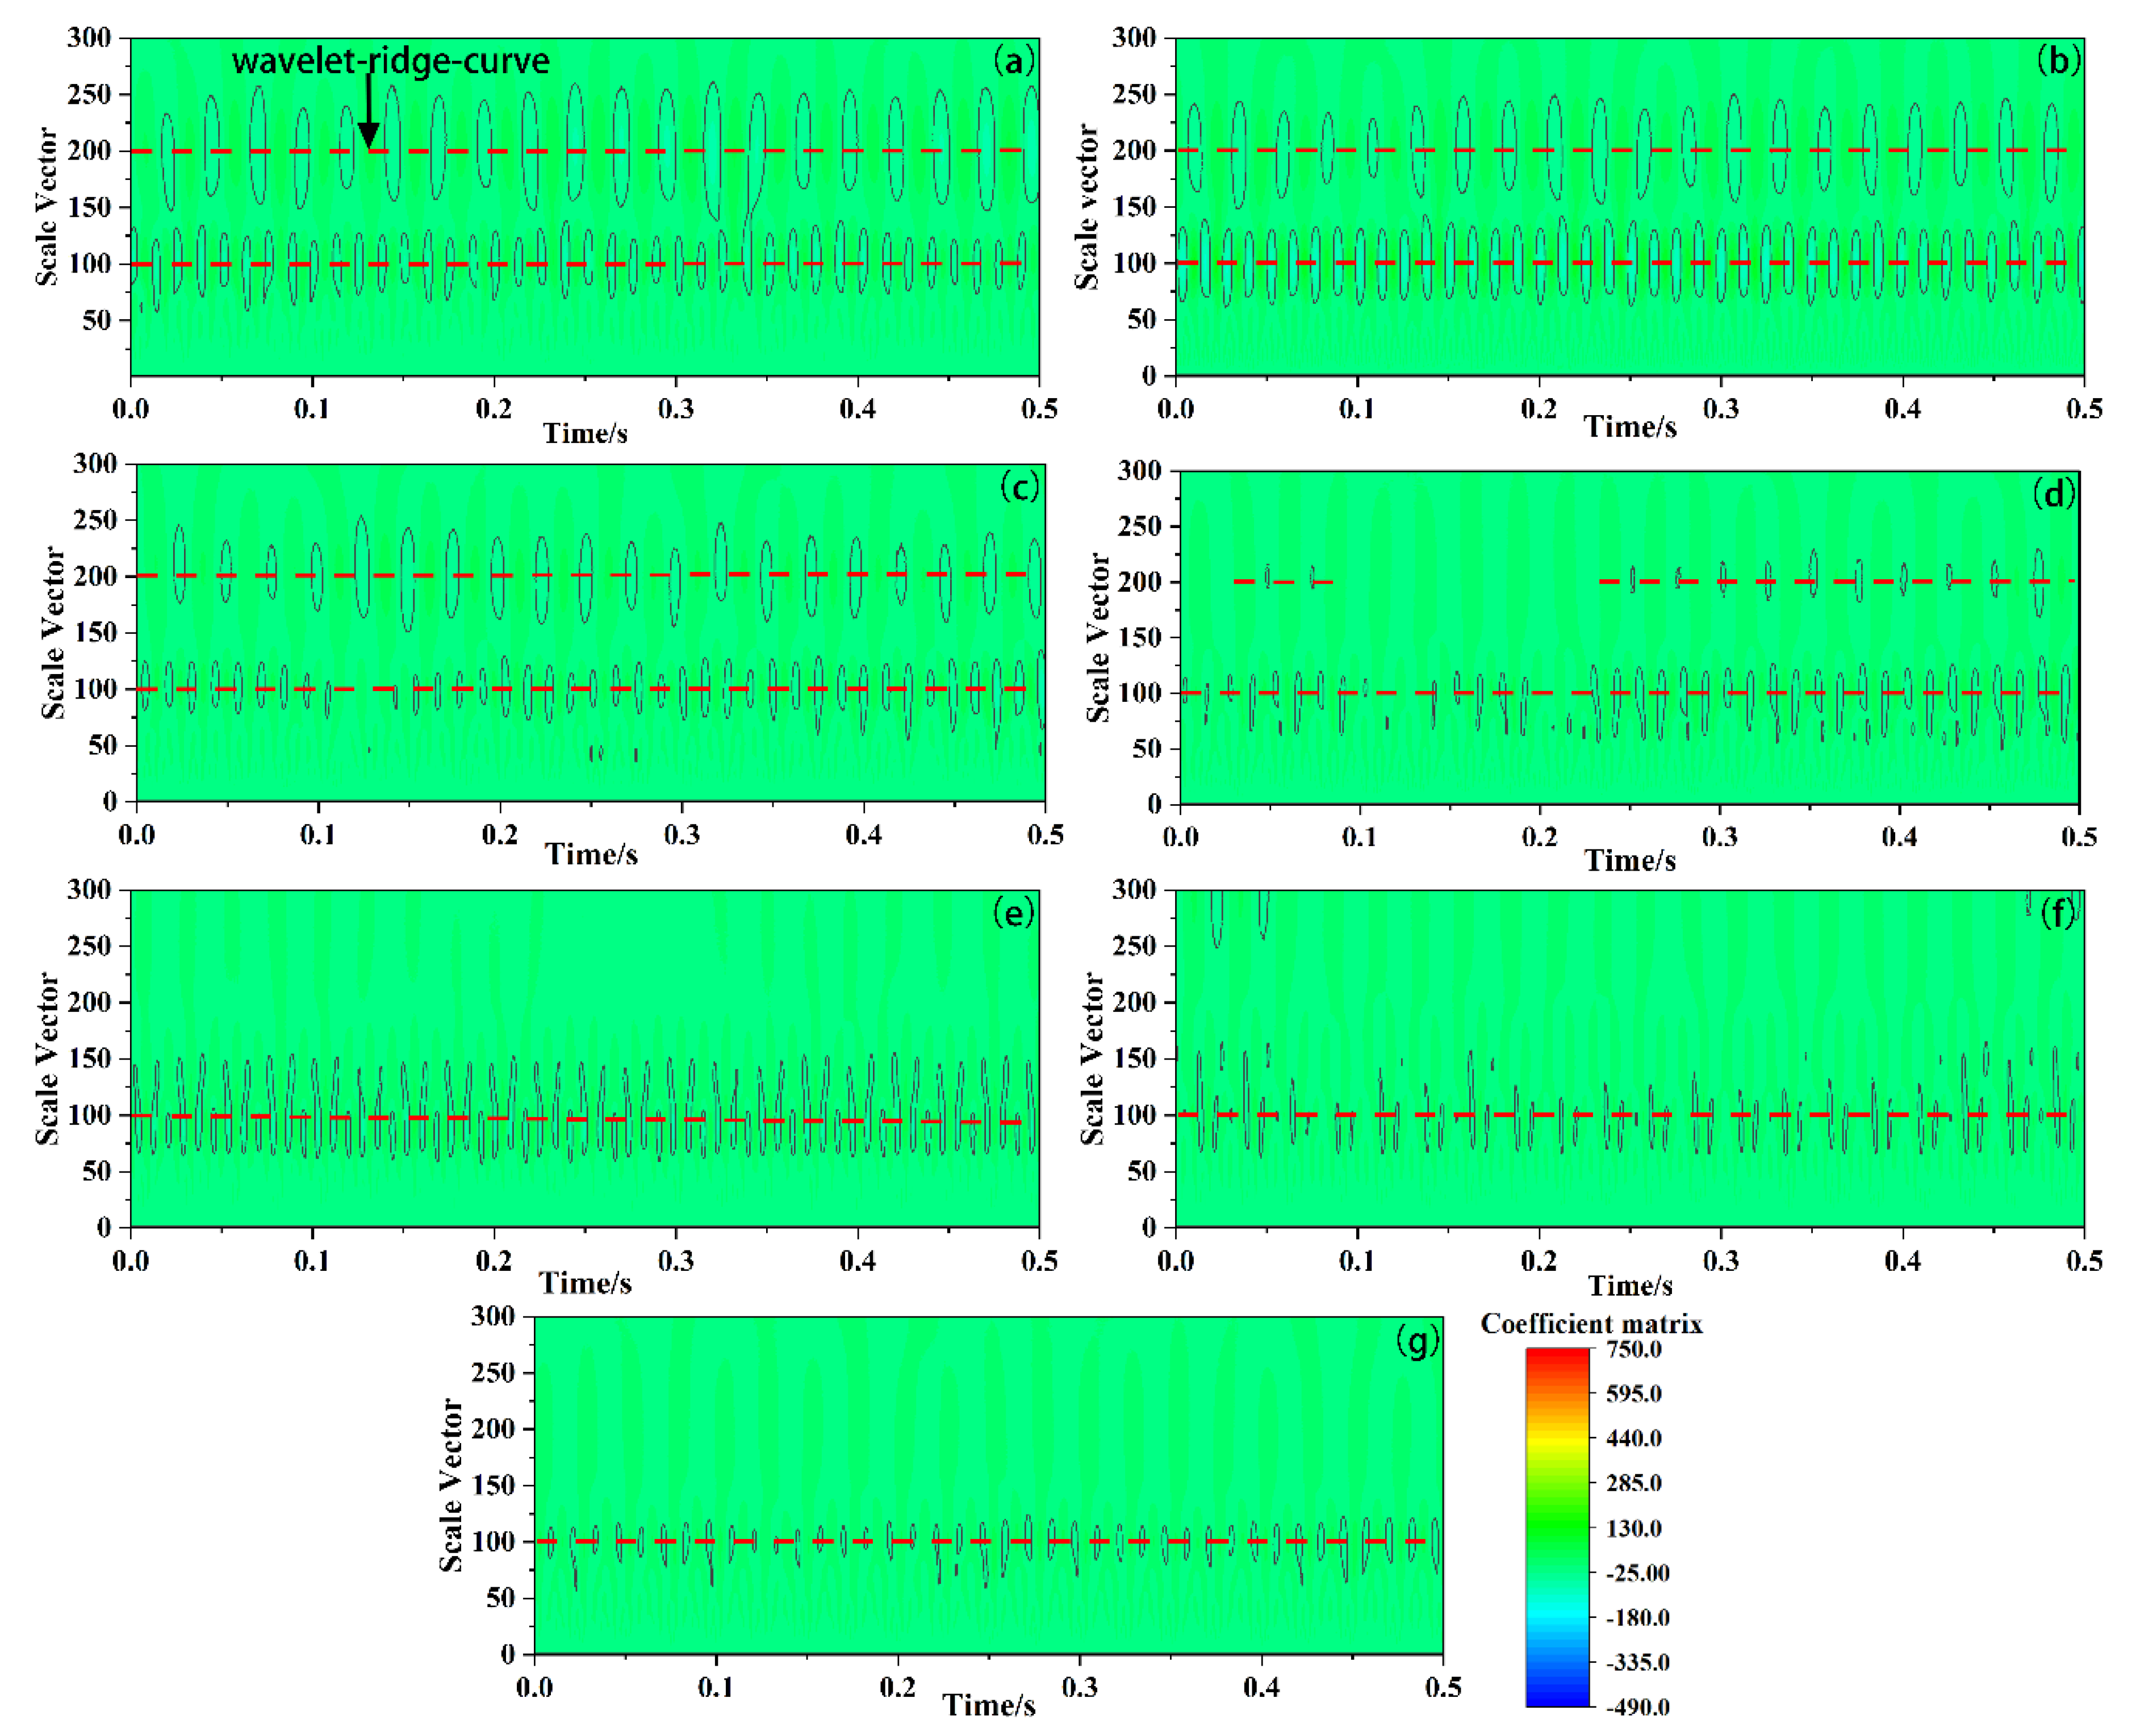
Figure 11 is the contour diagram of continuous wavelet transform coefficient of P-GMAW weld pool oscillation signal with different penetration status.
As shown in Figure 11a–c, there were two continuous wavelet ridges in the contour diagram of the transform coefficient of oscillation of the full penetration pool. The scale vectors were 200 and 100, respectively, and with the Equation (2), the corresponding oscillation frequencies of the weld pool were 40 Hz and 80 Hz, respectively. As indicated by paper [18]. The pool was a dynamic system excited by periodic signals under the impact of a fixed frequency, oscillating at the same or integer multiple of the pulse frequency (40 Hz). There were also two wavelet ridges with the same scale vector in the wavelets of the oscillating signals in the weld pool, but the wavelet ridge with the scale vector of 200 was inconsecutive as shown in Figure 11d. As for partial penetration, only one wavelet ridge curve with the scale vector of 100 occurred in the contour diagram of transform coefficient, as shown in Figure 11e–g, and the corresponding oscillation of the partly penetrated weld pool was 80 Hz. The corresponding wavelet skeleton at the wavelet ridge curves was the composition of the weld pool oscillation signal at this frequency [17]. 
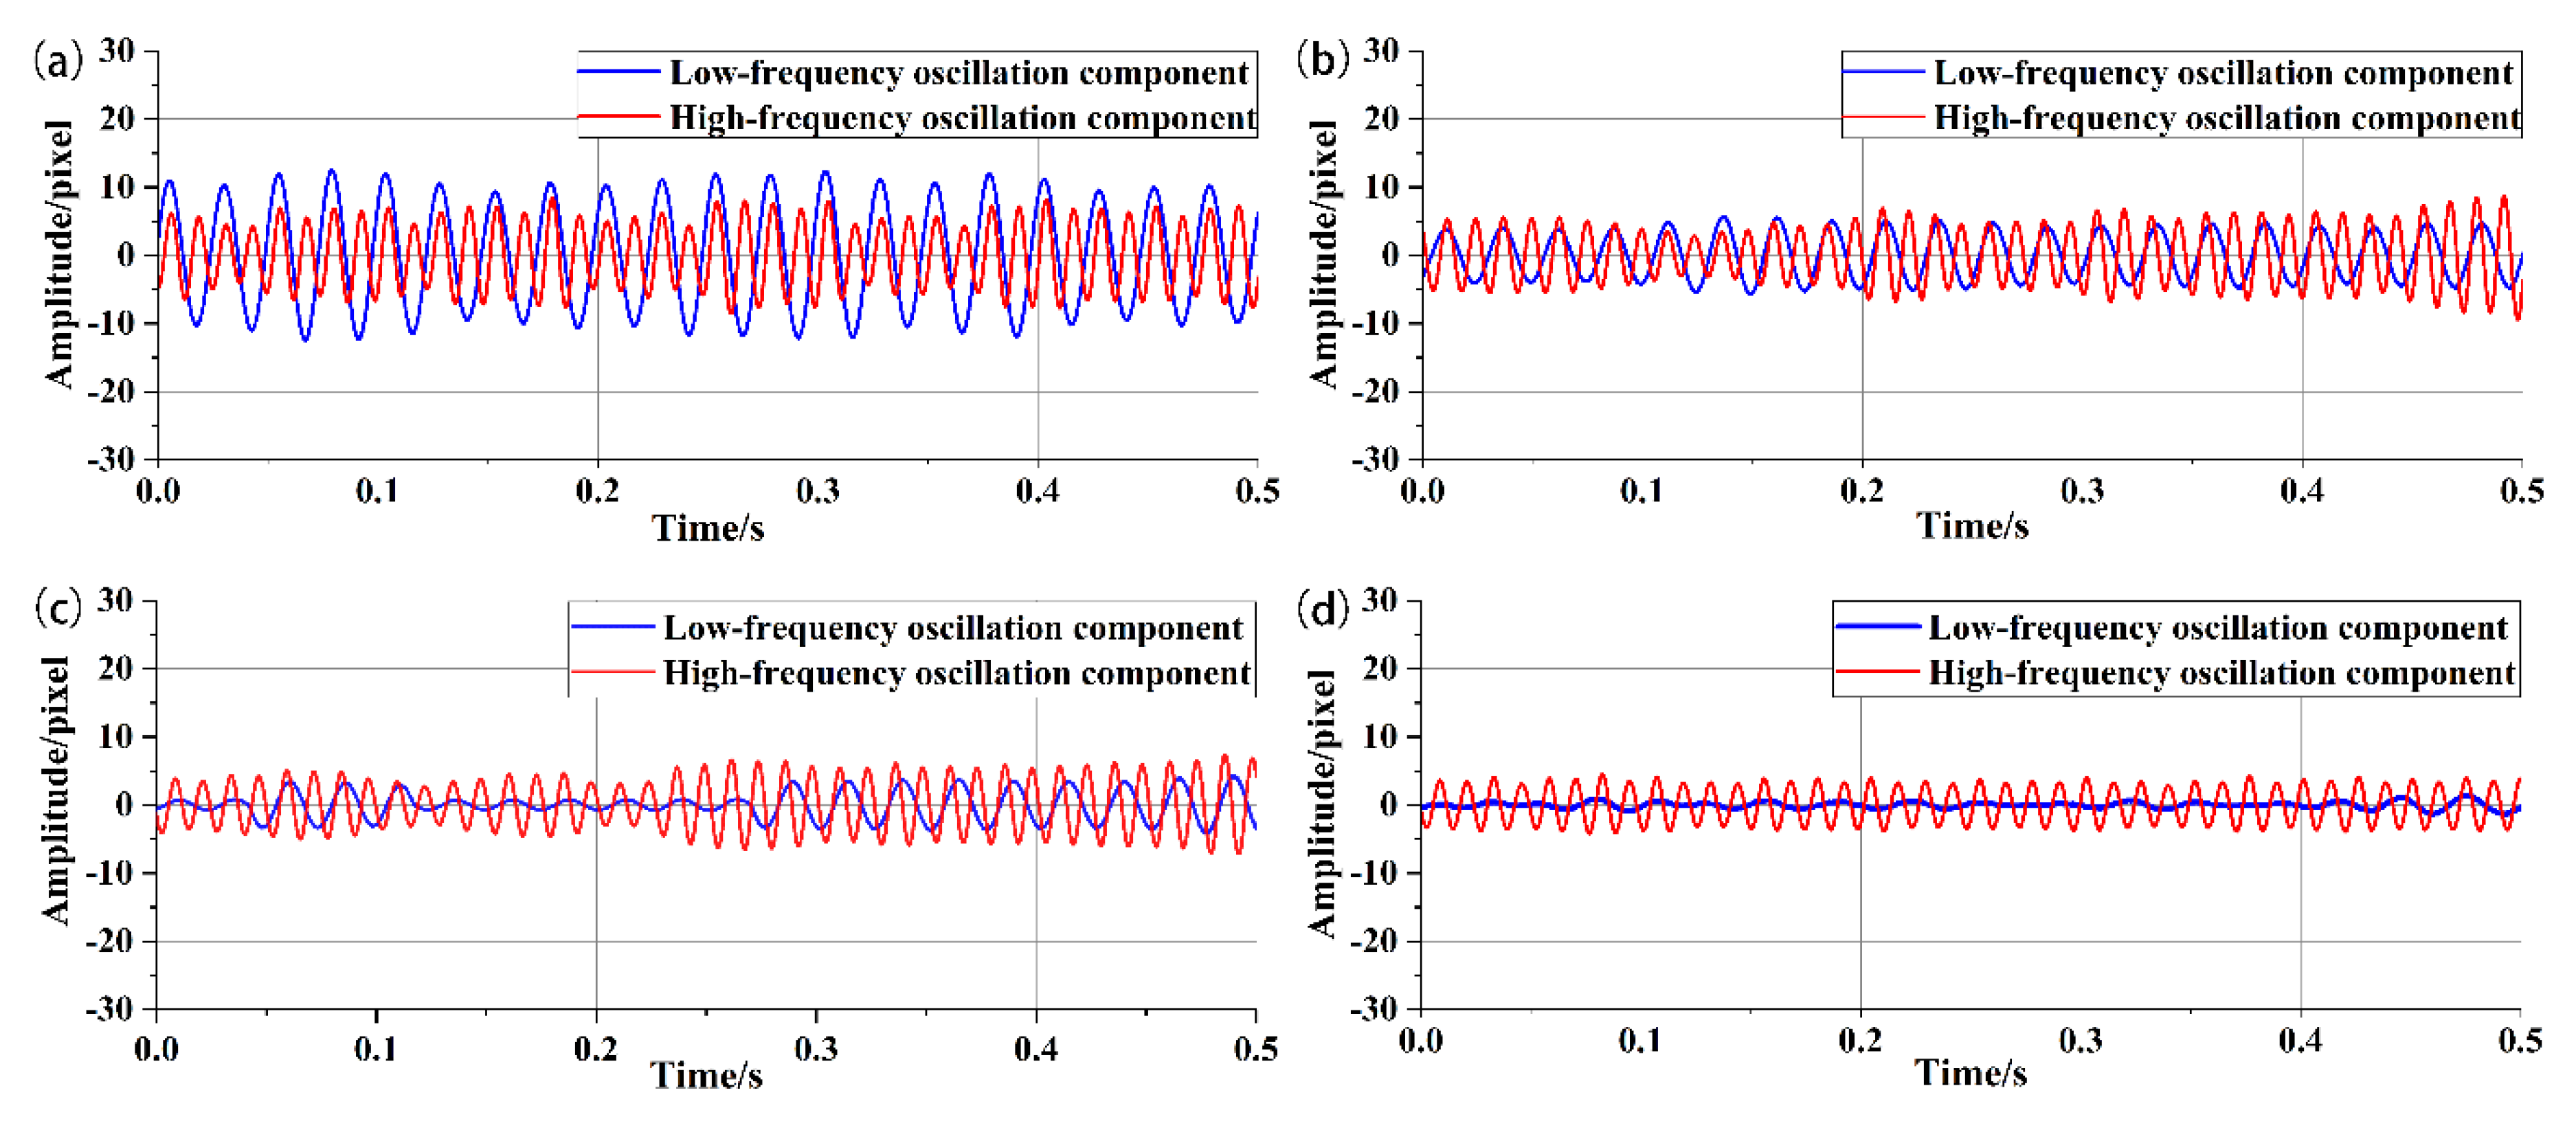
Figure 12 shows the composition of the weld pool oscillation signal at 40 Hz and 80 Hz with different penetration status.
As shown in Figure 12, the amplitude of the component curve of the weld pool oscillation signal at 40 Hz and 80 Hz gradually decreased with the weld pool translated from full to partial penetration. The curves at 40 Hz fluctuated only in full and critical penetration. The oscillating signals of the full penetrated weld pool appeared low-frequency components (40 Hz) with large amplitude due to the lack of solid boundary constraint at the weld pool bottom, while the oscillating signals of the partly penetrated weld pools were only composed of high-frequency signals (80 Hz). As for critical penetration, the high-frequency component of the oscillation signal persisted, while the high-frequency component was not stable due to the variational boundary conditions.
These results suggest that different penetration status significantly affected the oscillation motion of the weld pool under the same impact. However, it was impossible to use the high-speed camera to extract the oscillation characteristic of the weld pool in practical production. The weld pool oscillation could change the arc length, thus affecting the voltage signal during the base time. Therefore, it was necessary to study the relationship between the voltage signal and the behavior of the weld pool during the base time.

3.2. The Link between the Voltage Signal and the Weld Pool Behavior

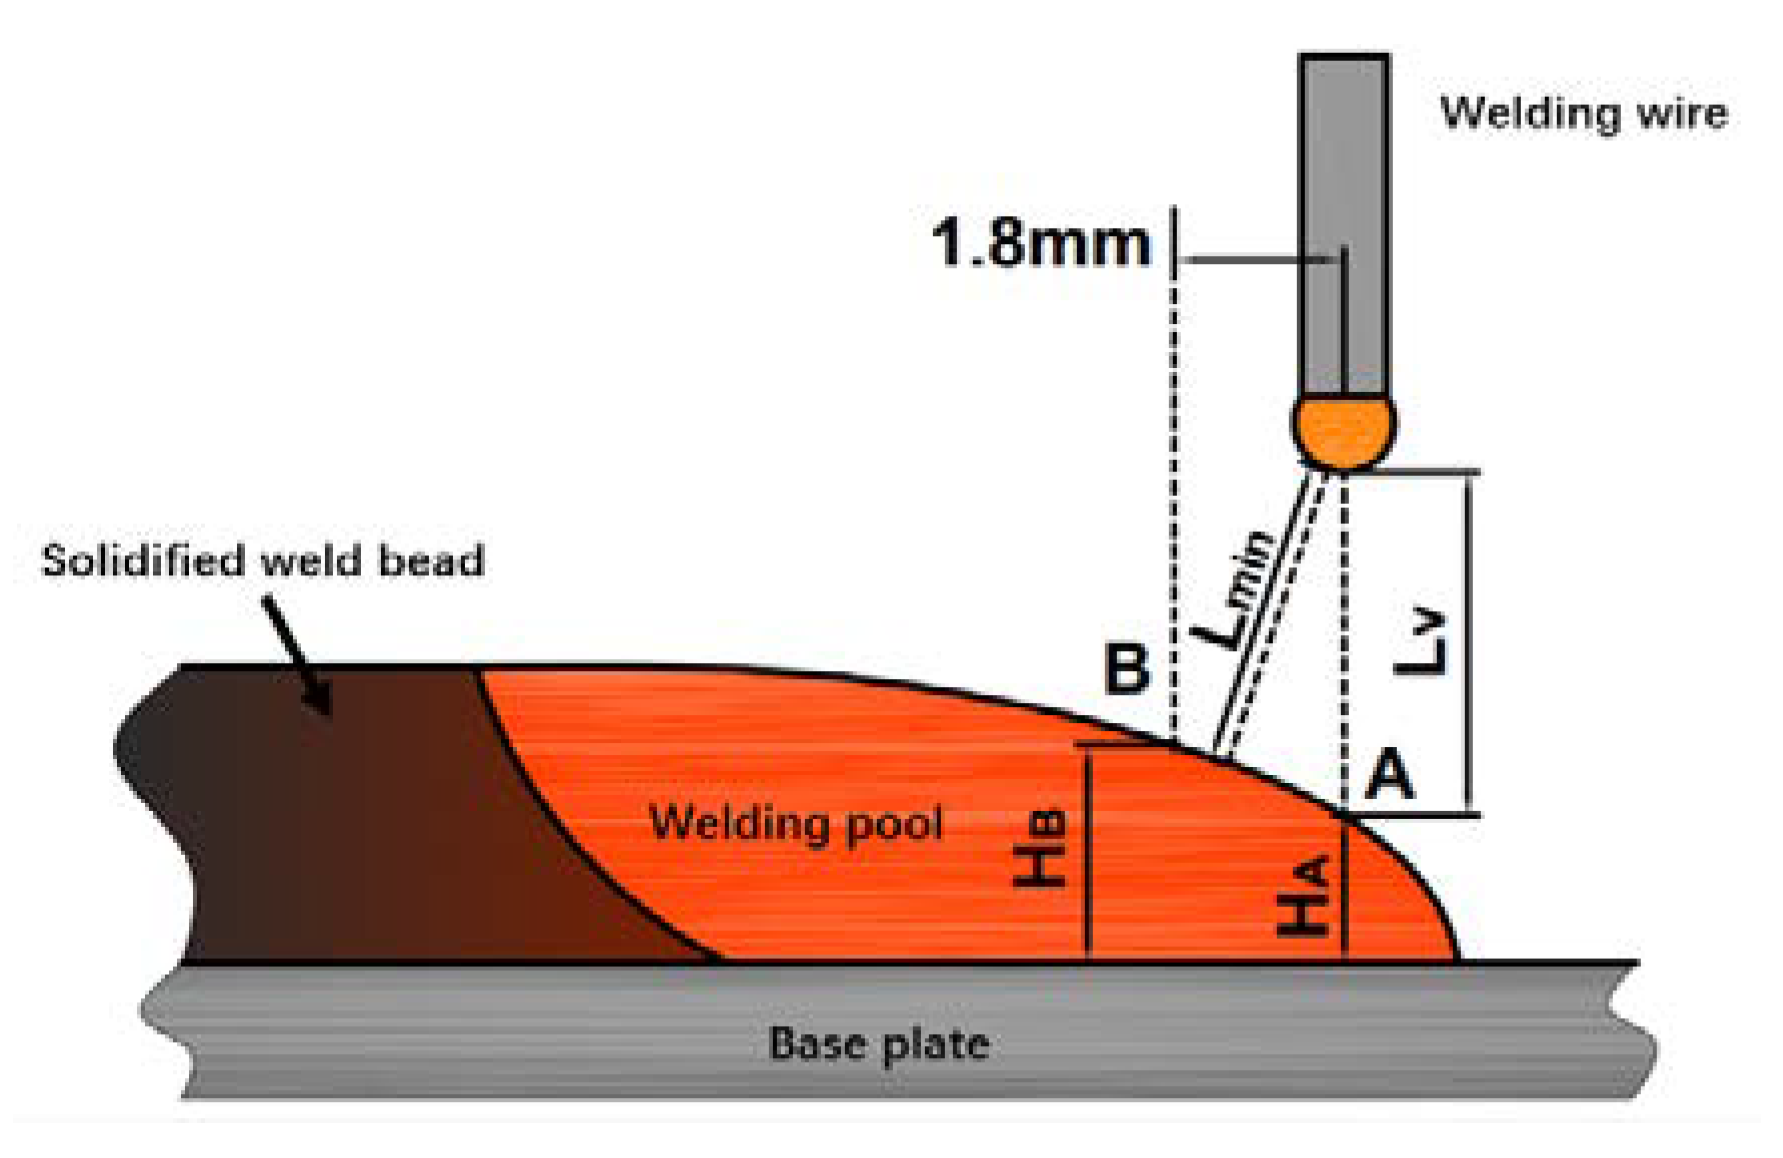
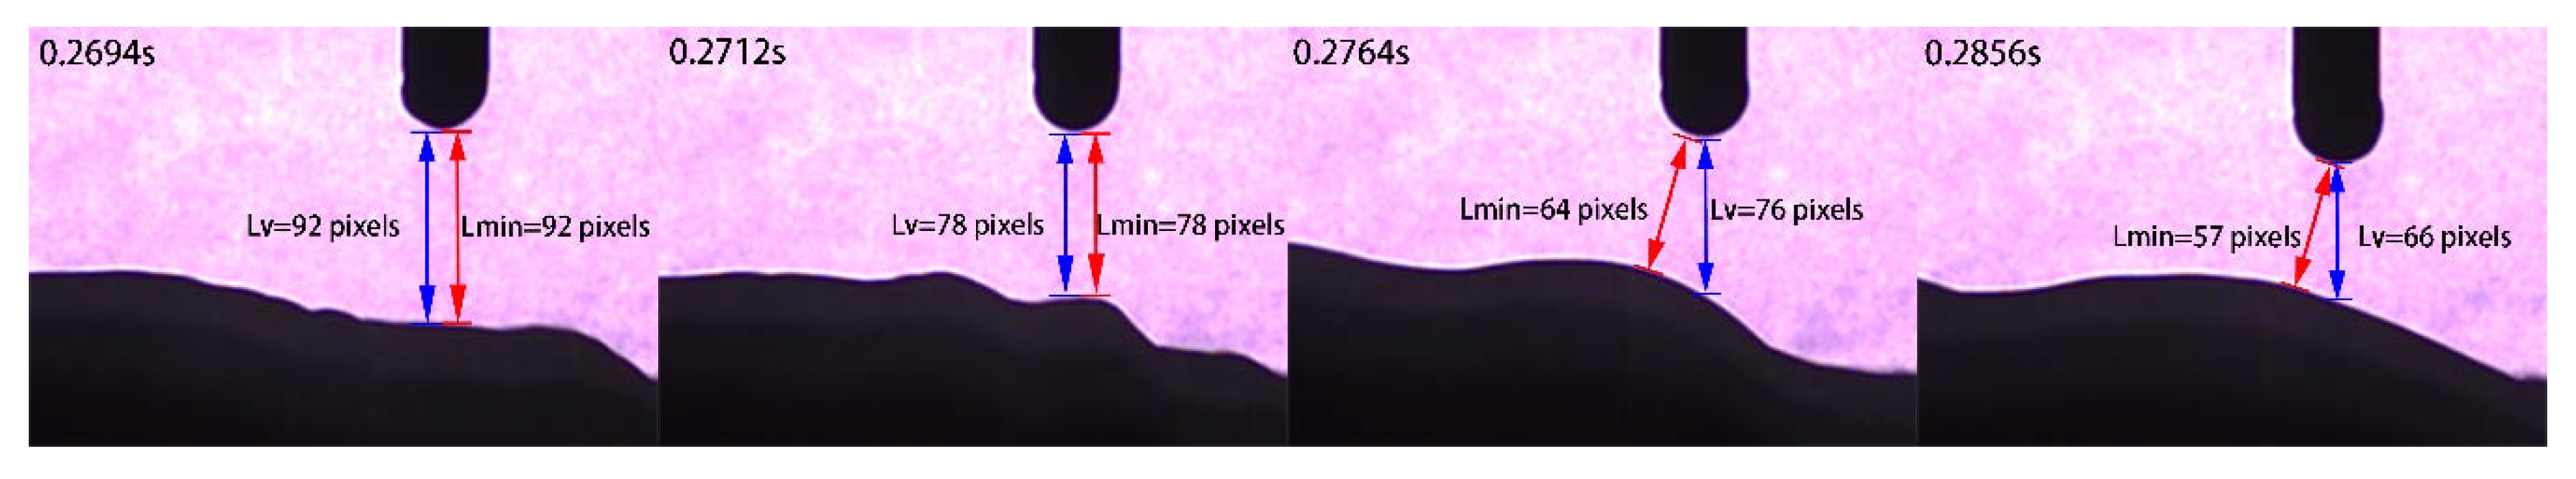
High-speed photographic images showed that the weld pool oscillation changed the relative position between the tip of the welding wire and the surface of the weld pool. It affected the arc length and caused the voltage signal fluctuation during the base time, as shown in Figure 13. The shortest distance (LV) and vertical distance (Lmin) between the droplet and the pool during the base time were measured by image processing algorithm (as shown in Section 2.1), and the relationship between the pool behavior and the voltage was analyzed.
As shown in Figure 13, two main factors affected the relative position between the wire tip and the pool surface: (1) wire extension variation; (2) changes in height and curvature of weld pool surface. During the base time, the wire feeding speed was constant, while the wire could not melt, and the length of stick-out wire increased. The increased length of stick-out wire could lead to the arc length compression and the voltage drop over the wire increase, but the conclusion given in papers [13,19] shows that the change in the voltage drop over the wire extension during the base current time did little contribution to the voltage signal. It is commonly accepted that the arc voltage is proportional to the arc length. Each of the above exceptions could lead to arc voltage variation. 
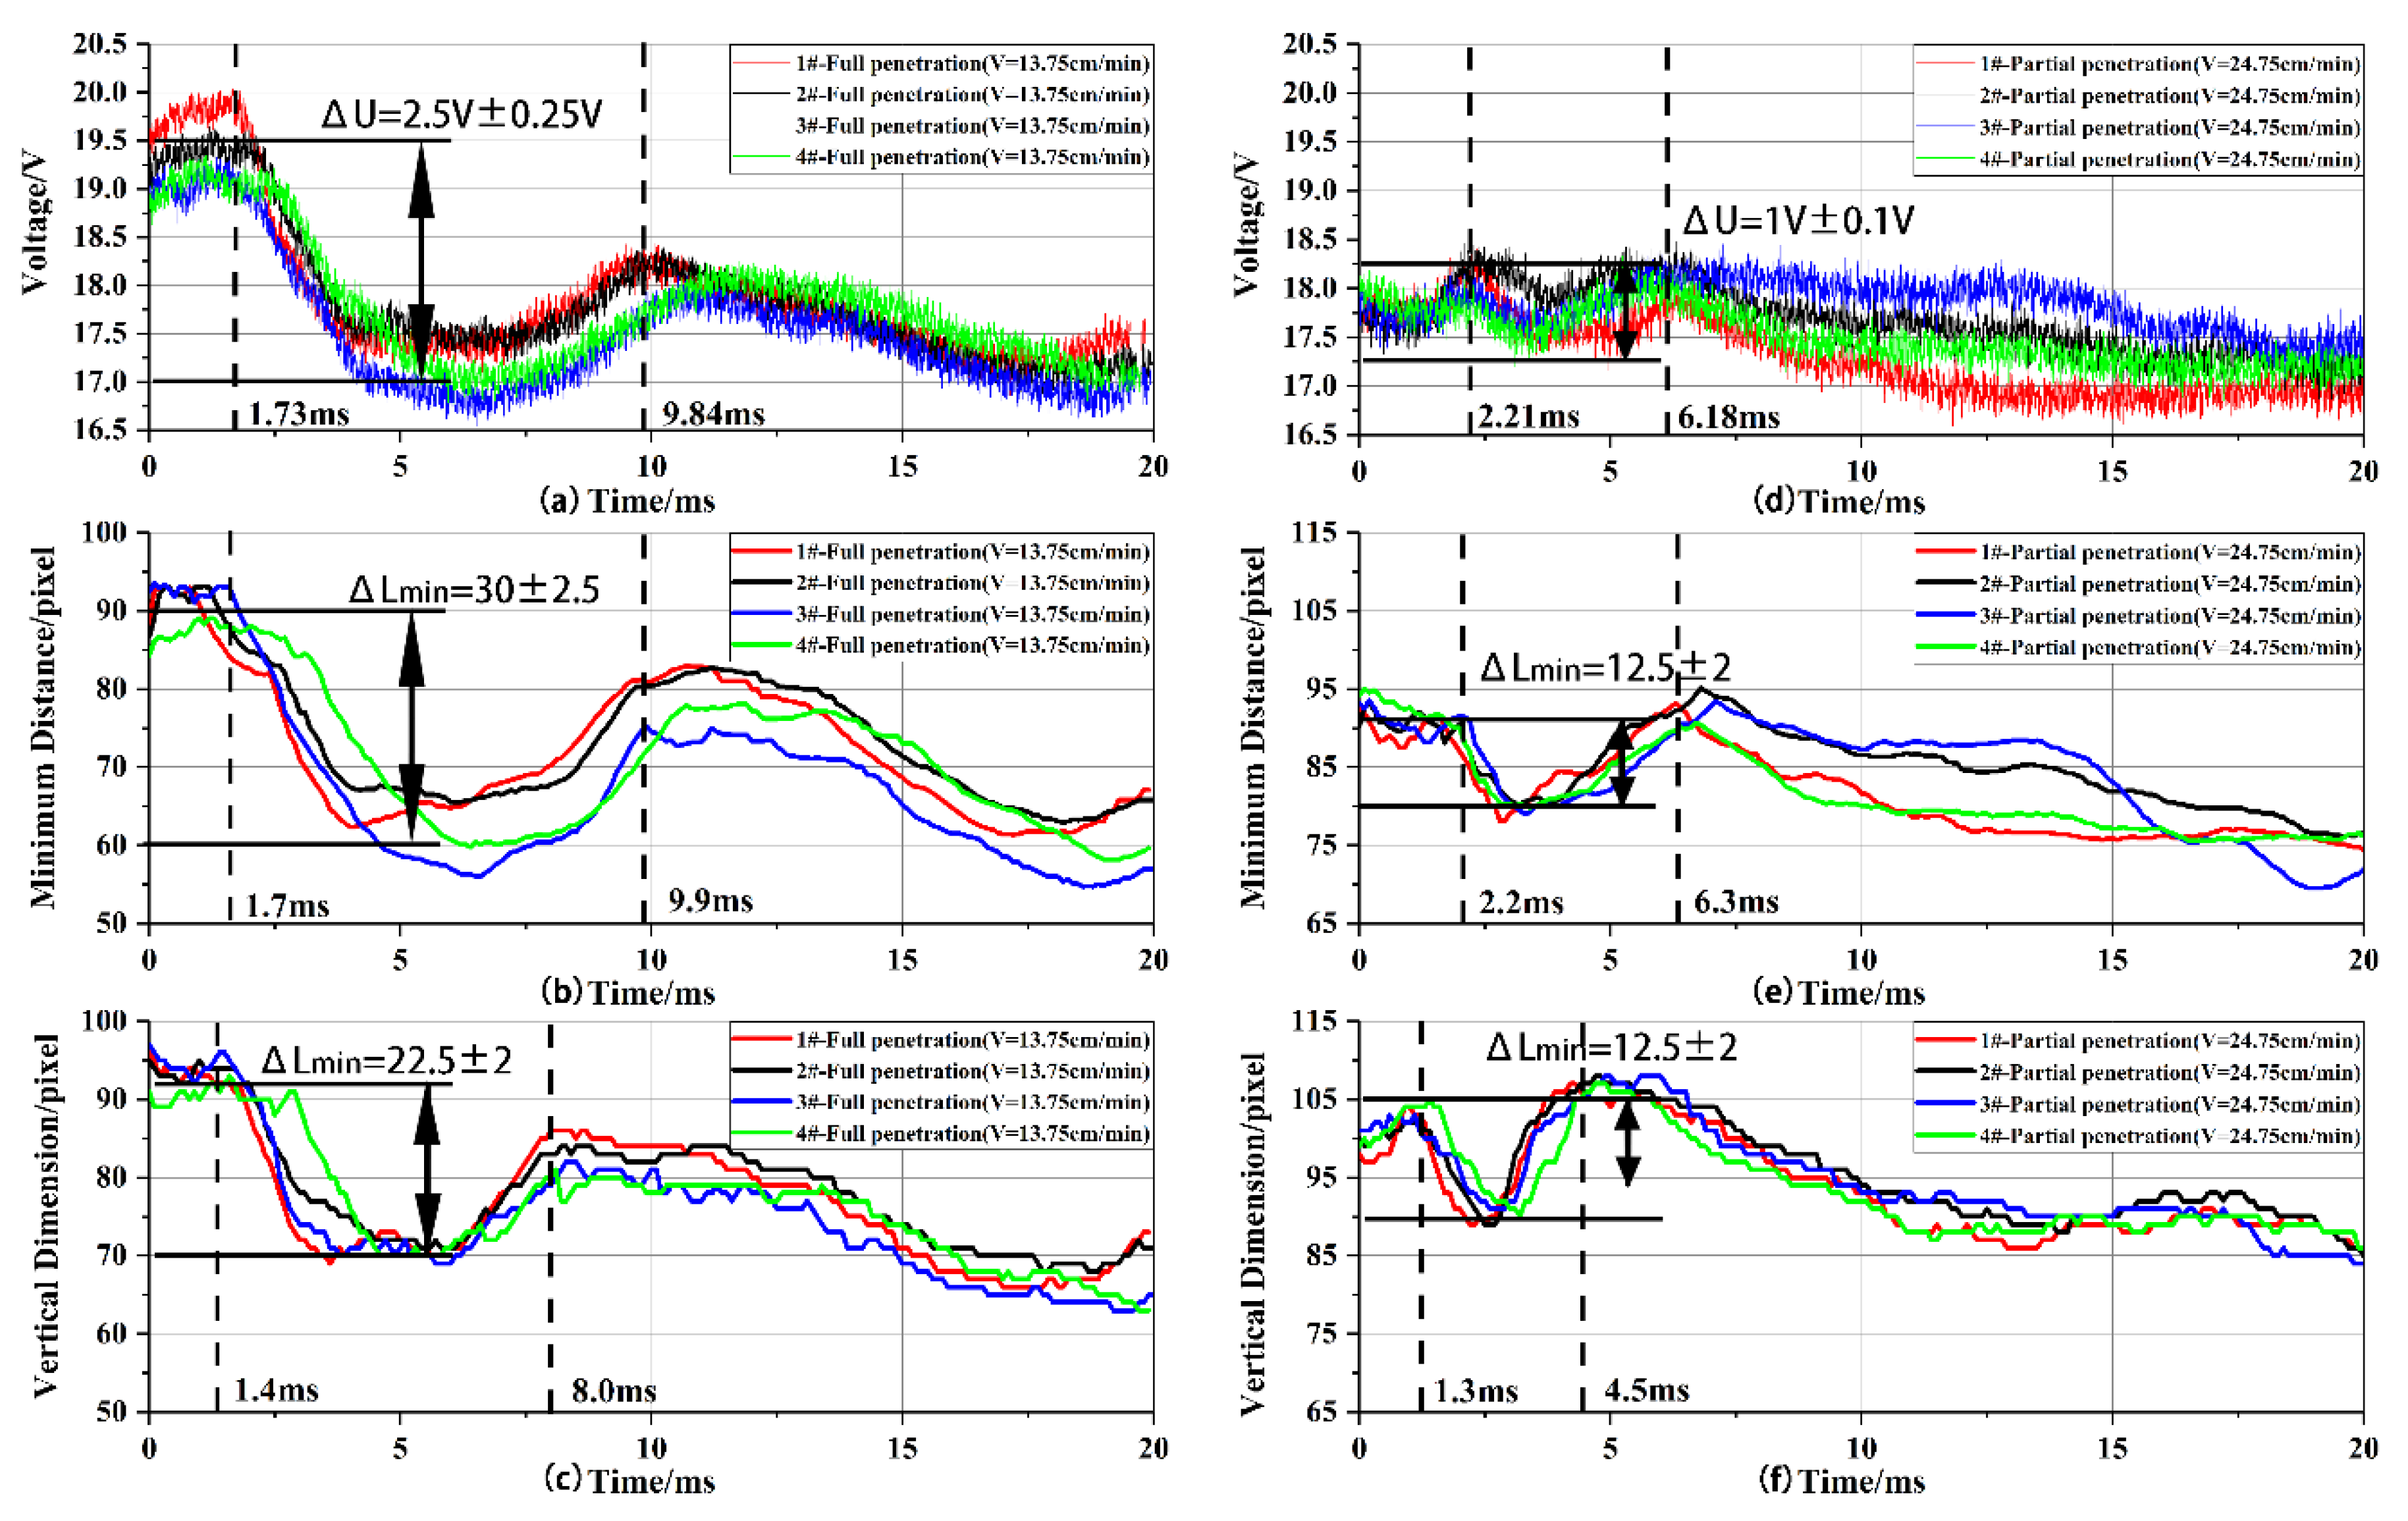
Figure 14 shows the synchronous curves of the voltage signal, the minimum distance (Lmin) and the vertical dimension (LV).
As shown in Figure 14, the voltage signal curve, the minimum distance (Lmin) curve and the vertical dimension (LV) curve all showed an obvious trough for all penetration status. It was caused by the initial wave peak of the weld pool during the base time. The vertical dimension curve is the direct response to the weld pool motion (as shown in Figure 2). The voltage signal curve had good consistency with the minimum distance curve. The starting and ending time of both troughs and shape of the curves were the similar as shown in Figure 14a,b,d,e. It illustrates that the change of the shortest distance between the weld pool surface and the tip of the wire, which is the effective length of the arc, is the major factor of voltage fluctuation. However, the end time of the trough of the minimum distance curves and the voltage curves acted lag behind which of the voltage signal curves. It was caused by the transfer process of wave peaks on the surface of the weld pool. With the impact of the molten drop, a surface wave peak was formed and moved to the rear part of the weld pool. When the wave peak moved backwards and the pool under the welding wire fall back, the vertical dimension increased, while the minimum distance did not increase synchronously, as shown in Figure 13. The minimum distance curve and the voltage signal curve lost the frequency characteristics of the pool oscillation due to the hysteresis of ending time of the trough, so the pool oscillation frequency cannot be extracted from the voltage signal.
As shown in Figure 13 and Figure 14, due to the curvature of the weld pool surface, there was some difference between ΔLmin and ΔLV. while it could not be denied that ΔLmin had evident positive correlation with ΔLV. Similarly, researchers have previously reported the non-proportional relationship between arc voltage and arc length [19,20,21], while there were also significant positive correlations between arc voltage and arc length. Therefore, it can be inferred that the change of voltage during the base time (ΔU) can be used to sense the penetration status which is similar to the amplitude of the weld pool oscillation (described in Section 3.1). 
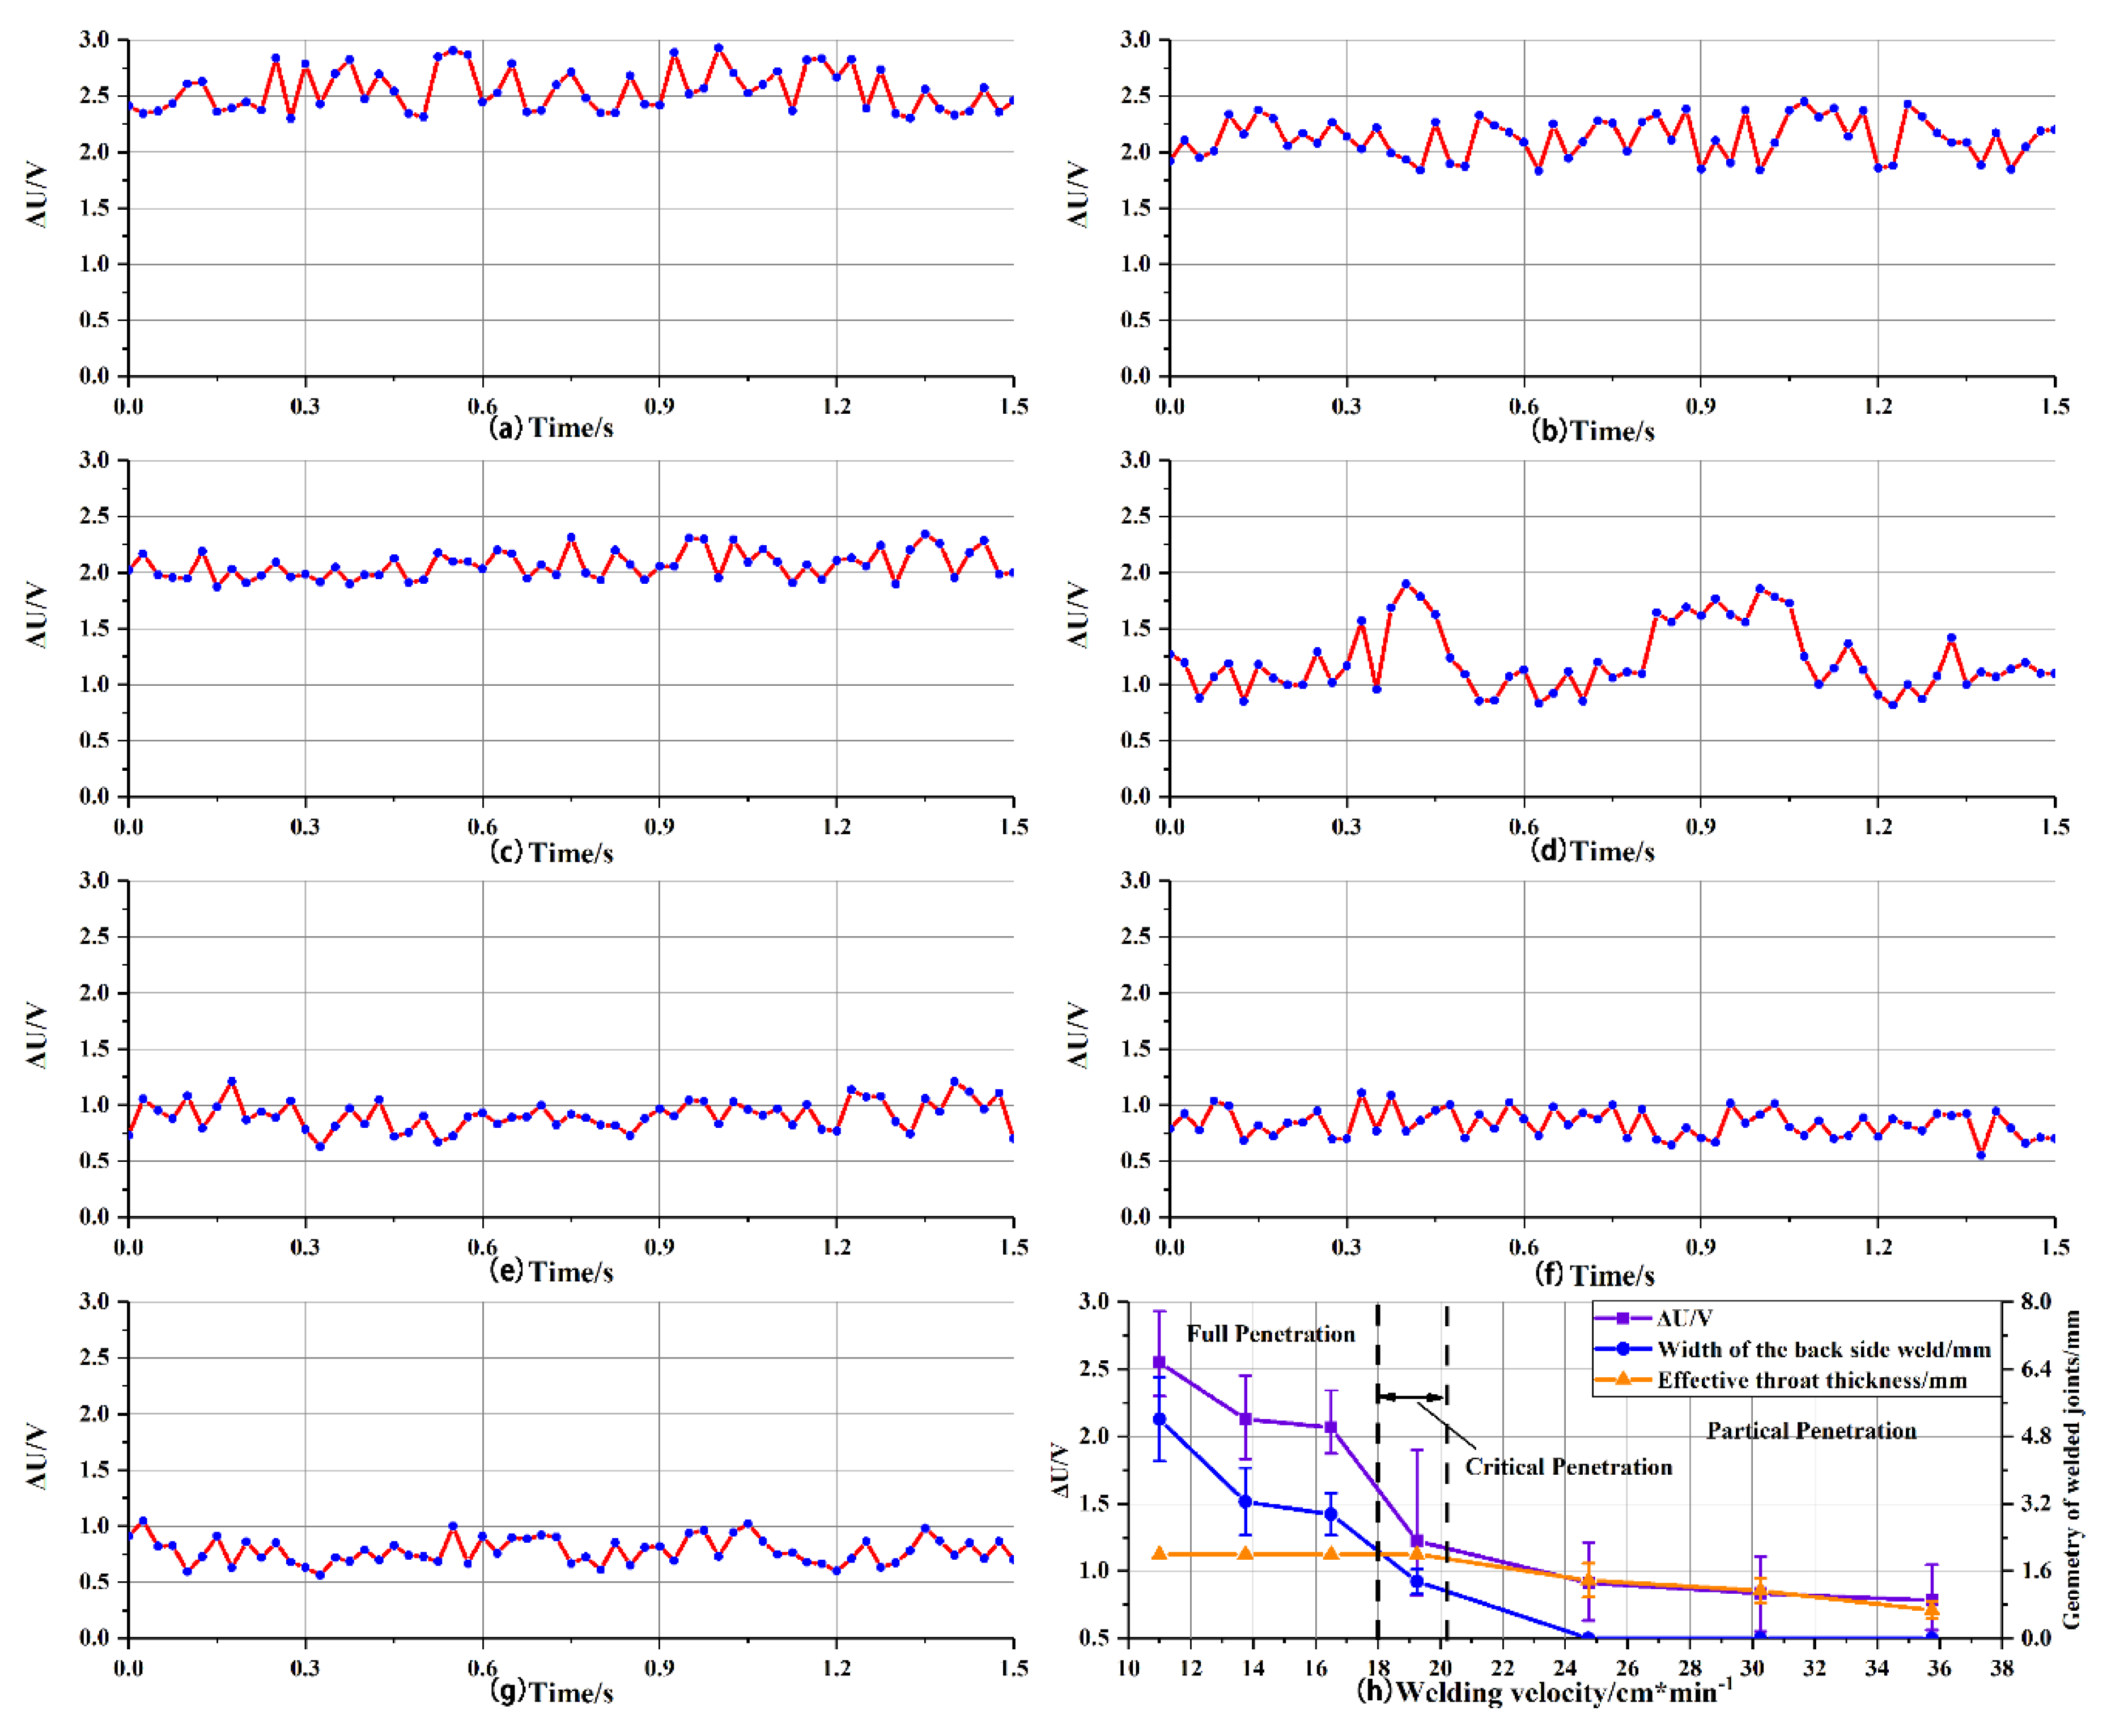
Figure 15 shows the curves of ΔU with time with different penetration statues.
ΔU was plotted with welding time at different penetration status, as shown in Figure 15a–g. The trend of mean value and the error analysis of ΔUs at different penetration status are shown in Figure 15g. With the decrease in ΔU, the status transform from the full penetration to the partial penetration, and an abrupt transition occurred of ΔU in the transition from full to critical penetration status which was similar to the trend of the oscillation amplitude. ΔU of full penetration was all greater than 2 V, while which of partial penetration was less than 1 V. As for critical penetration, the uncertainty of ΔU was the maxima relative to which of full penetration and partial penetration as shown in Figure 15h. The range of ΔU was from 0.8 V–2 V due to nonconstant weld pool boundary conditions. The fluctuation amplitude of the arc voltage in the base duration (ΔU) reflects the penetration status. And ΔU occurs in every pulse base phase, which indicates that the curve of time and ΔU was a good indicator to sense weld penetration status. Under the experimental conditions in the present work, ΔU persistently greater than 2 V can be the threshold for full penetration. From the analyses made above, the constant watch of the curve of time and ΔU during P-GMAW was an efficient way to sensor the weld pool penetration status.

4. Conclusions

In this paper, the oscillation characteristics of P-GMAW weld pool with different penetration status were studied. The internal relation between voltage signal and oscillation behavior of weld pool was analyzed. And a new method was proposed to sense the penetration of the weld pool for traveling P-GMAW which was based on the voltage signal during the base current period. The conclusions are as follows:
(1)
During traveling welding process, the weld pool can be triggered into oscillation by the impact of the droplet. The oscillation amplitude of the weld pool decreased with penetration decrease and an abrupt transition occurred in the transition from full to partial penetration status.
(2)
During P-GMA welding, the frequency field of the oscillation for full and critical penetration was made up of fundamental frequency of arc and twice of which, while the low-frequency component of the critical penetration was unstable. For partial penetration, the frequency field of the oscillation was only made up of twice of the fundamental frequency of arc.
(3)
The change of Lmin caused by weld pool oscillation was the main factor of voltage signal fluctuation during the base current period. The voltage signal curve lost the frequency characteristics of the pool oscillation due to the curvature of the pool surface.
(4)
The fluctuation amplitude of the arc voltage at the base duration (ΔU) represents the oscillation amplitude of the weld pool which reflects the penetration status. The constant watch of the curve of time and ΔU during P-GMAW may be an efficient way to detect weld pool penetration.

Author Contributions

Conceptualization, T.C. and S.X.; methodology, T.C.; software, T.C.; validation, T.C., S.X. and W.L.; formal analysis, T.C.; investigation, T.C., P.Z.; resources, T.C.; data curation, T.C.; writing—original draft preparation, T.C.; writing—review and editing, T.C., S.X.; visualization, T.C.; supervision, S.X.; project administration, B.W.; funding acquisition, S.X. All authors have read and agreed to the published version of the manuscript.

Funding

This work was funded by the National Natural Science Foundation of China, grant No.51675269 and the Priority Academic Program Development of Jiangsu Higher Education Institutions (PAPD).

Conflicts of Interest

The authors declare no conflict of interest.

References

  1. Li, C.; Shi, Y.; Gu, Y.F. Monitoring weld pool oscillation using reflected laser pattern in gas tungsten arc welding. J. Mater. Process. Tech. 2018, 255, 876–885. [Google Scholar] [CrossRef]
  2. Wang, K.H.; Tang, X.C.; Yu, J. Method of visional detecting MAG weld pool information. Trans. Nonferrous Met. Soc. China 2005, 15, 369–374. [Google Scholar]
  3. Fan, C.; Lv, F.; Chen, S. Visual sensing and penetration control in aluminum alloy pulsed GTA welding. Int. J. Adv. Manuf. Tech. 2009, 42, 126–137. [Google Scholar] [CrossRef]
  4. Wang, Z.; Zhang, C.; Pan, Z.; Wang, Z.; Liu, L.; Qi, X.; Mao, S.; Pan, J. Image Segmentation Approaches for Weld Pool Monitoring during Robotic Arc Welding. Appl. Sci. 2018, 8, 2445. [Google Scholar] [CrossRef] [Green Version]
  5. Chandrasekhar, N.; Vasudevan, M.; Bhaduri, A.K. Intelligent modeling for estimating weld bead width and depth of penetration from infra-red thermal images of the weld pool. J. Intell. Manuf. 2015, 26, 59–71. [Google Scholar] [CrossRef]
  6. Vasudevan, M.; Chandrasekhar, N.; Maduraimuthu, V.; Bhaduri, A.K. Real-Time Monitoring of Weld Pool during GTAW using Infra-Red Thermography and analysis of Infra-Red thermal images. Weld. World 2013, 55, 83–89. [Google Scholar] [CrossRef]
  7. Shi, Y.; Zhang, G.; Ma, X.J. Laser-Vision-Based Measurement and Analysis of Weld Pool Oscillation Frequency in GTAW-P. Weld. J. 2015, 94, 176–187. [Google Scholar]
  8. Wang, Z.J.; Zhang, Y.M.; Wu, L. Measurement and estimation of weld pool surface depth and weld penetration in pulsed gas metal arc welding. Weld. J. 2010, 89, 117s–126s. [Google Scholar]
  9. Chen, S.B.; Lv, N. Research evolution on intelligentized technologies for arc welding process. J. Manuf. Process. 2014, 16, 109–122. [Google Scholar]
  10. Zhang, K.; Zhang, Y.; Chen, J.; Wu, S. Observation and analysis of three-dimensional weld pool oscillation dynamic behaviors. Weld. J. 2017, 96, 143–153. [Google Scholar]
  11. Zhang, Z.; Chen, S.B. Real-time seam penetration identification in arc welding based on fusion of sound, voltage and spectrum signals. J. Intell. Manuf. 2017, 28, 207–218. [Google Scholar] [CrossRef]
  12. Xiao, Y.H.; Ouden, G. A study of GTA weld pool oscillation. Weld. J. 1990, 69, 289–293. [Google Scholar]
  13. Bai, P.; Wang, Z.; Hu, S. Sensing of the weld penetration at the beginning. of pulsed gas metal arc welding. J. Manuf. Process. 2017, 28 Pt 1, 343–350. [Google Scholar] [CrossRef]
  14. Yudodibroto, B.Y.; Hermans, M.J.; den Ouden, G.; Richardson, I.M. Observations on Droplet and Arc Behavior during Pulsed GMAW. Weld. World 2009, 53, R171–R180. [Google Scholar] [CrossRef]
  15. Zhao, Y.; Lee, P.S.; Chung, H. Effect of pulsing parameters on drop transfer dynamics and heat transfer behavior in pulsed gas metal arc welding. Int. J. Heat Mass Trans. 2019, 129, 1110–1122. [Google Scholar] [CrossRef]
  16. Zacksenhouse, M.; Hardt, D.E. Weld Pool Impedance Identification for Size Measurement and Control. J. Dyn. Syst. Asme. 1983, 105, 179–184. [Google Scholar]
  17. Ta, M.N.; Joseph, L. Identification of weak nonlinearities on damping and stiffness by the continuous wavelet transform. J. Sound Vib. 2006, 293, 16–37. [Google Scholar] [CrossRef]
  18. Ramos, E.G.; de Carvalho, G.C.; Absi Alfaro, S.C. Analysis of weld pool oscillation in GMAW-P by means of shadowgraphy image processing. Weld. Int. 2013, 10, 197–205. [Google Scholar]
  19. Dos Santos, E.B.F.; Kuroiwa, L.H.; Ferreira, A.F.C.; Pistor, R.; Gerlich, A.P. On the Visualization of Gas Metal Arc Welding Plasma and the Relationship Between Arc Length and Voltage. Appl. Sci. 2017, 7, 503. [Google Scholar] [CrossRef] [Green Version]
  20. Ponomarev, V.; Costa, A.V.; Scotti, A. Voltage drop in electrode molten metal droplets under MIG/MAG welding conditions. Int. J. Join. Mater. 2004, 16, 49–54. [Google Scholar]
  21. Yudodibroto, B.Y.B. Liquid Metal Oscillation and Arc Behaviour during Welding. Ph.D. Thesis, Delft University of Technology, Delft, The Netherlands, 25 January 2010. [Google Scholar]
Figure 1. Experimental system and image processing system.
Applsci 10 02735 g001
Figure 2. Experimental system and image processing system.
Applsci 10 02735 g002
Figure 3. Different penetration status. Welding travel speed (cm/min): (a) 16.5; (b) 19.25; (c) 24.75.
Applsci 10 02735 g003
Figure 4. Combination of voltage signal waveform and fully penetrated weld pool oscillation process: High-speed photographs of weld pool at different times:(a)–(j). (welding travel speed: 13.75 cm/min).
Applsci 10 02735 g004
Figure 5. Combination of voltage signal waveform and partly penetrated weld pool oscillation process: High-speed photographs of weld pool at different times:(a)–(j) (welding travel speed: 24.75 cm/min).
Applsci 10 02735 g005
Figure 6. The height of the reference point A on the weld pools surface as a function of time. Full penetration: (a) V = 11 cm/min; (b) V = 13.75 cm/min; (c) V = 16.5 cm/min. Critical penetration: (d) V = 19.25 cm/min. Full penetration: (e) V = 24.75 cm/min; (f) V = 30.25 cm/min; (g) V = 35.75 cm/min.
Applsci 10 02735 g006
Figure 7. Transverse sections of weld joints with different welding travel speed. Full penetration: (ac); critical penetration: (d); full penetration: (eg).
Applsci 10 02735 g007
Figure 8. The amplitude of initial oscillation peak and geometry of the weld joints under different penetration status.
Applsci 10 02735 g008
Figure 9. Oscillation mode of weld pool: (a) partial penetration; (b) full penetration.
Applsci 10 02735 g009
Figure 10. Height of reference point B on the pool surface as a function of time: (a) full penetration; (b) partial penetration.
Applsci 10 02735 g010
Figure 11. The contour diagram of transform coefficient of weld pool oscillation with different penetration status. Full penetration: (a) V = 11 cm/min; (b) V = 13.75 cm/min; (c) V = 16.5 cm/min. Critical penetration: (d) V = 19.25 cm/min. Full penetration: (e) V = 24.75 cm/min; (f) V = 30.25 cm/min; (g) V = 35.75 cm/min.
Applsci 10 02735 g011
Figure 12. Components of the weld pool oscillation signal at 40 Hz and 80 Hz with different penetration status. Full penetration: (a) V = 11 cm/min; (b) V = 16.5 cm/min. Critical penetration: (c) V = 19.25 cm/min. partial penetration: (d) V = 30.25 cm/min.
Applsci 10 02735 g012
Figure 13. The relative position between the tip of the wire and the weld pool during base time (V = 13.75 cm/min).
Applsci 10 02735 g013
Figure 14. The synchronous curves of the voltage signal, the minimum distance (Lmin) and the vertical dimension (LV). Full penetration (V = 13.75 cm/min): (ac). Partial penetration (V = 24.75 cm/min): (df).
Applsci 10 02735 g014
Figure 15. ΔU with arc burning time at different penetration status. Full penetration: (a) V = 11 cm/min; (b) V = 13.75 cm/min; (c) V = 16.5 cm/min. Critical penetration: (d) V = 19.25 cm/min. Full penetration: (e) V = 24.75 cm/min; (f) V = 30.25 cm/min; (g) V = 35.75 cm/min; (h) the relationship between ΔU and geometry of the weld joints.
Applsci 10 02735 g015
Table 1. Chemical compositions (in wt%) of base metal and filler wire (Fe balance).
MaterialsCMnSiPSNiCrMoVOther
S235JR0.171.400.30.0350.035----N 0.012
ER70S-60.06–0.151.4–1.80.8–1.20.0250.0350.150.150.150.03Cu 0.5
Table 2. Welding process parameters.
Welding ParametersValue
Mean welding current (A)60 A.
Mean arc voltage (V)19.5 V.
Wire feed rate (m/min)2.2 m/min.
Ip and Ib/AIp = 495 A; Ib = 18 A.
Pulsing frequency40 Hz.
Welding travel speed (cm/min)11, 13.75, 16.5, 19.25, 24.75, 30.25, 35.75.
Arc height (grade displayed on the power)0, 3, 6, 9.
Table 3. Penetration status of weld beads with different welding travel speed.
Welding Travel Speed (V) (cm/min)Penetration Status
11, 13.75, 16.5Full penetration
19.25Critical penetration
24.75, 30.25, 35.75Partial penetration

