Article

Design Optimization for the Thin-Walled Joint Thread of a Coring Tool Used for Deep Boreholes

1
School of Engineering and Technology, China University of Geosciences, Beijing 100083, China
2
Key Laboratory on Deep Geo-Drilling Technology of the Ministry of Natural Resources, China University of Geosciences, Beijing 100083, China
3
Beijing Aidi Geological Investigation & Foundation Construction Company, Beijing 100041, China
4
Shanxi Huanjie Petroleum Drilling Tools Co., Ltd., Jinzhong 045499, China
*
Authors to whom correspondence should be addressed.
Appl. Sci. 2020, 10(8), 2669; https://doi.org/10.3390/app10082669
Submission received: 26 February 2020 / Revised: 9 April 2020 / Accepted: 10 April 2020 / Published: 13 April 2020

Abstract

:
Threaded joints are key components of core drilling tools. Currently, core drilling tools generally adopt the thread structure designed by the API Spec 7-1 standard. However, fractures easily occur in this thread structure due to high stress concentrations, resulting in downhole accidents. In this paper, according to the needs of large-diameter core drilling, a core barrel joint was designed with an outer diameter of Φ135 mm and a trapezoidal thread profile. Subsequently, a three-dimensional simulation model of the joint was established. The influence of the external load, connection state and thread structure on the stress distribution in the joint was analyzed through simulations, from which the optimal thread structure was determined. Finally, a connection test was carried out on the threaded joint. The stress distribution in the joint thread was indirectly studied by analyzing gas leaks (i.e., the sealing effect) under axial tension. According to the test data and the simulation results, the final joint thread structure was optimized, which lays a good foundation for the design of a core barrel.

1. Introduction

A threaded joint is one of the weakest and most critical components of a core drilling tool [1]. A threaded joint is a typical thin-walled structure that operates in a harsh working environment and is mainly subjected to tensile loads and torsional loads. During core drilling, downhole accidents often occur as a result of thread breakage. The most common reason for joint failure is fatigue, which is affected by the maximum stress [2]. Ensuring the joint strength and airtightness of the thread is the key to the success of the coring process; however, due to limited radial dimensions, it has always been difficult to achieve such goals in the study of core drilling tools [3,4,5].
At present, research on joint threads mainly focuses on oil drill strings [6,7,8], which have a large wall thickness and a large thread design margin; hence, these structures cannot provide a direct reference for the core drilling thread design [9,10,11]. Wireline core drill strings are thin-walled structures that can be used as a reference for the thread design of core drilling tools.
Many researchers have used model parameterization to study the mechanical characteristics of rotary shouldered connections (RSCs). Studies have shown that the 2D finite element method (FEM) is a powerful numerical method for solving this particular problem [12,13,14]. Feng Qingwen [15] studied the relationship between the thread taper and strength and the corresponding stress distributions through a range of lab tensile, torsional and optical-elastic stress tests. Su Jijun [16] optimized the pitch and length parameters of the thread for diamond wireline core drilling tools. Their results showed that an appropriate increase in the pitch and length of a thread could effectively improve the stress distribution inside a joint thread.
Owing to the complex structure, finite element simulation is the most effective method for studying threads. Tadeusz Smolnicki et al. [17] established the finite element modeling of fatigue loaded bolted flange joints and analyzed the mechanism of bolt fracture. Owing to the complex structure, finite element simulations are the most effective method for studying threads. Tadeusz Smolnicki et al. [18] established finite element modeling of fatigue-loaded bolted flange joints and analyzed the mechanism of bolt fracture. Based on the nonlinear finite element theory, Liang Jian [19] carried out a simulation analysis to assess problems involving a threaded joint in a drill pipe joint and the pull-out of a rod during deep-hole drilling. They used finite element software to analyze the pull-out ability of a thread with different wireline core drill strings under different parameters. Cui Chengmin [20] used ANSYS software to carry out a 3D simulation of a Φ71 mm wireline core drill string and joint and determined that the thread root had the highest stress. Yin Feng [21] established a quasi-three-dimensional model for a Φ89 mm wireline core string joint. Under the condition of neglecting the influence of the helix angle, ANSYS was used to analyze the nonlinear mechanical dynamics of a thread. Finally, the stress nephogram and the deformation nephogram at a joint thread were obtained; however, other loads and boundary conditions were ignored, making the results irregular. Gao Shenyou [22] used static mechanics to analyze the stress state of the negative angle thread of a Φ74 mm wireline core drill string and calculated the torsional resistance of the thread. Moreover, theoretical calculations and static torsion tests were performed on negative angle threads with different taper and thread heights. Gao Jianlong [23] calculated the force in a thread from the influence of the thread structure and the drilling parameters on the thread of the joint. ANSYS/Workbench software was used to simulate the stress and fatigue of a joint thread, and the fatigue life of a drill pipe joint was predicted.
Current core drilling tools mostly use American Petroleum Institute (API) standards [24]. Although API RP 7G provides the ultimate working torque for API RSCs, the relationship between the ultimate working torque and axial tension is simplified to be linear, which is only true when the axial tension is not too large [25]. The stress distribution in API joints is not reasonable, which results in a short service life [26]. For a drilling pipe, taking the XT-M tool joint developed by GRANT Company as an example, the torsional strength of XT-M was higher than that of API joints, and the gas sealing performance was satisfactory, which was confirmed through an experiment in which XT-M joints sealed an external pressure load [27]. Threads designed in accordance with API standards are prone to downhole accidents owing to stress concentrations during coring operations, indicating that these threads cannot meet the needs of deep core drilling. At present, there is almost no research on the thread of a large-diameter thin-walled core barrel, which makes it impossible to meet the needs of the deep-hole coring process in many cases.
In this paper, according to the need for large-diameter deep-hole coring, a core barrel joint is designed with an outer diameter of Φ135 mm, a trapezoidal thread profile, and flush internal and external faces. Subsequently, a three-dimensional finite element model of the threaded joint is established. The effects of the external load, connection state and thread structure on the joint connection are established via simulation, from which the thread structure is optimized. Finally, a threaded joint connection test is designed. The stress distribution in the threads is experimentally determined by testing the airtightness effect of the joints. Combined with the above simulation model, the final joint thread structure is optimized, which lays a good foundation for the design of the deep-hole core barrel.

2. Design of the Core Barrel

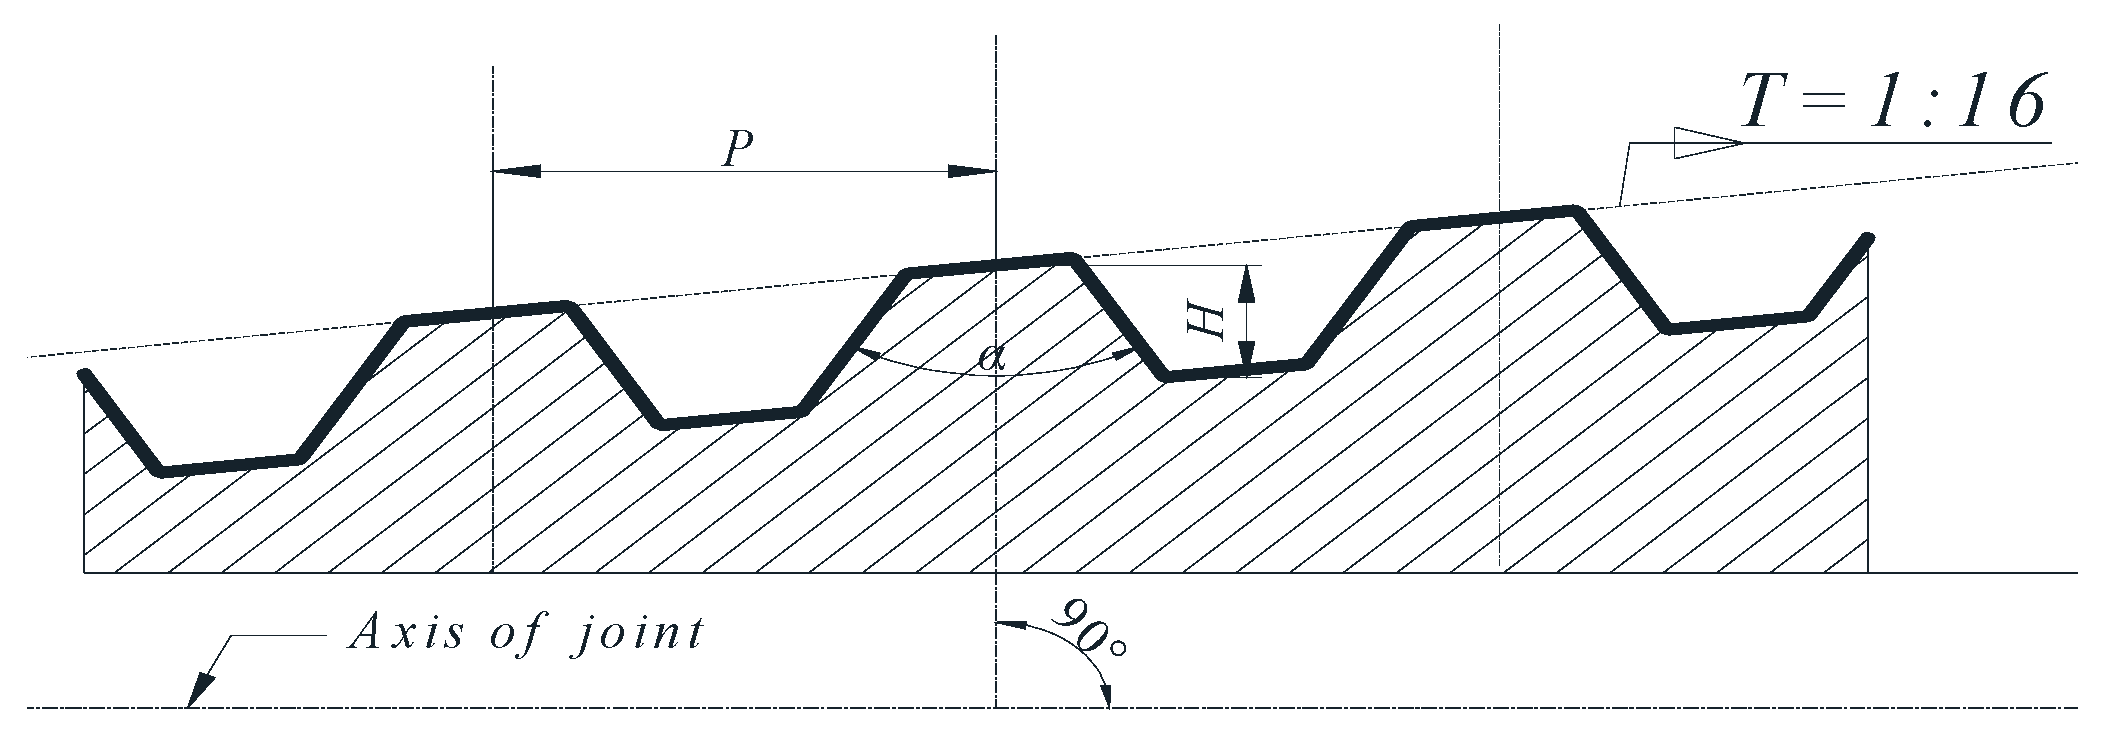
2.1. Structure Parameters of the Thread

The thread is the most important part of a joint. The thread connecting the drill is generally a conical thread structure, which has a self-locking effect and good sealing performance, so it is widely used in connecting liquid and gas pipelines. Other thread forms include trapezoidal threads, gear style threads, and symmetrical trapezoidal threads (Figure 1). In the picture, P is the pitch, H is the height, α is the thread angle, and T is the taper. Trapezoidal threads are studied in this paper.
The structural parameters of the conical thread include the taper T, pitch p, lead S, helix angle θ, thread angle α, and thread height h. The taper is the ratio of the difference between the diameters of the large end and small end to the length of the thread. A tapered thread can produce a tight fit between threads. Therefore, a tapered thread has a good sealing capacity and good pressure capacity. The pitch refers to the axial distance between two adjacent threads. The strength of the thread increases as the pitch increases, but the self-locking effect decreases as the pitch increases. The lead is the axial distance at which a point on the thread is rotated 360 degrees along the helix. In a single-helix thread, the lead is equal to the pitch. The thread of a drilling joint is generally a single-helix thread.
The helix angle is the angle between the tangent of the helix and the plane of the vertical helix axis. The helix angle determines the number of turns of the thread. The smaller the helix angle is, the greater the number of turns in the same distance and the better the self-locking effect of the thread. The thread angle is the angle between the two faces of the thread profile. The smaller the thread angle is, the larger the required upper buckle torque, and the easier it is for the thread to loosen. However, if the thread angle is too large, the thread strength will decrease, and the buckle torque will decrease. The thread height is the difference between the large diameter and the small diameter of the thread. When the thread height is too small, thread tripping can easily occur, and the stress in the thread is concentrated. When the thread height is too large, it is easy for the thread to buckle and break.

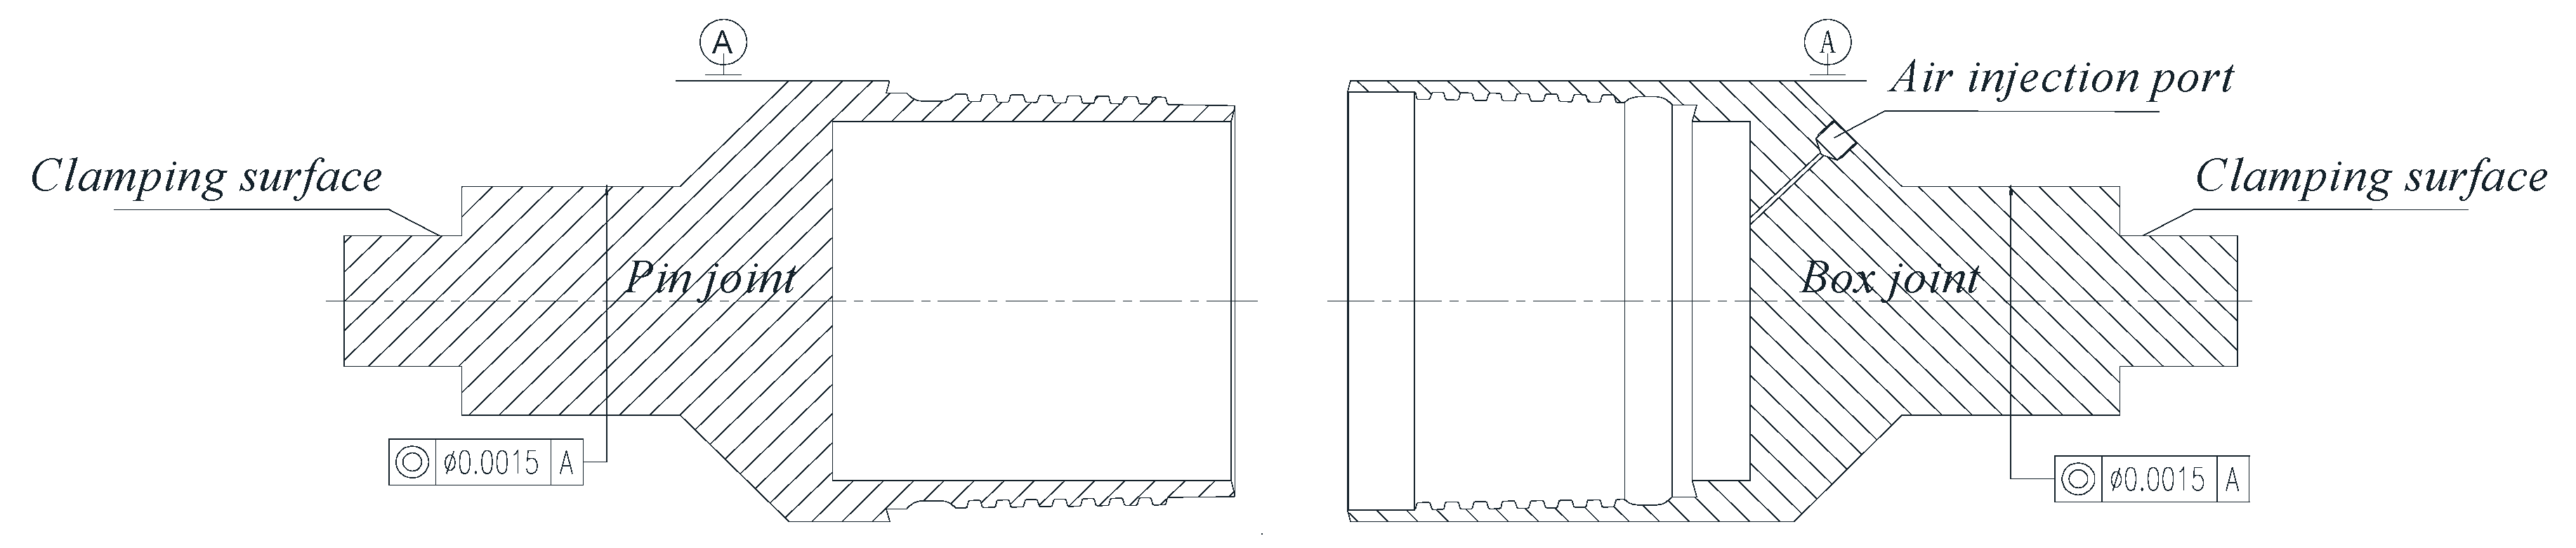
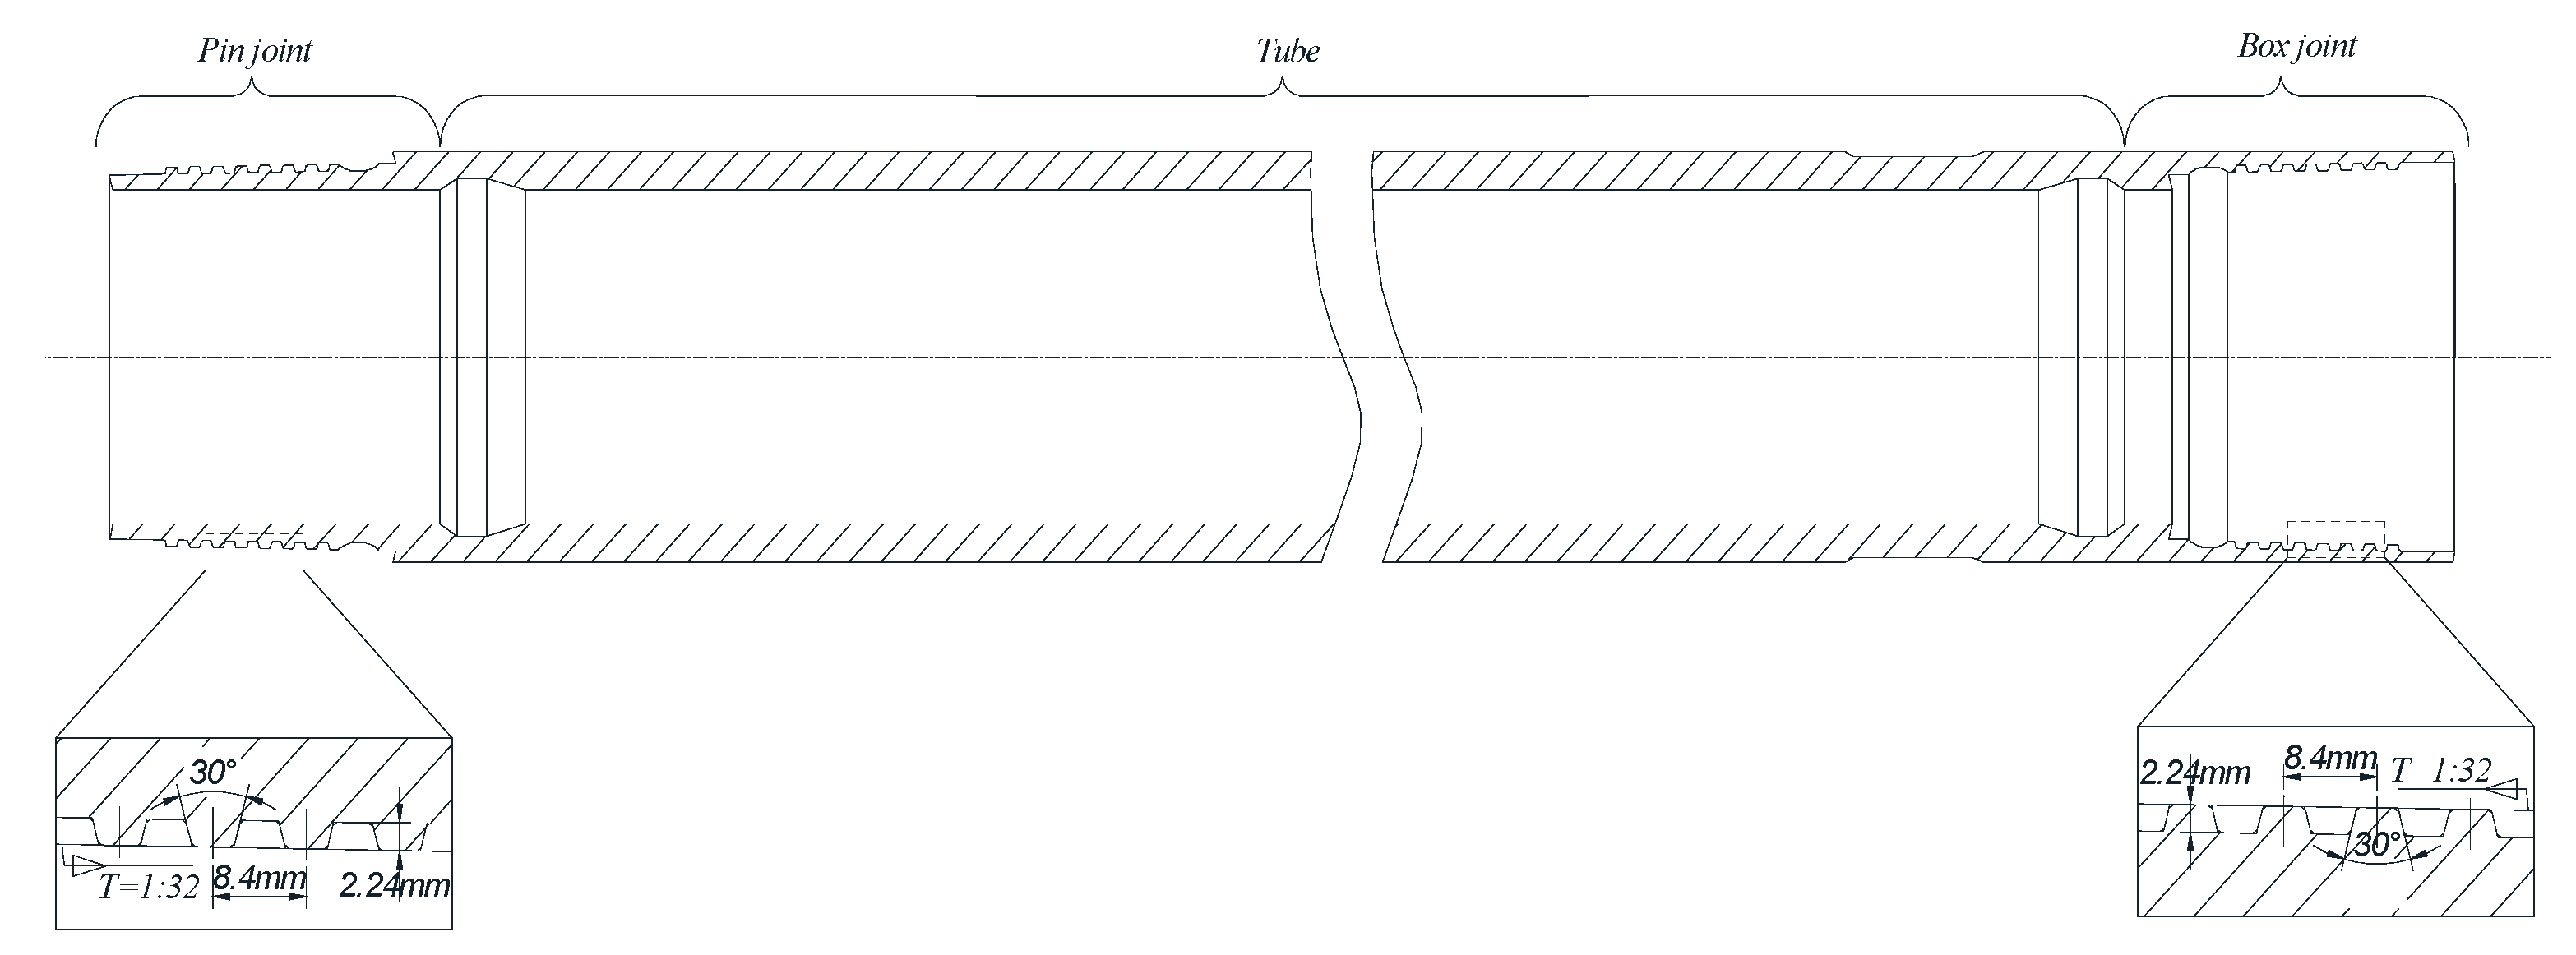
2.2. Design of the Joint

According to the need of large-diameter cores for deep holes, a preliminary design for a core barrel is shown in Figure 2. The core barrel consists of a pin joint, a box joint and a body, which are machined from a single cylinder. The wall thickness of the core barrel joint is only 7 mm. Through preliminary design, the joint threads are trapezoidal threads with a tooth profile angle of 30 degrees, a taper of 1:32, a tooth height of 2.24 mm, and a pitch of 8.4 mm. The threads cooperate to form a sealing surface by means of a shoulder face and an end face.

3. Simulation and Optimization of the Joint

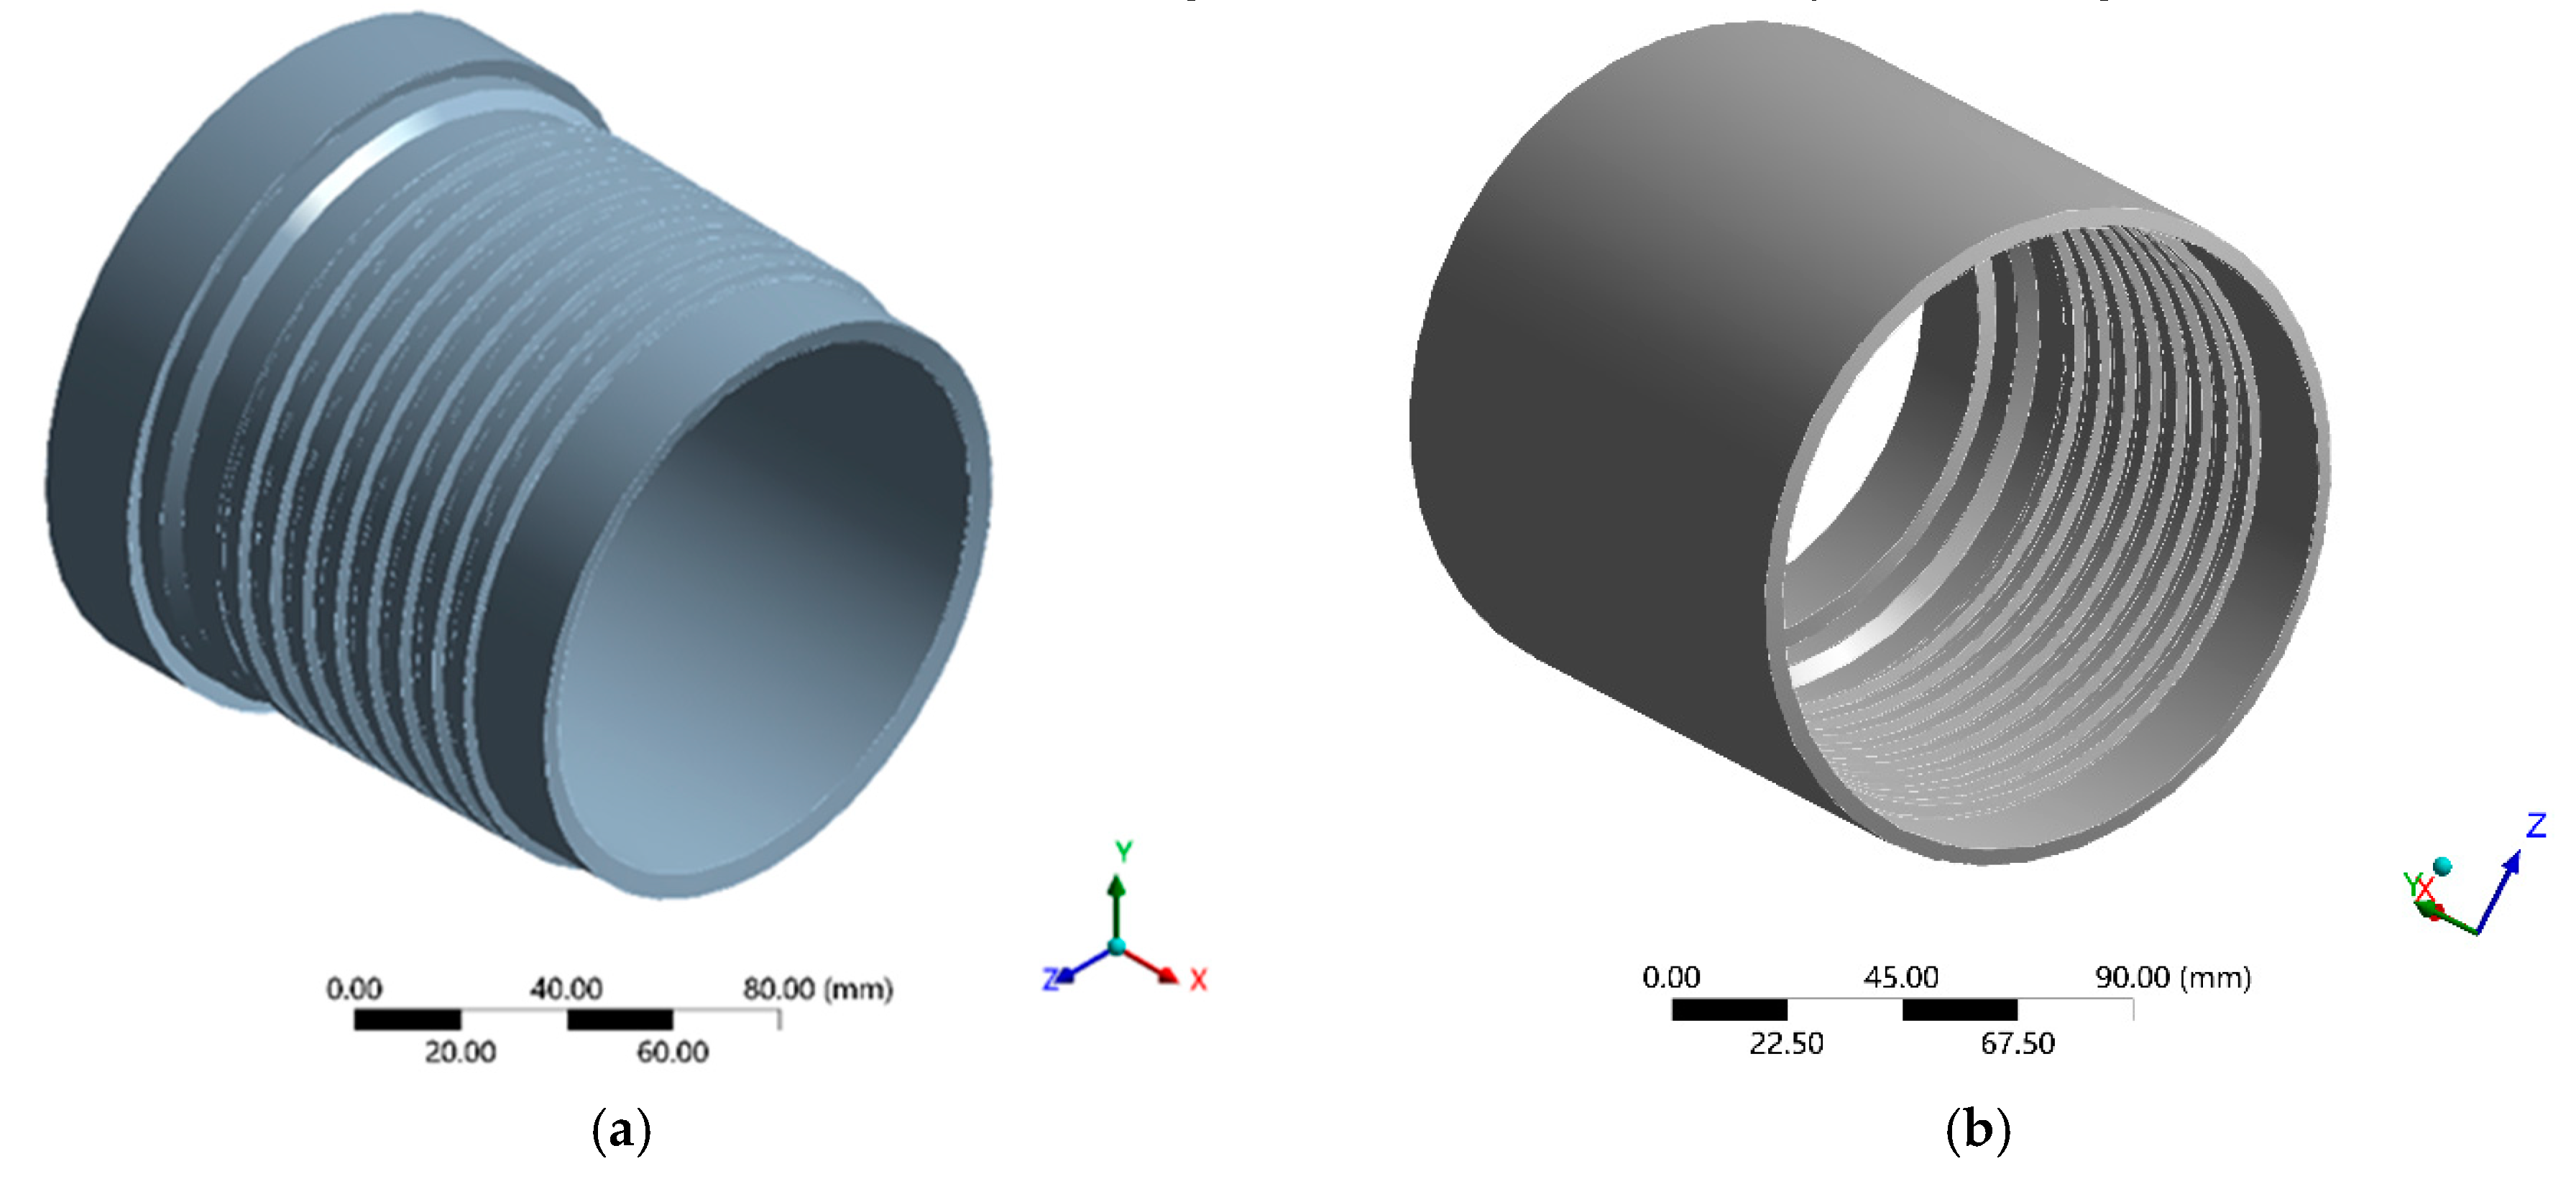
3.1. Finite Element Modelling

Previous finite element simulation studies on threads have the following limitations: (1) they are mostly 2D models that are unable to reflect the true three-dimensional force state and (2) transforming an asymmetrical model into a symmetrical model ignores the effect of the helix angle. Although this can simplify the finite element calculation process, the results do not truly reflect the stress variation in the thread. In this paper, a three-dimensional asymmetric model is used to study the conical thread of a core joint. This three-dimensional model can more accurately reflect the connection state of the thread and visually reveal the thread stress distribution.
A 1:1 three-dimensional model of the threaded joint is established, as shown in Figure 3. The joint material is AISI 4145H. The material parameters are as follows: the elastic modulus is 2.05 × 10¹¹ Pa, the Poisson’s ratio is 0.29, the tensile strength is 965 MPa, and the yield strength is 820 MPa.

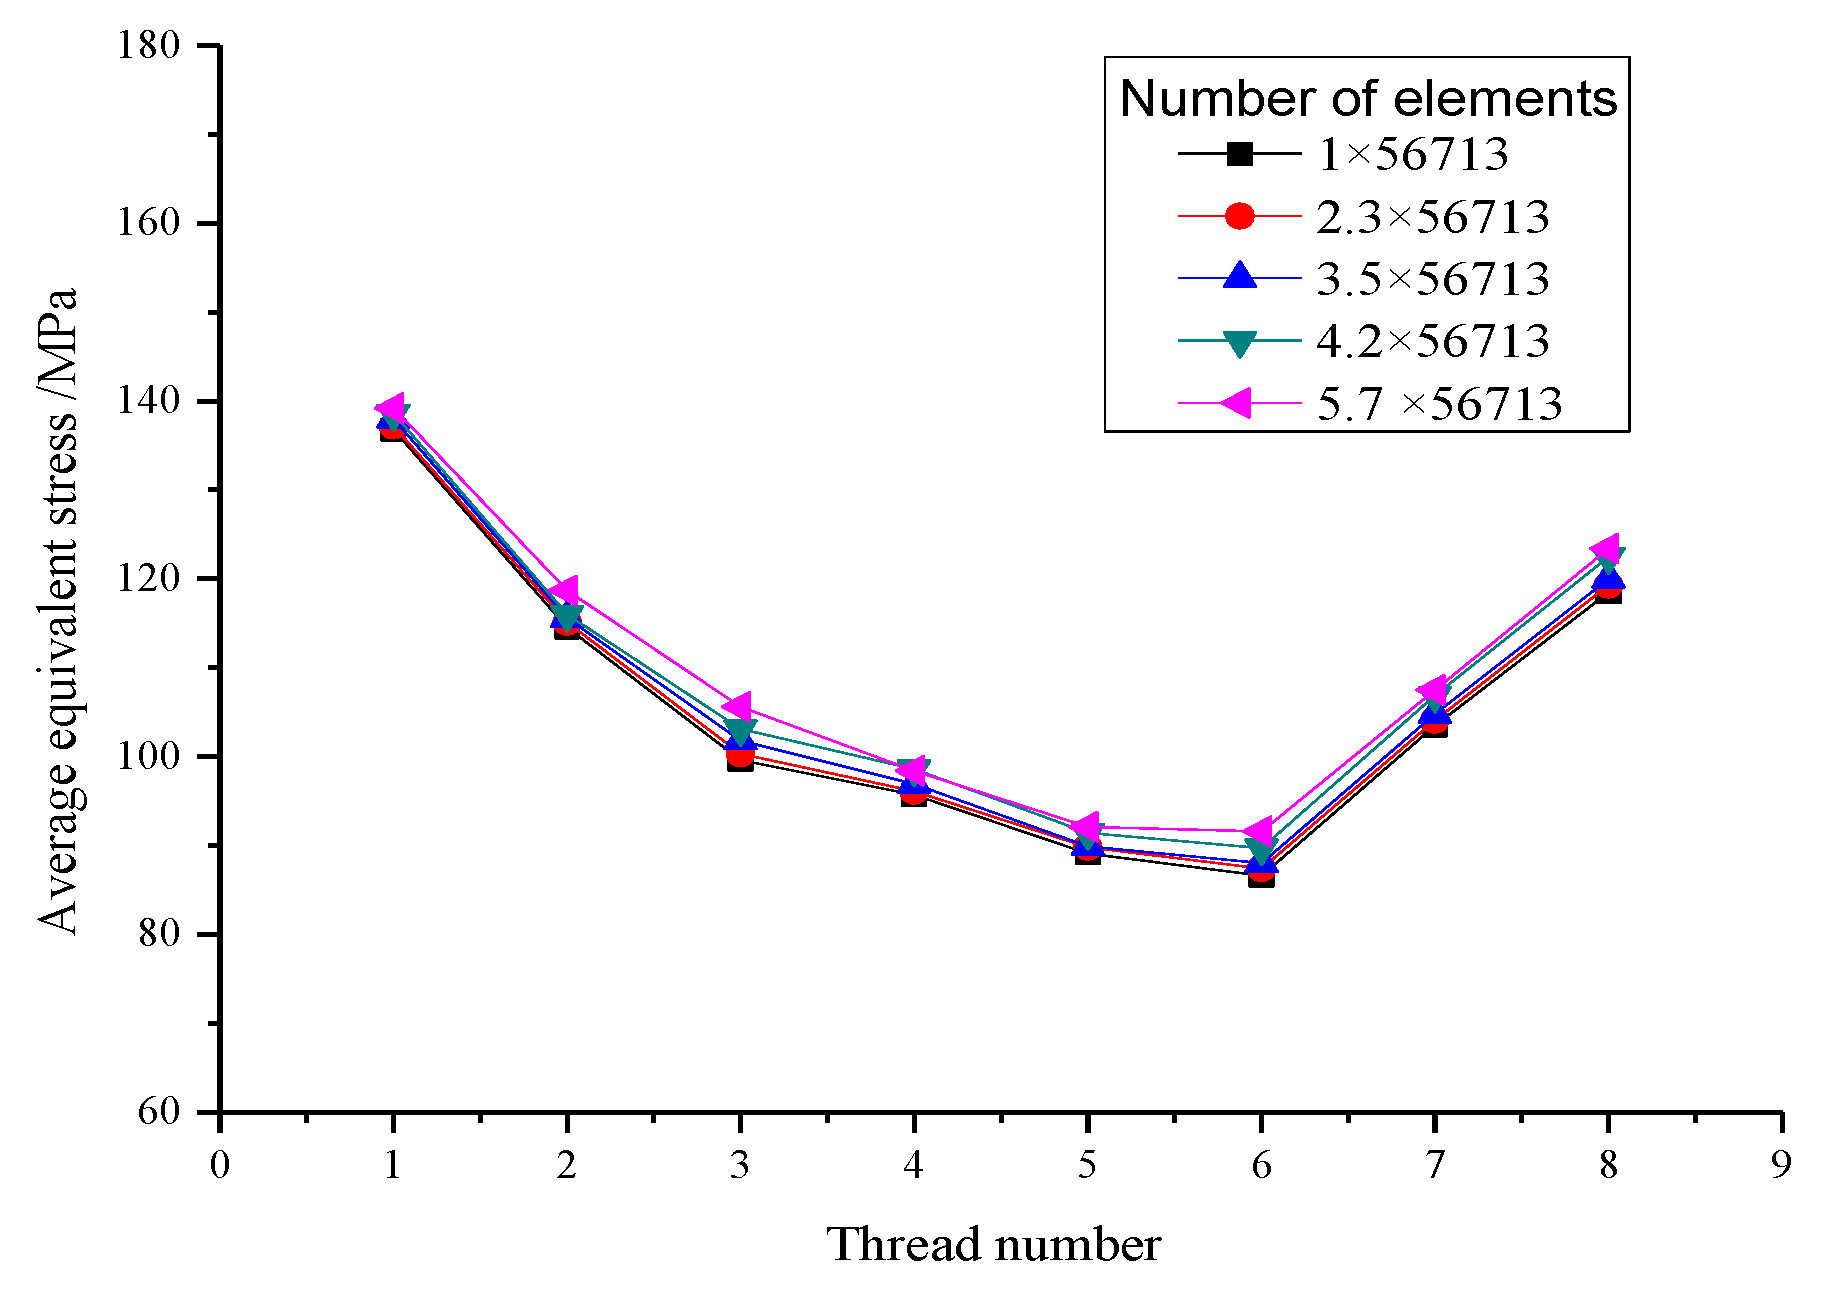
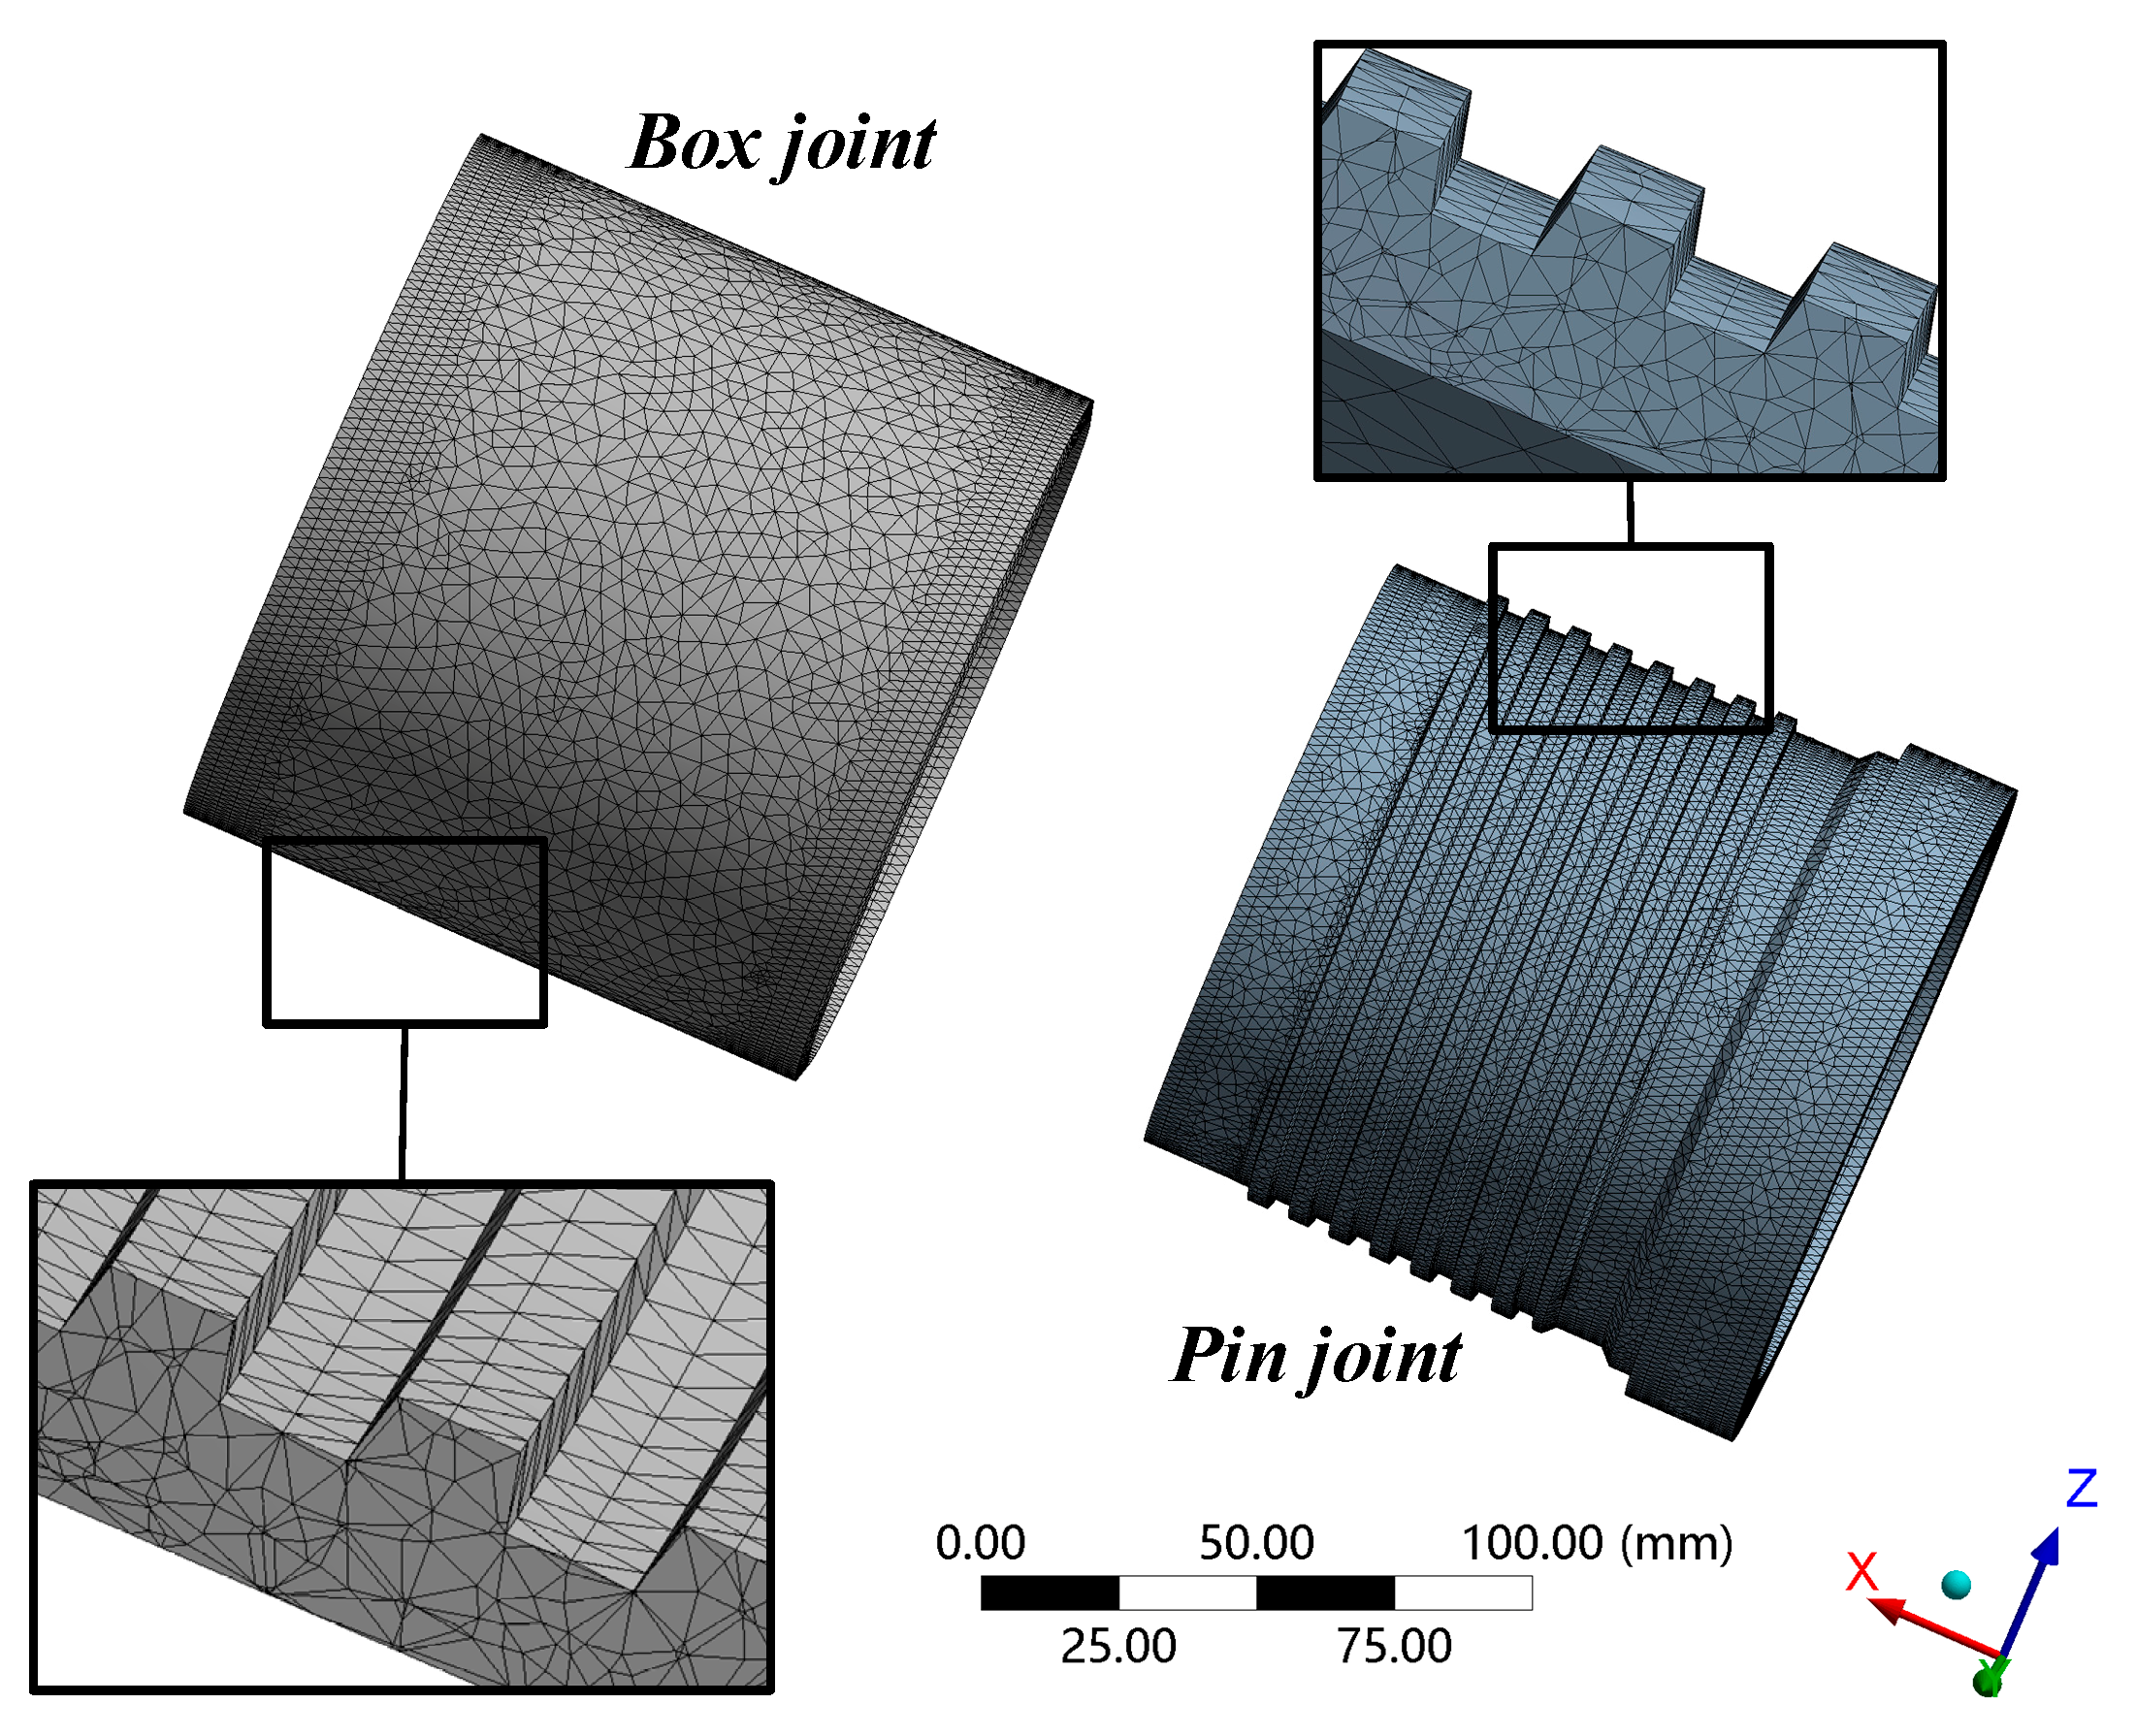
3.2. Element Selection and Meshing

To make the calculation results accurate and credible, it is necessary to analyze the independence of the mesh. The mesh independence was verified under a load of 500 kN. As shown in Figure 4, when the number of elements is greater than 56,713, the average stress in the thread no longer changes significantly as the number of elements increases. Therefore, it can be considered that the calculation results are independent of the mesh size when the number of elements is greater than 56,713.
In view of the complexity of the thread structure and the contact behavior in the analysis, a mesh that is too dense will produce a considerable computational cost, so the mesh size cannot be too small. Moreover, mesh generation needs to have a certain degree of precision, and it is necessary to improve the correlation of the elements. The 3D model was meshed by tetrahedral elements and local mesh refinement was performed at the thread. The total number of model units is 56,713; the number of nodes is 101,147. The average element quality is 0.7. The grid model is shown in Figure 5.
To quantitatively analyze the stress variation along the axis of the thread, the thread is numbered as follows: from the end near the inner-shoulder face, a 360-degree rotation of the thread is defined as one turn, as shown in Figure 6.

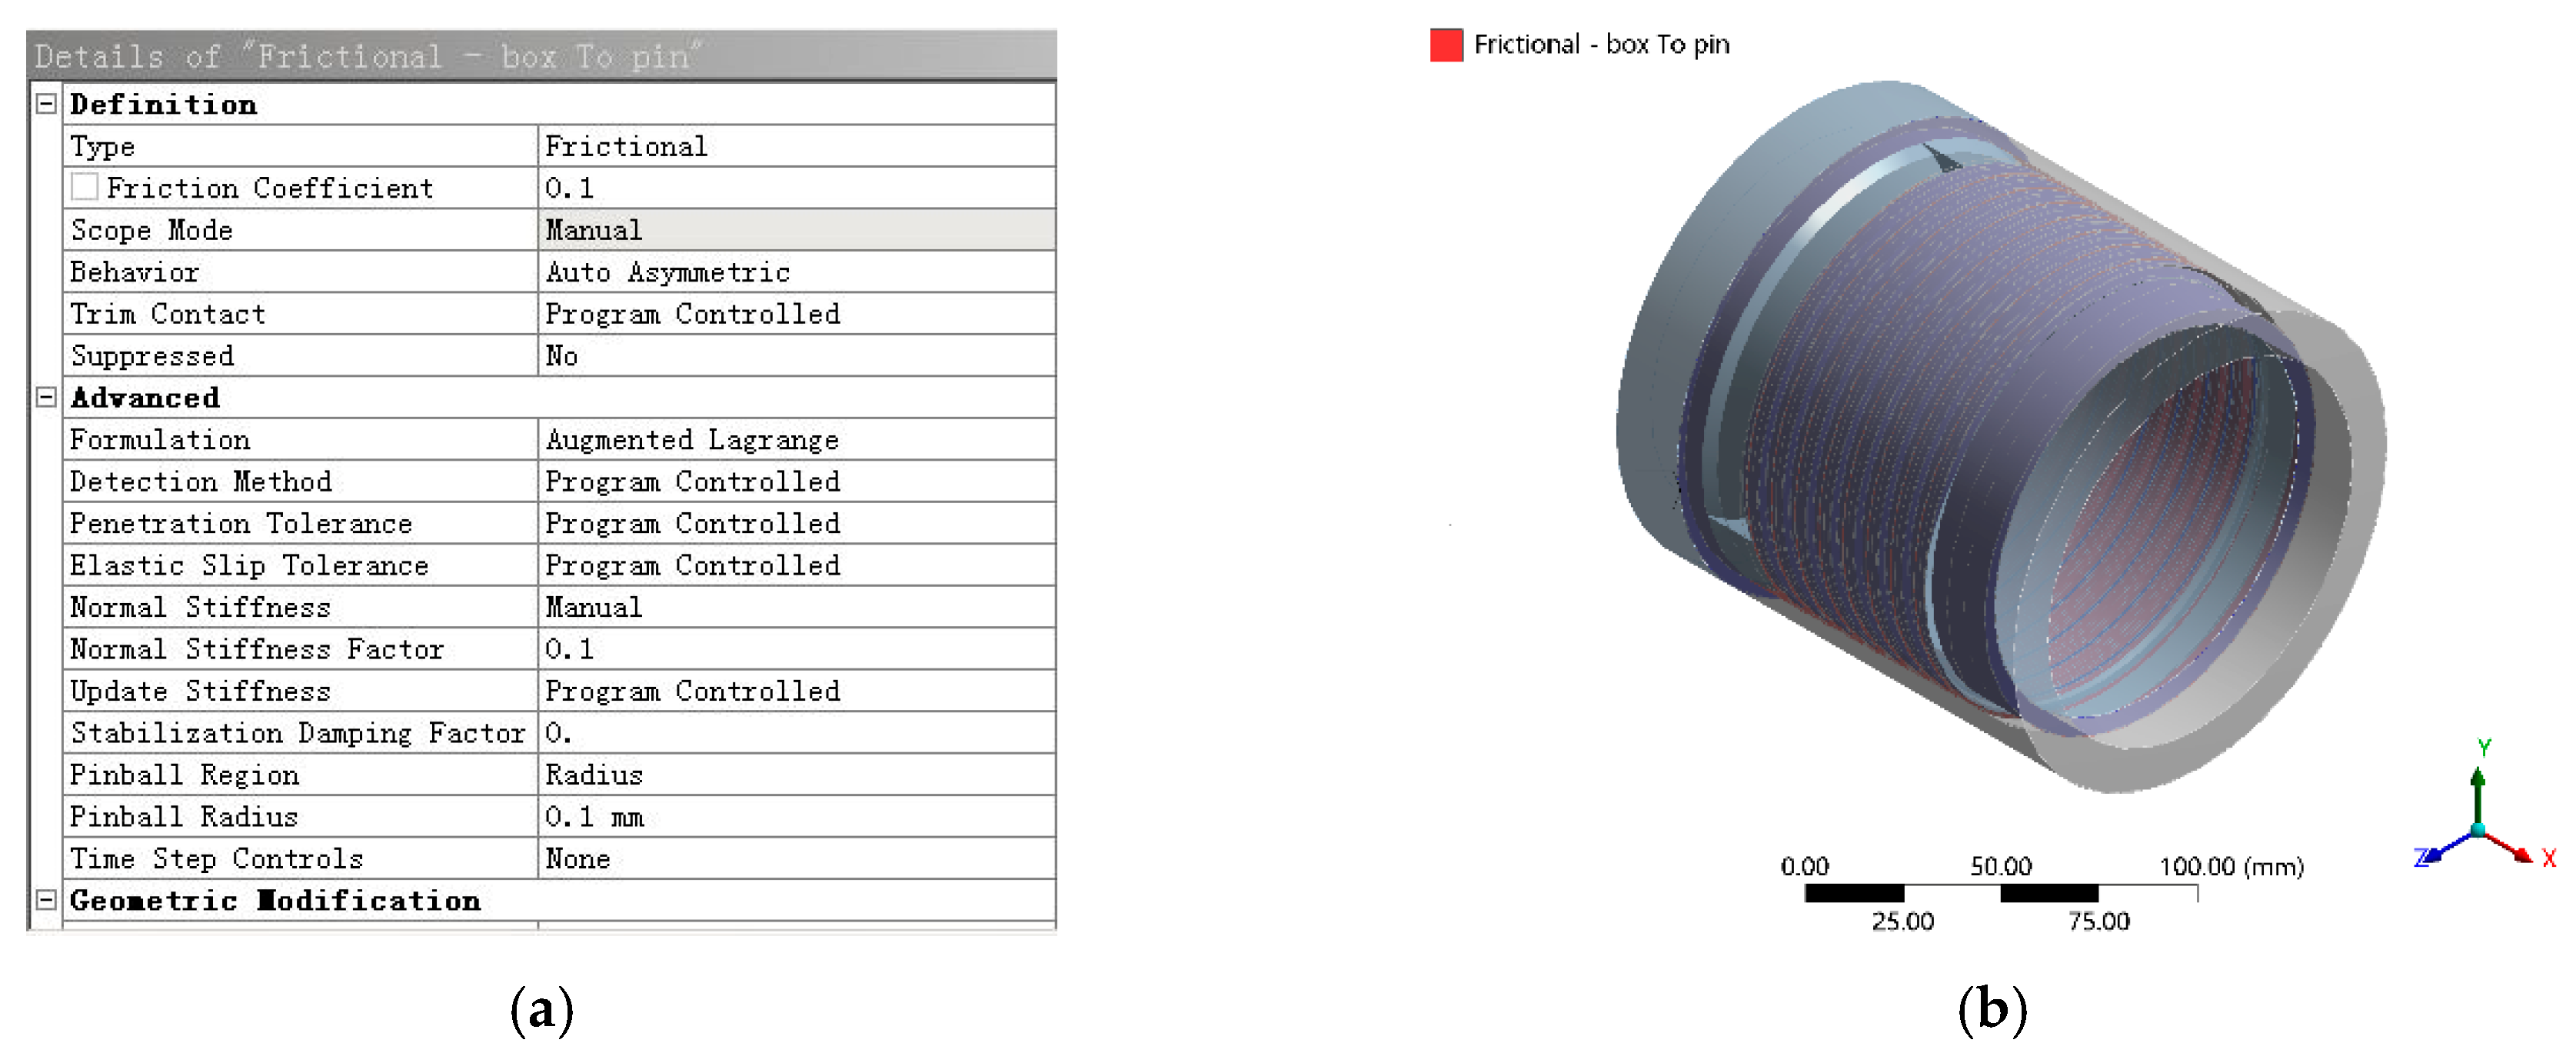
3.3. Contact and Loading Conditions

ANSYS provides five contact modes: bonded, frictionless, no separation, rough, and frictional. The bonded contact model completely binds two contact surfaces, thereby preventing both separation and sliding. The frictionless model defines the friction coefficient between the contact surfaces as zero and allows normal separation. The no separation model allows frictionless sliding over a small area. The rough model is similar to the frictionless model, except that contact sliding between contact surfaces is not allowed. The frictional model defines that there will be shear forces based on the friction coefficient between the contact surfaces. The latter three models are nonlinear contact models. The frictional model was selected in the simulation, as shown in Figure 7. In the simulation, the coefficient of friction between the threads of the pin joint and box joint is set to 0.1, which is the actual coefficient of friction between steel and steel.
After the joints are connected, it is necessary to continue tightening at a certain angle to produce an interference fit, achieve sealing and prevent thread tripping. In the previous study, the interference fit between the threads was achieved by setting the contact offset. In this simulation, the interference fit between the threads was achieved by rotating the pin joint by a certain angle, which is consistent with the actual working conditions. Moreover, the circular cross section of the pin joint is set to the cylinder connection, that is, both the movement and rotation in the x and y directions are prohibited (wherein UX, UY, RX, and RY are constrained). After completing the above settings, the model can be loaded, as shown in Figure 8.

3.4. Effect of the Axial Tensile Load

Of all the loads, the axial load is an important factor affecting the strength of the joint. A. Tafreshi and W.D. Dover [6] compared stress concentration factors values for pin and box under bending, axial and torsional loading. The results showed that stress concentration factors values of axial loading were greater than bending, while for torsion they were very small. A. Baryshnikov et al. [27], through a series of full-scale fatigue tests, indicated that tension loads have a negative effect on the drill pipe and tool joint fatigue behavior.
In actual work, the force acting on the joint is very complicated, including the pressure exerted by the rig, the weight of the joint itself, the buoyancy of the medium and the friction of the core. The force in the joints of a core barrel is generally between 100 and 150 kN. In the case of pulling out in a stuck state, the load may exceed 300 kN. To cover the actual force range, the range of axial tension during the simulation is 100–500 kN. In the simulation analysis of the equivalent stress distribution under the axial load, the constraint condition of the box joint is a fixed constraint, and the constraint condition of the pin joint is a uniform tensile load. The pin joint is subjected to a uniformly distributed tensile load. Figure 9 shows the equivalent stress distribution in the thread when the tensile load is 500 kN.
Figure 9 shows that the equivalent stress concentration occurs at the relief notch because the relief notch is thinner than the threaded section. The equivalent stress in the pin and box joint assemblies decreases from the outside to the inside. For a single joint, the equivalent stress is reduced from the side closer to the inner-shoulder face to the side of the outer-shoulder face.
In order to quantitatively study the stress distributions in the thread, the average equivalent stress and the maximum equivalent stress of each thread are compared. An equivalent stress path, as shown in Figure 10, is inserted into the pin joint under the tensile load. The stress path starts at point 1 along the helix to point 2. Each 360 degree rotation along the stress path is counted as one turn. Then, the sum of the stress values at the nodes is calculated for each turn. These nodes fall on the stress path when meshing. The sum of stress is then divided by the number of nodes to obtain the average equivalent stress on each thread, the results of which are is shown in Figure 11a. The maximum equivalent stress of each circle is shown in Figure 11b. The ordinate represents the average equivalent stress for each turn of the thread, and the number of threads is shown in Figure 6. Figure 11 shows that the distribution characteristics of the average equivalent stress in the thread under different axial tensile loads are as follows: the stress is high at the two ends and low in the middle, and the stress is highest near the inner-shoulder surface. A comparison of the curves shows that when the axial tensile load is low, the stress in each thread is relatively uniform. However, as the tensile load increases, the distribution of the thread stress becomes more uneven. The maximum equivalent stress of the thread has a similar distribution pattern as the equivalent stress, but the fluctuation is significantly larger than the average stress. Both the average stress distribution and the maximum stress distribution indicate that the surface near the first thread is a dangerous section.
When analyzing the stress distribution in the joint under the axial load, the friction between the thread surfaces can be ignored, and the contact surface is considered to have only normal stress. The results shown in Figure 12 were obtained under a tensile force of 500 kN. The compressive stress distribution in the contact surface is shown in Figure 12a. Similarly, the normal stress on the contact surface is also reduced from the inner-shoulder face side to the outer-shoulder side. A cross section of the assembly is shown in Figure 12b. This figure shows that the stress on the inner wall of the pin-joint end is higher than the stress in the thread. Similarly, the stress on the outer wall of the box-joint end is higher than the stress in the thread. Therefore, it can be inferred that when the thread is subjected to an excessive axial tensile load, the inner wall of the pin-joint end and the outer wall of the box-joint end are most likely to experience plastic deformation.
Many scholars have investigated fractured joints at drilling sites and found that joint fractures caused by thread fracture under the combined action of static and alternating loads are the main causes of downhole accidents [28,29]. Further research found that thread fractures generally occurred at the root of the first turn of the pin joint or the root of the last turn of the box joint, indicating that those two parts are prone to stress concentrations [30,31,32]. These results are in good agreement with the above simulation results.

3.5. Effect of the Connection Status

The connection state of the drill pipe joint is an important factor affecting the thread stress distribution. Because the thread has a certain taper, it can be tightened to a greater extent, which will deform the threads and achieve an interference fit, which cannot be achieved by other threads. After the joints are connected, it is necessary to continue tightening at a certain angle to produce an interference fit, achieve sealing and prevent tripping. In this study, the magnitude of the interference of the joint tightened by one turn is 0.099 mm. After trial and error, it is finally determined that the maximum tightening angle is eight degrees, and the pretightening angle actually applied in the simulation is one to eight degrees.
Figure 13 shows the stress distribution in the joint when the pretightening angle is five degrees. Unlike the tensile load, the pretightening angle primarily affects the stress distribution in the joint shoulder. Figure 14 shows a line graph of the average stress in each thread for different pretightening angles. The results show that when the pretightening angle is small, the stress in the thread is relatively uniform. As the tightening angle increases, the thread stress becomes more concentrated at both ends, whereas the thread stress remains lower in the central portion. The results in Figure 11 and Figure 14 are due to stress concentrations caused by the relief notch near the inner-shoulder face. There are relief notches near the inner-shoulder face of the pin and box joints. Therefore, the equivalent stress in the thread presents the following distribution characteristics: high stress at the two ends and low stress in the middle. This shows that the thread near the inner face is the weak point of the joint, which is consistent with previous research results.
Under different pretightening angles, the maximum and minimum axial displacements of the threaded surface, the outer-shoulder surface and the inner-shoulder surface of the box joint are obtained, the results of which are shown in Figure 15. Through an analysis, the maximum displacement of the inner shoulder and the outer shoulder is their interference. The interference of the thread surface is in the opposite direction of the axial displacement, so the absolute value of the minimum axial displacement is the interference.
Figure 15 shows that when the pretightening angle is less than 3.6 degrees, the interference of the outer-shoulder surface is higher than the interference of the thread surface. As the pretightening angle increases, the interference of the thread surface gradually exceeds the interference of the outer-shoulder surface. From these results, it can be inferred that the thread surface is more likely to deform than the shoulder surfaces at both ends. This difference in deformability produces a thread stress that exhibits the distribution characteristics described above.

3.6. Effect of the Structural Parameters

3.6.1. Effect of the Structural Parameters

The structural parameters of the tapered thread include the taper, pitch, lead, helix angle, thread angle, and thread height. The strength of the thread is mainly affected by the taper, thread angle and thread height. The pitch and lead mainly affect the self-locking effect of the thread. Therefore, the effects of three parameters were analyzed: taper, thread height and thread angle. To further explore the degrees of influence of the three parameters on the equivalent stress, an orthogonal analysis was performed for each parameter with the equivalent stress concentration factor as the evaluation standard. The stress concentration factor is defined as
K = M s A s
where K is the stress concentration factor; M s is the maximum equivalent stress, MPa; and A s is the average equivalent stress, MPa.
The maximum equivalent stress and equivalent stress concentration factor under different structural parameters are shown in Table 1. The data in Table 1 were obtained by extracting data from the stress path.
The data in Table 1 show that the maximum stress in the thread is the smallest when the taper is 1:32, and the stress concentration factor is smaller. Therefore, the optimization scheme (i.e., the settings that produce the lowest stress concentration factor) uses a taper of 1:32, a thread height of 2.44 mm, and a thread angle of 15 degrees.

3.6.2. Optimization Scheme of the Joint

The simulation results show that the structural parameters of the thread have a great influence on the stress distribution. Therefore, these three parameters—the taper, thread height, and thread angle—are optimized to produce a more uniform stress distribution.
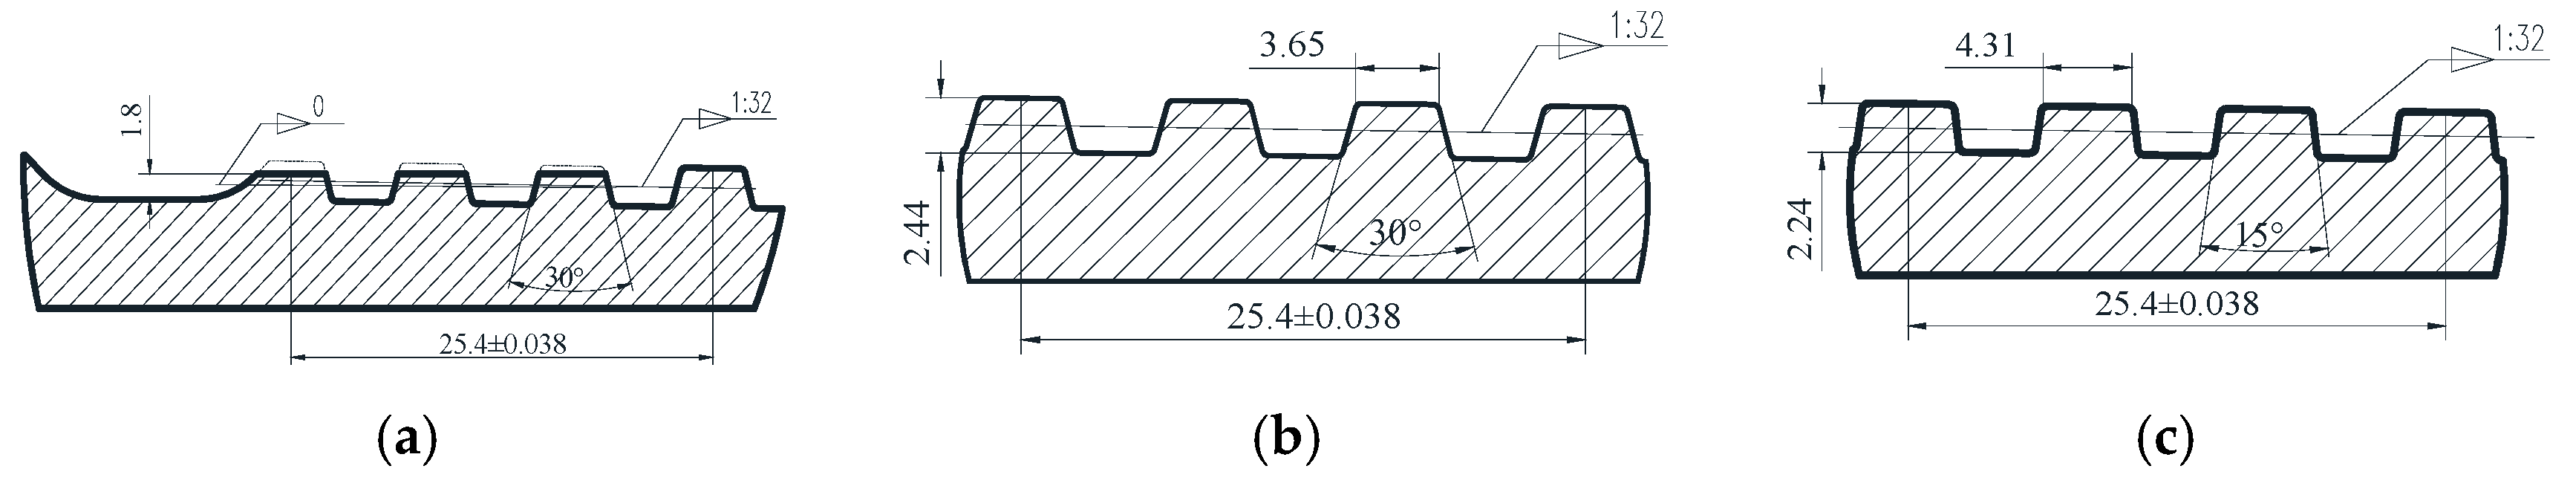
  • Optimum scheme 1—Compound-tapered thread: The simulations show that the stress during the first turn of the thread is the highest in any case. Therefore, reducing the stress in the first turn can make the overall stress distribution more even. The smaller the taper is, the smaller the stress, so the thread near the inner shoulder is designed to create a smaller taper. Cut the top surface of the thread near the inner shoulder to the same height so that the taper is zero and the rear thread taper is unchanged, as shown in Figure 16a. This turns the thread into a compound taper of 0 + 1:32. This turns the thread into a compound taper. The simulation results show that the thread stress concentration factor is 2.97, which is 15% lower than that before optimization.
  • Optimum scheme 2—Increased thread height: The simulation results show that the stress concentration factor of the thread decreases as the thread height increases. By increasing the thread height to 2.44 mm while keeping the other parameters constant, as shown in Figure 16b, the thread stress concentration factor is 3.39, which is 1% lower than that before the optimization.
  • Optimum scheme 3—Reduced thread angle: According to the simulation results, the stress concentration factor of the thread decreases as the thread angle decreases. By decreasing the thread angle from 30 degrees to 15 degrees while keeping the other parameters constant, as shown in Figure 16c, the thread stress concentration factor is 2.89, which is 18% lower than that before optimization.

4. Experiment and Discussion

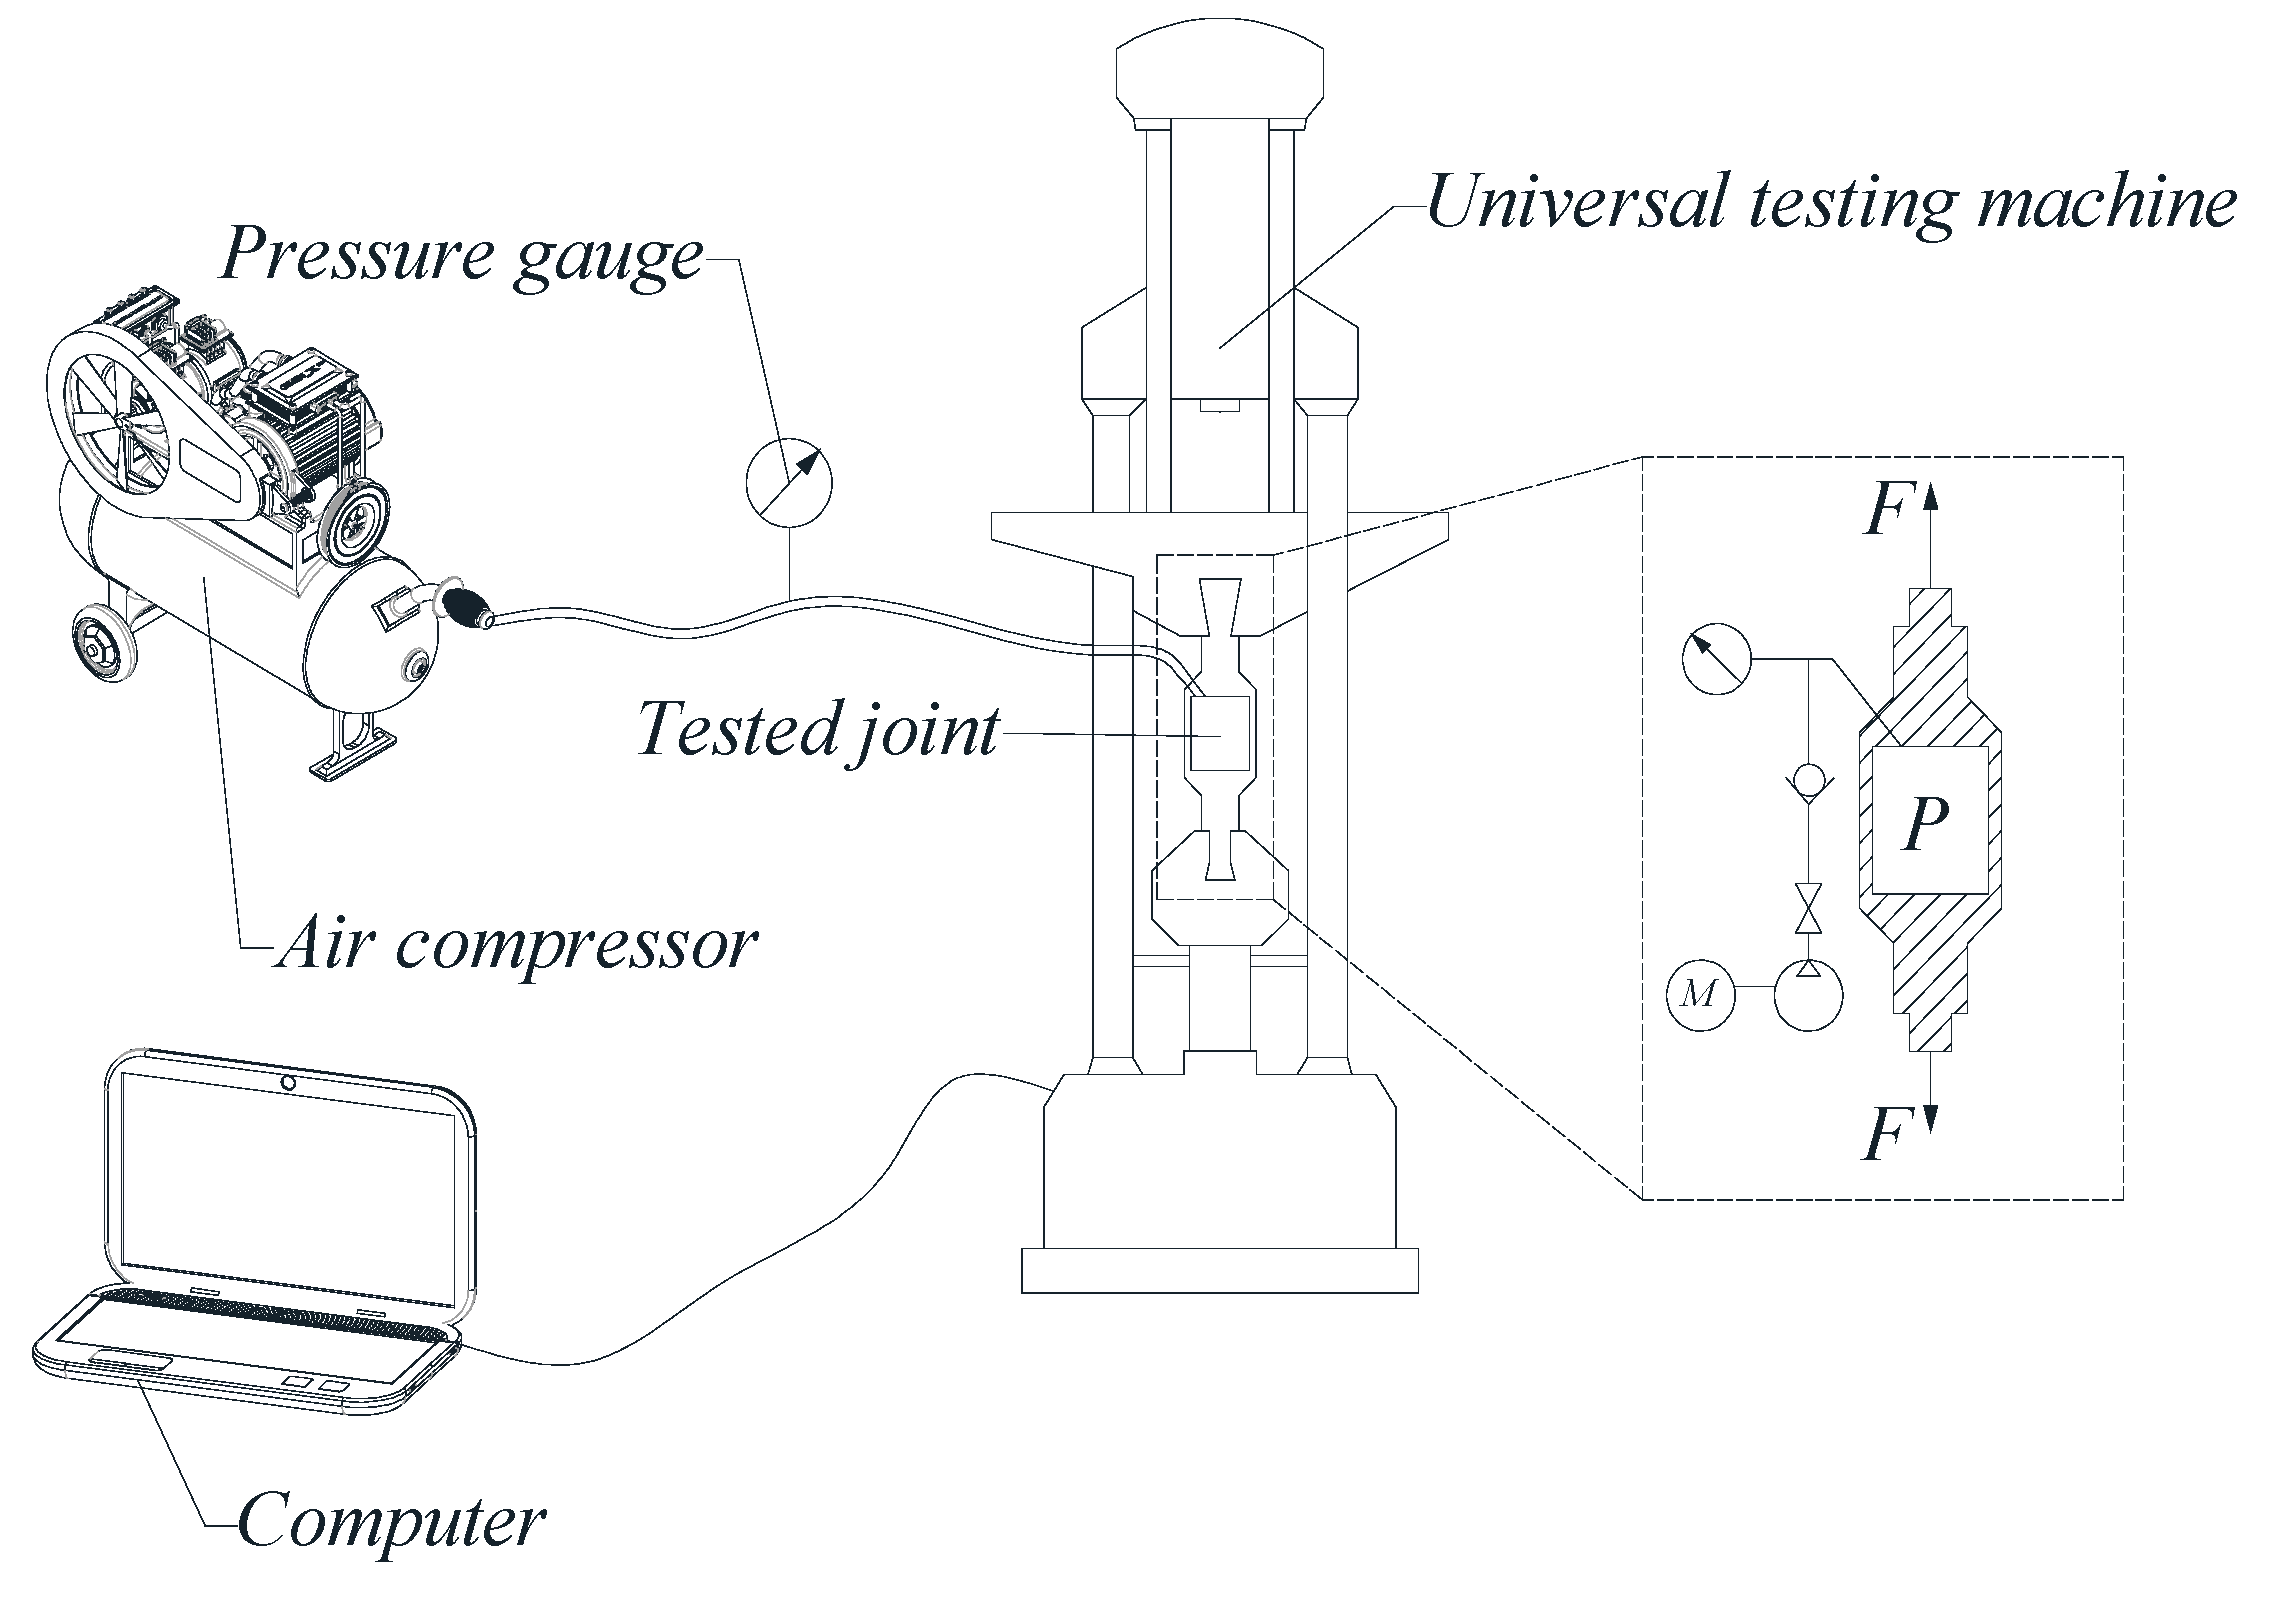
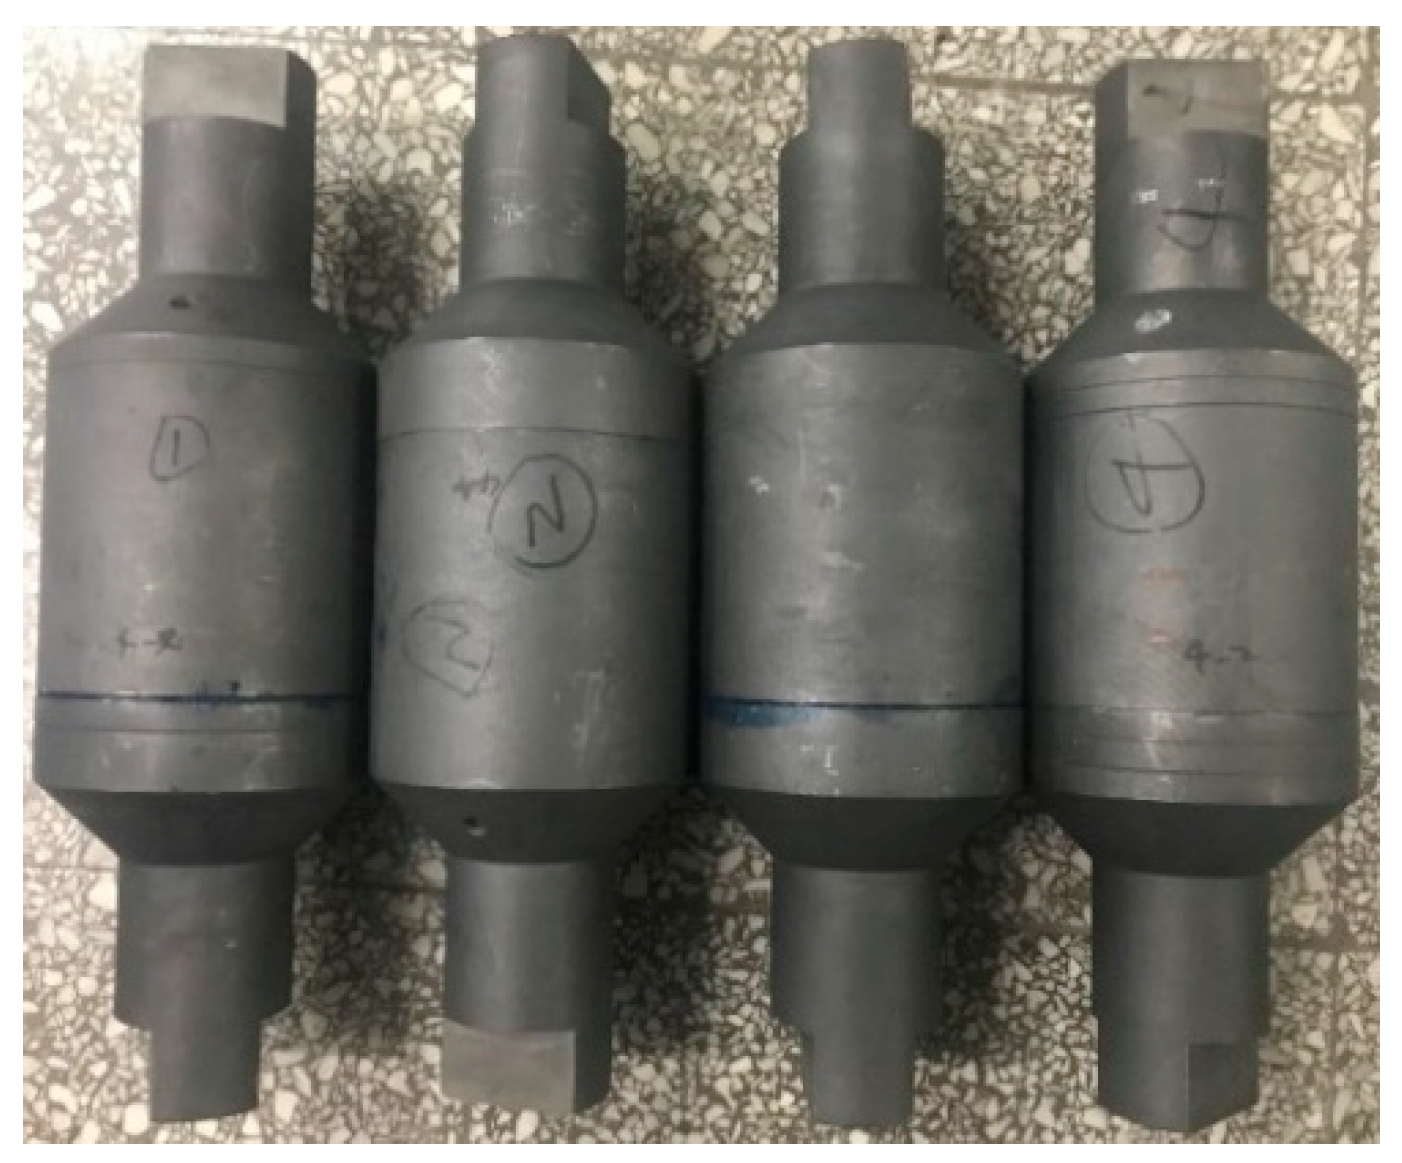
4.1. Experimental Platform

Owing to the complicated structure of the thread, the stress distribution in the engaging surface of the thread cannot be measured by a strain gauge. However, the thread will deform after being loaded. When the deformation reaches a certain level, the sealing of the thread will fail. If a pressurized gas is filled in the cavity of the joint, the gas will leak through the spiral passage of the thread. By measuring the pressure in the chamber, the small thread deformation can be converted into a change in the pressure reading. Accordingly, the sealing performance of the thread can be evaluated by the change in the pressure reading. Therefore, the relationship between the axial load and the seal of the thread can be obtained.
Figure 17 shows a schematic diagram of the experimental platform used to perform the tensile tests. The tests are performed on a WAW-2000 DL electrohydraulic servo-controlled universal testing machine, which can provide a maximum tensile force of 2000 kN. The air compressor (model: W-1/8) can provide a maximum air pressure of 1.5 MPa. To ensure the safety of the experiment, the pressure of the gas in the joint cavity during the tensile test is 0.6 MPa. Thus, the air compressor can meet the requirements of the experiment. The tensile load and crosshead displacement of the universal testing machine are collected and processed by the computer. The test piece subjected to the tensile test is shown in Figure 18. The test piece consists of two parts: a pin joint and a box joint. When the two parts are connected, a closed cavity is formed inside. An air injection port is provided in the wall of the box joint, through which a certain air pressure can be injected into the cavity. A clamping surface, which is designed to be gripped by the universal testing machine, is provided at both ends of the joint. In this study, four different threaded joints were tested: optimization scheme 1, optimization scheme 2, optimization scheme 3 and the original design. For better sealing, grease is evenly applied to the threads before joining. The prepared test samples are shown in Figure 19. The main parameters of each group of threads are shown in Table 2.

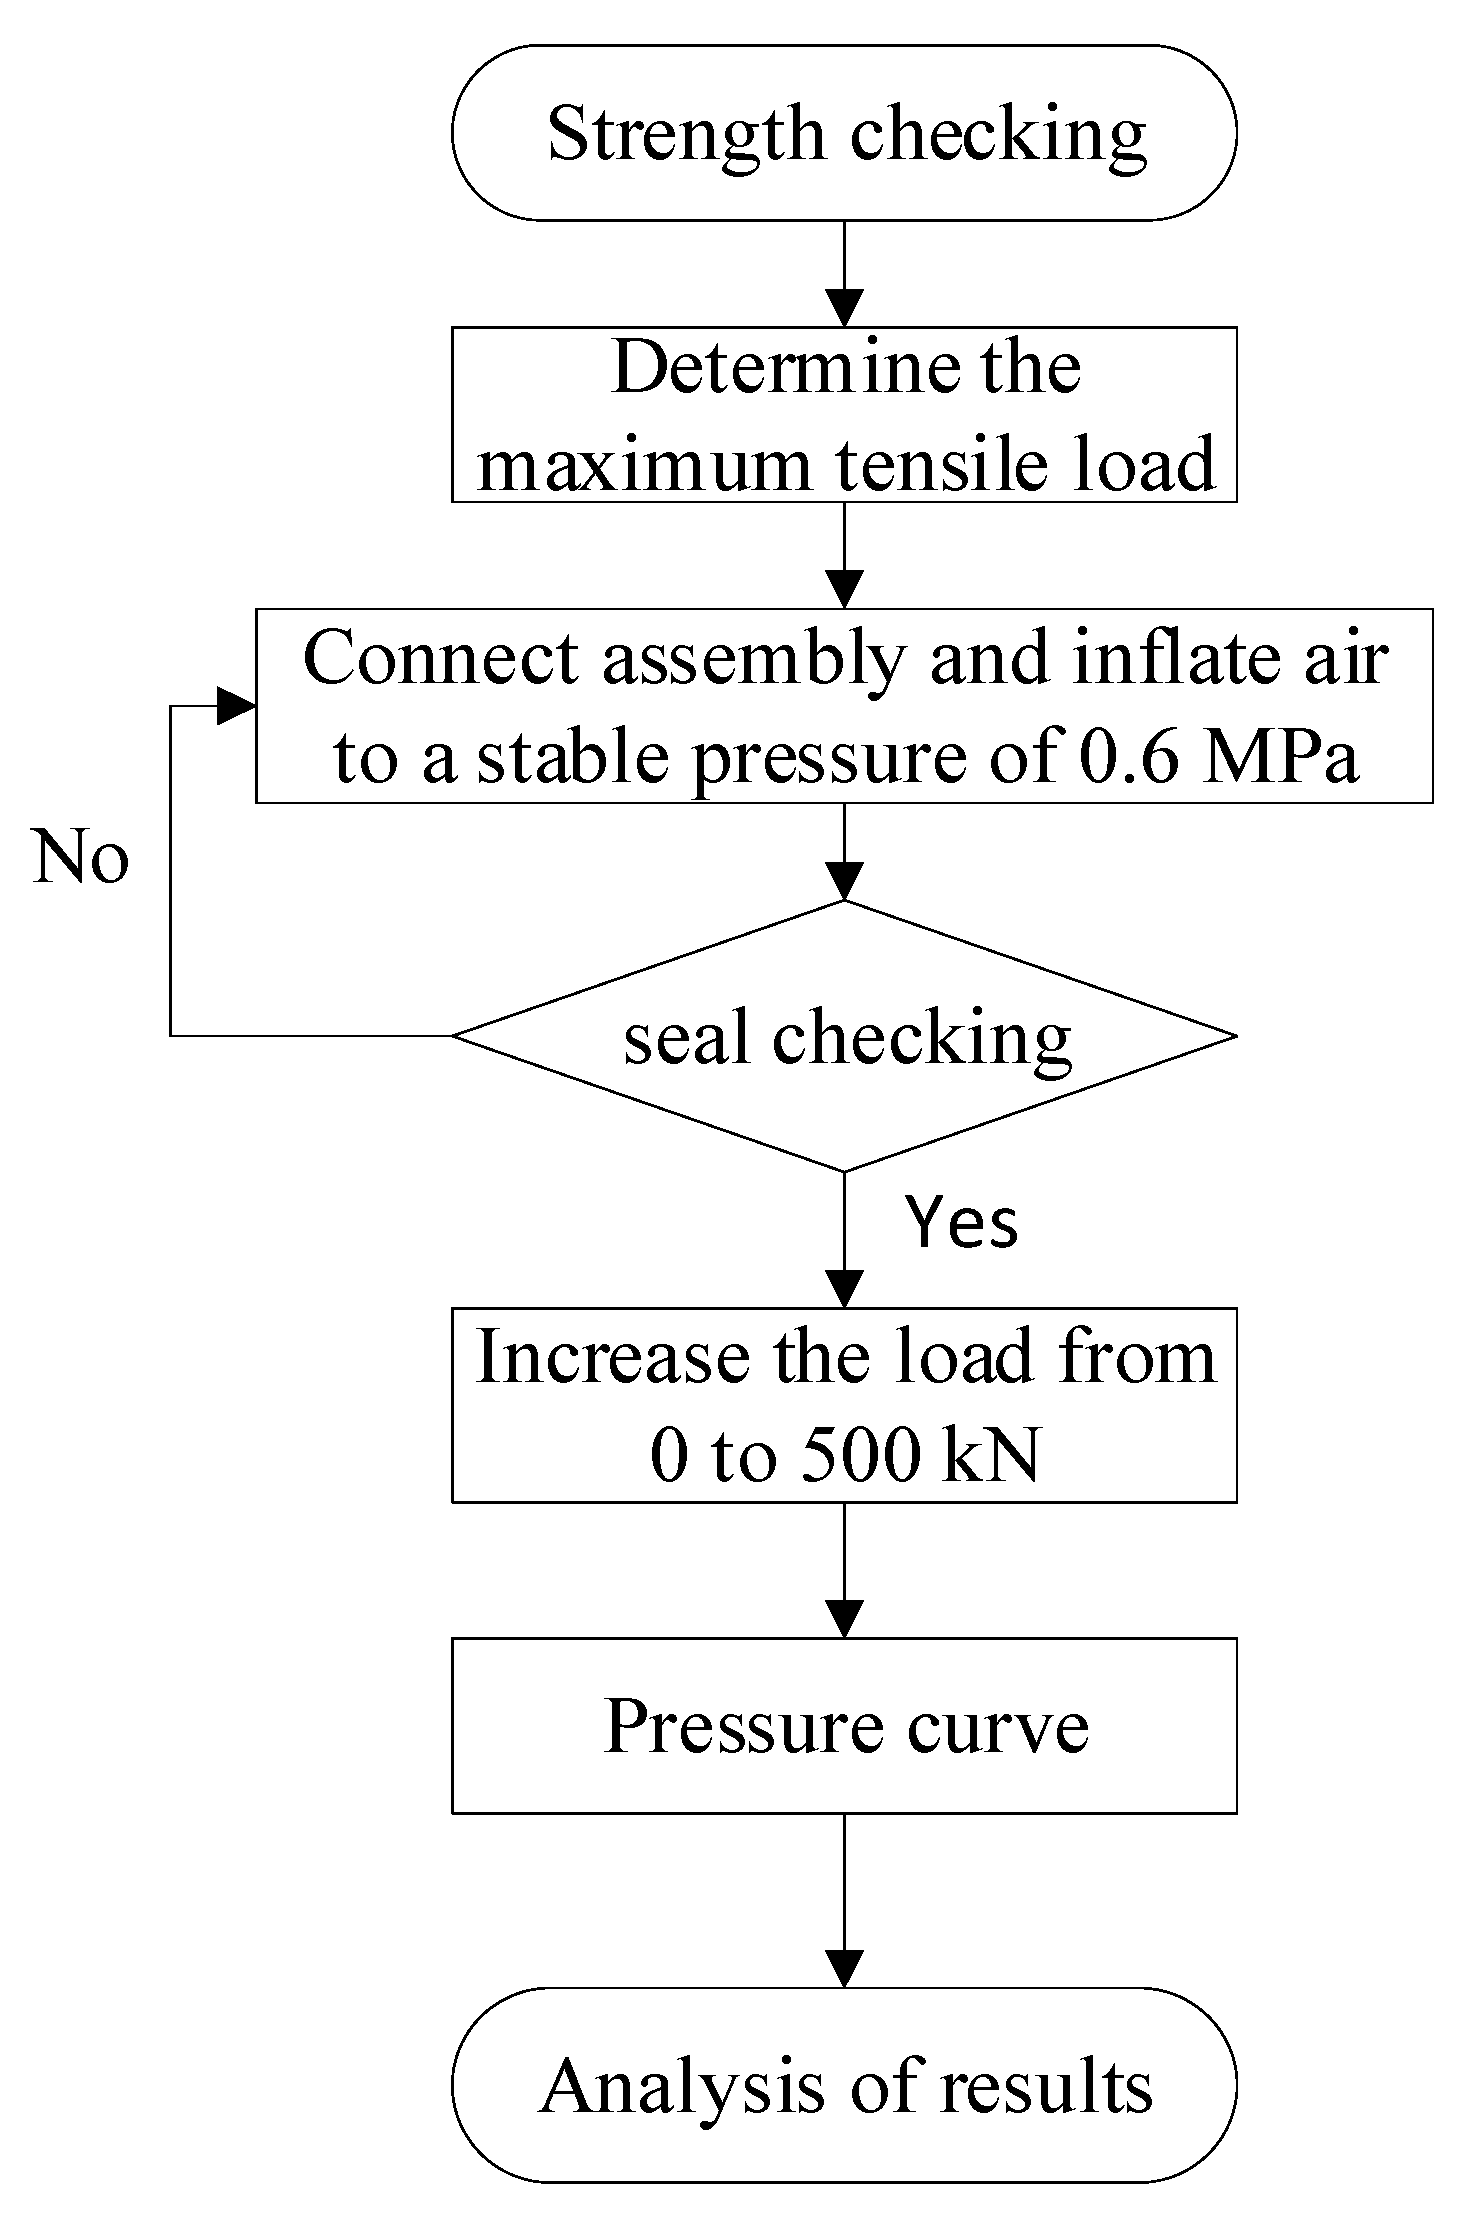
4.2. Experimental Process

Owing to the dry surface of the joint threads, a small amount of threading dope needs to be applied for lubrication before connection. In order to minimize the influence of the thread dope on the experiment, the thread dope was evenly applied and then wiped clean with a dry cloth.
It is important to check the sealing and leak points of the joint before performing the tensile test. The check method is to immerse the connected, gas-filled joint in a water tank and observe whether bubbles emerge. If a leak occurs, this sample will be discarded and replaced with a new sample and test the new joint again. The tensile test can be performed after the sample is successfully prepared. The experimental process is shown in Figure 20. The test procedure is as follows:
(1)
Adjust the two grips of the universal testing machine to the appropriate distance and install the sample.
(2)
Connect the air injection port on the joint to the outlet of the air compressor and fill the cavity with compressed air. After the pressure gauge reading stabilizes at 0.6 MPa, close the valve between the air pressure gauge and the air compressor.
(3)
Allow the sample to stand for 10 min while continuously observing the pressure readings. If there is no significant change in the pressure gauge reading, indicating that no leak has occurred, and then proceed to the next step. However, if the pressure is significantly reduced, indicating a leak, replace the joint.
(4)
Set the tensile force of the universal testing machine to 500 kN, the crosshead displacement rate to 5 mm/min, and the saturation loading time to 5 min.
(5)
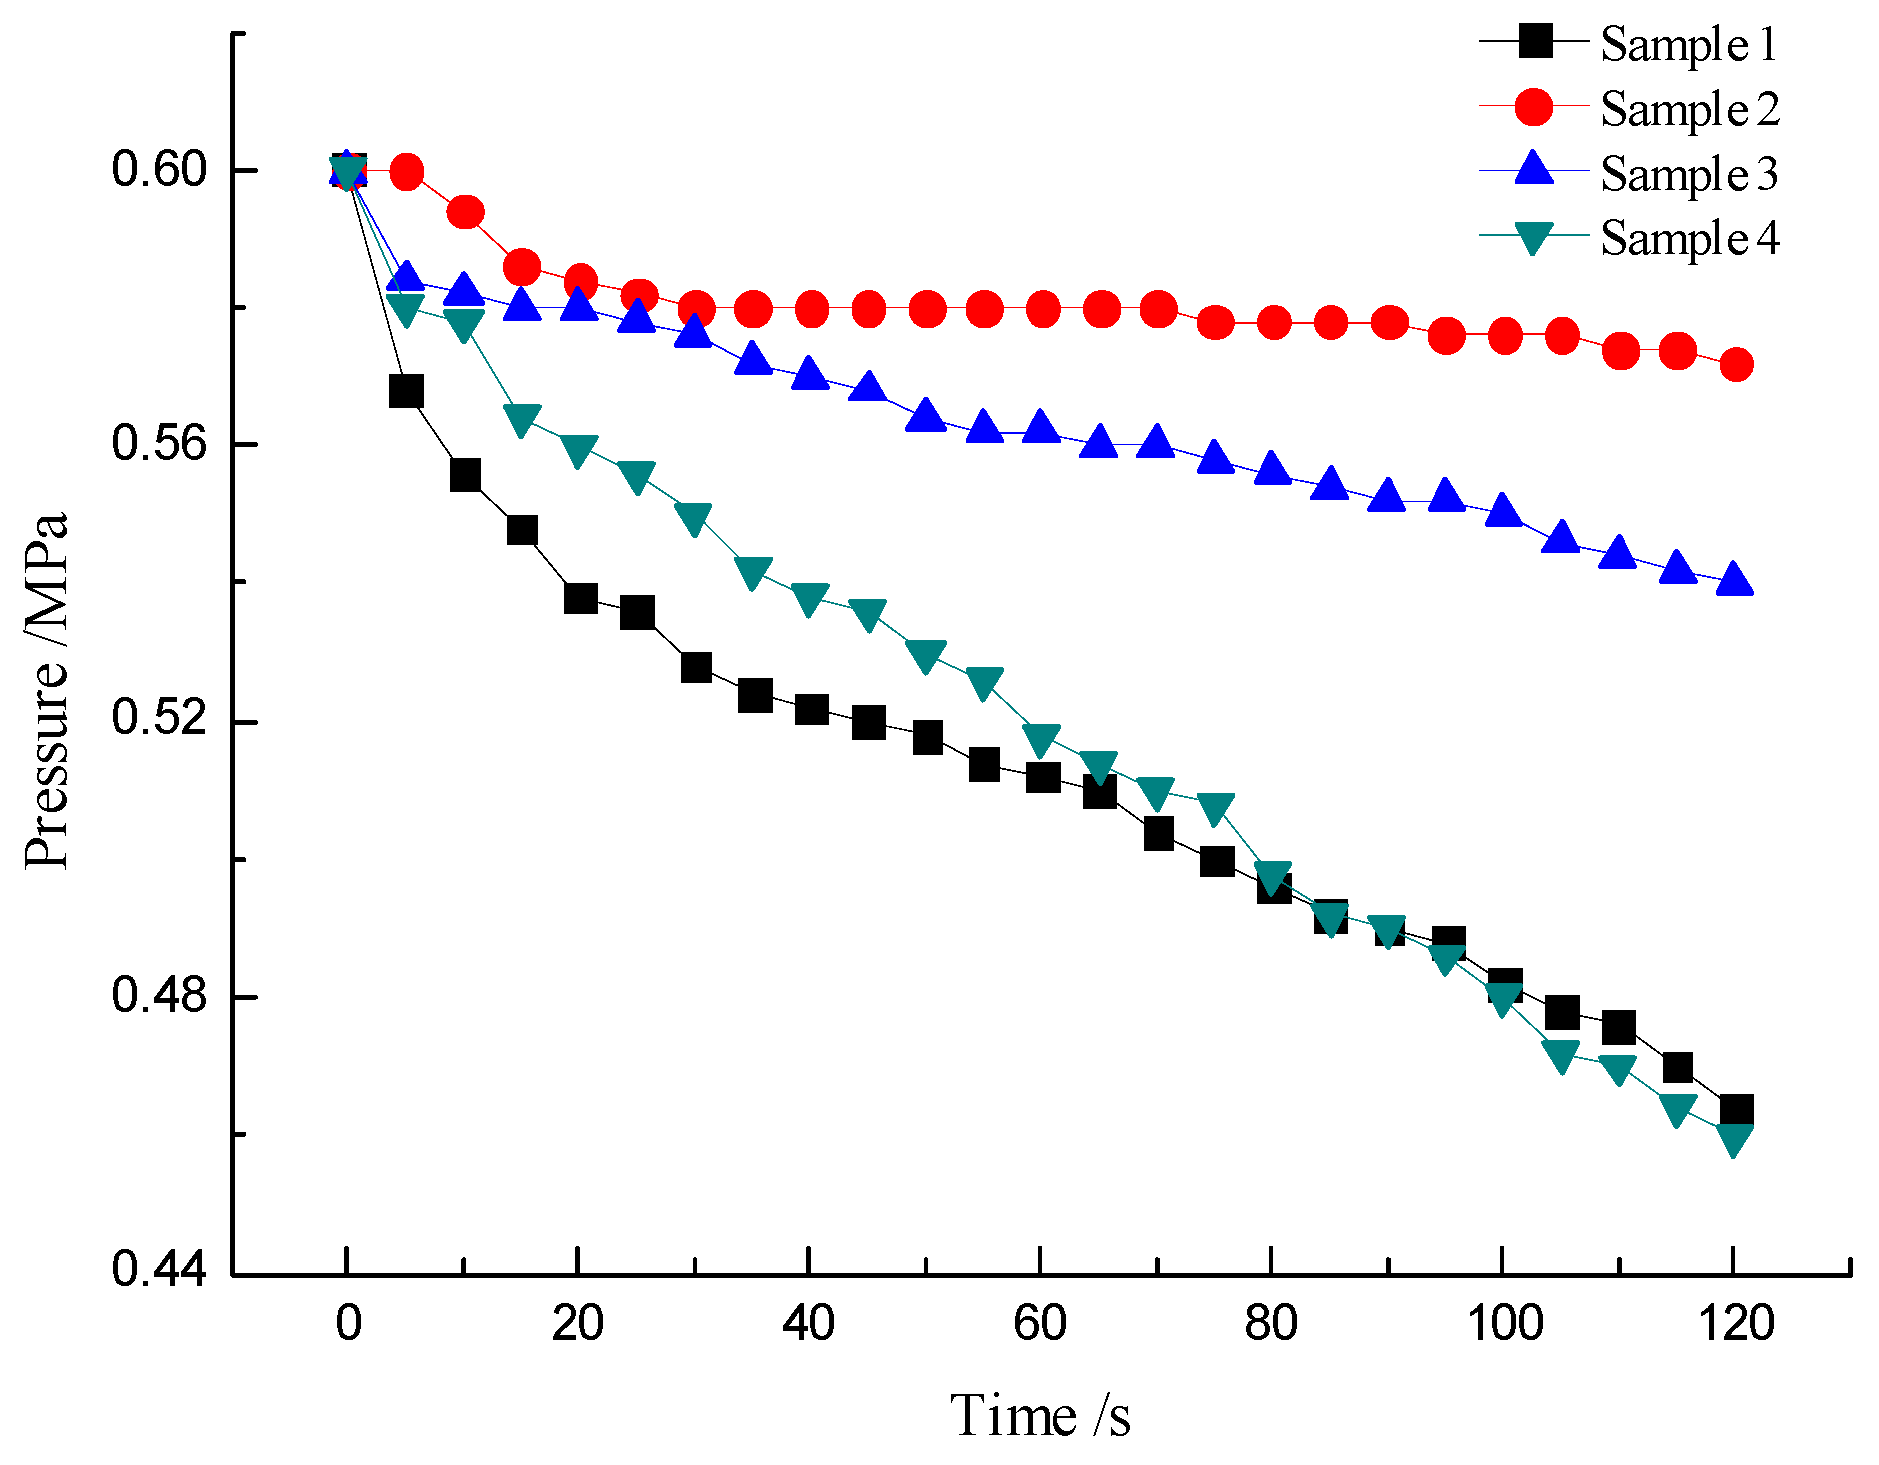
Start the universal testing machine. As the tensile force increases from 0 to 500 kN, the pressure gauge value is read every 5 s. During the loading phase, a 0.02 MPa change in the pressure gauge reading indicates the formation of the initial leakage. Therefore, the tensile force that corresponds to this stress reduction is recorded as the initial leakage tensile force. During the load saturation phase, the gauge values are read every 30 s.
(6)
After reaching the saturated loading time, the universal testing machine is unloaded, after which the grips are opened and the sample is replaced. Repeat steps 1 through 5 for the next set of experiments.

4.3. Experimental Results and Discussion

The seal of the joint is achieved by an interference fit between the inner and outer shoulders. When the joint thread is subjected to a tensile load, if the mating surface is separated, gas leakage will occur. The greater the gas leakage, the greater the deformation of the thread.
Figure 21 shows the relationship between the change in the gas pressure over time during loading. It can be seen from the figure that in the initial stage, only the pressure of sample 2 did not decrease significantly, while the other samples showed a significant decrease. Comparing the entire loading phase, it can be seen that the curve of sample 2 is the most gradual, while the curves of sample 1 and sample 4 are steep. This shows that the thread with the composite taper structure has the best sealing performance, which indirectly reflects that the composite taper thread has a good ability to resist the axial tensile load.

5. Conclusions

Combining the results of the simulation analysis with the experimental data, the following conclusions can be drawn from this study:
(1)
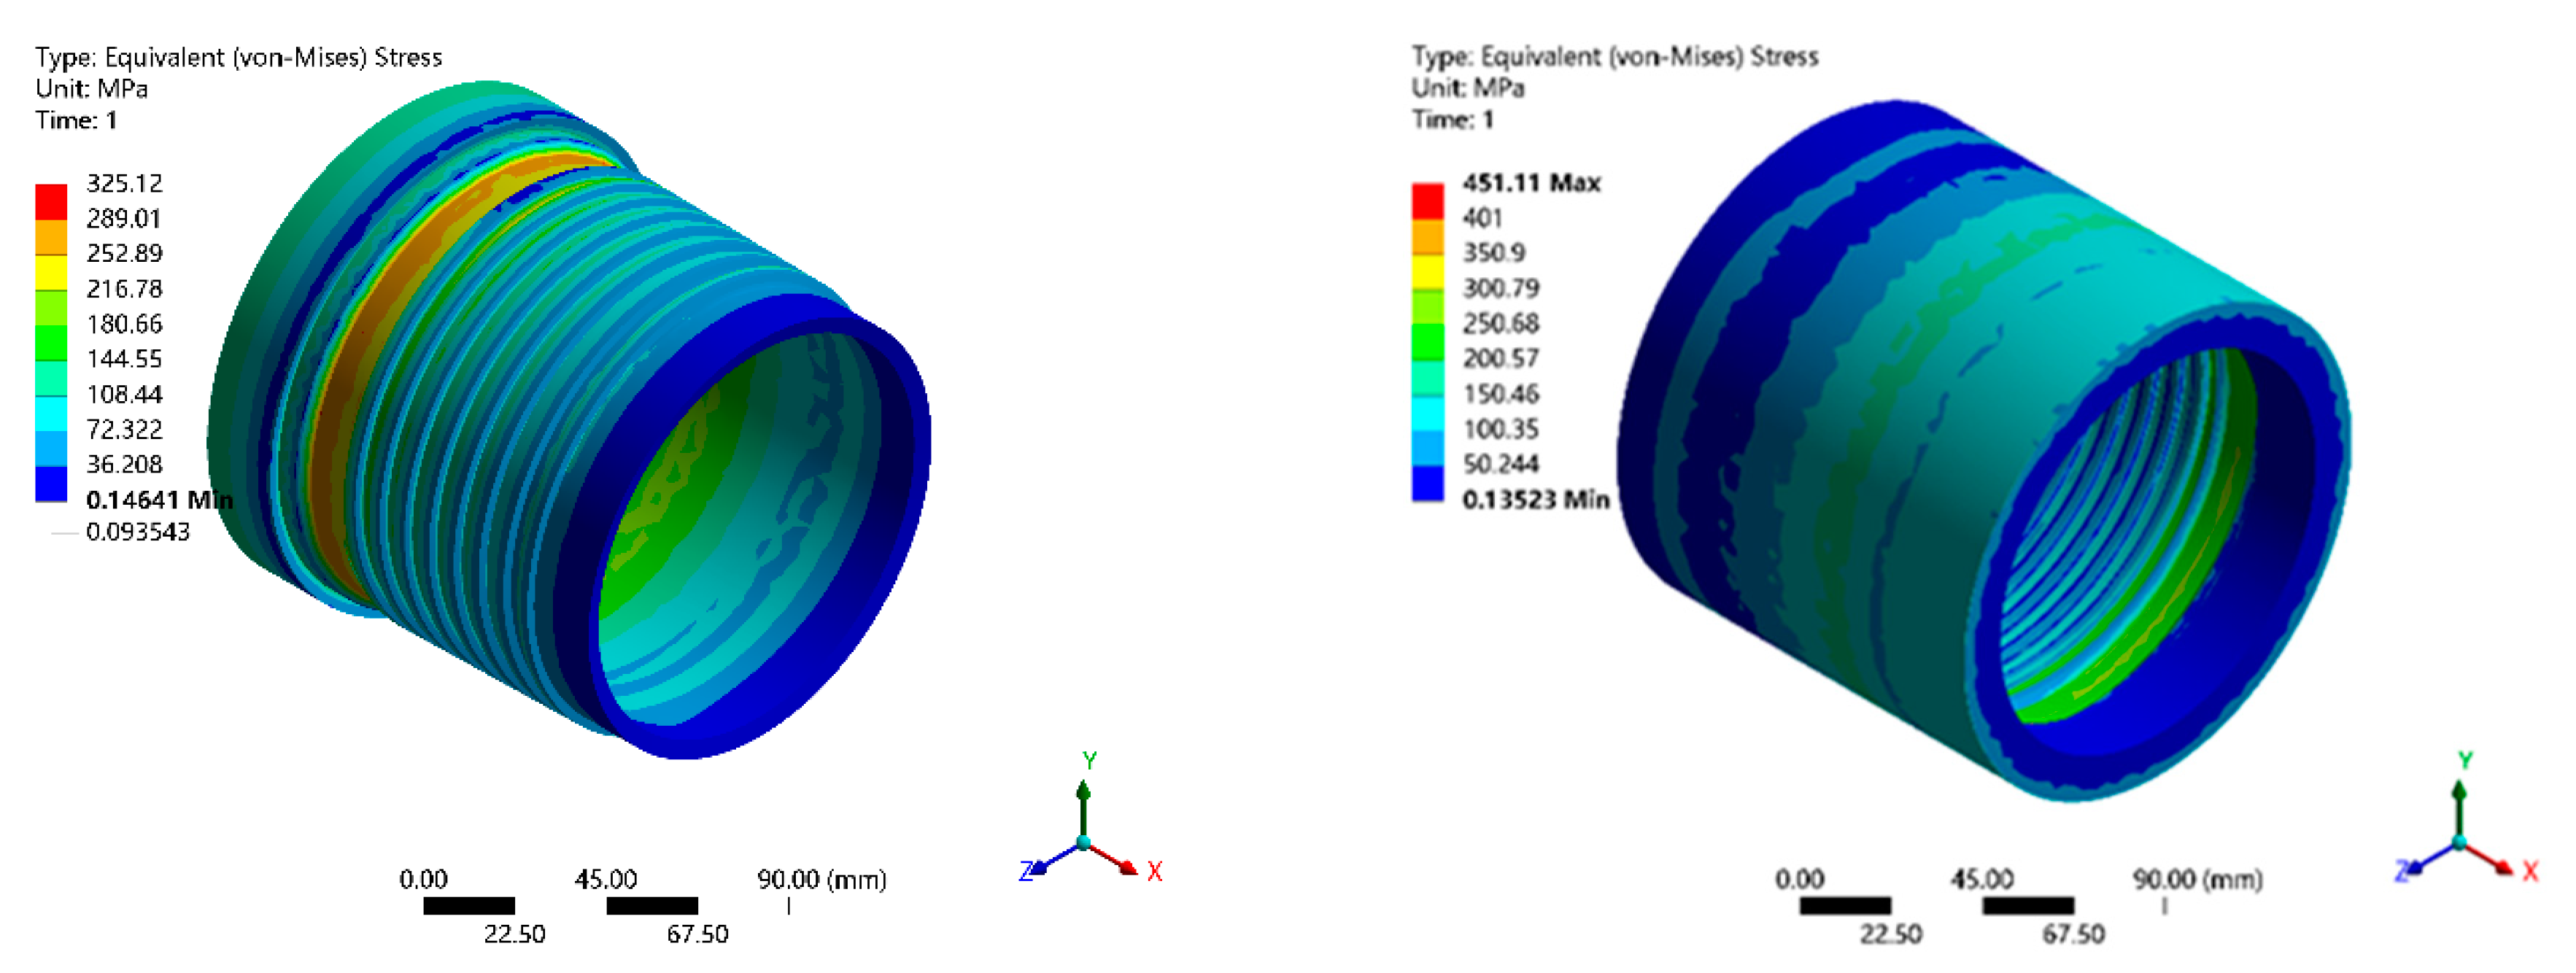
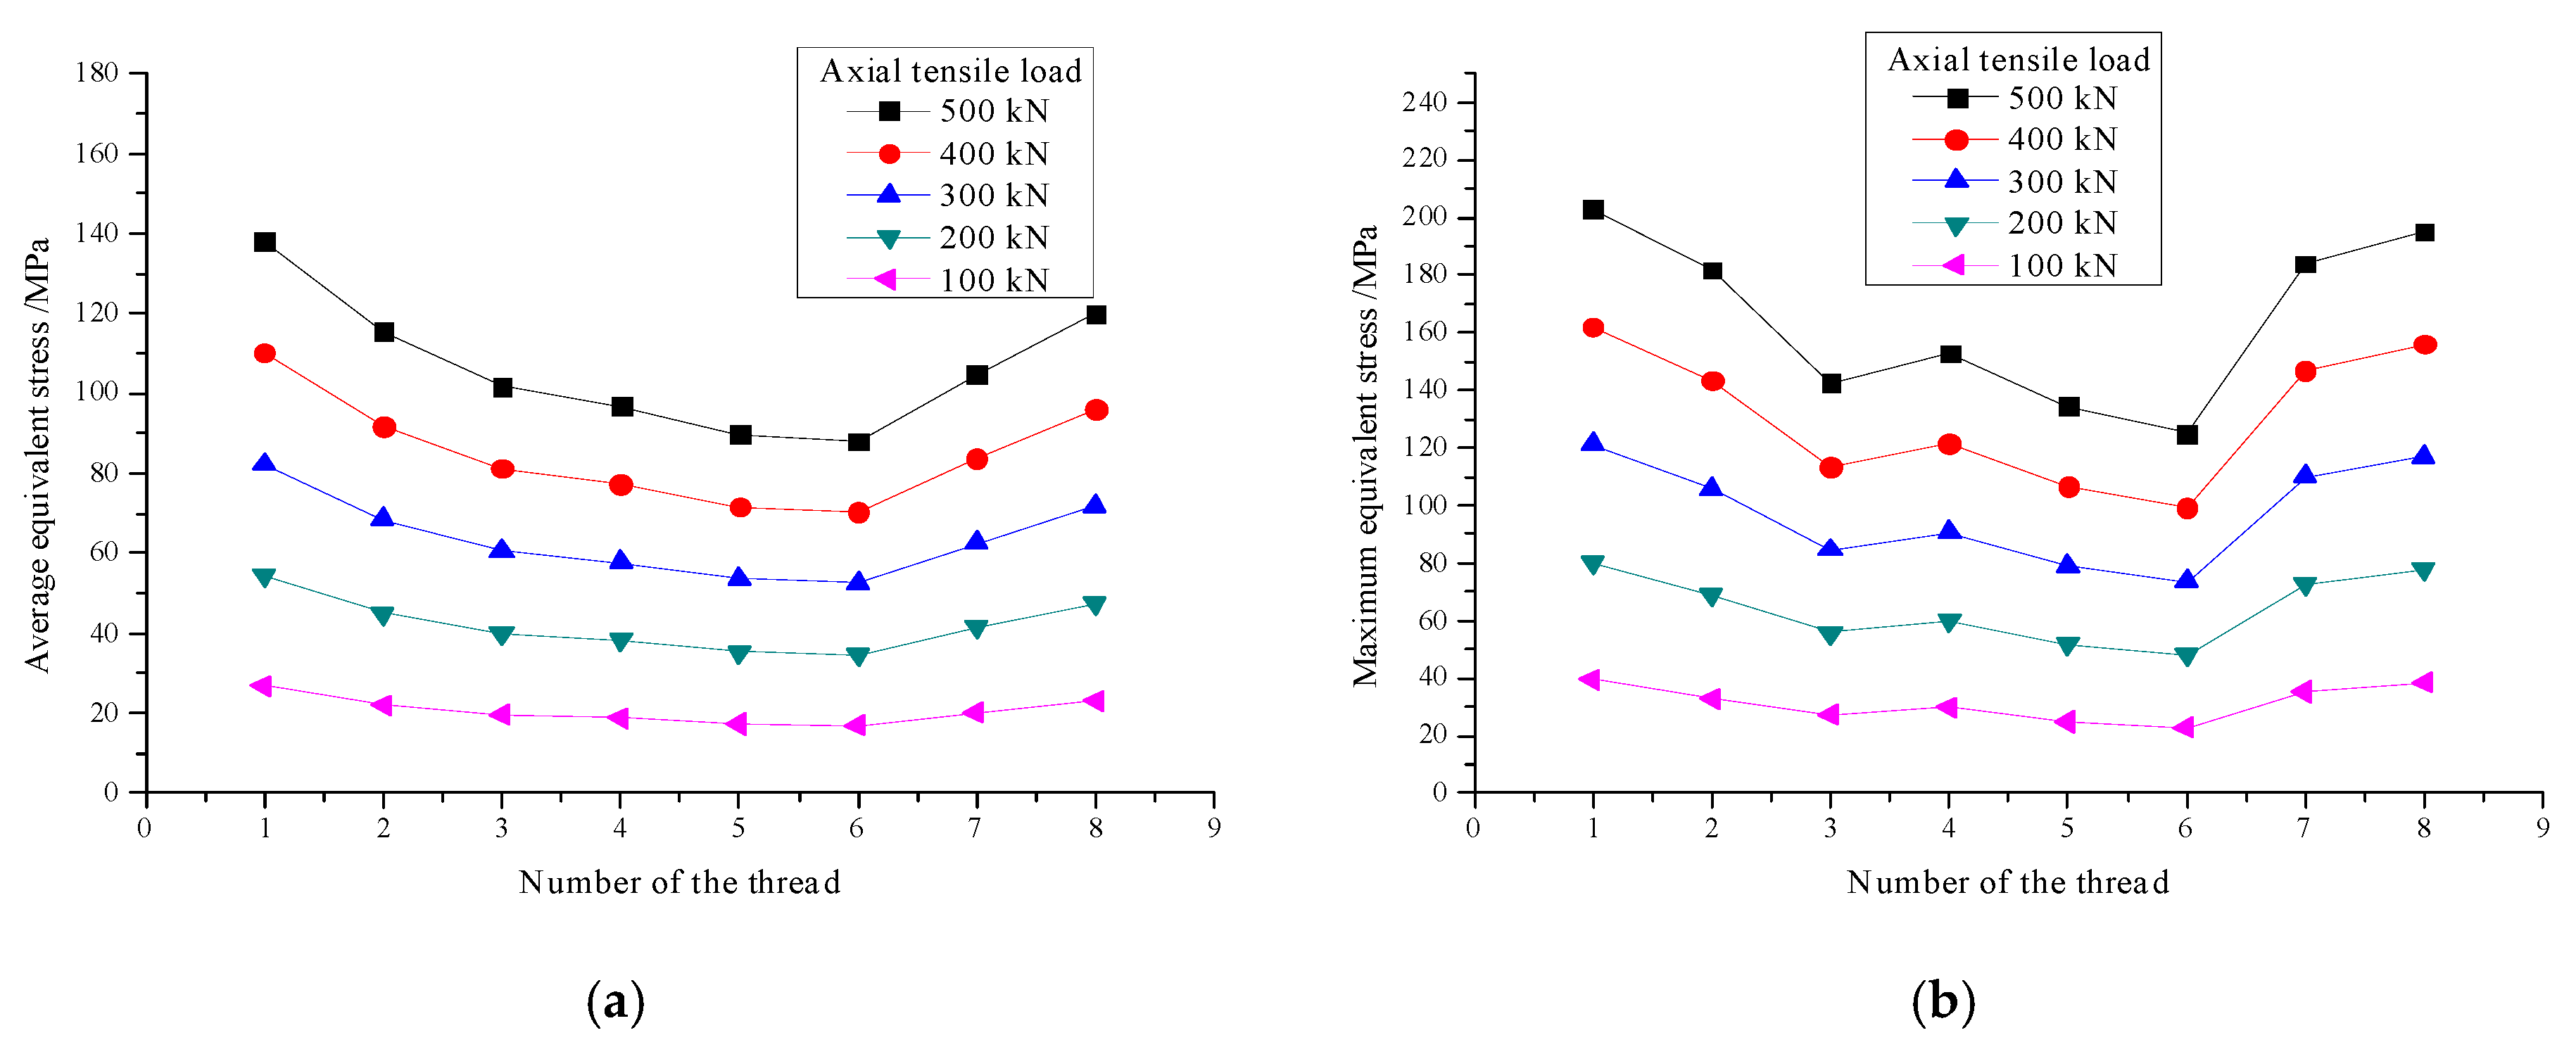
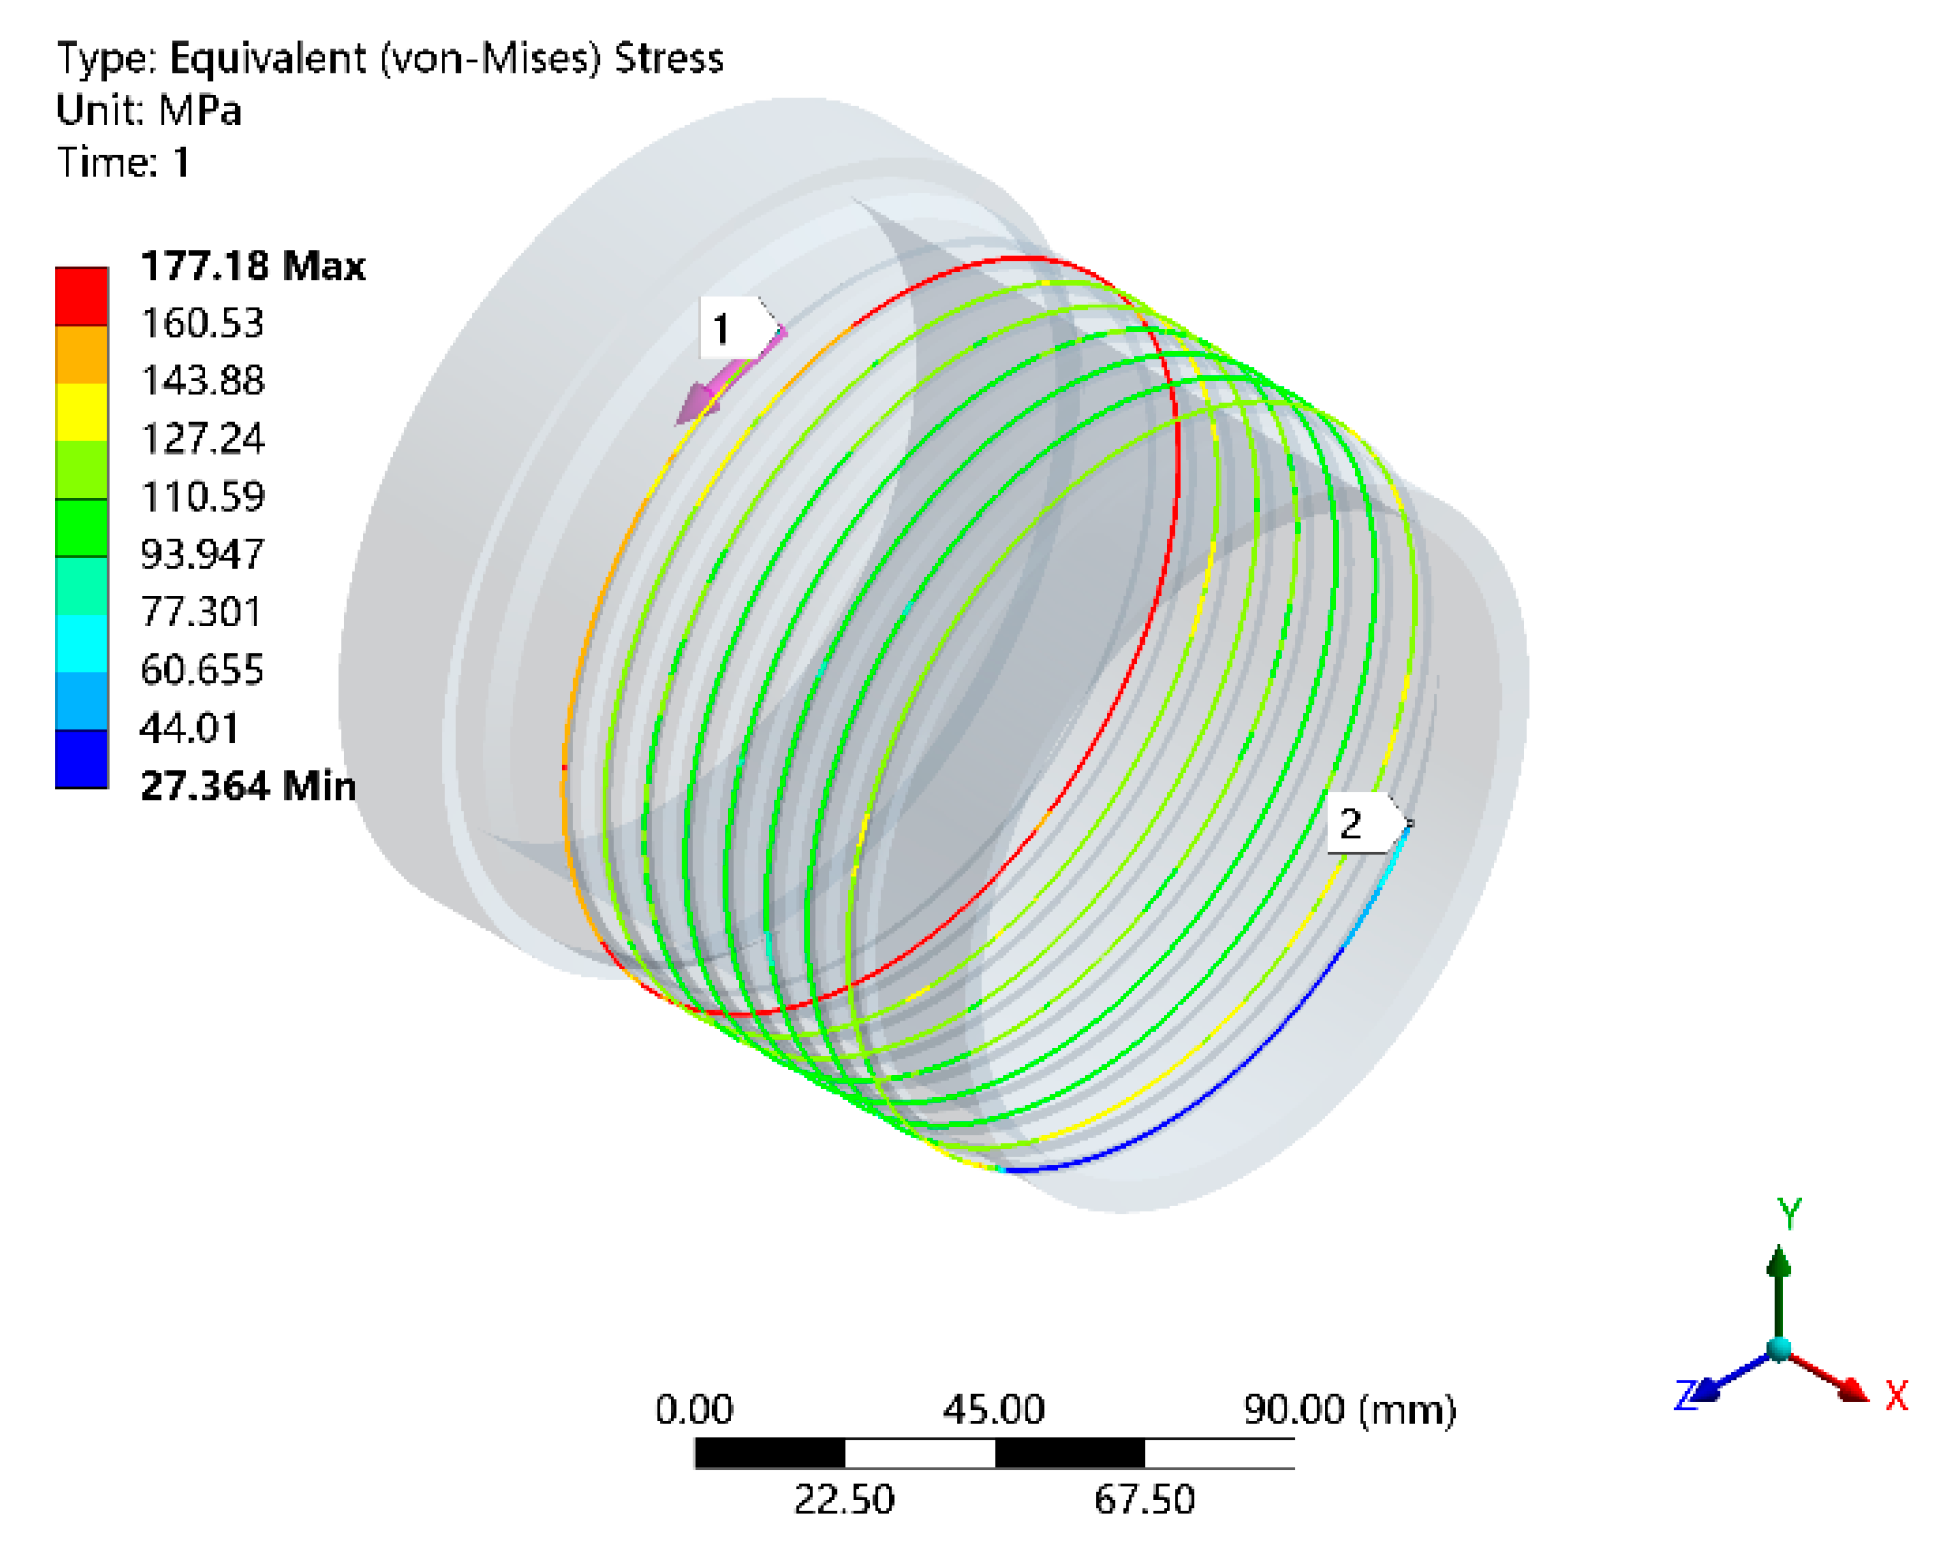
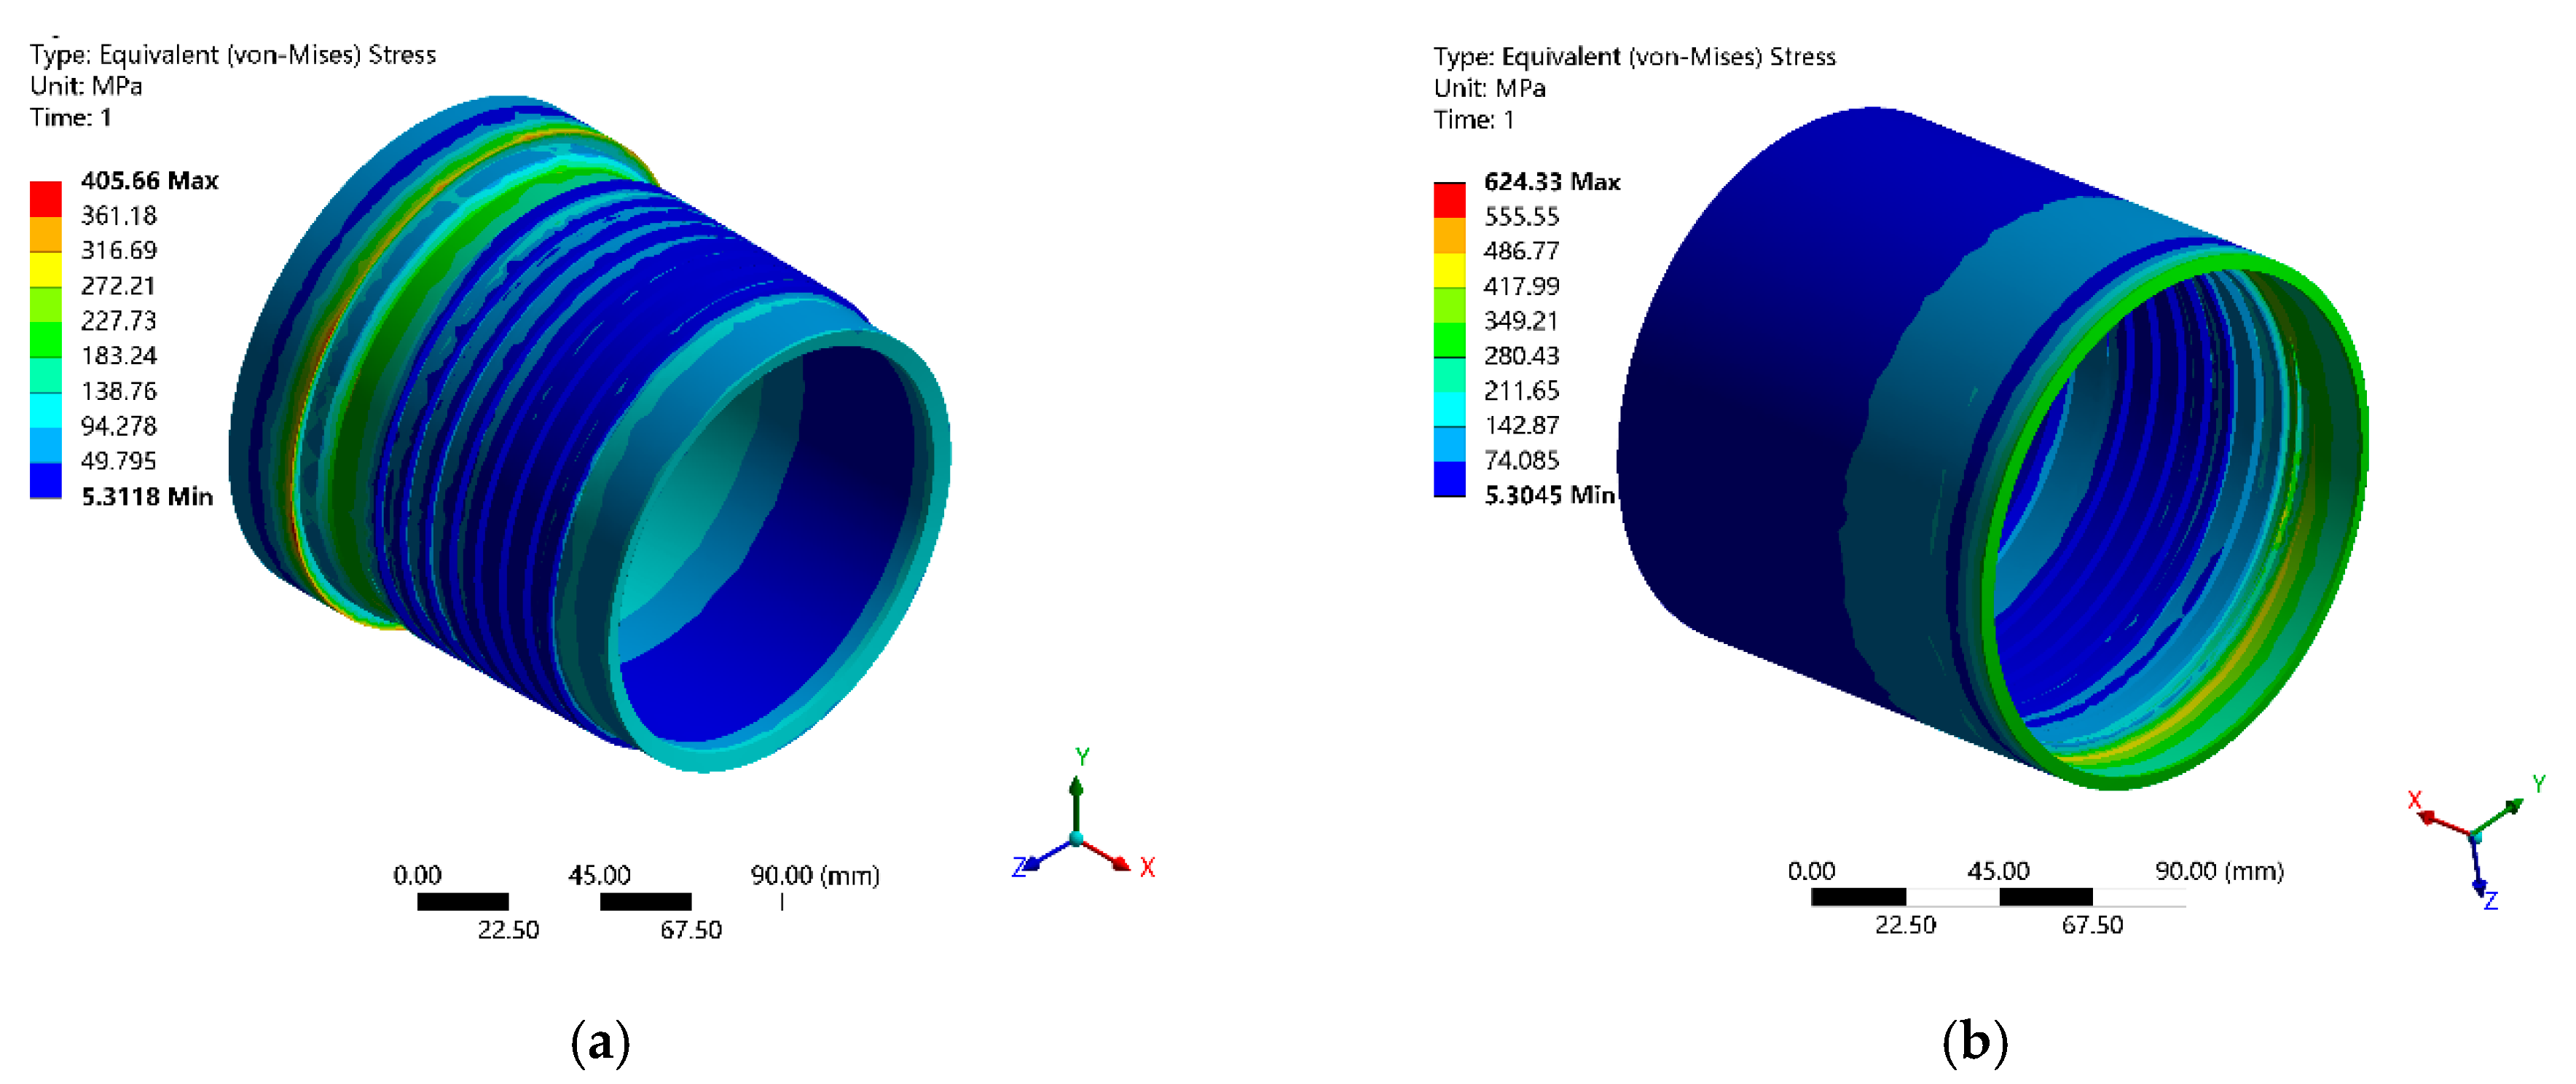
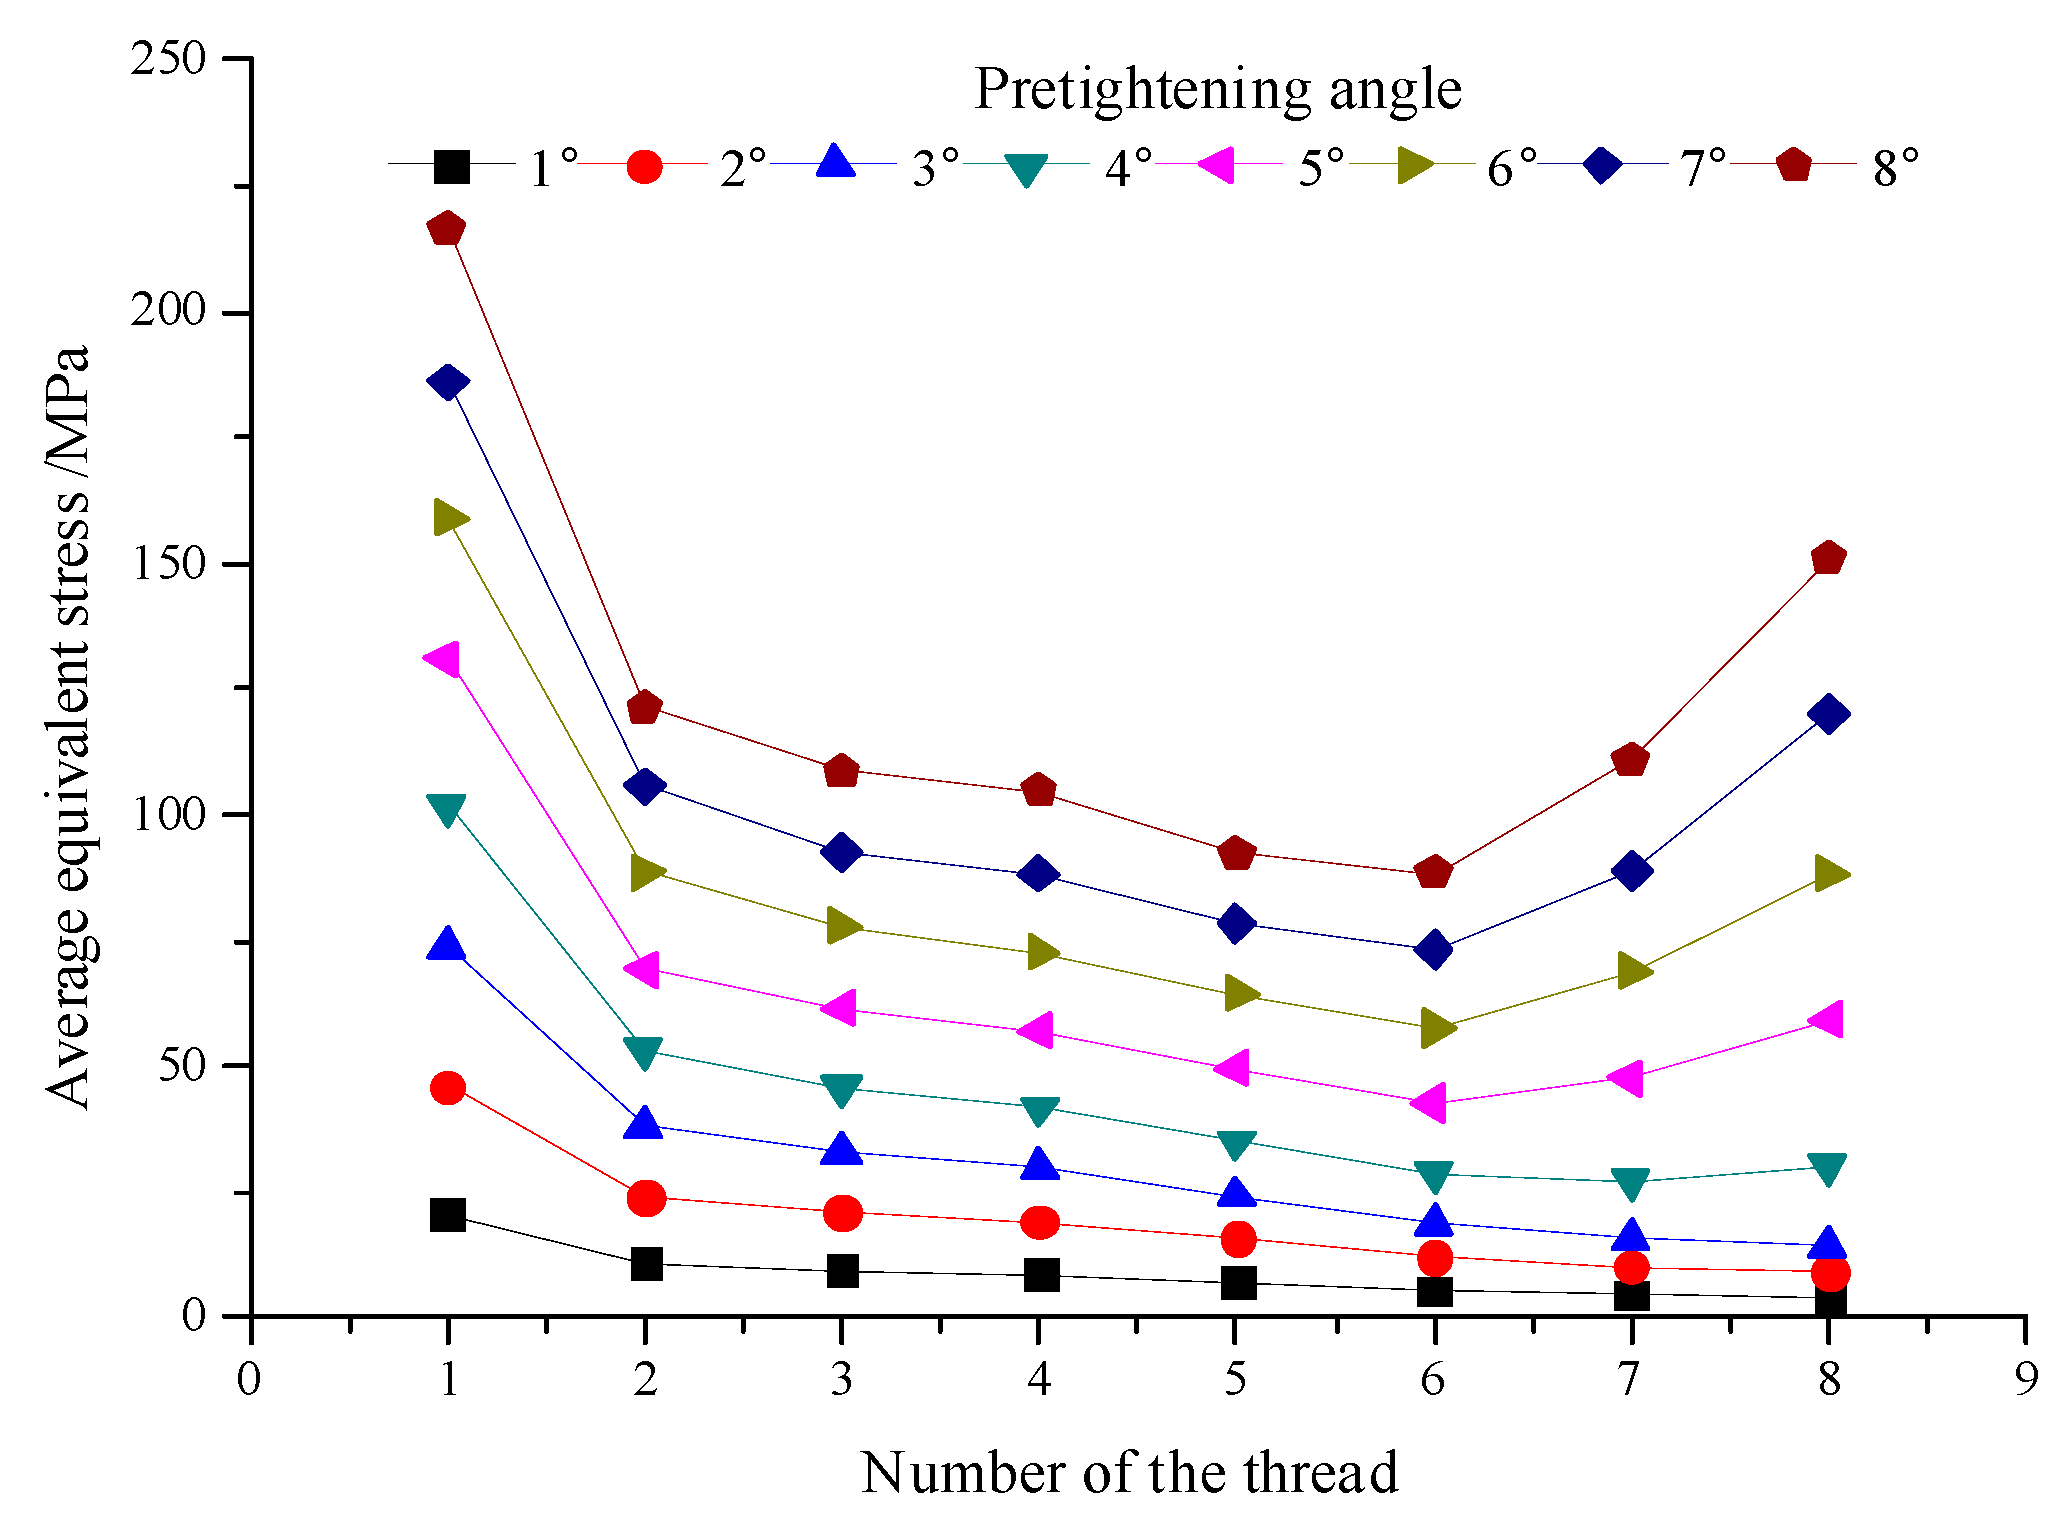
Under a tensile load, stress concentrations occur at both ends of the thread, whereas the stress is low in the middle of the thread. As the tensile load increases, the stress at both ends increases faster than the stress in the middle, and as the number of turns increases, the stress concentration at both ends decreases.
(2)
When the threaded joint is subjected to a tensile load, the stress concentration factor increases as the thread angle or taper increases, whereas the stress concentration factor decreases as the thread height increases; however, in the latter case, the overall decrease is small.
(3)
Through simulations and experiments, four structures of the thread are optimized. The results show that the best performance is provided by compound taper thread, which has the following structural parameters: a thread height of 2.24 mm, a thread angle of 30 degrees, and a 0 + 1:32 compound taper.

Author Contributions

Conceptualization, Y.W. and C.Q.; methodology, Y.W.; software, C.Q.; validation, Q.Z.; formal analysis, L.K.; investigation, Y.W.; resources, Y.W.; data curation, C.Q.; writing—original draft preparation, C.Q.; writing—review and editing, L.K.; visualization, L.K.; supervision, Y.W.; project administration, J.G.; funding acquisition, Y.W. All authors have read and agreed to the published version of the manuscript.

Funding

This work was supported by the National Key R&D Program of China (No. 2018YFC0603404) and the National Natural Science Foundation of China (Nos. 41672366 and 41872180).

Acknowledgments

The authors would also like to thank former researchers for their excellent work. Their results were fundamental for the presented academic study.

Conflicts of Interest

The authors declare that there are no conflicts of interest regarding the publication of this paper.

References

  1. Santus, C.; Bertini, L.; Burchianti, A.; Inoue, T.; Sakurai, N. Fatigue resonant tests on drill collar rotary shouldered connections and critical thread root identification. Eng. Fail. Anal. 2018, 89, 138–149. [Google Scholar] [CrossRef]
  2. Sajad, M.Z.; Sayed, A.H.T.; Hassan, S. Failure analysis of drill pipe: A review. Eng. Fail. Anal. 2016, 59, 605–623. [Google Scholar]
  3. Shugen, X.; Chong, W.; Shengkun, W.; Lan, Z.; Xinchun, L.; Honghai, Z. Experimental study of mechanical properties and residual stresses of expandable tubulars with a thread joint. Thin Walled Struct. 2017, 115, 247–254. [Google Scholar]
  4. Shuai, L.; Sujun, W. Effect of stress distribution on the tool joint failure of internal and external upset drill pipes. Mater. Des. 2013, 52, 308–314. [Google Scholar]
  5. Yu, W.; Bairu, X.; Zhiqiao, W.; Chong, C. Model of a new joint thread for a drilling tool and its stress analysis used in a slim borehole. Mech. Sci. 2016, 7, 189–200. [Google Scholar]
  6. Tafreshi, A.; Dover, W.D. Stress analysis of drill string threaded connections using finite element method. Int. J. Fatigue 1993, 15, 429–438. [Google Scholar] [CrossRef]
  7. Baryshnikov, A.; Baragetti, S. Rotary shouldered thread connections: Working limits under combined static loading. J. Mech. Des. 2001, 123, 456–463. [Google Scholar]
  8. Shahani, A.R.; Sharifi, S.M. Contact stress analysis and calculation of stress concentration factors at the tool joint of a drill pipe. Mater. Des. 2009, 30, 3615–3621. [Google Scholar] [CrossRef]
  9. Liangliang, D.; Xiaohua, Z.; Desheng, Y. Study on mechanical behaviors of double shoulder drill pipe joint thread. Petroleum 2018, 5, 102–112. [Google Scholar]
  10. Yosuke, O.; Masaaki, S.; Yoshinori, A.; Taizo, M.; Ryosuke, K.; Daisuke, T.; Masanobu, K. Fretting fatigue on thread root of premium threaded connections. Tribol. Int. 2017, 108, 111–120. [Google Scholar]
  11. Sorg, A.; Utzinger, J.; Seufert, B.; Oechsner, M. Fatigue life estimation of screws under multiaxial loading using a local approach. Int. J. Fatigue 2017, 104, 43–51. [Google Scholar] [CrossRef]
  12. Tafreshi, A. SIF evaluation and stress analysis of drillstring threaded joints. Int. J. Press. Vessel. Pip. 1999, 76, 91–103. [Google Scholar] [CrossRef]
  13. Bahai, H. A parametric model for axial and bending stress concentration factors in API drillstring threaded connectors. Int. J. Press. Vessel. Pip. 2001, 78, 495–505. [Google Scholar] [CrossRef]
  14. Baets, J.D.; Waele, P.D. Nonlinear contact analysis of different API line pipe coupling modifications. J. Press. Vessel. Technol. 2010, 132, 1–7. [Google Scholar]
  15. Feng, Q. Study of relationship between wireline drill pipe thread taper and strength and its stresses. Explor. Eng. Rock Soil Drill. Tunn. 1995, 6, 24–26. [Google Scholar]
  16. Su, J.; Yin, K.; Guo, T. Optimization of the joint-thread of diamond wire-line coring drill pipe. J. Jilin Univ. Earth Sci. Educ. 2005, 35, 677–680. [Google Scholar]
  17. Smolnicki, T.; Rusiński, E.; Karliński, J. FEM modelling of fatigue loaded bolted flange joints. J. Achiev. Mater. Manuf. Eng. 2007, 22, 69–72. [Google Scholar]
  18. Liang, J.; Guo, B.; Sun, J.; Zhang, Y. Finite element method of resistance to pull-off for deep hole wire-line drill rod. Coal Geol. Explor. 2013, 41, 90–93. [Google Scholar]
  19. Chui, C.; Mei, D. Analysis on the stress on wire-line core drilling pipe and connection joint based on ANSYS. Explor. Eng. Rock Soil Drill. Tunn. 2014, 41, 61–63. [Google Scholar]
  20. Yin, F.; Zhang, Y.; Xiong, J.; Xiong, L. Simulation analysis on structural mechanism of the thread for wire-line drill pipe. Explor. Eng. Rock Soil Drill. Tunn. 2014, 41, 66–69. [Google Scholar]
  21. Gao, S.; Sun, J.; Cai, J.; Liu, D. Calculation analysis on negative angle thread torque of wire-line coring drill pipe and test research. Explor. Eng. Rock Soil Drill. Tunn. 2016, 43, 45–49. [Google Scholar]
  22. Gao, J.; Ma, Y.; Wang, D.; Ji, S. Fatigue analysis on wire-line coring drill pipe joints in tonghua well-1 based on ansys workbench. Explor. Eng. Rock Soil Drill. Tunn. 2017, 44, 70–78. [Google Scholar]
  23. API recommended practise API spec7-1. In Recommended Practice for Drill Stem Design and Operating Limits, 15th ed.; American Petroleum Institute: Washington, DC, USA, 1995.
  24. Feng, C.; Di, Q.F.; Li, N.; Wang, C.S.; Wang, W.C.; Wang, M.J. Determination of operating load limits for rotary shouldered connections with three-dimensional finite element analysis. J. Pet. Sci. Eng. 2015, 133, 622–632. [Google Scholar]
  25. Yong, Z.; Gao, L.X.; Yuan, P.B. Force analysis and tightening optimization of gas sealing drill pipe joints. Eng. Fail. Anal. 2015, 58, 173–183. [Google Scholar] [CrossRef]
  26. Brock, J.N.; Jellison, M.J. Development of a gas-tight, pressure-rated, third-generation rotary shouldered connection for 20,000-psi internal and 10,000-psi external service. In Proceedings of the IADC/SPE Drilling Conference, Orlando, FL, USA, 4–6 March 2008; p. 112547. [Google Scholar]
  27. Baryshnikov, A.; Calderoni, A.; Ligrone, A.; Ferrara, P. A new approach to the analysis of drillstring fatigue behavior. SPE Drill. Complet. 1997, 12, 77–84. [Google Scholar] [CrossRef]
  28. Wang, Y.; Gao, L.X.; Yuan, P.B. Cause analysis of longitudinal cracking of internal thread joints of double shoulder drill pipes. Mach. Tool Hydraul. 2015, 43, 183–186. [Google Scholar]
  29. Peng, C.Y.; Lou, Y.S.; Cao, Y.P.; Sun, W.H.; Liu, X.F. Research on fatigue failure of drill thread connections. Pet Drill. Technol. 2006, 6, 20–22. [Google Scholar]
  30. Macdonald, K.A.; Deans, W.F. Stress analysis of drill string threaded connection using the finite element method. Eng. Fail. Anal. 1995, 2, 1–30. [Google Scholar] [CrossRef]
  31. Moradi, S.; Ranjbar, K. Experimental and computational failure analysis of drill strings. Eng. Fail. Anal. 2009, 16, 923–933. [Google Scholar] [CrossRef]
  32. Rahman, M.K.; Hossain, M.M.; Rahman, S.S. Survival assessment of die-marked drill pipes: Integrated static and fatigue analysis. Eng. Fail. Anal. 1999, 6, 277–299. [Google Scholar] [CrossRef]
Figure 1. Schematic diagram of the thread profile.
Applsci 10 02669 g001
Figure 2. Structure of the coring tool.
Applsci 10 02669 g002
Figure 3. Three-dimensional models of the (a) pin joint and (b) box joint.
Applsci 10 02669 g003
Figure 4. Mesh independence analysis results.
Applsci 10 02669 g004
Figure 5. Meshed models of the pin joint and box joint.
Applsci 10 02669 g005
Figure 6. Schematic diagram of thread numbering.
Applsci 10 02669 g006
Figure 7. (a) Contact settings and (b) contact surfaces.
Applsci 10 02669 g007
Figure 8. Loading conditions: (a) tensile load and (b) torsional load.
Applsci 10 02669 g008
Figure 9. Stress distributions in the (a) pin joint and (b) box joint.
Applsci 10 02669 g009
Figure 10. Stress path setting.
Applsci 10 02669 g010
Figure 11. Equivalent stress distribution in the thread: (a) average equivalent stress and (b) maximum equivalent stress.
Applsci 10 02669 g011
Figure 12. Stress distribution on the thread contact surface under a tensile load of 100 kN: (a) contact surface stress and (b) cross-sectional stress distribution.
Applsci 10 02669 g012
Figure 13. Thread stress nephograms with a pretightening angle of five degrees: (a) pin joint and (b) box joint.
Applsci 10 02669 g013
Figure 14. Relationship between the average equivalent thread stress and the pretightening angle.
Applsci 10 02669 g014
Figure 15. Relationship between the displacement and interference of each surface with respect to the pretightening angle.
Applsci 10 02669 g015
Figure 16. Three optimized thread structures: (a) optimized thread taper, (b) optimized thread height and (c) optimized thread angle.
Applsci 10 02669 g016
Figure 17. Tensile test platform.
Applsci 10 02669 g017
Figure 18. Structure of the joint sample.
Applsci 10 02669 g018
Figure 19. Test samples.
Applsci 10 02669 g019
Figure 20. Tensile test flow.
Applsci 10 02669 g020
Figure 21. The relationship between the air pressure and time during axial stretching.
Applsci 10 02669 g021
Table 1. Stress states under different structural parameters.
Serial NumberTaperThread Height (mm)Thread Angle (degrees)Maximum Stress (MPa)K
11:42.2430454.743.68
21:62.2430447.413.52
31:162.2430449.133.46
41:322.2430445.983.42
51:322.0430523.643.69
61:322.2430445.983.42
71:322.4430396.213.39
81:322.2415419.552.89
91:322.2430445.983.42
101:322.2445485.593.59
Table 2. Structural parameters of the test samples.
GroupTaperThread Height (mm)Thread Angle (degrees)
Sample 11:322.2430
Sample 20 + 1:322.2430
Sample 31:322.2415
Sample 41:322.4430

