Article

Predictive Voltage Control: Empowering Domestic Customers With a Key Role in the Active Management of LV Networks

by
Micael Simões
* and
André G. Madureira
INESC TEC—Institute for Systems and Computer Engineering, Technology and Science, 4200-465 Porto, Portugal
*
Author to whom correspondence should be addressed.
Appl. Sci. 2020, 10(7), 2635; https://doi.org/10.3390/app10072635
Submission received: 31 January 2020 / Revised: 3 April 2020 / Accepted: 5 April 2020 / Published: 10 April 2020

Abstract

:
In order to avoid voltage problems derived from the connection of large amounts of renewable-based generation to the electrical distribution system, new advanced tools need to be developed that are able to exploit the presence of Distributed Energy Resources (DER). This paper describes the approach proposed for a predictive voltage control algorithm to be used in Low Voltage (LV) distribution networks in order to make use of available flexibilities from domestic consumers via their Home Energy Management System (HEMS) and more traditional resources from the Distribution System Operator (DSO), such as transformers with On-Load Tap Changer (OLTC) and storage devices. The proposed algorithm—the Low Voltage Control (LVC)—is detailed in this paper. The algorithm was tested through simulation using a real Portuguese LV network and real consumption and generation data, in order to evaluate its performance in preparation for a field-trial validation in a Portuguese smart grids pilot.

1. Introduction

The deployment of Distributed Generation (DG) technologies, driven by several factors of political, social, economical, environmental and technical character has led to an increased complexity of distribution network operation. In particular, excessive DG penetration can sometimes negatively impact the performance of the system and may lead to voltage fluctuation problems, overvoltages, thermal overloading of network equipment, increased risk of exceeding equipment short circuit capacity as well as maloperation of protection equipment [1].
In deregulated energy markets, a conflict of interest has been found among the DG owners/ investors and Distribution System Operators (DSOs), as investors are looking forward to a greater integration of DG to the distribution network, while operators are primarily concerned with the management of their network in scenarios of excessive DG penetration levels. While in the past this conflict of interest was traditionally mitigated by defining new grid codes as a fair and transparent solution to decide when to accept or reject new DG connection requests [2], as the distribution networks move towards a more active concept, with the integration of controllable Distributed Energy Resources (DER), these methodologies become inefficient. In practice this limits the hosting capacity of DG connection, compromises the secure and efficient operation of the network, and can lead to curtailment of DG in high voltage scenarios. Voltage control in distribution networks is rapidly becoming a concern for DSOs, particularly in situations where high levels of Renewable Energy Sources (RES)—such as solar photovoltaic (PV) panels—are connected directly at the end-user’s premises [3]. This phenomenon is more prevalent in weak Low Voltage (LV) networks, that have long lines usually with low reactance/resistance (X/R) ratios, and where the injection of large amounts of renewable energy may lead to voltage magnitude fluctuations that may fall out of the range defined by the EN-50160 standard [4].

1.1. Active Distribution Network Management

Active distribution network management is seen as the key to a cost-effective integration of DER into distribution network planning and operation. This is in direct contrast to the current “fit-and-forget” approach that is still followed by most DSOs. Distribution networks were typically designed using deterministic studies or standard design rules, considering critical situations so that the networks could operate with a minimum amount of control, that is, eventual control problems were solved at the planning stage. Table 1 presents a summary of the experience gained by several DSOs worldwide and their rules of thumb for DG connection.
The practice of passive operation can limit the capacity of DG that can be connected to an existing system [1]. In contrast, active management techniques enable the distribution system operator to maximize the use of the existing network by taking full advantage of the network’s controllable DER in an integrated manner. The emerging electric grid is envisaged to allow for increased flexibility, scalability, and resiliency in handling the inherent variability of some renewable resources without compromising power quality [5]. In the recent past, quick but highly conservative methods such as the 15% rule followed by a large number of DSOs (see Table 1), were used as a way to limit DG integration. These methods do not take into account the location and production/consumption profiles of these resources, leading to a low hosting capacity, while not necessarily ensuring the system’s security and efficient operation. They also fail to reflect that some networks have higher hosting capacity, limiting the deployment of DG. As the DER penetration levels grow, other measures need to be taken [6].
As previously mentioned, one of the technical impacts resulting from the connection of large amounts of DG to distribution networks is related to the voltage rise effect. This fact, in addition to the fact that microgenerators are typically required to operate at unity power factor, results in voltage fluctuations at the equipment’s terminals that are directly proportional to the active power injected in the grid. Since it is a requirement of the distribution utility to supply its customers at a voltage level within specified limits, and of certain quality with minimal fluctuation, the development of voltage control techniques is crucial in order to increase the LV network’s maximum allowable DG connection capacity. Basically, two main control strategies can be found in the available technical literature—local distributed voltage control and centralized voltage control [7,8].

1.1.1. Decentralized Management Schemes

Active power generation curtailment is the most basic form of voltage control. It is performed by reducing the active power output of the DG unit when the voltage magnitude exceeds predefined limits. Decentralized control, on the other hand, can be achieved by not enforcing DG units to operate at unity power factor, but allowing the unit to manage its reactive power output. This voltage control scheme acts when predefined voltage limits at the DG unit’s terminals are overstepped, thus helping to reduce the voltage rise effect. When the voltage values are within admissible limits, the DG unit operates at unity power factor.
In Reference [9], the authors propose a decentralized control scheme, based on active and reactive power control algorithms to perform voltage control of the distribution network with a high penetration level of DG. The authors state that the proposed control scheme has higher performance in the mitigation of voltage deviations than more traditional control schemes, increasing the grid’s RES hosting capacity from 35.65% up to 66.7%. In Reference [10], a detailed analysis of the main operation modes and control structures for power converters is carried out. In Reference [11], an overview of the state-of-the-art decentralized control techniques is performed. Different control techniques and classification of inverter modules are investigated, detailing the pros and cons of each. Among this, it is possible to find inverters capable of parallel operation that, through the addition of communication links between the DG units’ inverter modules, are able to increase the reliability of this type of control and reduce the total amount of generation curtailment.

1.1.2. Centralized Management Schemes

Centralized voltage control schemes are based on information about a large portion—or even totality—of the distribution network, in order to determine the control actions to be implemented. Typically, these methods control not only the substation voltage level but also other resources with voltage control capabilities, such as energy storage devices, flexible loads, and controllable DG units. Usually, the network nodes’ voltages are either measured or estimated and obtained through an Advanced Metering Infrastructure (AMI) or similar. Centralized voltage control schemes may rely heavily on data and communication infrastructure, sensors and advanced control systems, but are able to ensure coordinated and optimized management of the available resources. By comparison, decentralized control schemes are simpler to implement, but the lack of coordination between devices often leads to sub-optimum solutions.
A typified approach to centralized control schemes is the use of optimization techniques. In Reference [12], the authors propose an Optimal Power Flow (OPF) algorithm to perform the voltage control of the LV network, recurring to energy storage devices and flexible loads. Similar approaches to the coordination of DER can also be found in References [13,14]. In Reference [15], the authors propose a genetic algorithm to determine the optimal operating point for several controllable resources. It was shown that the algorithm was able to keep the voltage values within the predefined limits for a set of simulated scenarios. In Reference [16], the authors propose an algorithm to determine the optimal dispatch of energy storage devices. The problem is represented by a nonlinear programming model that was formulated using an exponential voltage-dependent load model. In Reference [17], a two-level hierarchical energy management system for microgrid operation based on a robust model predictive control strategy is proposed. The objective function is formulated as the minimization of the cost of the energy drawn from the main grid, increasing self-consumption from local RES. Simulation results using data from a real urban community showed that when compared with an equivalent (non-robust) deterministic methodology (i.e., without considering uncertainty), show that the proposed solution achieved lower energy costs and obtained a more uniform grid power consumption, safer battery operation, and reduced peak loads.
Centralized voltage control techniques based on optimization methods can be complex and demanding from a computational power and hardware point-of-view, requiring dedicated systems to run the algorithms, such as Advanced Distribution Management Systems (ADMS), developed specifically to support the operation of the LV network. Given the large number of LV networks, simpler alternatives are sought in order to enable efficient monitoring and control of LV distribution grids with large integration of DER. In Reference [18], a method for the coordination of multiple energy storage systems is proposed for voltage control in LV distribution networks. The performance of coordinated control is compared with non-coordinated control using both a real-time digital simulator and a Matlab model of a real UK low voltage distribution network with a high installed capacity of solar PV. The proposed coordinated control scheme is able to use the ES devices more evenly and therefore reduces the costs of battery replacement. In Reference [19] are shown the results from a demonstration trial of a hierarchical control scheme, that combines a centralized algorithm with decentralized algorithms embedded in the inverters of DER. The control algorithm was demonstrated in a real LV network and the results obtained have shown that the proposed approach was able to keep the voltage values within the predefined limits, thus enabling a larger deployment of renewable energy in the network. In Reference [20], a voltage control method based on the active power variation of the DG unit’s output to stabilize the bus voltage is proposed. The simulation results show that the proposed method can effectively improve the voltage control capability of the network and enable it to operate normally under severe conditions. Through the control method proposed, the communication requirements are greatly reduced and the calculation time is effectively reduced. In Reference [21], an algorithm that reduces voltage and frequency deviations by coordinating multiple energy storage devices is proposed. The algorithm reduces the total number of charging and discharging times by calculating the sensitivity coefficient of the storage devices at different nodes and then selecting the appropriate devices to operate. The algorithm was validated on a typical distribution testing system and the results show that the voltage and frequency are controlled within the permissible range, the state of charge of the storage devices is controlled within the normal range, and the total number of charging and discharging cycles are reduced to prolong life.

1.1.3. InteGrid’s Approach

The European Union’s Horizon 2020 project InteGrid [22] aims at bridging the gap between citizens and technology/solution providers such as utilities, aggregators, manufacturers and other agents providing energy services. Hence, it expands from DSO’s distribution and access services to active market facilitation and system optimization services, while ensuring sustainability, security and quality of the energy supply. In the InteGrid project, a new tool for voltage control designed specifically for LV networks is currently being developed—the LVC module. In the context of InteGrid, it is assumed that the presence of DER can be exploited by the DSO for grid control and management purposes [23]. These DER can be either owned by the DSO, such as storage devices, or licensed by DSOs to participate in grid operation under a contractual agreement. The proposed tool is intended to be a decision support tool, to assist the DSO in the management of the LV grid in an active manner. Its aim is to identify a set of preventive control actions that can be implemented by the DSO in order to avoid foreseeable technical problems in the LV grid, such as voltage violations or branch/transformer overloads. Preliminary results, with a test LV network and typical load and generation profiles are presented in Reference [24]. In this work, the proposed LVC algorithm is described, and extensive results from simulations performed on real LV networks were obtained and partially presented in this paper.

2. Low Voltage Control Tool

2.1. Proposed Framework

The LVC tool performs the active management of an LV network recurring to two main resource types:
  • DSO-owned resources, such as OLTC transformers and energy storage devices, and
  • Privately-owned resources, in this case private consumers willing to participate in grid operation through demand response schemes.
It is assumed that the private consumers willing to participate in grid operation have installed a HEMS [25]. The HEMS is a local controller, installed at the private consumer household, that is simultaneously responsible for the optimization of the consumption of the household itself, and the calculation of the flexibility available for the different periods of the day, that can be exploited by the DSO to perform the active management of the LV network. Therefore, the HEMS acts as an interface between the LVC tool and the consumer’s appliances, communicating to the DSO the flexibility available in the household for a certain period ahead, and receiving eventual consumption change set-points that might be requested by the DSO. The interaction between the DSO and the private consumers willing participate into grid operation is performed through a type of neutral access platform, called grid and market hub (GM-Hub), responsible for collecting all the flexibility offers from the consumers and making them available to the DSO [26]. Furthermore, the GM-Hub is also responsible for receiving the control actions from the DSO (flexibility activation requests), and communicating them to the private consumers.
The LVC tool operates in two main timescales:
  • Preventive scale (typically one day ahead), and
  • Quasi-real-time scale (typically 15 min ahead).
In the preventive stage, the algorithm requires forecasts of generation, load and flexibility available provided by the private consumers in order to determine a preventive control action to apply to the LV network controllable resources [27,28]. The control actions produced by the preventive control module are communicated to the DSO, for validation purposes that then can accept or perform changes to the control action determined by the LVC algorithm. In real-time the algorithm uses a state estimation algorithm, the Low Voltage State Estimator (LVSE), to obtain a snapshot of the network in real-time recurring to a subset of the smart meters measurements available in the network [29,30]. It is important to highlight the requirement for the usage of a LVSE algorithm for the operationalization of the proposed management scheme, since current AMI solutions are unable to provide accurate synchronized real-time measurements in useful time in order to enable the management of the LV network in real-time. The main objective of the real-time control module is to assess the actual network conditions registered in real-time, and compare them to the conditions that were forecasted in the preventive stage. If these significantly differ, the control action is updated accordingly, and the new set-points (control action) are generated and submitted to the validation platform. Therefore, the real-time control module of the LVC tool has a corrective character, acting solely if the network conditions significantly differ from what was forecasted. A simplified schematic of the proposed framework is shown in Figure 1.

2.2. Description of the LVC Algorithm

As previously described, the LVC tool consists of two main modules: the preventive control module, that operates at a preventive scale of typically one day-ahead; and the real-time control module, that operates at a quasi-real-time timescale to monitor the LV network conditions and update the preventive control action, if required. The main objective of the LVC tool is to ensure that the DSO will be able to comply with the requirements of the EN-50160 standard concerning admissible supply voltage variations, even under scenarios where high RES and Electric Vehicle (EV) penetration levels are expected. The definition of the control action plan follows a merit order of actuation of the available flexible resources, typically according to their activation costs, that can be adjusted to the DSO’s preferences. It is reasonable to assume that the DSO controllable assets will always be considered first, as these are considered to have a lower operational cost, and only then the customers’ flexibility will be used.

Voltage Regulation in LV Networks

In LV networks with no DG, voltage control has traditionally been achieved by local compensation or by adjusting OLTC tap settings. However, with the advent of microgeneration, new methodologies are being developed in order to effectively tackle the voltage control problem at lower voltage levels in the distribution system. Since LV lines tend to be highly resistive as previously mentioned, traditional voltage control based only on reactive power management is ineffective [31,32].
In order to understand the influence of LV networks’ characteristics, consider the example system presented in Figure 2.
The expressions that determine the power flow in the LV line represented in Figure 2 (neglecting shunt admittances) are:
P 12 = R V 1 2 R V 1 V 2 cos ( θ 12 ) + X V 1 V 2 sin ( θ 12 ) R 2 + X 2 ,
Q 12 = X V 1 2 X V 1 V 2 cos ( θ 12 ) R V 1 V 2 sin ( θ 12 ) R 2 + X 2 ,
with
θ 12 = θ 1 θ 2 ,
where:
V i
is the voltage magnitude at bus i
θ i
is the voltage angle at bus i
S i j
is the apparent power flow in the branch connecting bus i to bus j
P i j
is the active power flow in the branch connecting bus i to bus j
Q i j
is the reactive power flow in the branch connecting bus i to bus j
Z
is the impedance of the branch connecting bus 1 to bus 2
R
is the resistance of the branch connecting bus 1 to bus 2
X
is the reactance of the branch connecting bus 1 to bus 2
Considering that in LV networks, the line resistance is usually much greater than the line reactance (i.e., R X ), the following expressions for active and reactive power flows can be derived from Equation (1) and Equation (2):
P 12 = V 1 2 V 1 V 2 cos ( θ 12 ) R ,
Q 12 = V 1 V 2 sin ( θ 12 ) R .
According to Equation (4), it can be seen that, in order to be able to inject active power from bus 2 to bus 1 in a resistive network, voltage should be higher at the bus 2 than at bus 1 (i.e., V 2 > V 1 ). This shows that, contrary to the transmission system or even at some voltage levels of the distribution system, controlling reactive power flow is not as effective as real power for voltage control in LV networks. In LV networks, situations where the active power injection largely exceeds consumption—such as peak solar production coinciding with low load demand—can lead to overvoltages that violate the admissible limits. Similarly, consumption peaks derived, for instance, from simultaneous EV charging, can lead to undervoltages that can also violate the admissible limits. Furthermore, it is expected that LV networks will in the future accommodate large amounts of microgeneration units. Given that at the LV level both loads and microgeneration units are usually single-phase, given their small power rating, LV networks may suffer from phase unbalance, contrary to what happens at the MV or HV levels of the distribution system, for instance.

2.3. Control Actions Management Module

The core of the LVC tool is the Control Actions Management Module (CAMM). The CAMM is responsible for analysing network data and for computation of set-points to apply to the network’s controllable resources. Figure 3 shows a simplified flowchart of the CAMM.
When a voltage violation is identified, the CAMM starts by evaluating the available LV controllable resources, with the objective of determining the best-suited resources to address the constraint. The ranking of the resources is performed according to criteria established by the DSO, with the overall objective of minimizing the grid operation costs. The rank of each network resource is established according to the following criteria, by priority:
  • Resource type: the resource type is the highest priority criterion. In this work, priority was given to DSO-owned resources (OLTC transformers and energy storage devices) and then consumer-owned resources (flexibility from domestic clients via their HEMS, controllable microgenerators or loads).
  • Electrical distance to the voltage violation node: the next criterion in the rank computation of the resource is the electrical distance to the node where the voltage violation occurred. Priority is given to resources located in the same phase and that are electrically closer to the voltage violation node.
  • Available flexibility: for energy storage devices and HEMS. For storage devices, this flexibility is given by the State of Charge (SoC); for HEMS, this is the flexibility that is made available to participate in grid operation.
  • Contract characteristics and curtailment time: this criteria is used a last resort. Here we can consider the nature of the contracts established with private consumers (for instance, curtailment under severe conditions), and curtailment time of DG.
Once the best-suited resources are selected and ranked according to the aforementioned criteria, the first resource is selected and a set-point is computed, based on the electrical distance between the controllable resource’s node and the node where the voltage violation occurs. The impact of the set-point on the network nodes’ voltages is then evaluated recurring to an unbalanced three-phase power flow routine according to the formulation presented in Reference [33]. If the established set-point is unable to solve the constraint, the next resource in the controllable resources’ list is selected and a new set-point is computed. The control action plan is closed when the computed set-points are able to solve the voltage violation or when the controllable resources list is exhausted.

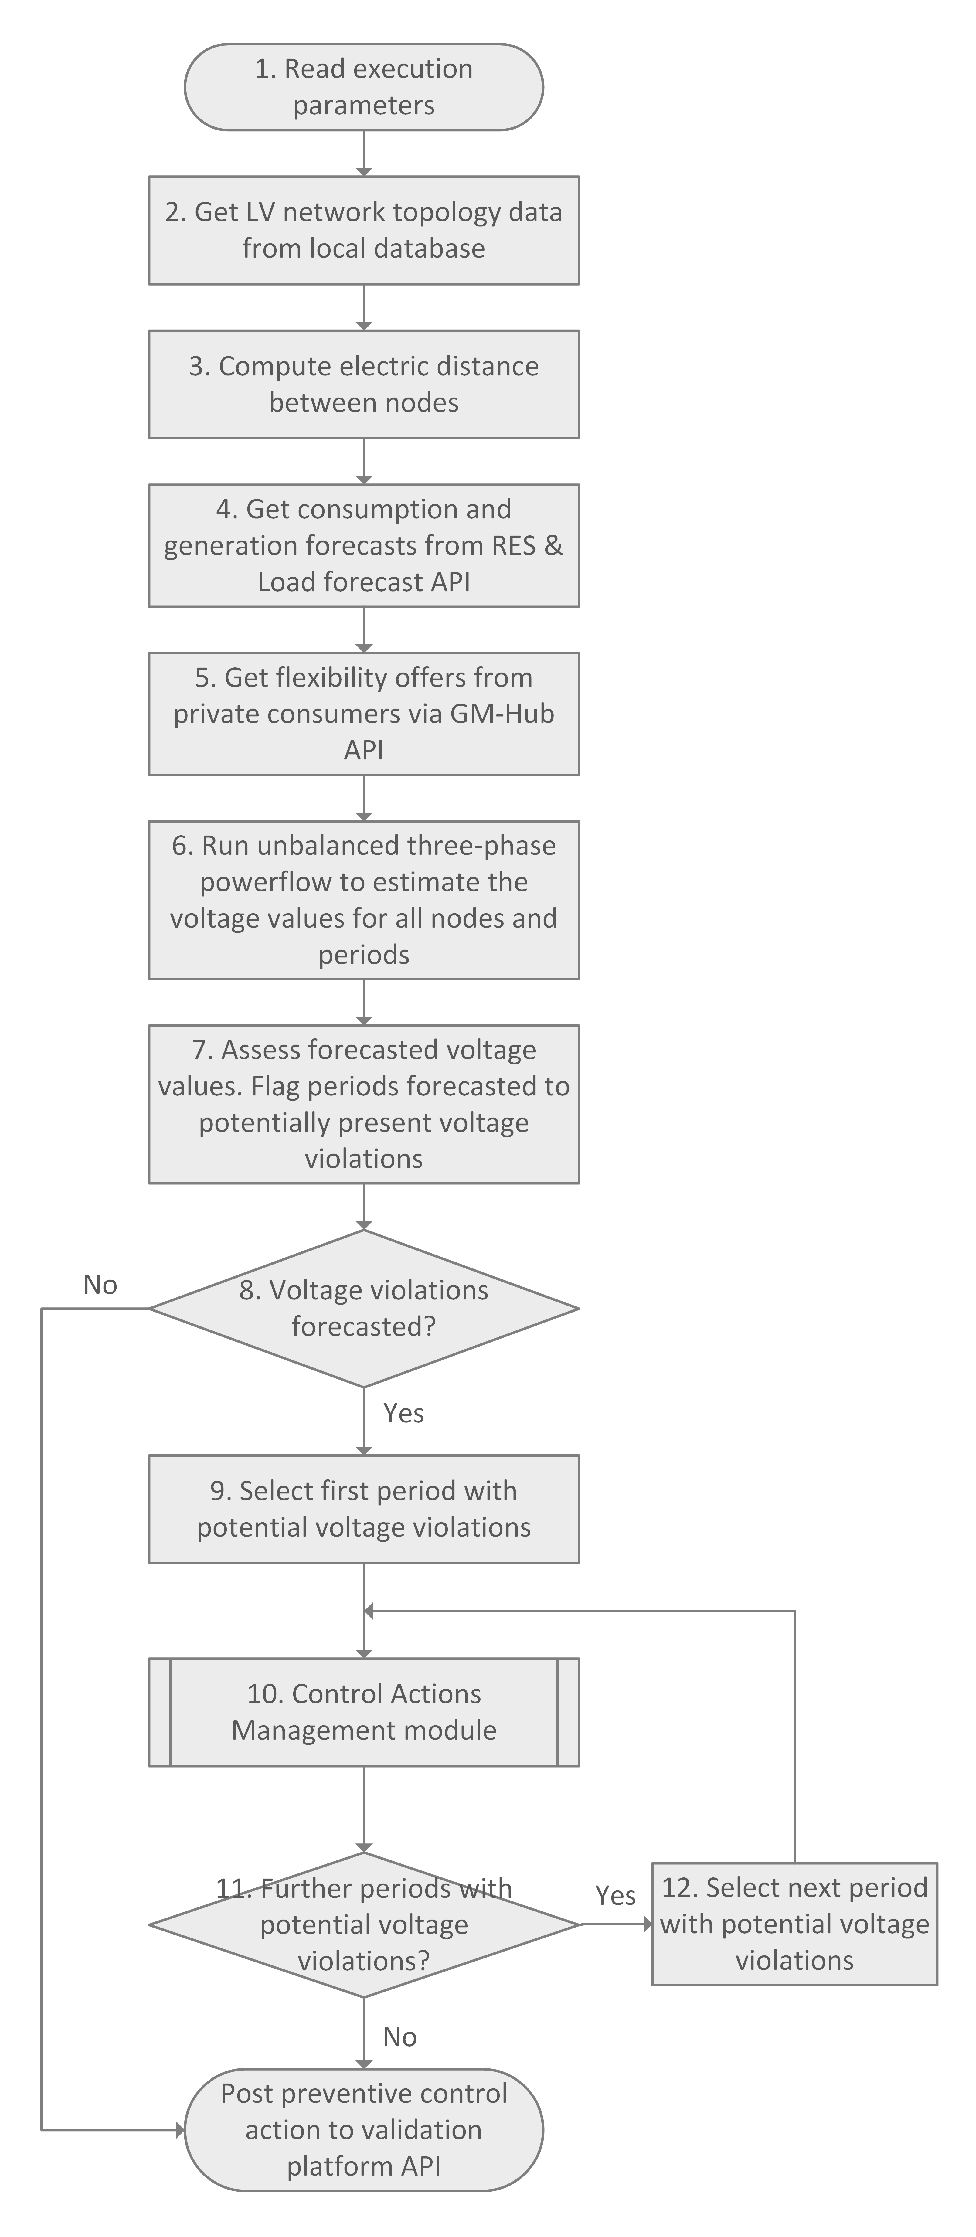
2.4. Preventive Control Module

The preventive control module is responsible for the computation of the preventive control action to apply in the LV network’s controllable resources. This occurs by pre-booking the controllable DER’ flexibility for the control period (typically, 24 h). It uses forecasts of active power generation and load for the several consumers and producers present in the network in order to estimate the voltage profiles for each control period. The control actions are determined taking into account the flexibility offers from private consumers, and the DSO-owned resources limits. The private consumers’ flexibility is pre-booked via the neutral access market platform (GM-Hub), and the set-points to apply in the DSO-owned resources are stored in the LVC’s local database, for deployment in real-time. The control actions are submitted to a validation platform, where an operator from the DSO has the option of validating, or updating, the control action determined by the LVC’s preventive control module. Figure 4 shows a simplified flowchart of the preventive control module.

2.5. Real-Time Control Module

The real-time control module is responsible for analysing the network’s node voltages in real-time, and correcting the previously established control action if necessary and if current conditions differ greatly from the ones previously assessed. In order to do this, it uses a snapshot of the most recent network state, provided by the LVSE algorithm. The LVSE algorithm is able to provide voltage and active power estimations for the several consumption and generation points present in the network. Figure 5 shows a simplified flowchart of the real-time control module.
Due to the more predictable character of the LV network’s voltage profiles when compared to the active power profiles, the voltage estimation is more accurate than the active power estimation. Therefore, the LVC’s real-time control module prioritises the voltage values obtained from the LVSE. If the voltage values obtained are outside of the voltage limits, the CAMM is run again to update the set-point plan generated by the preventive control module. The corrected (updated) control actions are also submitted to the validation platform, to be validated before the application on the LV network’s resources.

3. Simulation Results

3.1. Test-case Scenario Definition

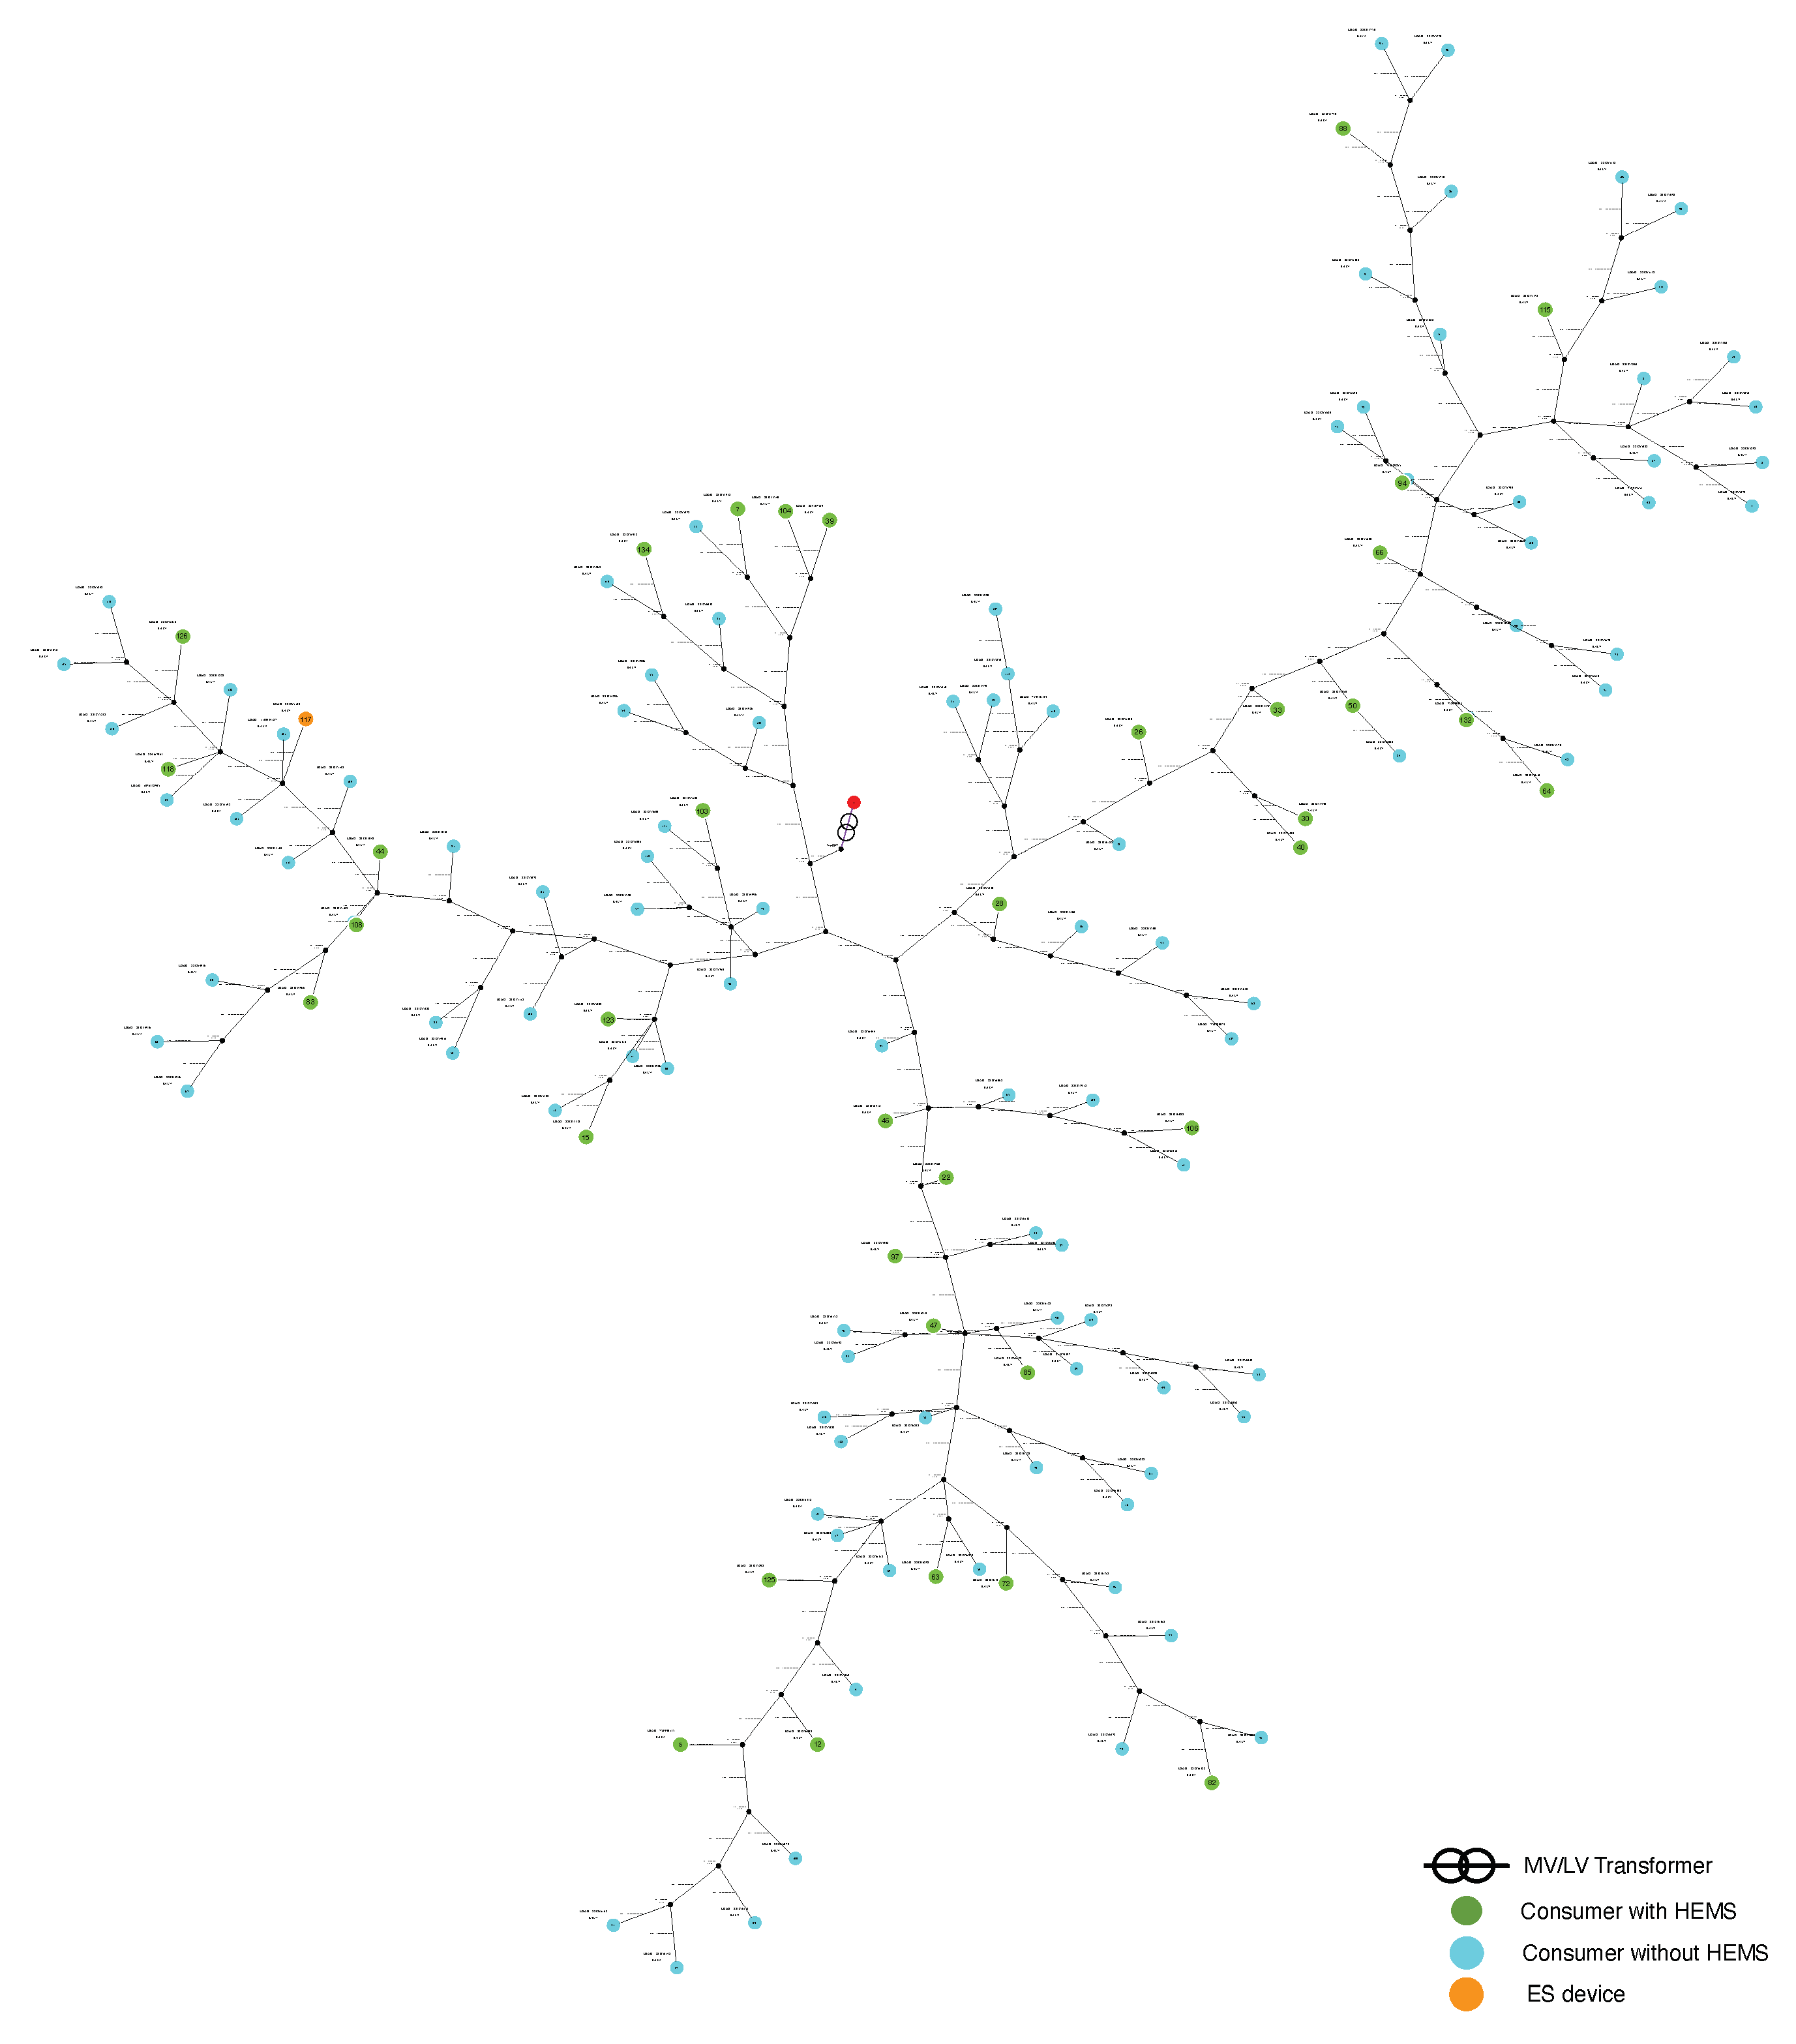
The LVC algorithm was tested in a model of a real Portuguese LV distribution network. The network is composed by 241 buses and 239 lines, and has a total of 129 consumers. The single-line diagram of the simulation network can be seen in Figure A1 of the Appendix section. The MV/LV transformer does not have OLTC capabilities and a DSO-owned 27 kW/30 kWh energy storage device is located at node 117. HEMS were stochastically distributed to around 30% of the LV customers, simulating consumer led installation of these devices. To simulate a network with a high penetration level of renewable energy, it was considered that every consumer has a small microgeneration unit installed. The installed capacity of the generation unit was determined as a function of the consumer’s contracted power, according to the criteria listed in Table 2.
In Table 3, is provided a summary with the number and contracted power of clientes with and without HEMS, as well as the microgeneration installed capacity.

3.2. Model Validation

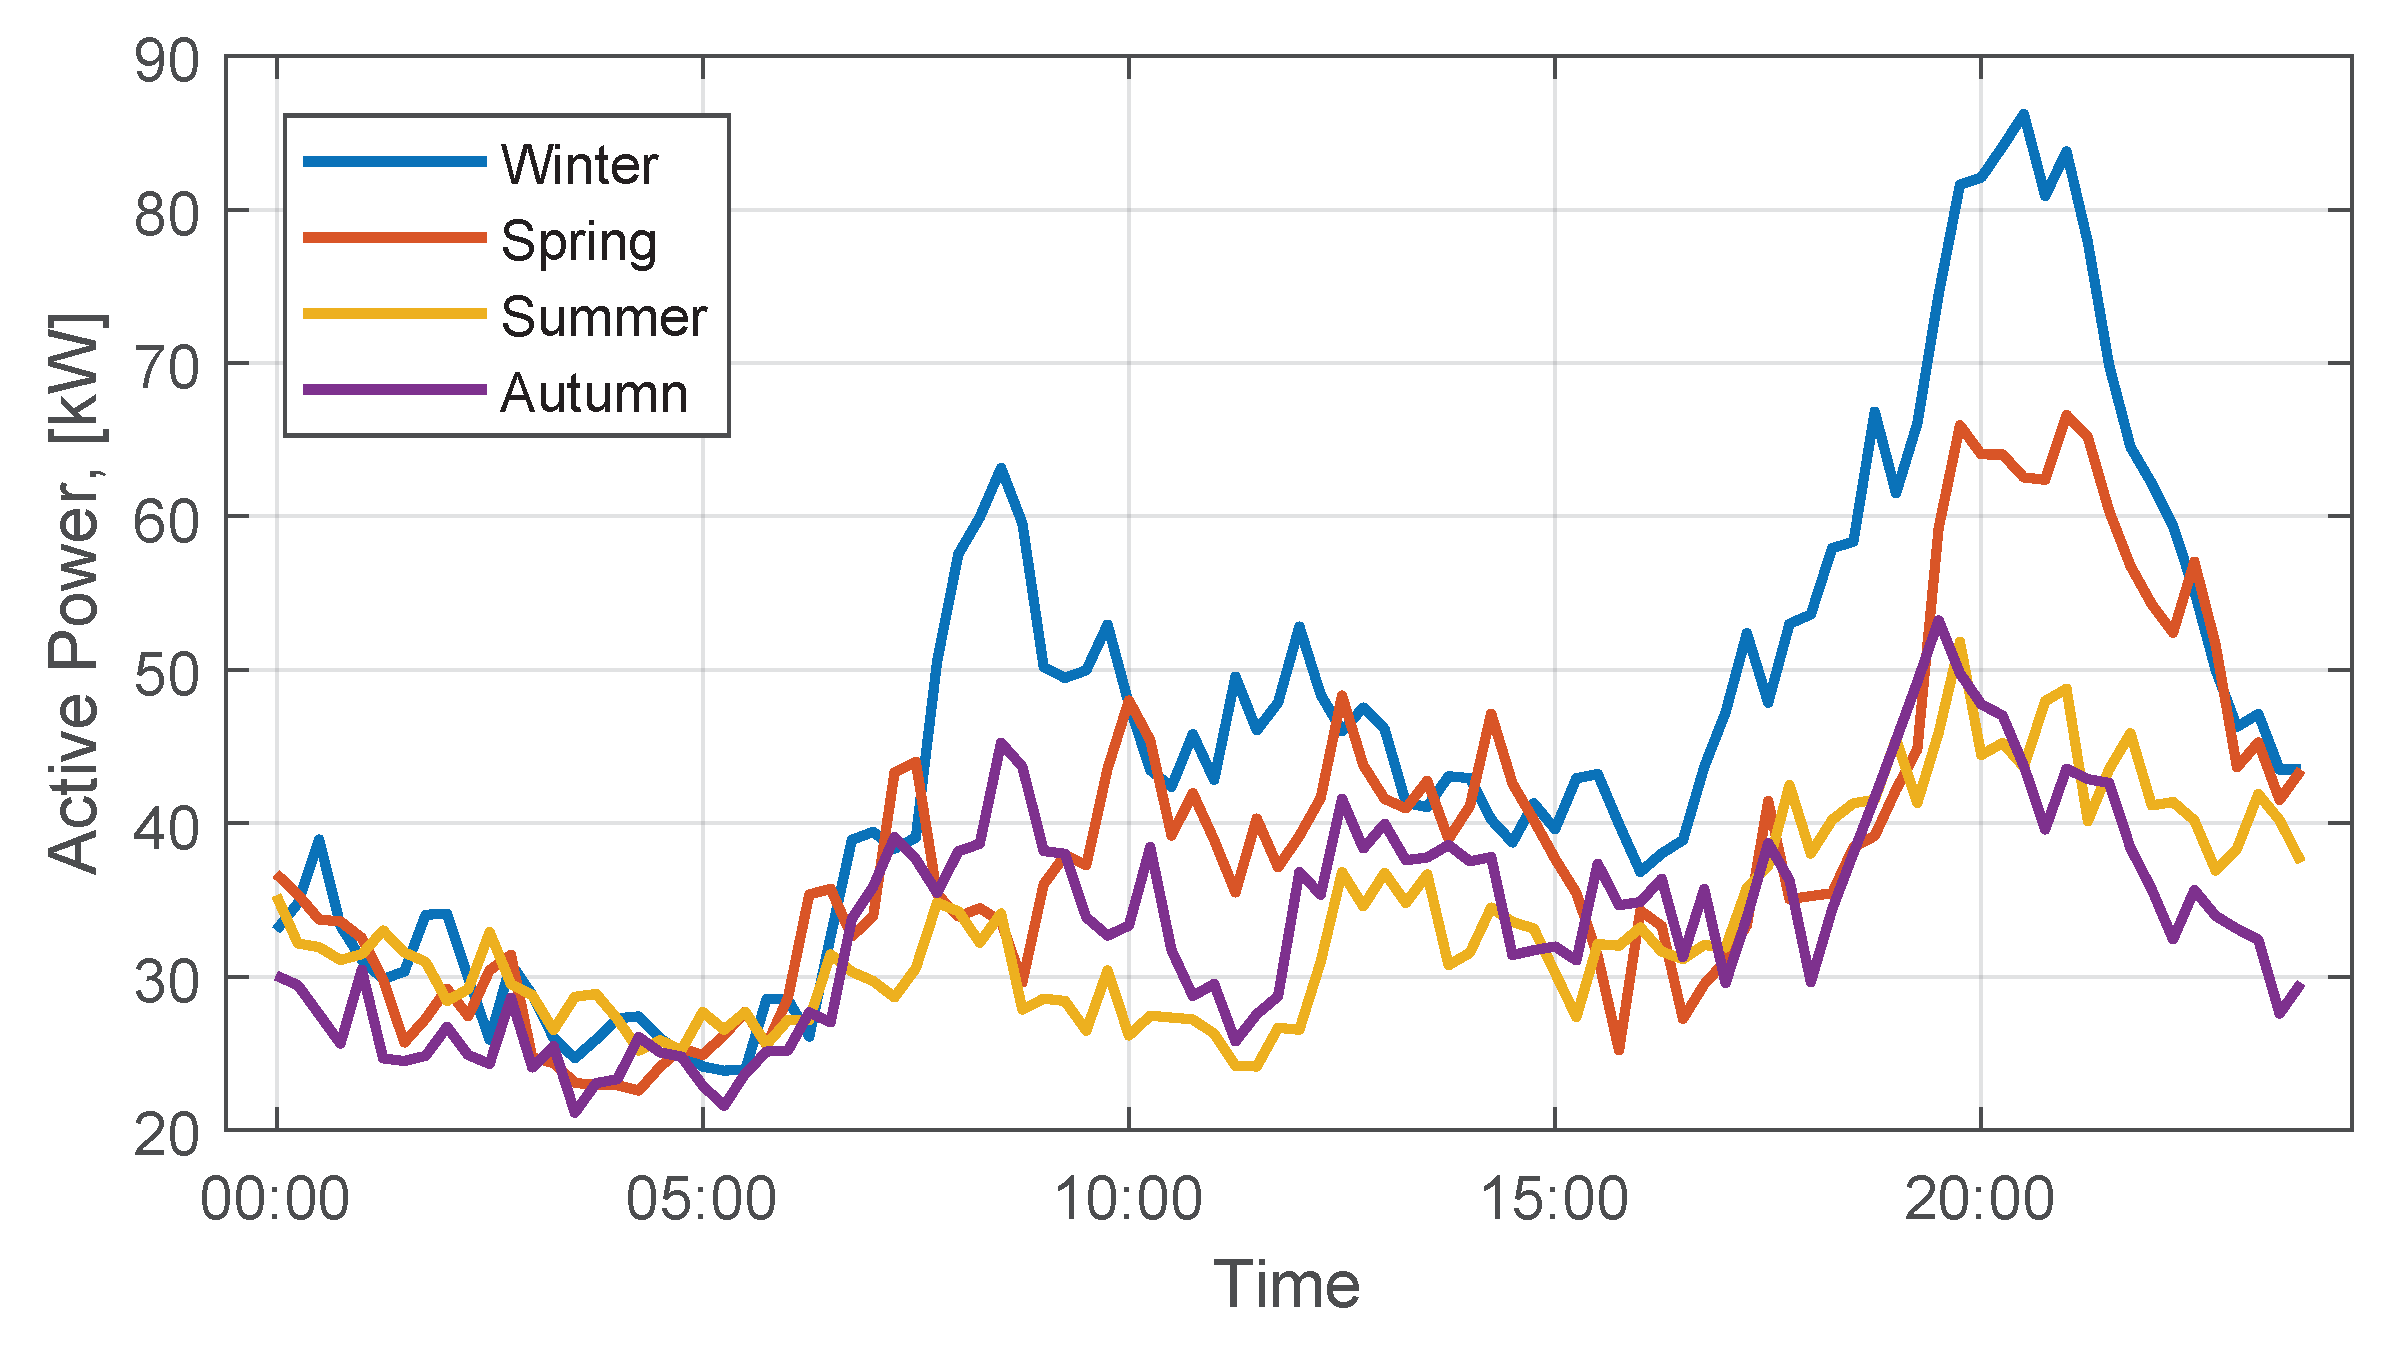
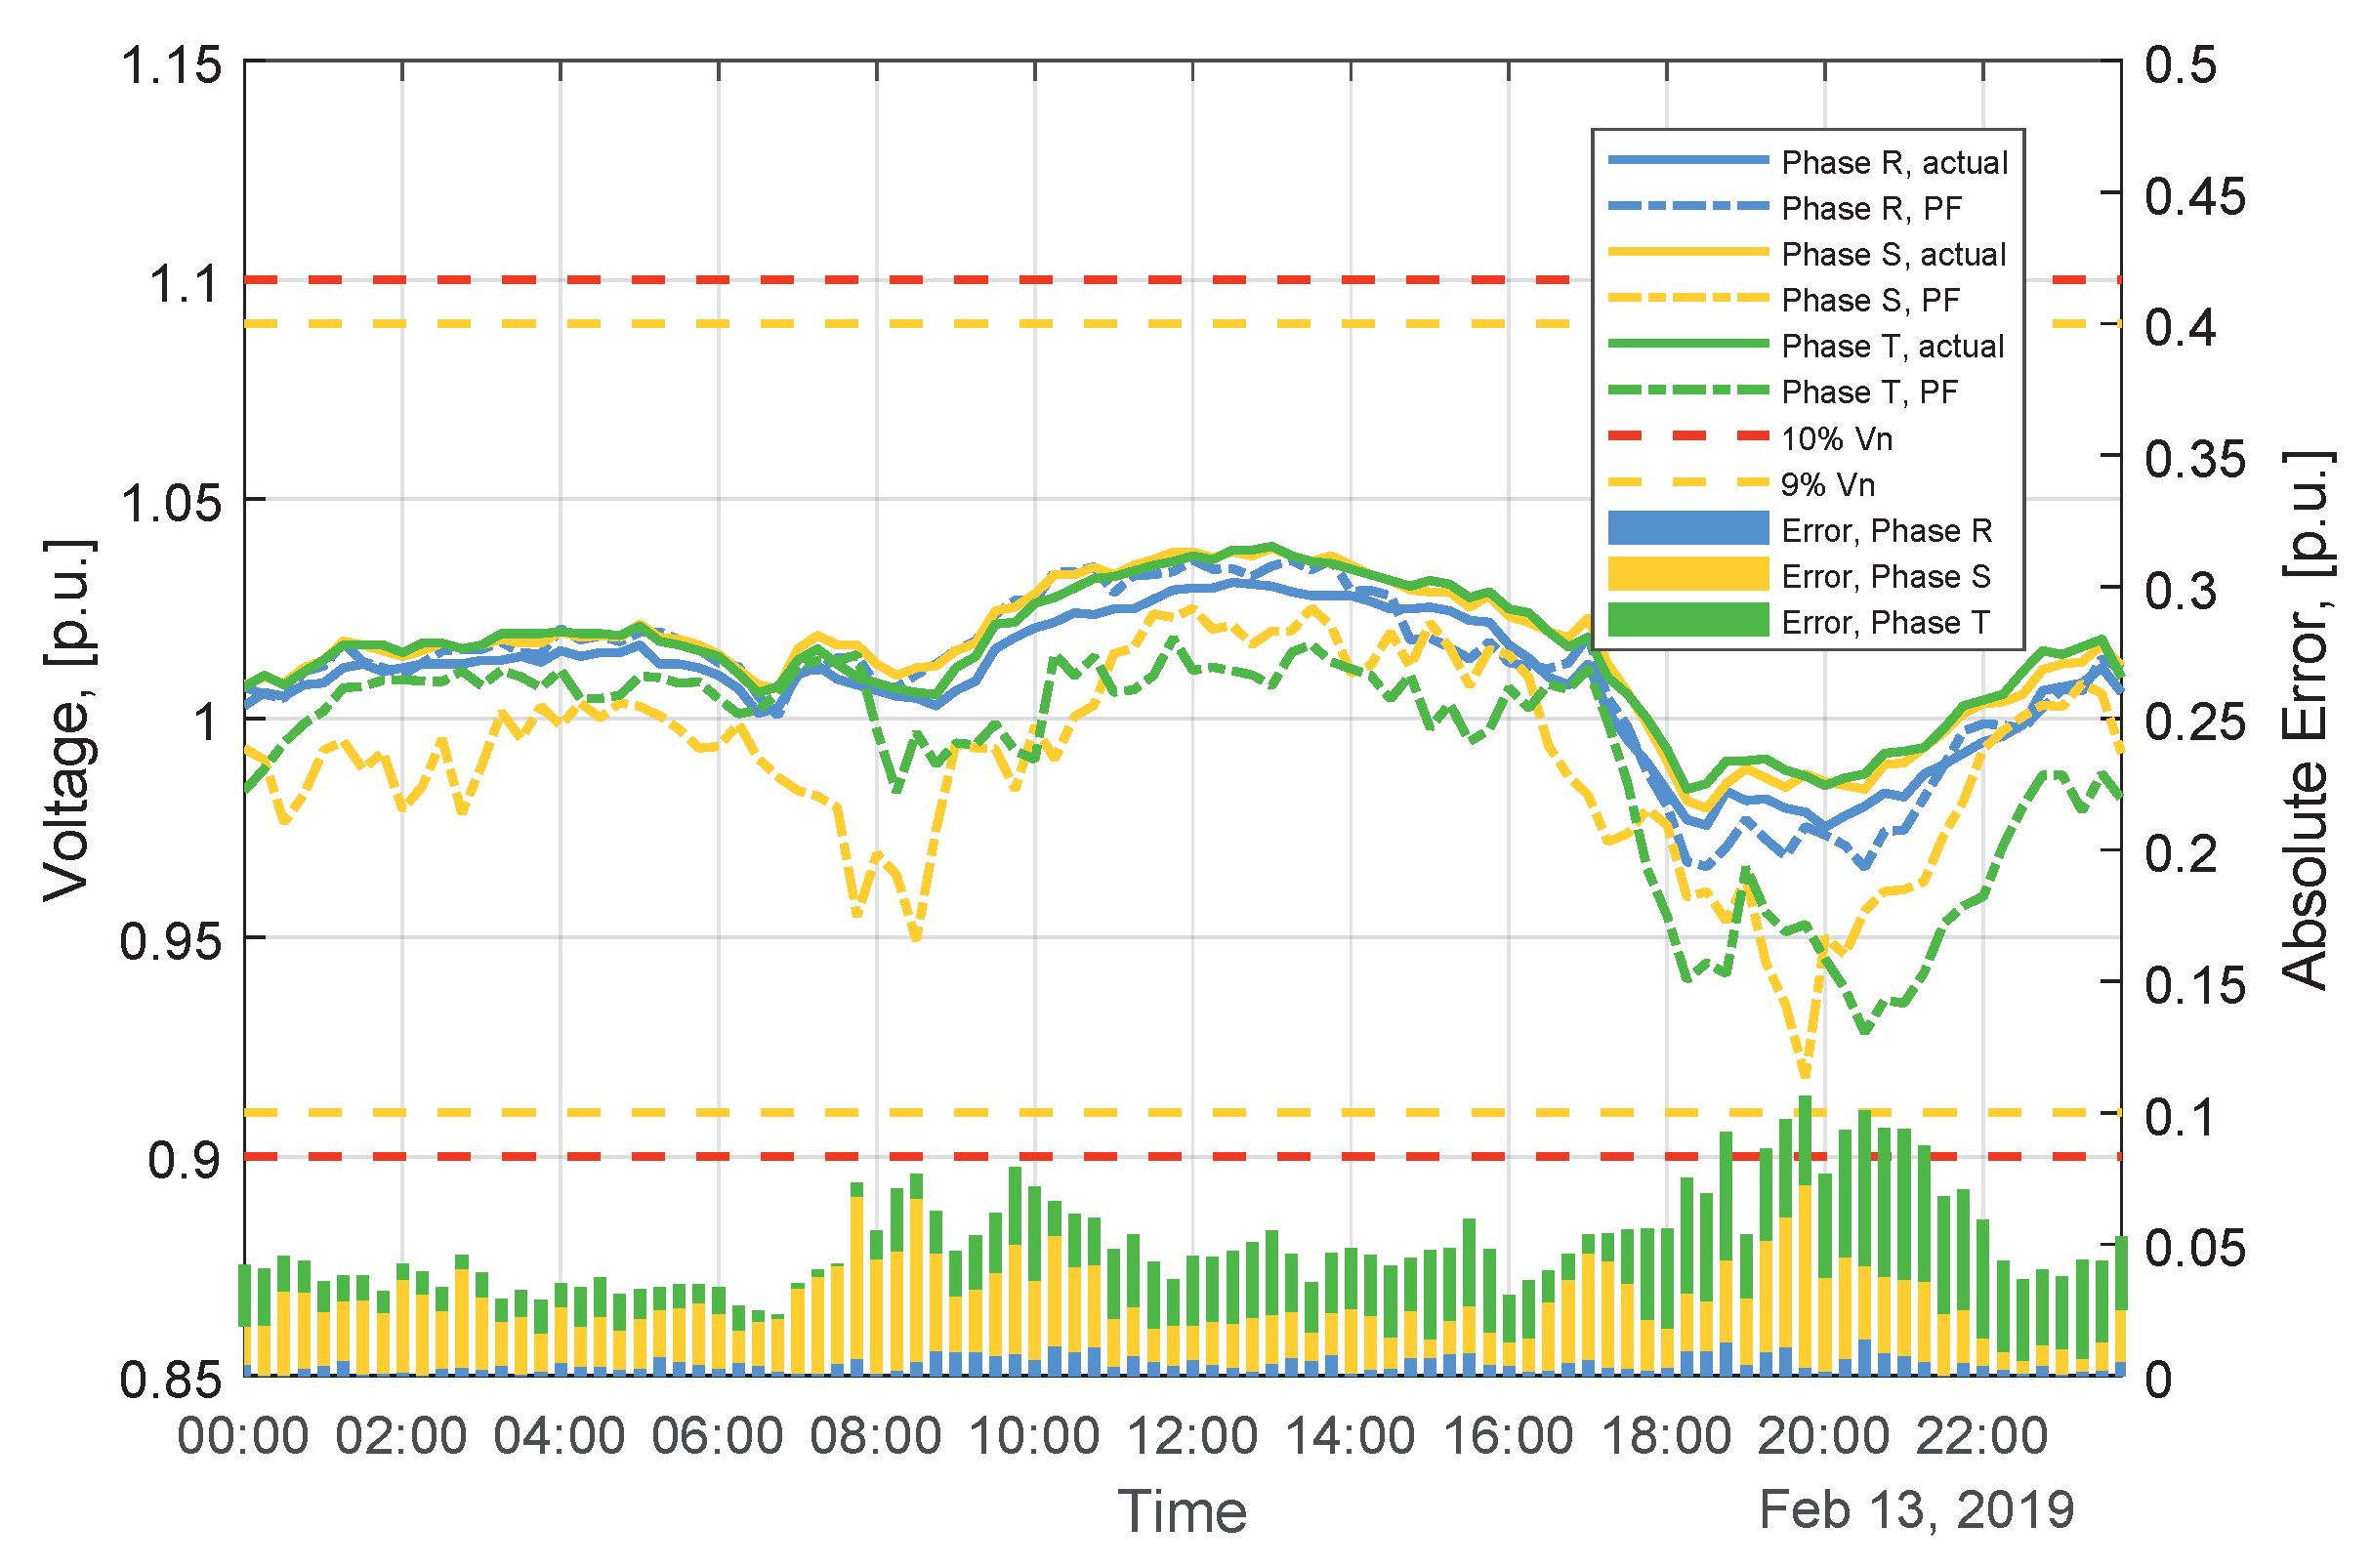
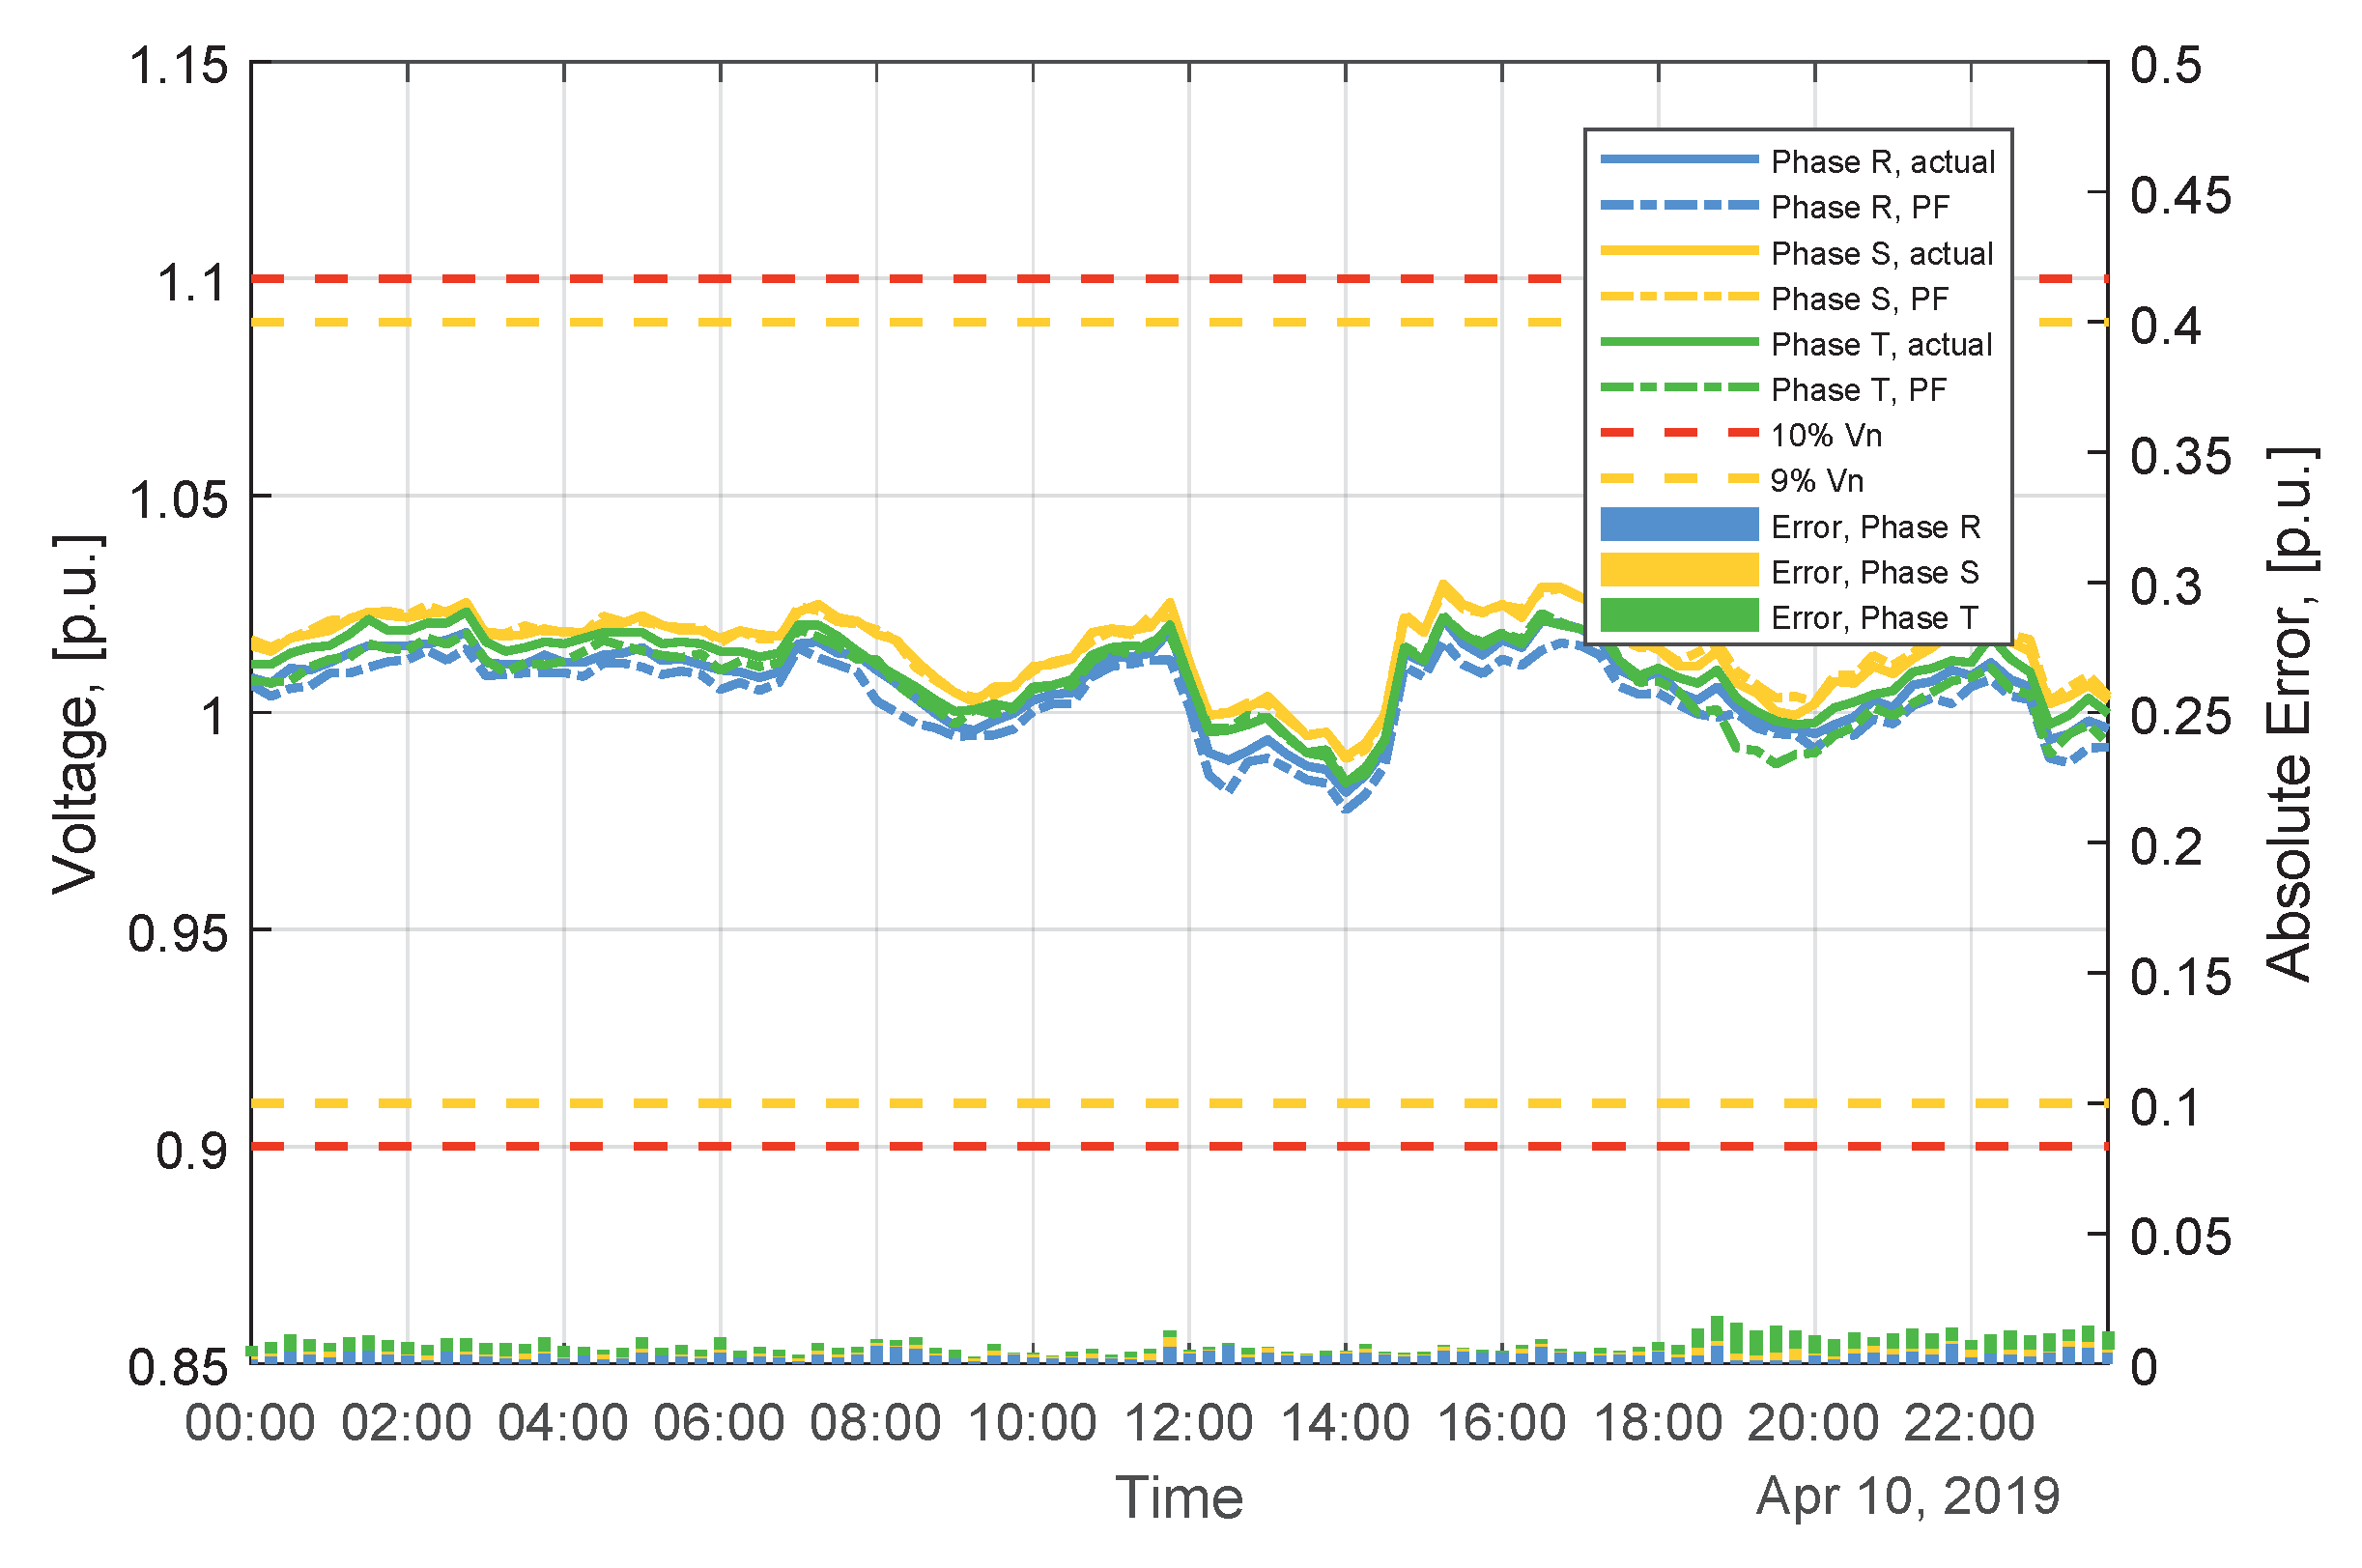
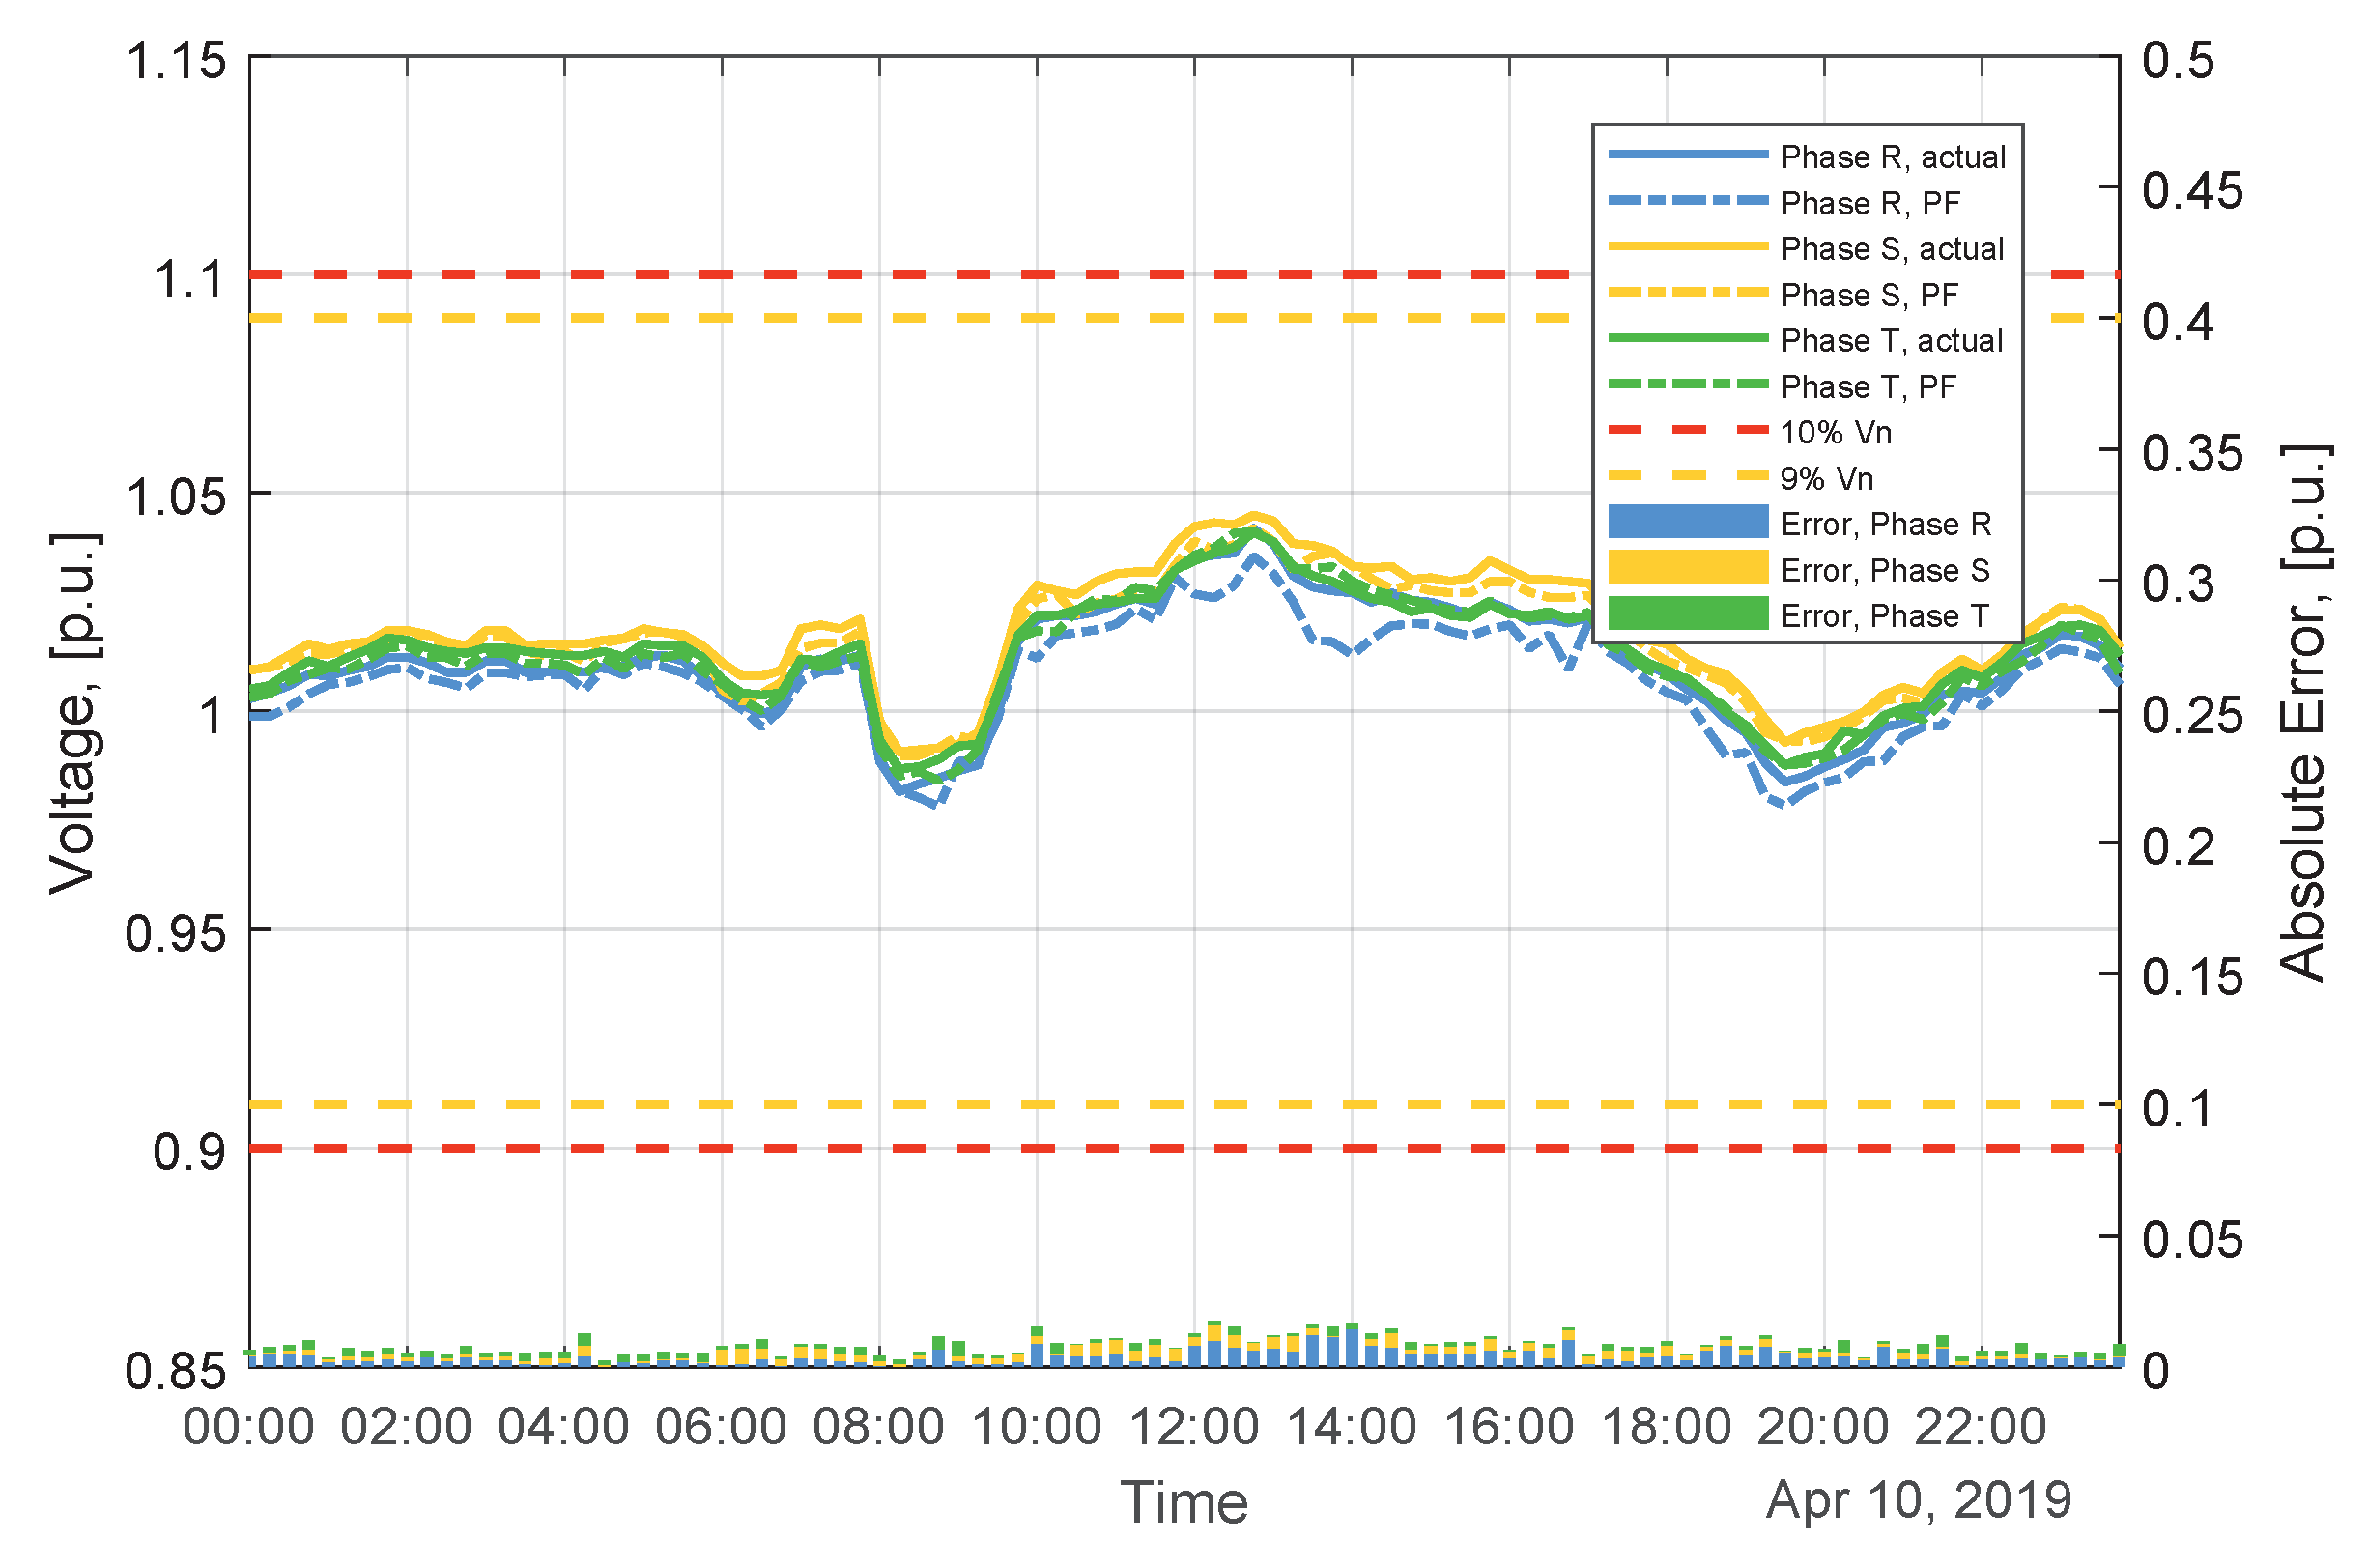
In order to evaluate the accuracy of the three-phase unbalanced power flow and the network parameters, voltage values obtained from the unbalanced three-phase power flow were compared to the actual voltage values supplied by the DSO and measured from the network, for four representative days of the four seasons of the year. In Figure 6 is shown the total active power consumption for the four representative days. In Figure 7, Figure 8, Figure 9 and Figure 10 are shown the comparisons between the historical voltage profiles and voltage profiles obtained through the three-phase unbalanced PF for the node electrically more distant from the distribution transformer for the four representative days.
The accuracy of the three-phase unbalanced power flow was evaluated through two different metrics, the Mean Absolute Percentage Error (MAPE) and the Root-Mean-Square Error (RMSE). The MAPE and RMSE are respectively given by:
MAPE = 100 % n t = 1 n A t F t A t
RMSE = t = 1 n F t A t 2 n ,
where n is the number of instants, and A t and F t are respectively the actual and forecasted values for the instant t. The MAPE and RMSE values obtained per phase for the node electrically furthest to the MV/LV transformer, for the four representative days, are listed in Table 4. As it is possible to see from Figure 7, Figure 8, Figure 9 and Figure 10, and Table 4, the voltage values obtained are very close to the historical voltage values. The day where the voltage values present the highest error is the Winter day, with an average MAPE of 1.70%. The errors also have the tendency to decrease over time. The higher errors obtained for the Winter days may be explained by some configuration and synchronization errors in the acquisition of the data from the AMI. As these issues were solved, the voltage error values decreased significantly. The results obtained validate not only the accuracy of the unbalanced three-phase power flow implementation, but also the network’s electrical characteristics.

3.3. Simulation Results

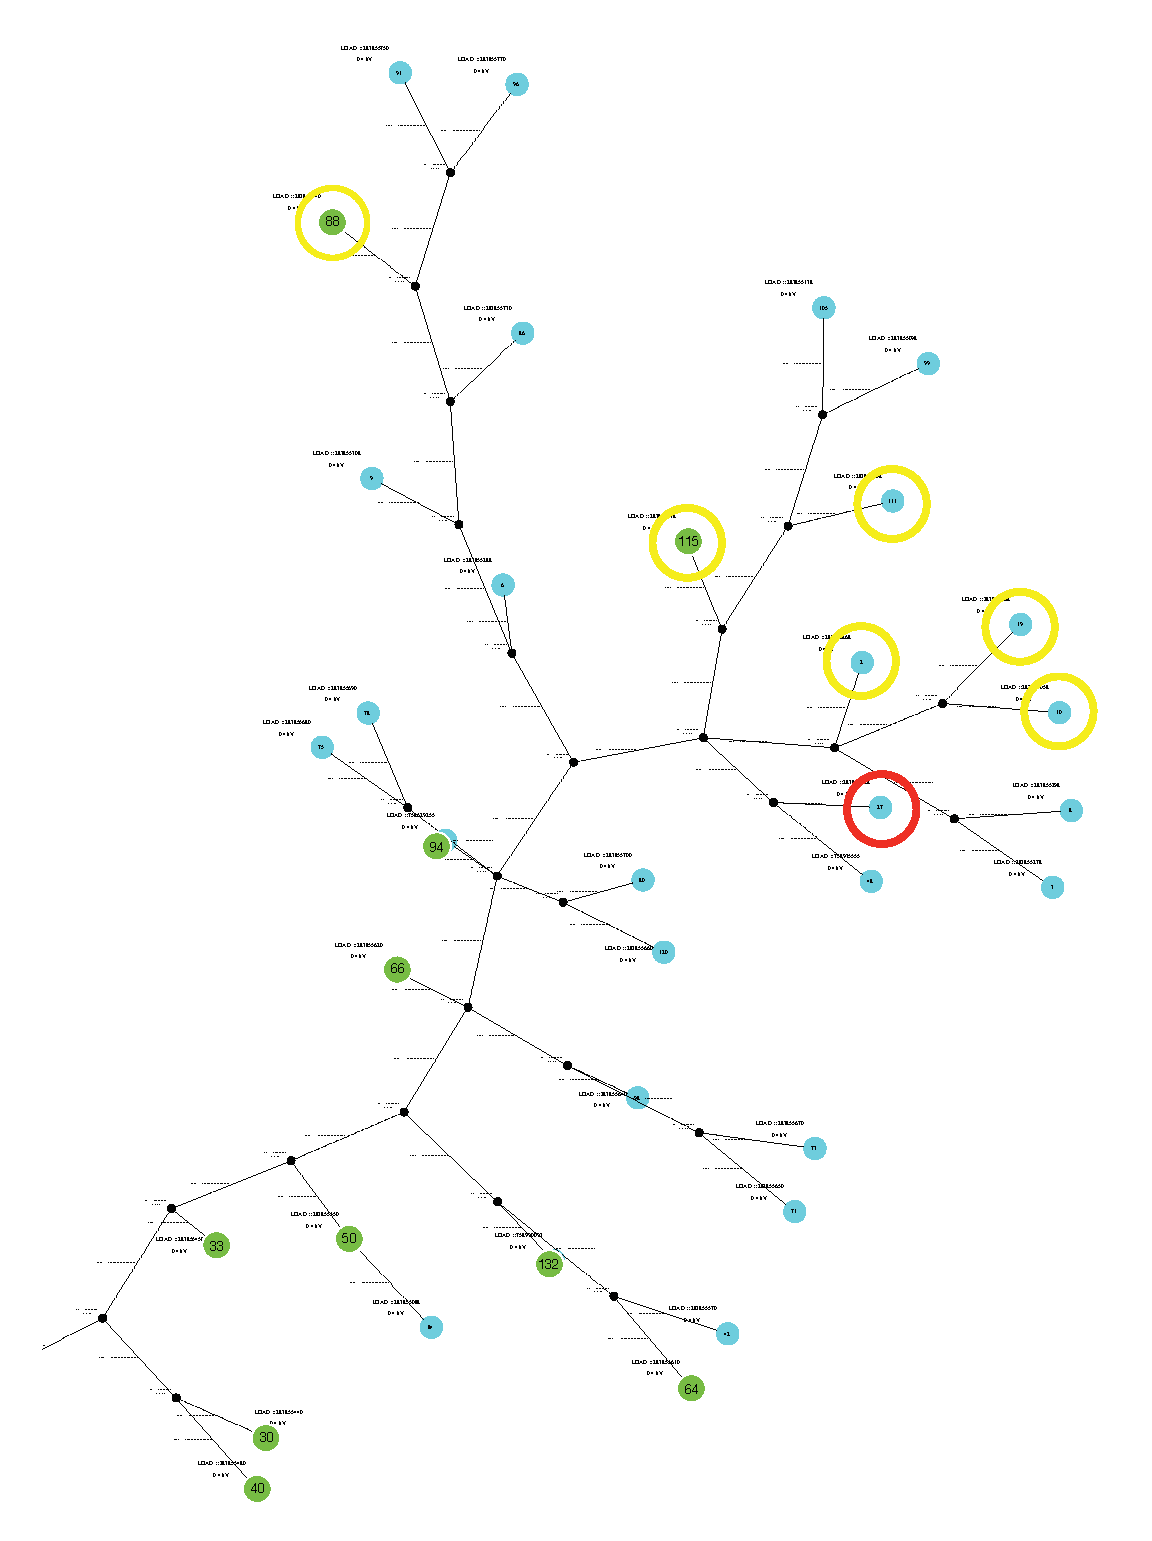
The LVC algorithm was run in preventive control mode, for a planning horizon of 24 h and a frequency of 4 plans per hour (i.e., every 15 min). All of the consumers with HEMS were considered to be available to participate in grid operation, as well as the DSO-owned storage device located at node 117. The simulation was run for the Autumn day (Figure 10), the most recent data available. The voltage magnitude limits considered were ± 10 % of the distribution transformer nominal voltage, V N . It is important to note that although the voltage magnitude limits are considered to be ± 10 % V N , the LVC algorithm establishes stricter limits in order to compensate for the errors associated with the forecasts and state estimation, as well as the uncertainty associated with the behaviour of the flexibility-providing consumers. By doing this, fewer corrections are required in real-time operation, at the expense of a higher flexibility usage, but the grid is operated in a safer manner. In Figure 11 a detail of the section of the network’s single-line diagram is shown where the voltage constraints are forecasted to occur. As it can be seen, the voltage violations are forecasted to occur towards the end of the feeder, that is, the nodes electrically more distant from the MV/LV distribution transformer.
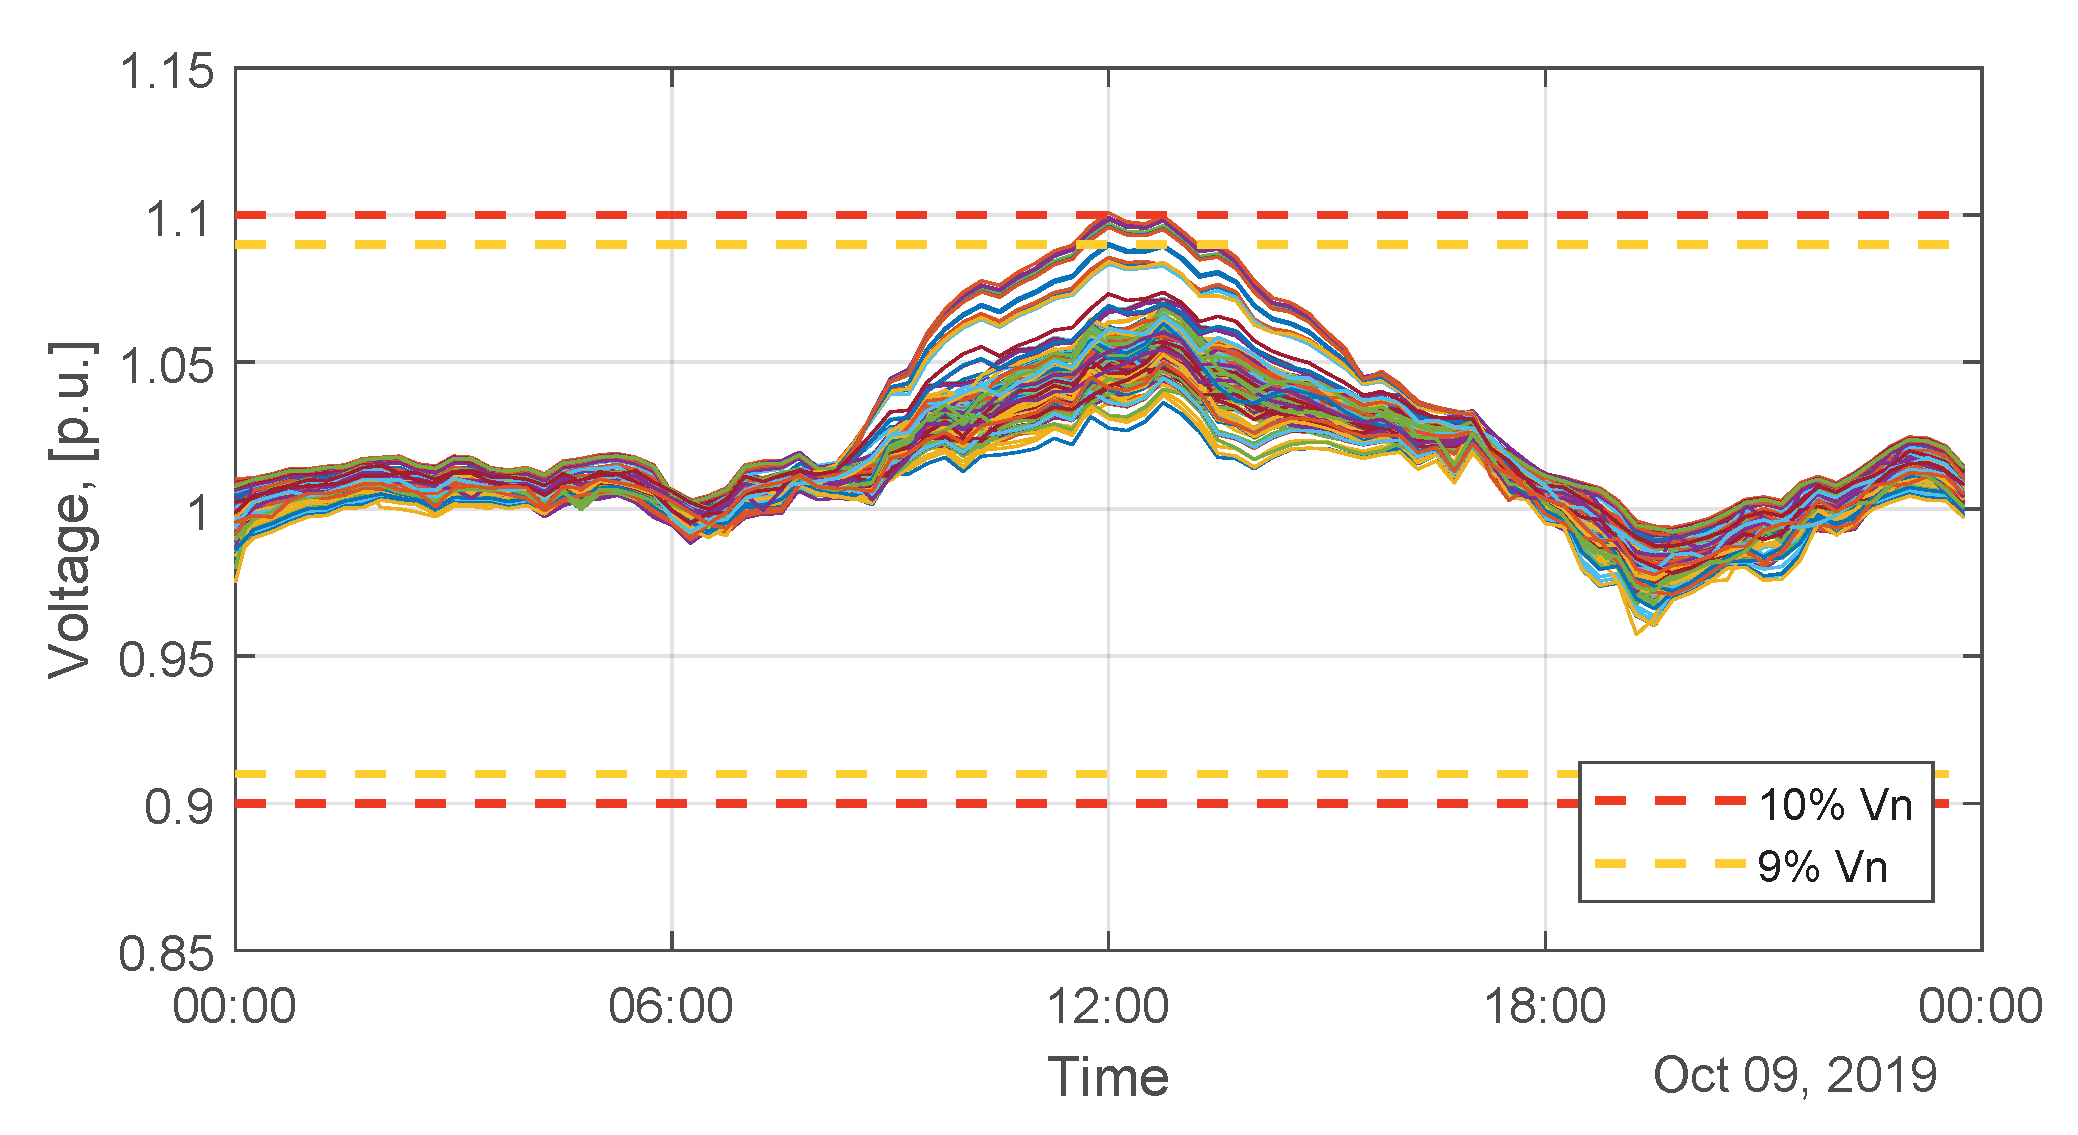
In Figure 12 and Figure 13 the forecasted voltage profiles are shown for every customer in the LV network for a 24-h control horizon, before and after the application of the LVC tool, respectively.
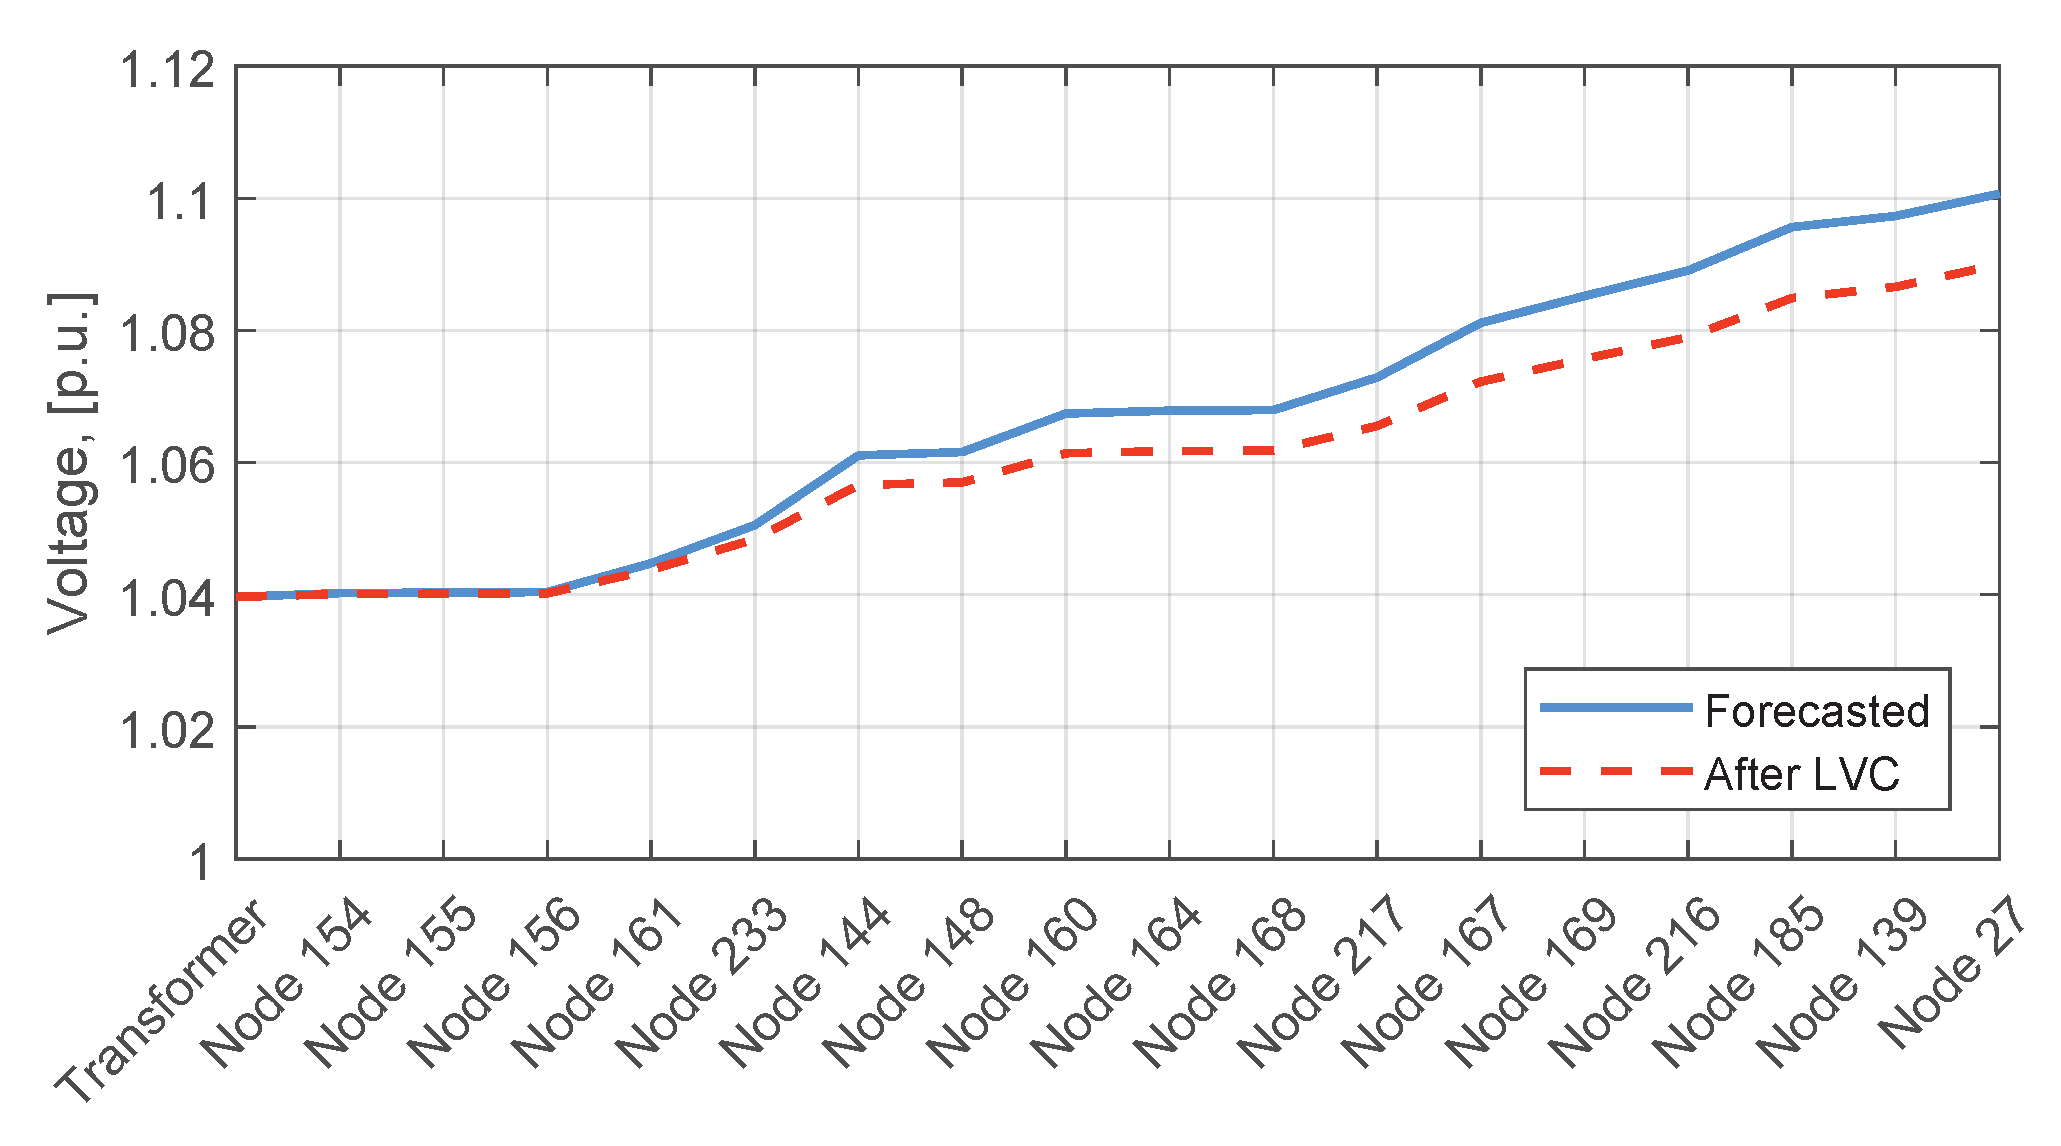
As shown in Figure 12, the voltage profiles, without the application of the LVC preventive control algorithm, surpass the predefined voltage magnitude upper limit during the solar peak production period of the day. Furthermore, it can also be seen that the voltage magnitude profiles tend to follow a curve similar to the solar PV production curve. This can be explained from the analysis of Figure 6. Since the consumption is low during the peak solar production period of the day, the excessive microgeneration leads to reverse power flows, thus resulting in a voltage rise. Figure 14 shows in greater detail the voltage rise effect for the feeder and time instant where the worst voltage violation is registered, with and without the application of the LVC algorithm.
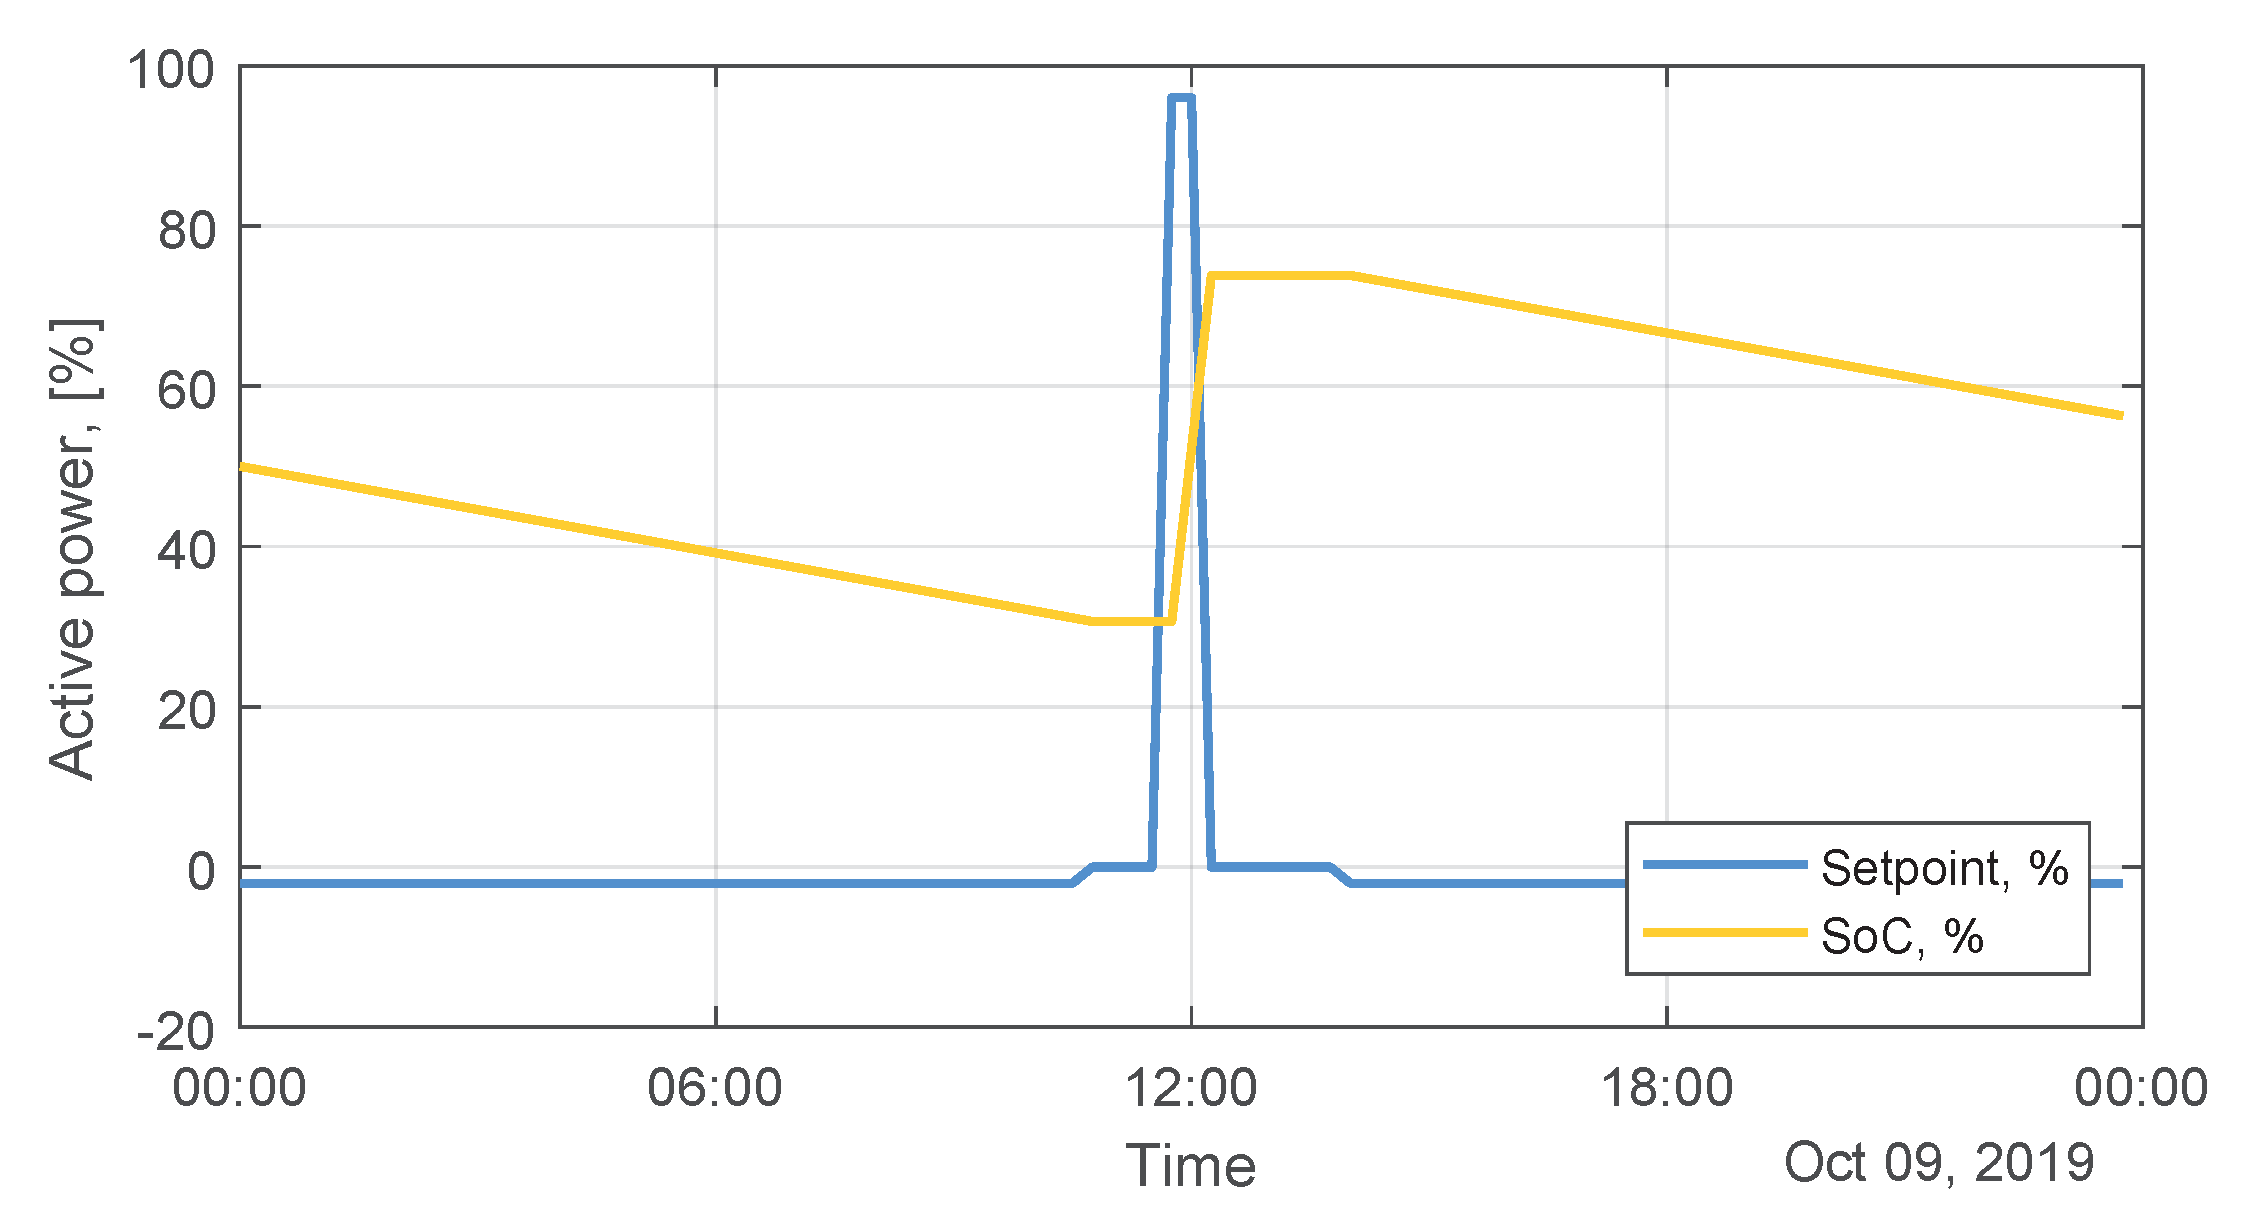
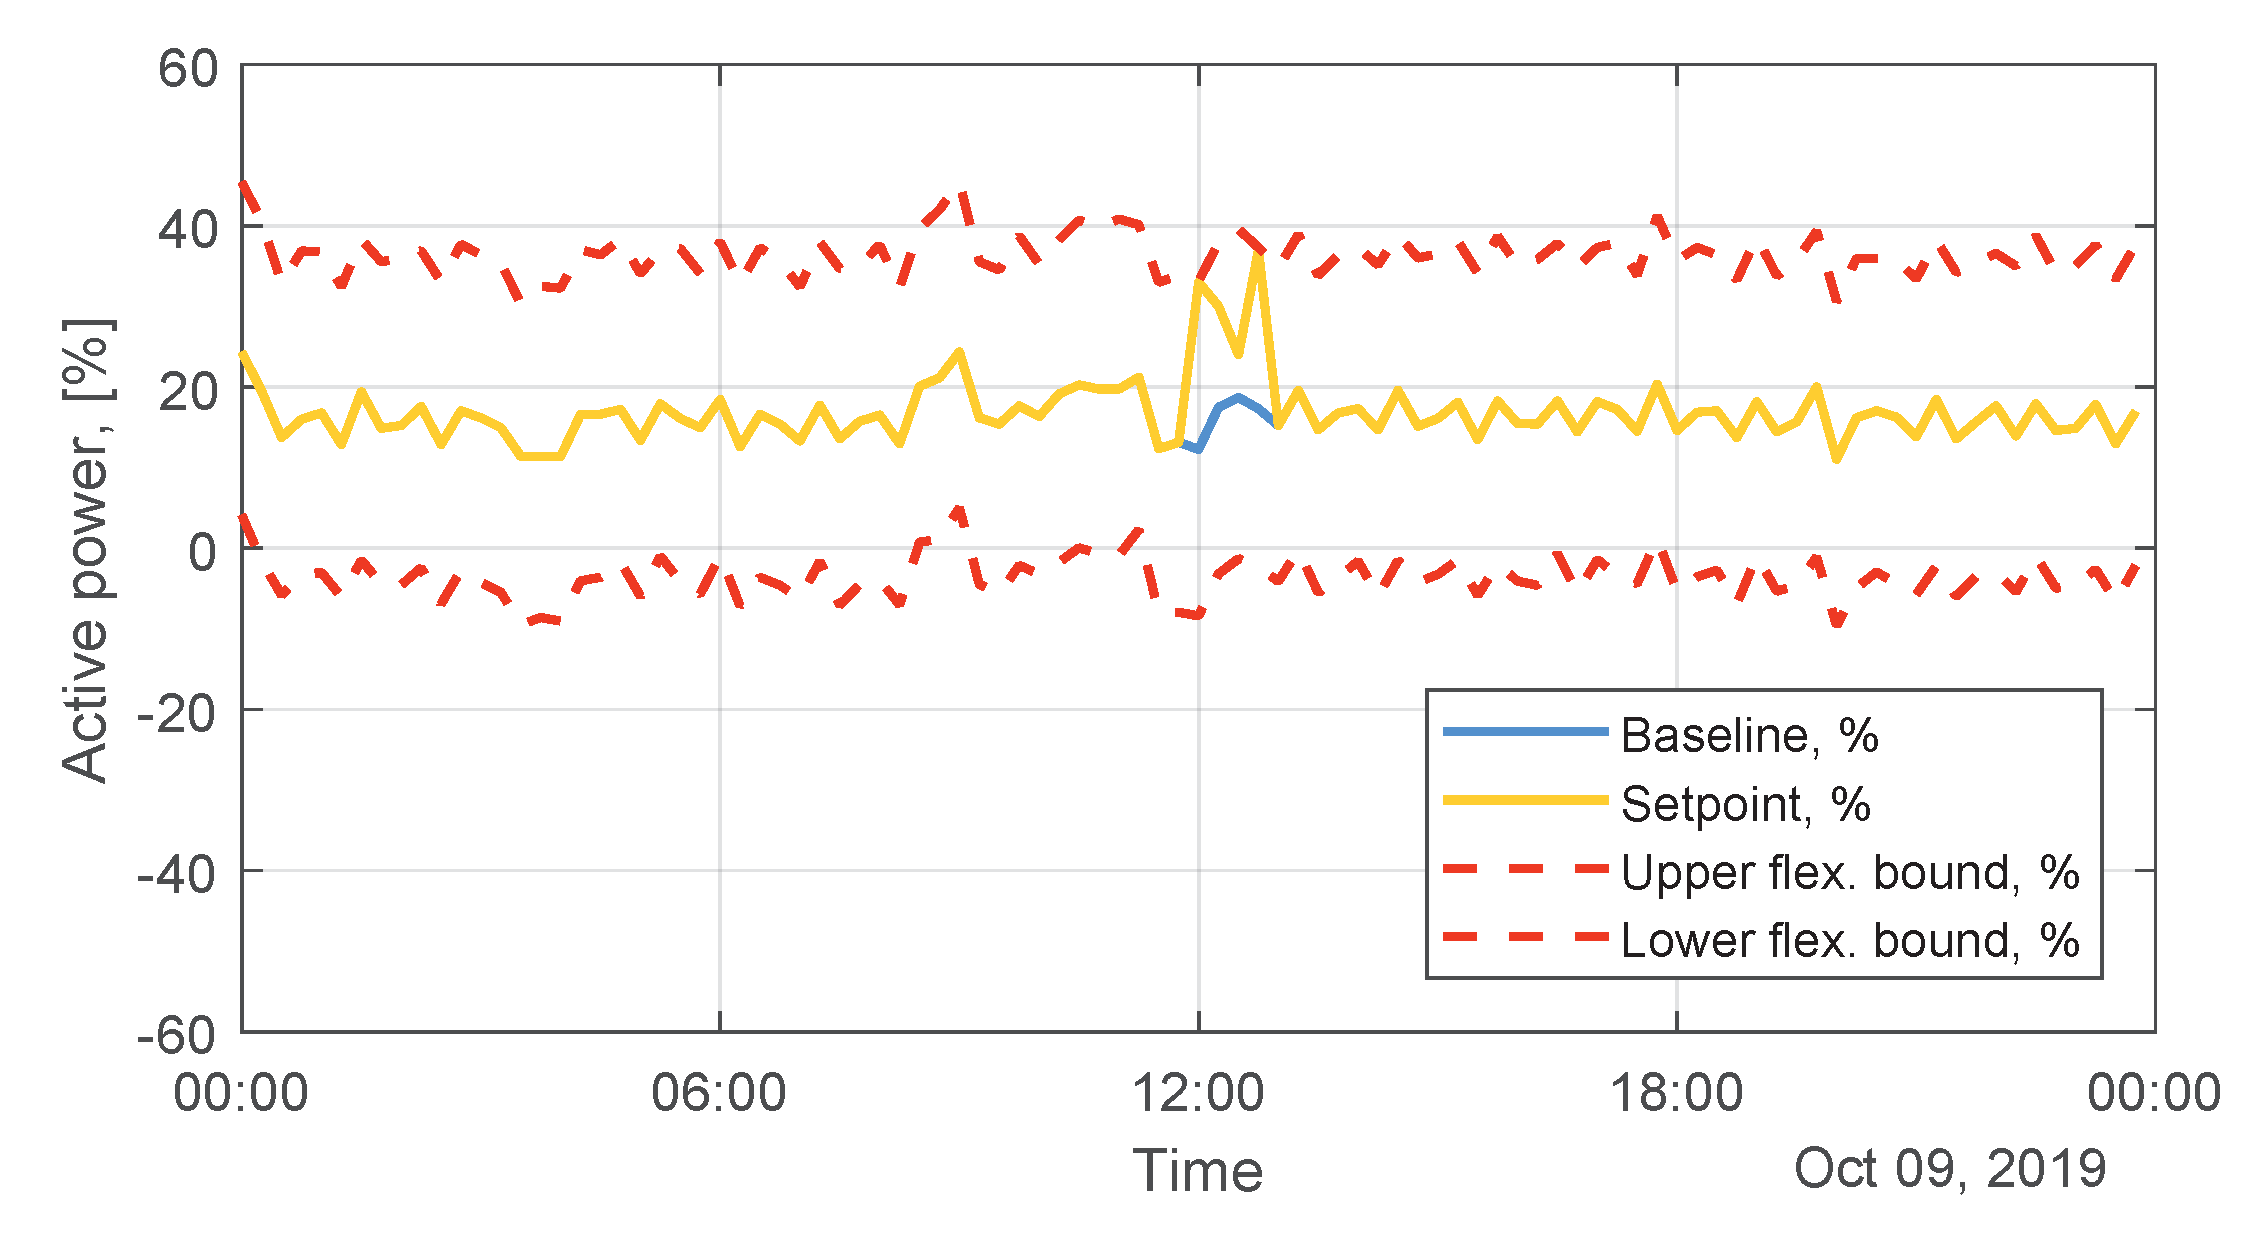
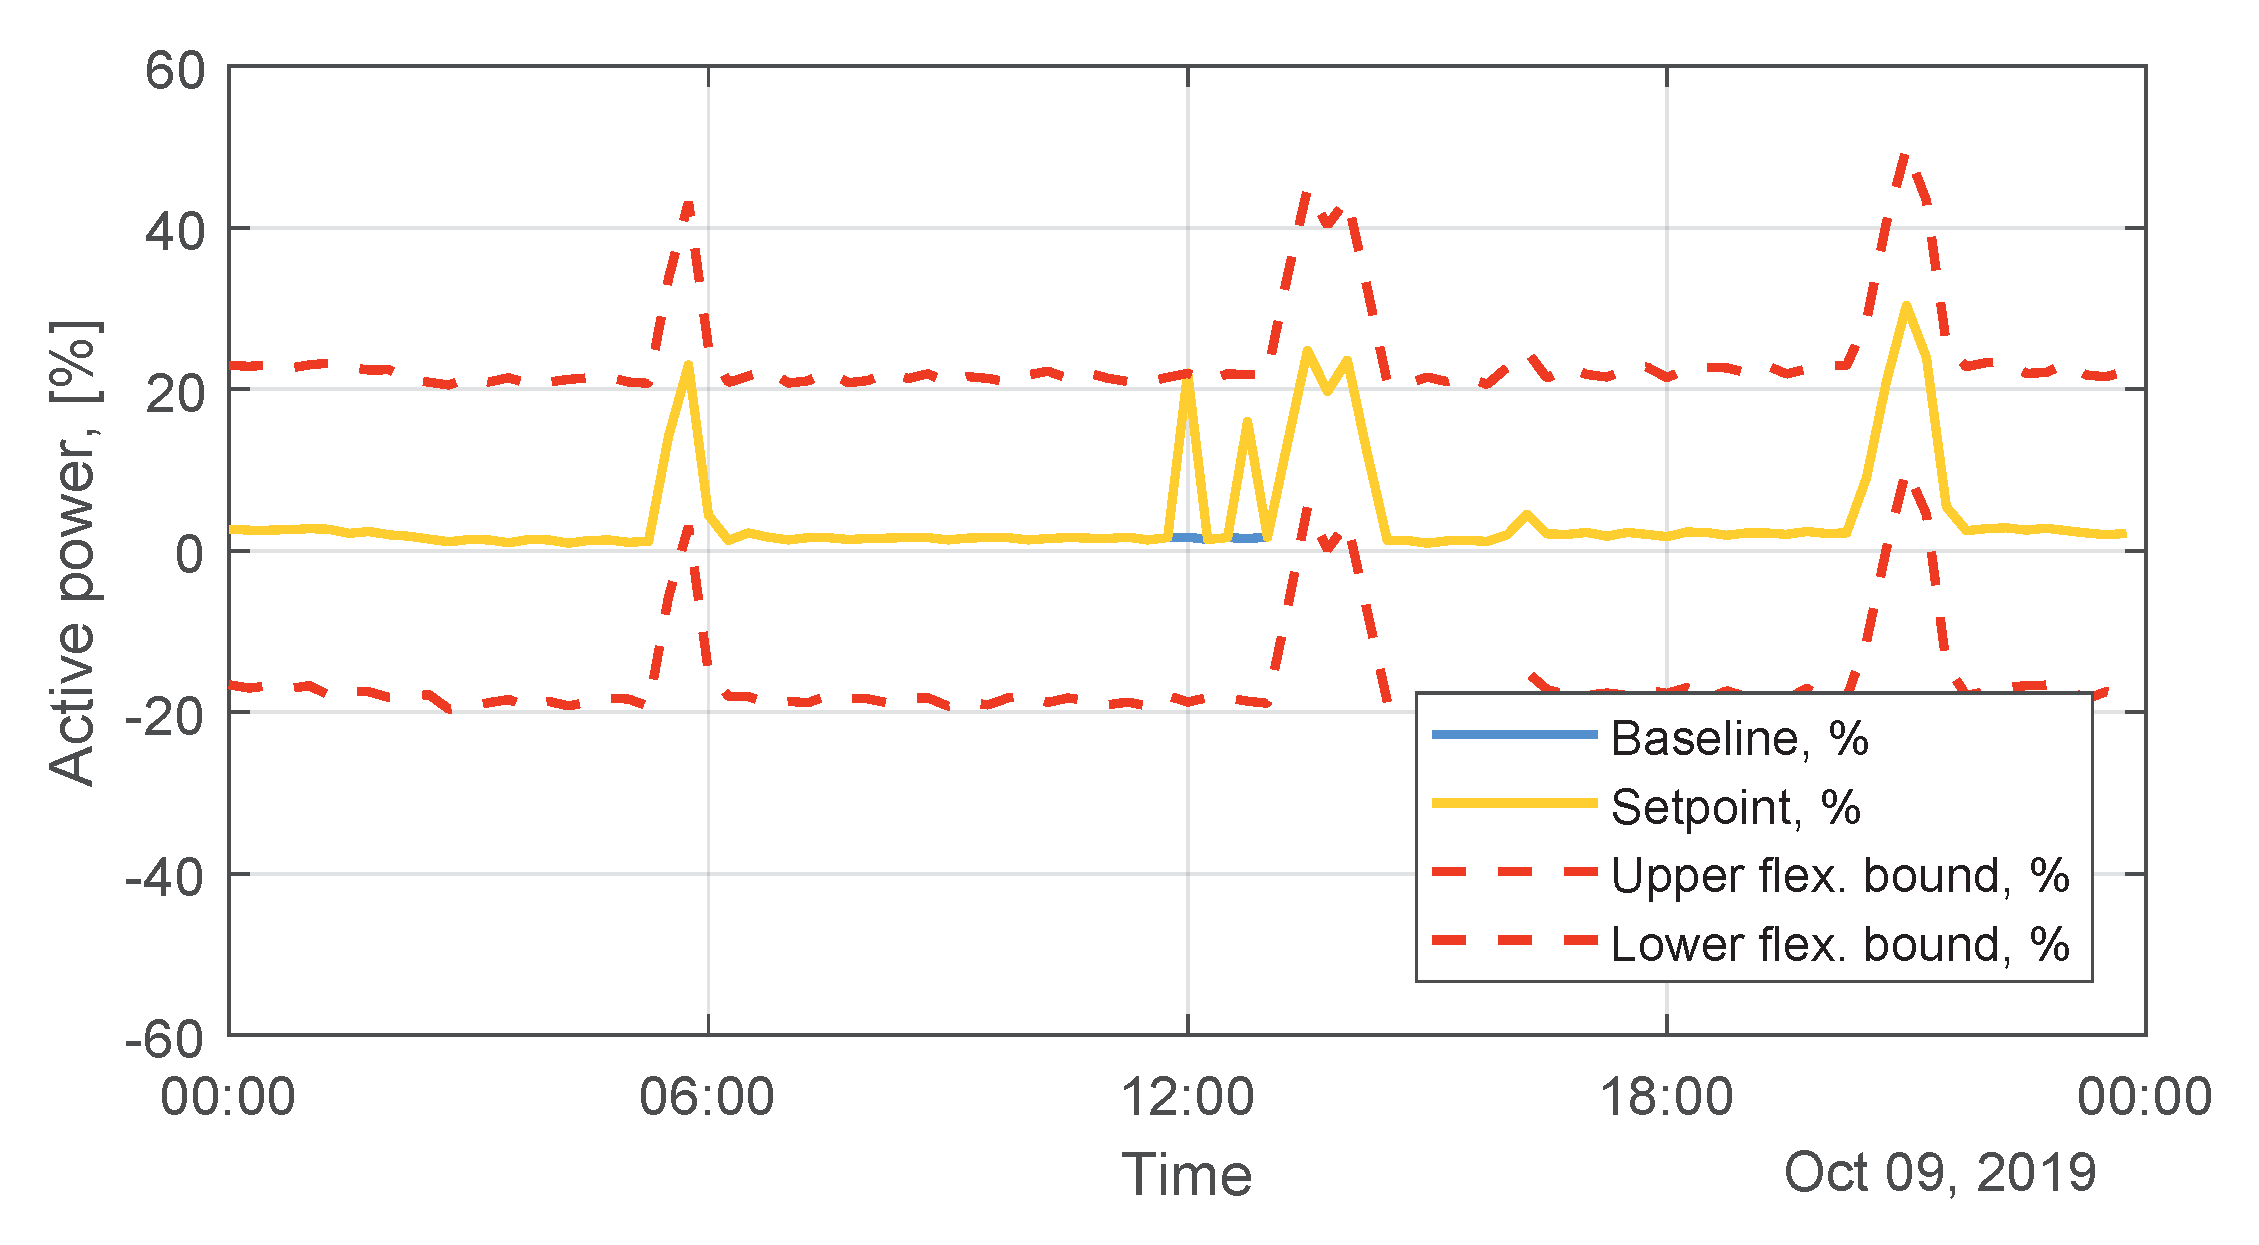
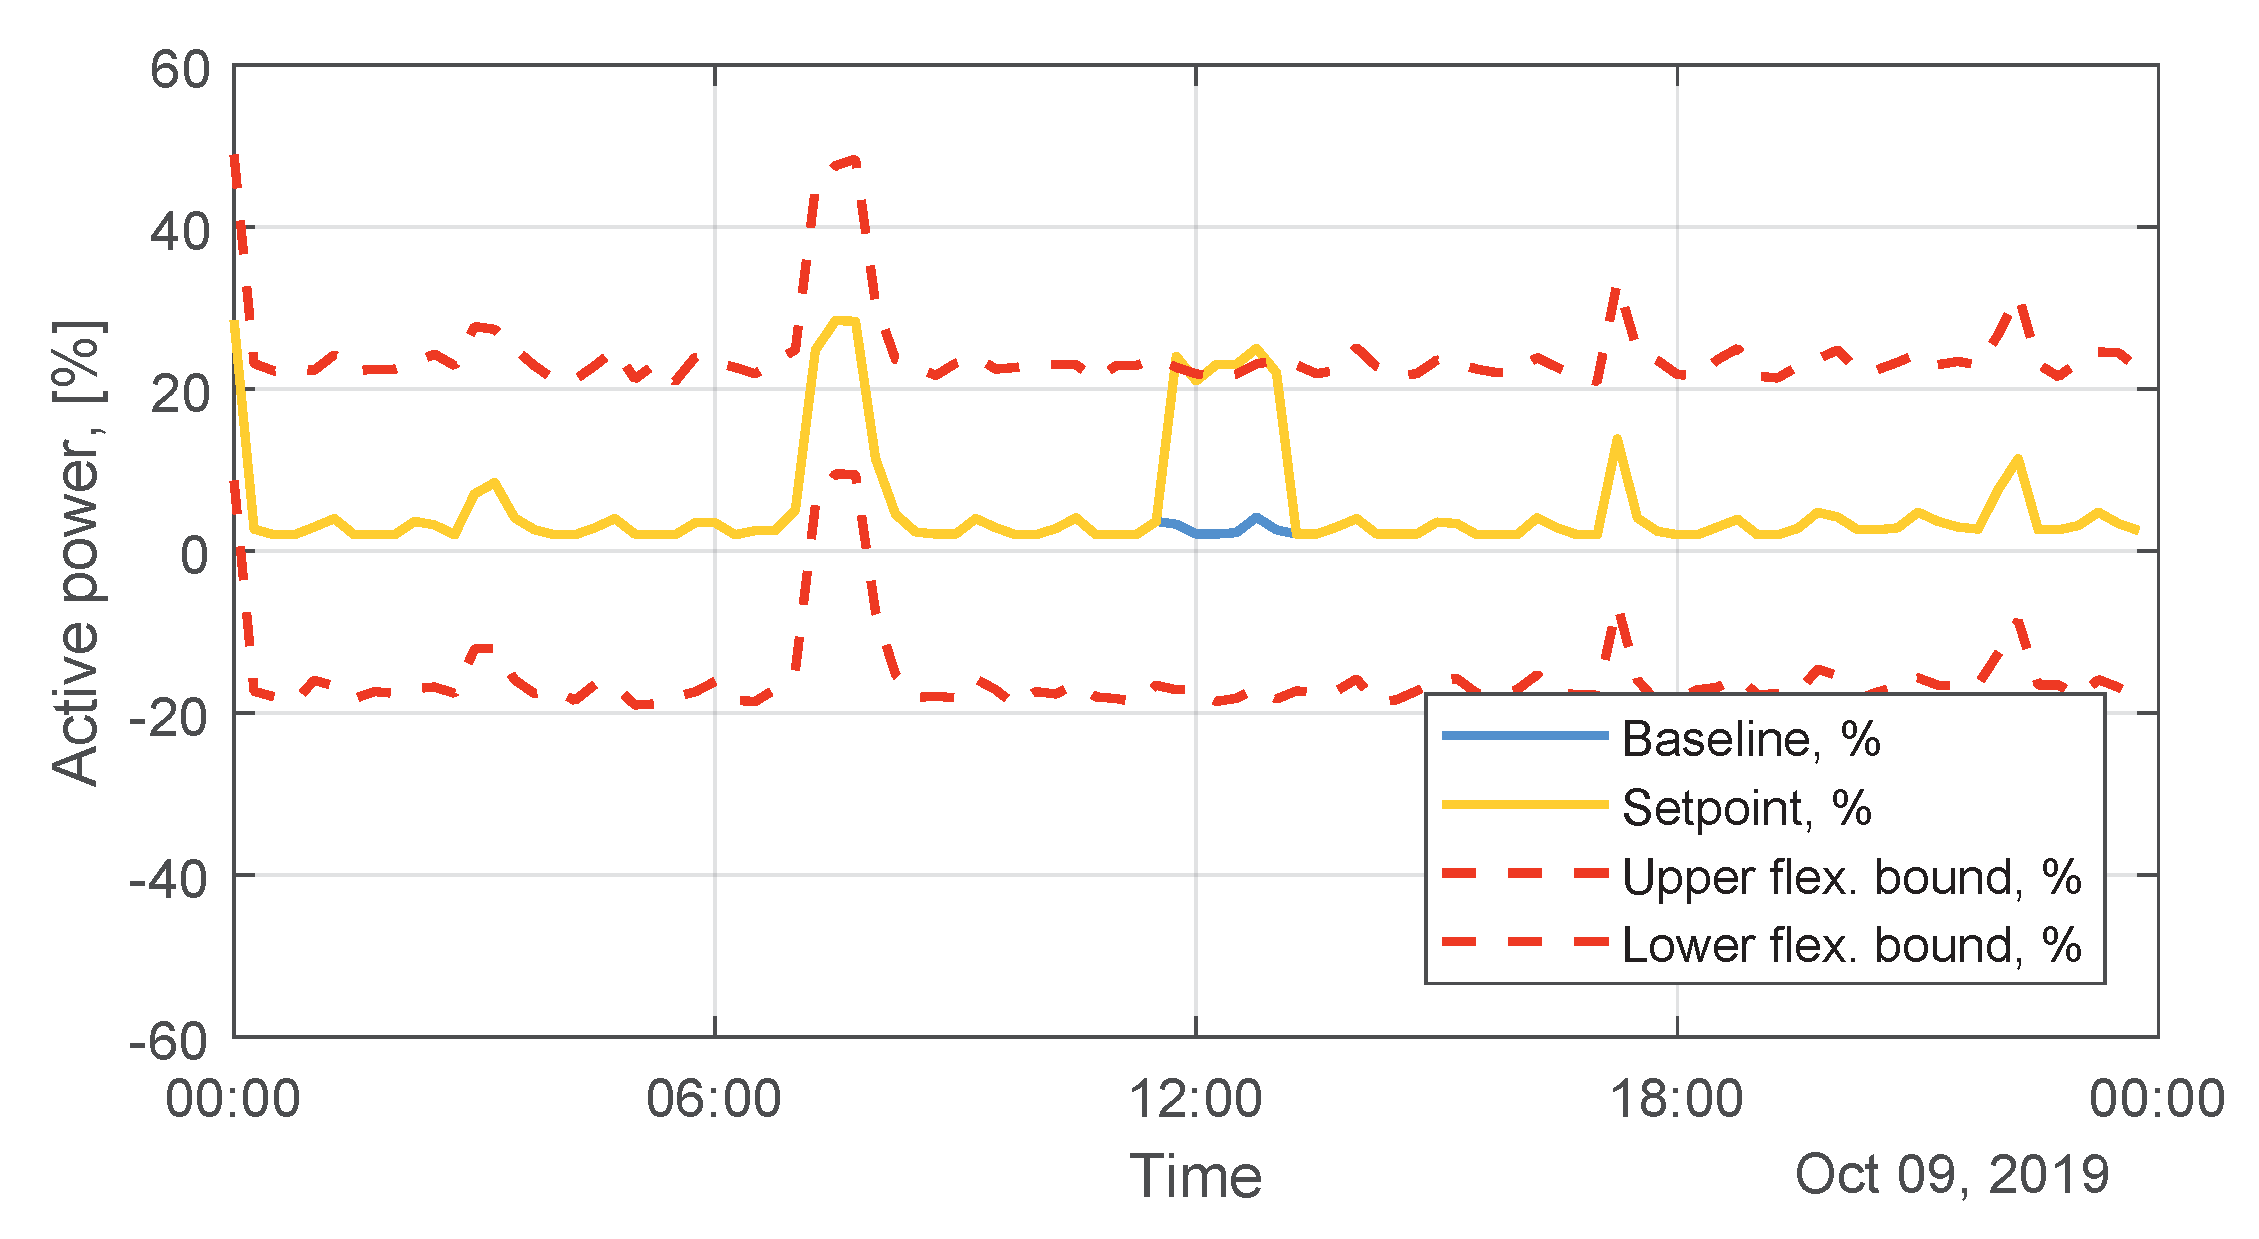
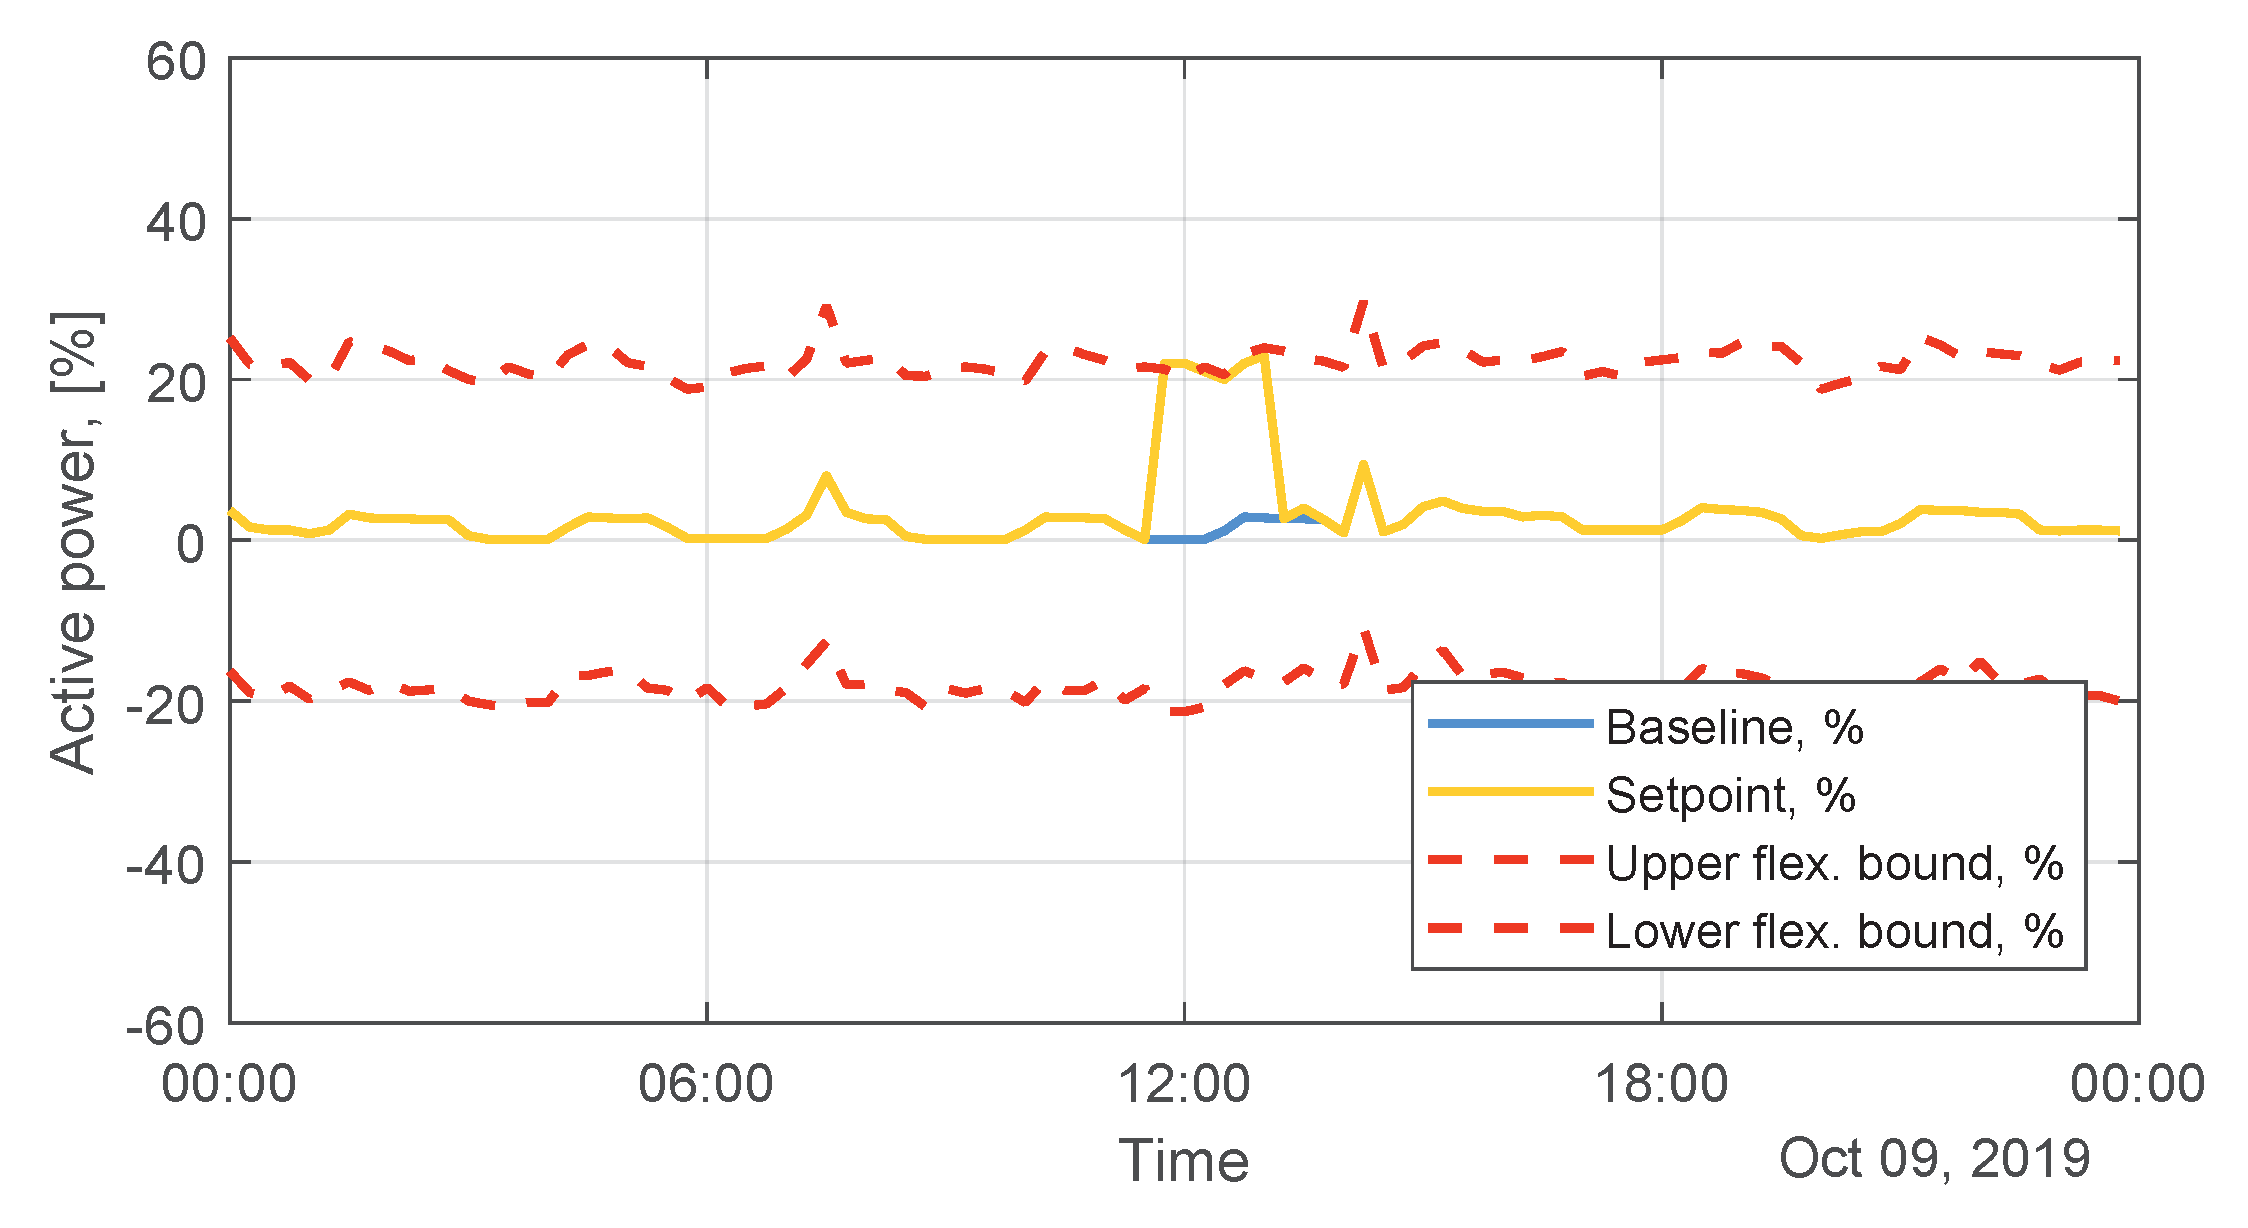
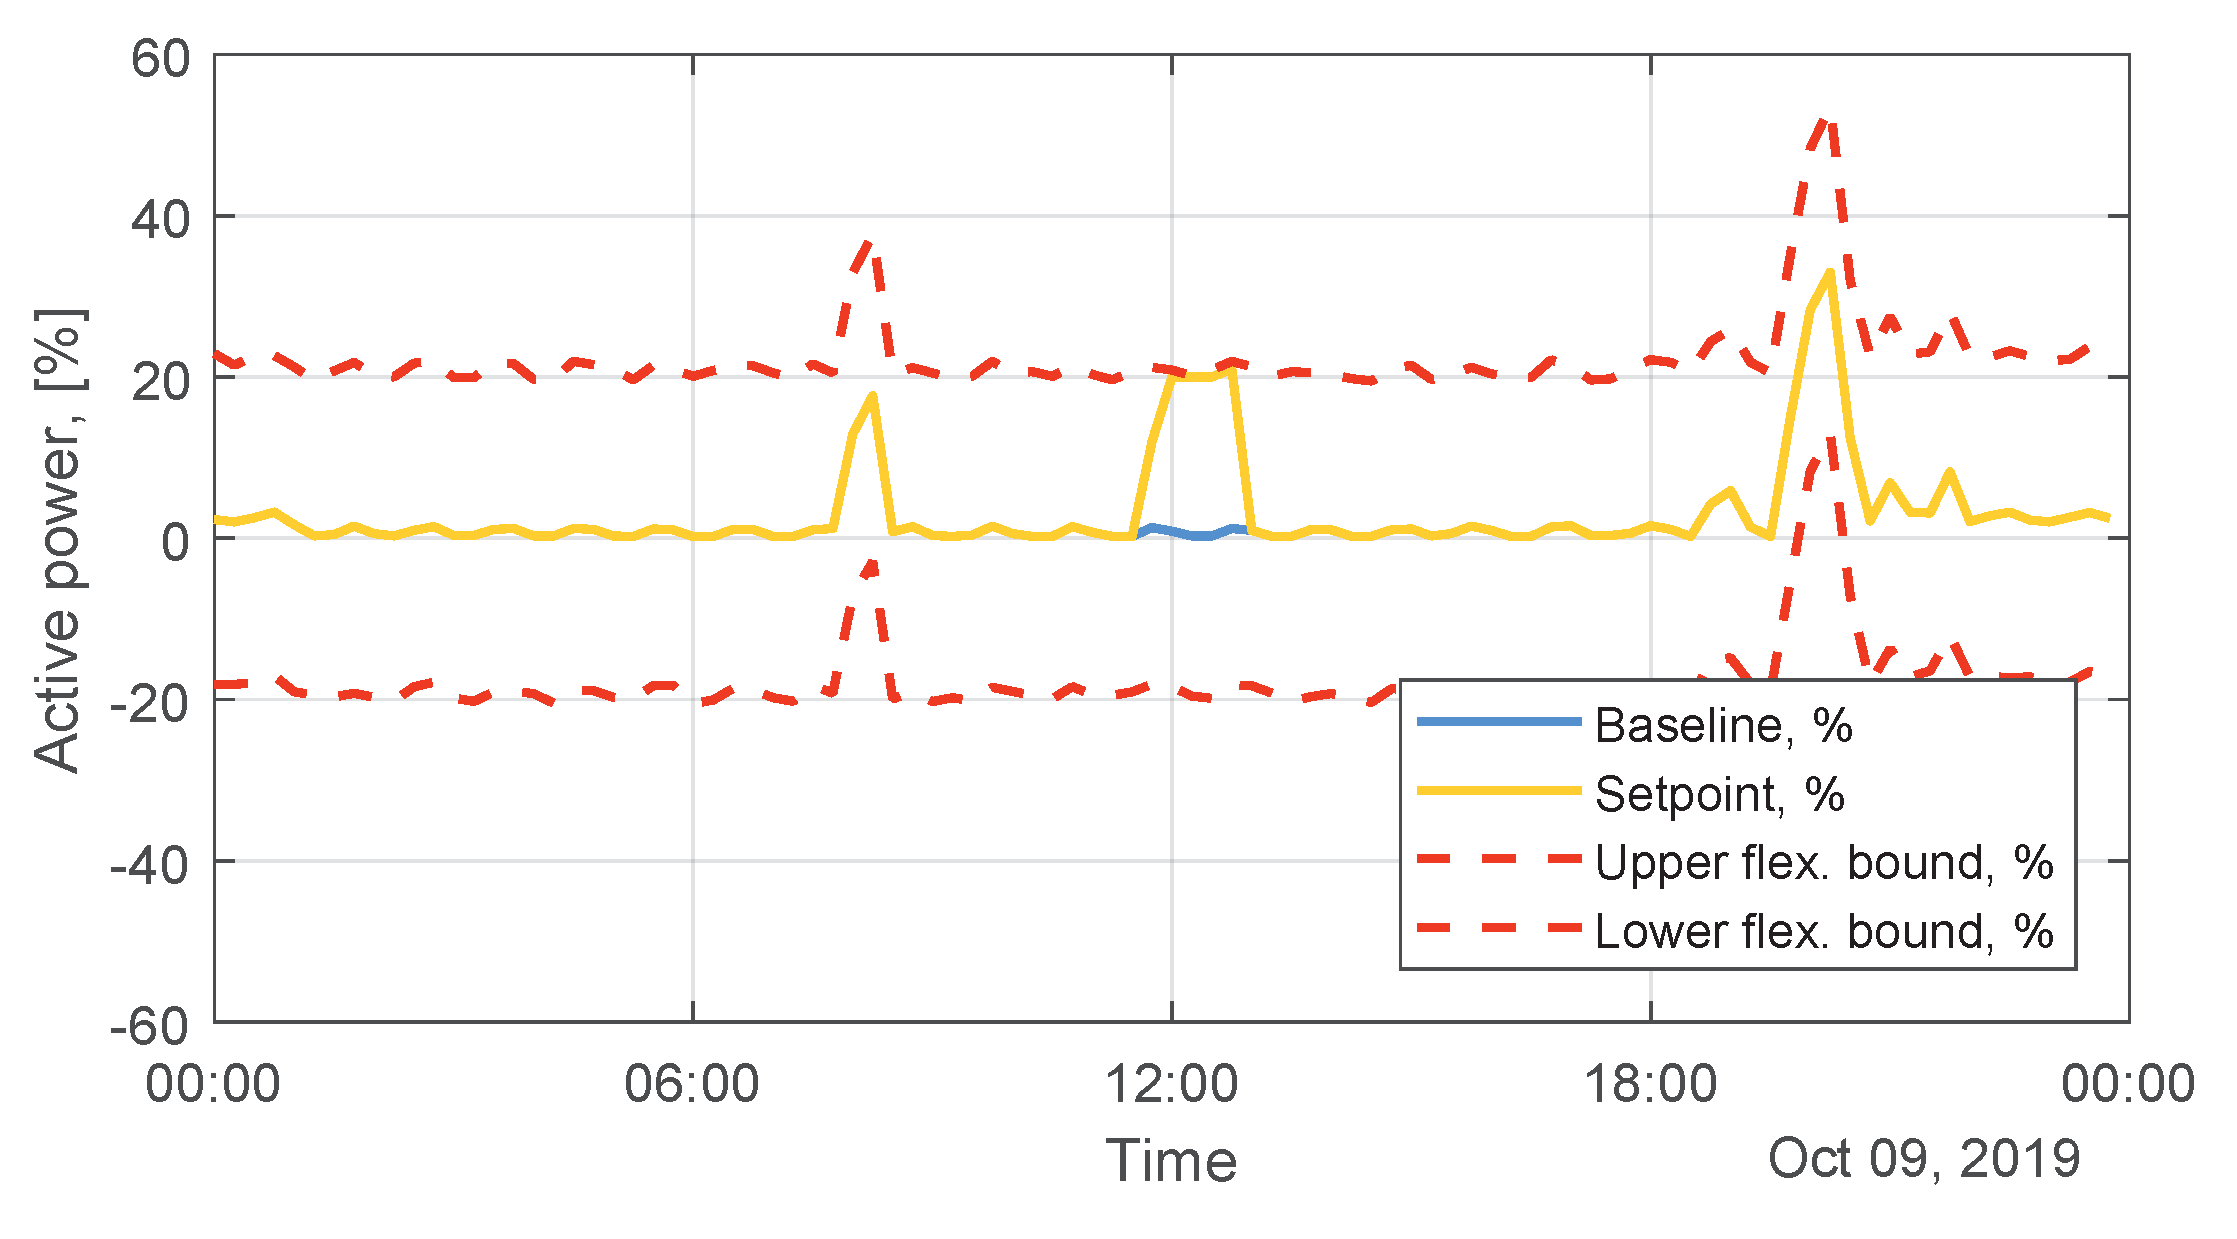
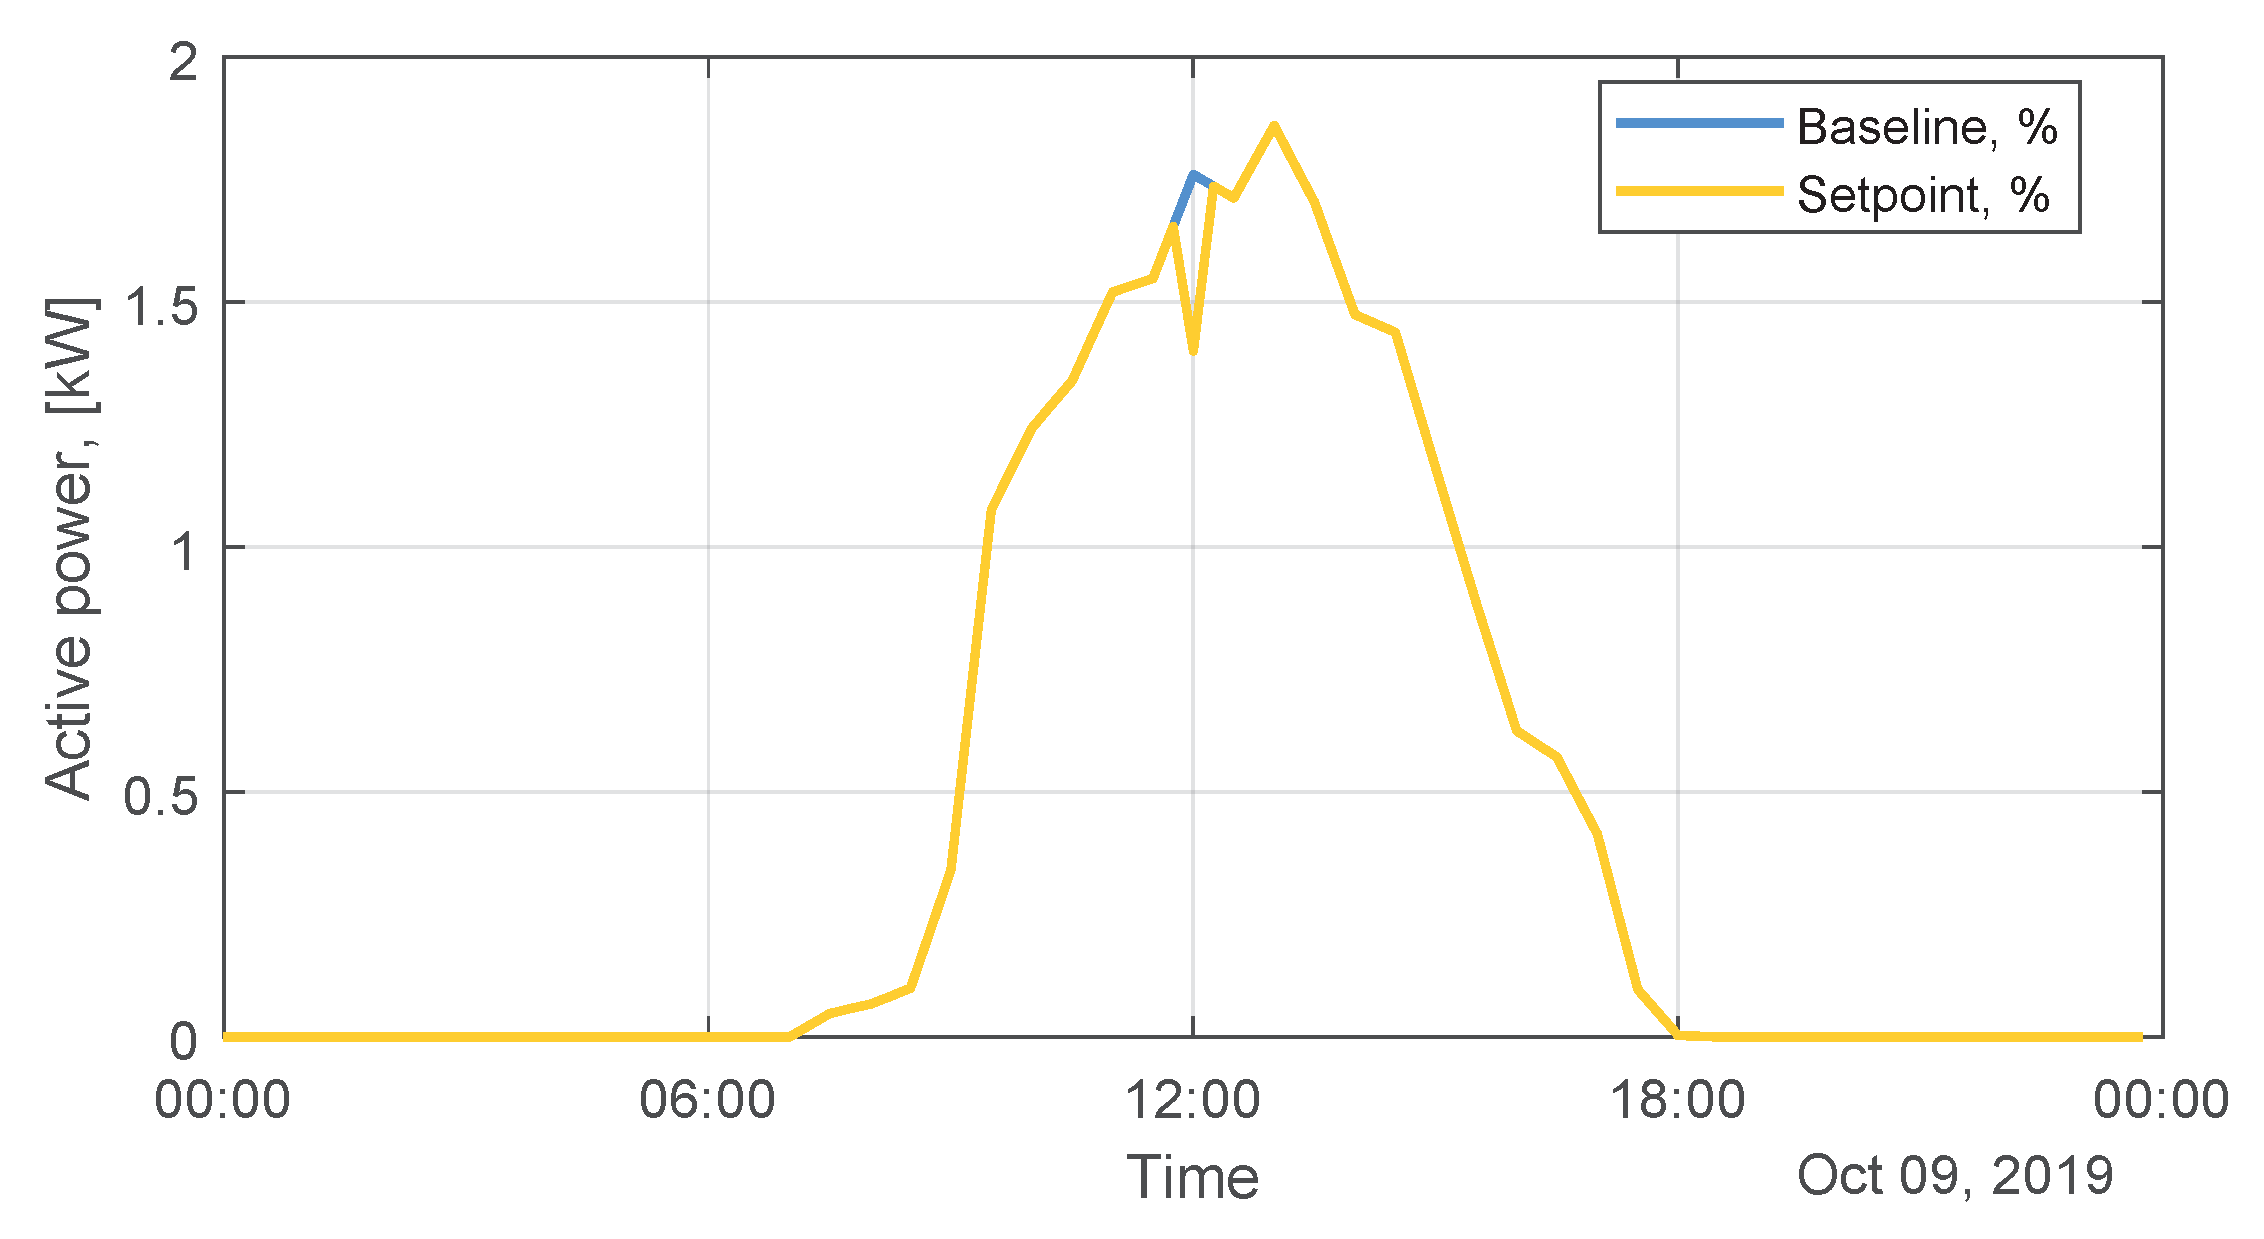
In Figure 15 the control action established to the DSO-owned storage device is shown. In Figure 16, Figure 17, Figure 18, Figure 19, Figure 20 and Figure 21 the control actions established to the consumers with HEMS are presented. In Table 5 a summary of the total flexibility provided by the HEMS is provided, together with the flexibility that is effectively requested by the LVC algorithm to the private consumers with HEMS.
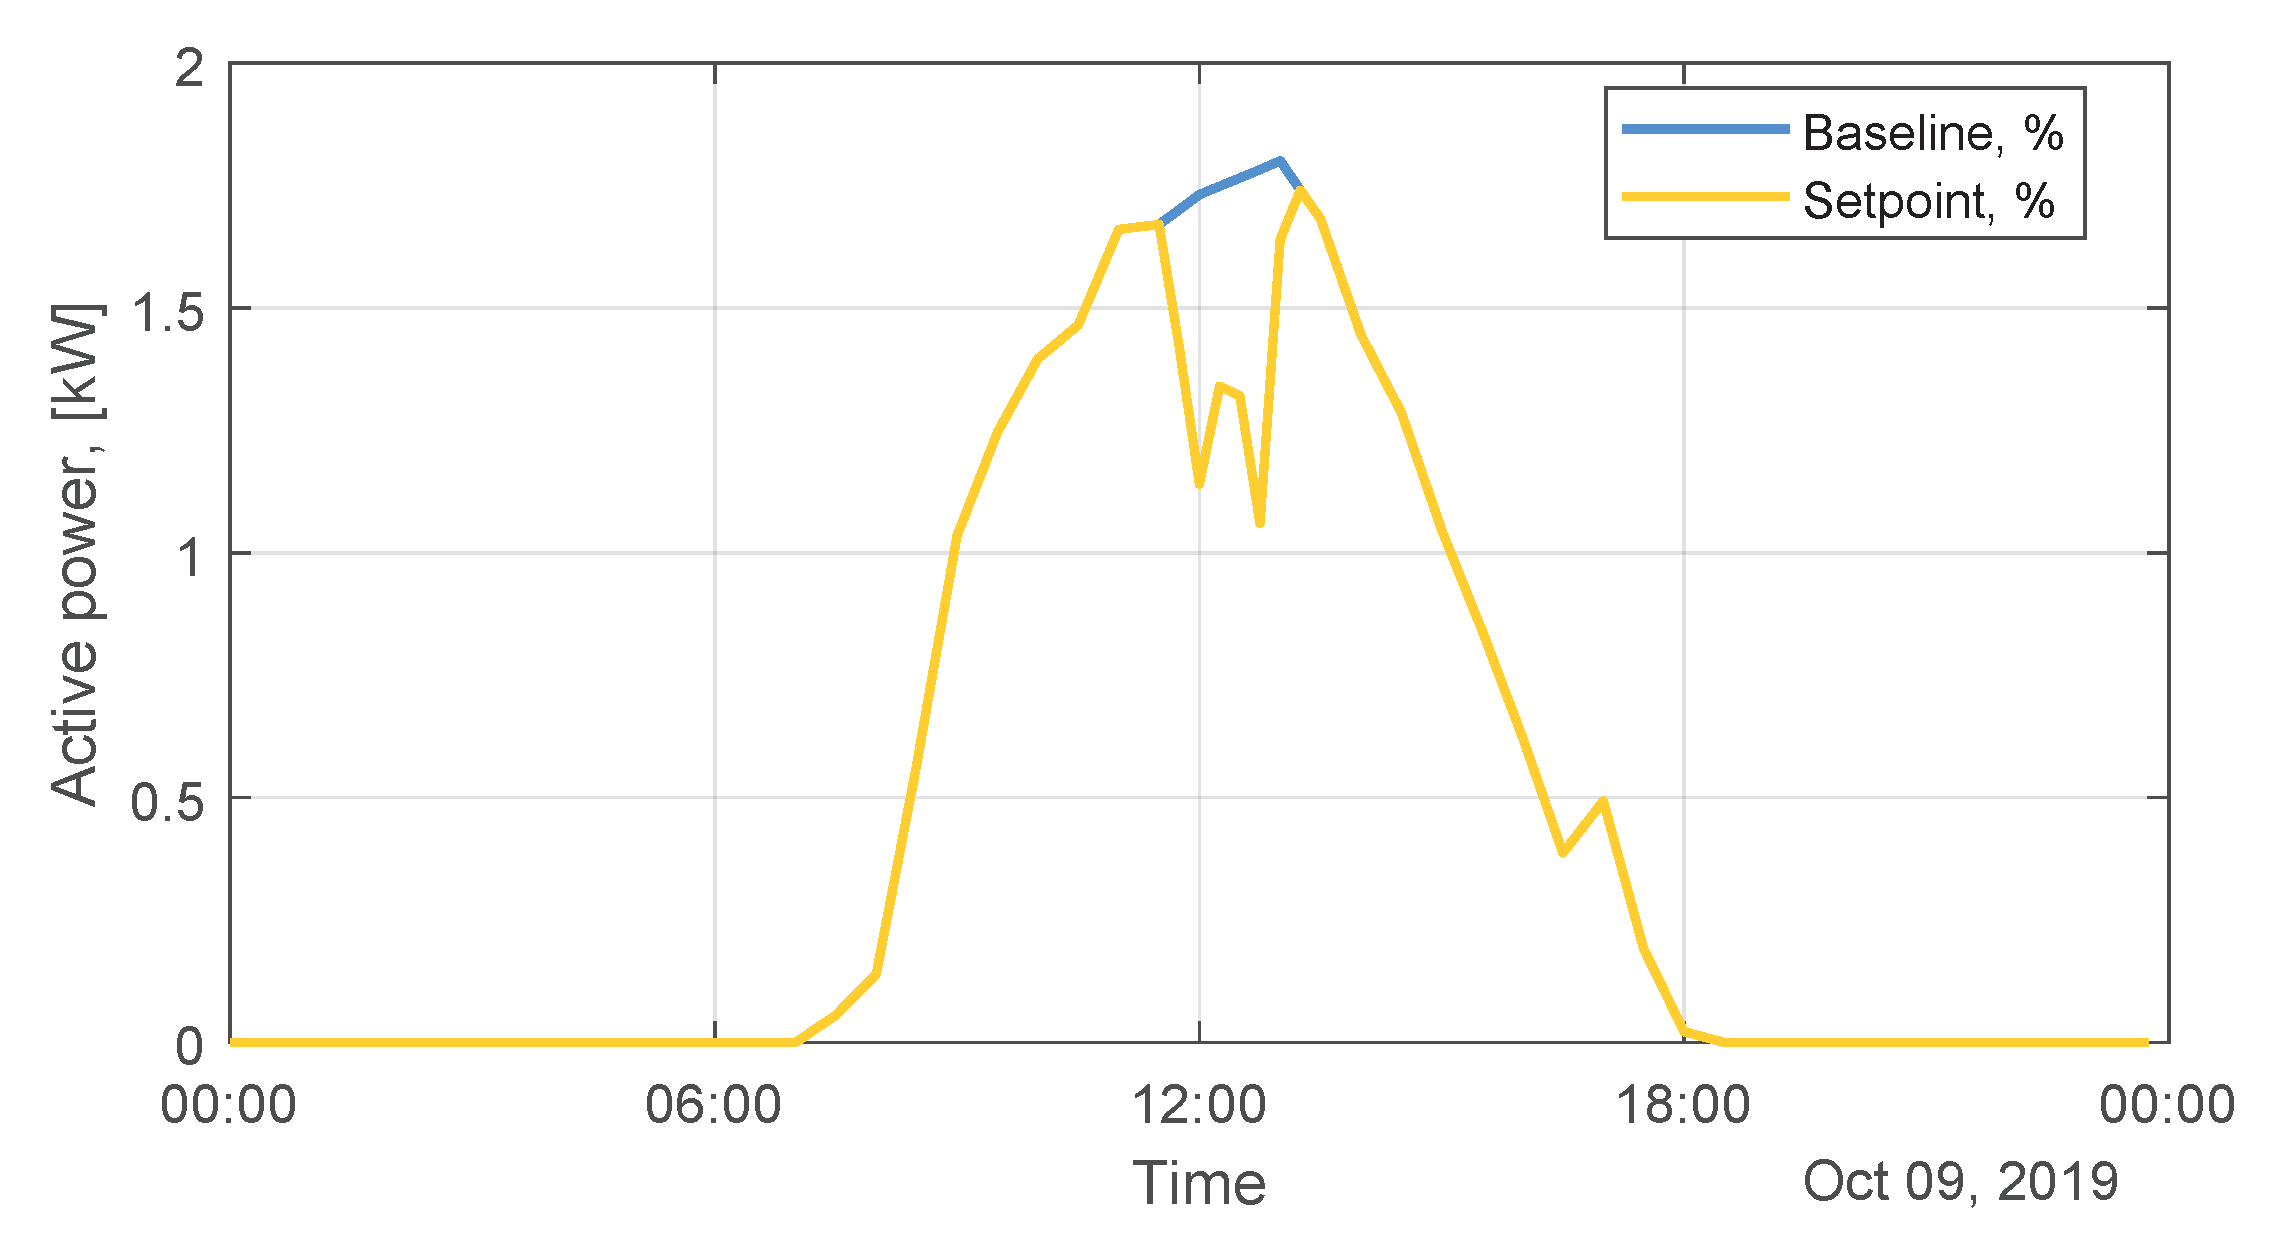
As can be seen from Figure 16, Figure 17, Figure 18, Figure 19, Figure 20 and Figure 21 and Table 5, the algorithm uses only a small amount of the total flexibility provided by the HEMS in order to perform the active management of the LV network. Simulation results for one year, based on the four representative days, estimate that the total flexibility required from domestic consumers is 1821.50 kWh, 3.47% of the total flexibility available. From the analysis of Figure 15, it can be seen that the LVC algorithm uses the energy storage device, once the overvoltage is registered at around 11:45, respecting the pre-established merit order. However, since the DSO-owned device is electrically far from the violation node (see Figure A1), it is unable to fully solve the voltage constraint. Once this resource is exhausted, the LVC selects the next DER, in this case the HEMS that is electrically closer to the voltage violation. The process continues until the voltage constraint is solved. From Figure 15 it can also be seen that the LVC algorithm tries to regularize the SoC of the storage device, in order not to jeopardize the availability of the resource for future time instants. To counteract the consumption peak registered at the peak solar production period of the day, the storage device slowly discharges during periods where it does not disturb the normal operation of the network, thus maintaining the SoC level at a safe point for the next control period. For comparison purposes, in Figure 22, Figure 23 and Figure 24 the control actions required to maintain the voltage magnitude within the limits are presented, if only generation curtailment was considered instead of using available flexibility.
As it can be seen from Figure 22, Figure 23 and Figure 24, a total of three generators would need to be curtailed, in order to maintain the voltage magnitude within the limits. The total amount of energy curtailment required to securely operate the network is 2.42 kWh. With the proposed method, no curtailment is required.
In Table 6 the active power losses are presented, with and without the application of the LVC tool, as well as the percentage of reduction that was obtained for the simulation day, and the annual estimation. As can be seen, a total reduction of 3.50% was achieved with the LVC tool for this scenario. For comparison purposes, if the curtailment strategy was adopted (Figure 22, Figure 23 and Figure 24), the total amount of losses would be 20.47 kWh, a reduction of 1.71%. With the proposed method, it is expected an annual loss reduction of 2.44%. This is an interesting result, since the reduction of the power losses is not an objective of the LVC algorithm. This result can be explained by the fact that the LVC algorithm tries to find the resource that is electrically closer to the node where the voltage constraint occurs, in practice reducing the power flows in the feeder.
The presented results show the potential of the proposed tool to be applied to highly stressed networks, allowing for their secure operation in scenarios of high DG penetration. Furthermore, from the DSO point-of-view, the LVC tool would allow to defer (or even avoid) large investments in network reinforcement and/or DSO-owned DER, such as ES devices, to maintain the secure and efficient operation of the network. Taking into account the current deployment state of AMI, it is reasonable to assume that the proposed solution could be deployed to real networks in the near future. The tool will be demonstrated on a smart grid pilot in Portugal, where the proposed functionalities will be tested in a real testbed to assess the robustness and efficiency of the proposed framework.

4. Conclusions

Voltage control of LV networks is a big concern for DSOs, especially in networks with high integration levels of DG. In this paper, a new algorithm for voltage control in LV grids that takes advantage of the available DER and flexibility from domestic consumers is presented. The proposed approach operates in two different time frames: a preventive plan for n-hours ahead and a scheme to implement corrective measures in real-time. Simulation results, in preparation for a trial in a real environment, were obtained where it was shown that the proposed approach was able to solve all of the foreseen voltage violations, recurring to the available flexibility from the different existing DER.
The unbalanced three-phase power flow algorithm used by the LVC tool was first evaluated by comparing the voltage values obtained with actual historical values for four typical days, representative of the four seasons. The algorithm showed a good performance, presenting MAPEs of 0.26% and 0.27% for the Summer and Autumn days, respectively, the latest data available. The LVC algorithm was tested using a real LV network, with real consumption and generation data. In the simulation scenario, it was shown that the LVC algorithm was able to regularize all of the foreseen voltage constraints during the peak solar production period of the day, recurring to the flexibility provided by the DSO-owned storage device and the flexibility provided by the domestic consumers. Furthermore, it was also shown that the LVC tool has a positive impact on the active power losses, although this is not a direct objective of the algorithm.
With the growing integration of DG and electrification of several sectors—such as transportation—, it is envisioned that LV networks will become highly stressed in the near future. The proposed algorithm intends to be a tool to apply in stressed LV networks, increasing the efficiency and security of operation, at the same time encouraging the participation of the private customer in grid operation. From the operator point-of-view, this kind of tools have the potential to defer large investments in grid reinforcement, while maintaining the quality of energy supply.
Within the framework of the H2020 InteGrid project, the algorithm will now be tested in a set of smart grid demonstration networks operated by EDP Distribuição, located in Portugal, in the first quarter of 2020 in the exact same network that was used for the simulation studies presented here.

Author Contributions

M.S. carried out the main research task and wrote the manuscript. A.G.M. proposed the original idea and contributed to the revision of the obtained results and of the whole manuscript. All authors have read and agreed to the published version of the manuscript.

Funding

The research leading to these results has received funding from the European Union’s Horizon 2020—The EU Framework Programme for Research and Innovation 2014–2020, under grant agreement No. 731218. The sole responsibility for the content published in this paper lies with the authors. It does not necessarily reflect the opinion of the European Commission. The European Commission is not responsible for any use that may be made of the information contained herein.

Acknowledgments

The authors would like to thank EDP Distribuição for the provision of the data used in the elaboration of this work.

Conflicts of Interest

The authors declare no conflict of interest.

Appendix A. Network Characterization

Figure A1. Simulation network characterization. Single-line diagram.
Applsci 10 02635 g0a1

References

  1. Peças Lopes, J.A.; Hatziargyriou, N.; Mutale, J.; Djapic, P.; Jenkins, N. Integrating distributed generation into electric power systems: A review of drivers, challenges and opportunities. Electr. Power Syst. Res. 2007, 77, 1189–1203. [Google Scholar] [CrossRef] [Green Version]
  2. Ismael, S.M.; Aleem, S.H.E.; Abdelaziz, A.Y.; Zobaa, A.F. State-of-the-art of hosting capacity in modern power systems with distributed generation. Renew. Energy 2018, 130, 1002–1020. [Google Scholar] [CrossRef]
  3. Jenkins, N.; Ekanayake, J.; Strbac, G. Distributed Generation; Institution of Engineering and Technology: London, UK, 2010. [Google Scholar]
  4. CENELEC. EN 50160: Voltage Characteristics of Electricity Supplied by Public Distribution Systems; CENELEC: Brussels, Belgium, 2001. [Google Scholar]
  5. Emmanuel, M.; Rayudu, R. Evolution of dispatchable photovoltaic system integration with the electric power network for smart grid applications: A review. Renew. Sustain. Energy Rev. 2016, 67, 207–224. [Google Scholar] [CrossRef]
  6. Navarro-Espinosa, A.; Ochoa, L.F. Increasing the PV hosting capacity of LV networks: OLTC-fitted transformers vs. reinforcements. In Proceedings of the 2015 IEEE Power & Energy Society Innovative Smart Grid Technologies Conference (ISGT), Washington, DC, USA, 18–20 February 2015. [Google Scholar]
  7. Vovos, P.N.; Kiprakis, A.E.; Wallace, A.R.; Harrison, G.P. Centralized and Distributed Voltage Control: Impact on Distributed Generation Penetration. IEEE Trans. Power Syst. 2007, 22, 476–483. [Google Scholar] [CrossRef] [Green Version]
  8. Kulmala, A.; Maki, K.; Repo, S.; Jarventausta, P. Active Voltage Level Management of Distribution Networks with Distributed Generation using On Load Tap Changing Transformers. In Proceedings of the 2007 IEEE Lausanne Power Tech, Lausanne, Switzerland, 1–5 July 2007. [Google Scholar]
  9. Pukhrem, S.; Basu, M.; Conlon, M.F.; Sunderland, K. Enhanced Network Voltage Management Techniques Under the Proliferation of Rooftop Solar PV Installation in Low-Voltage Distribution Network. IEEE J. Emerg. Select. Top. Power Electron. 2017, 5, 681–694. [Google Scholar] [CrossRef]
  10. Rocabert, J.; Luna, A.; Blaabjerg, F.; Rodríguez, P. Control of Power Converters in AC Microgrids. IEEE Trans. Power Electron. 2012, 27, 4734–4749. [Google Scholar] [CrossRef]
  11. Ahmed, K.H.; Massoud, A.M.; Adam, G.P.; Zobaa, A.F. A state of the art review of control techniques for power electronics converter based distributed generation systems in different modes of operation. In Proceedings of the 2013 International Conference on Renewable Energy Research and Applications (ICRERA), Madrid, Spain, 20–23 October 2013. [Google Scholar]
  12. Costa, H.M.; Sumaili, J.; Madureira, A.G.; Gouveia, C. A multi-temporal optimal power flow for managing storage and demand flexibility in LV networks. In Proceedings of the 2017 IEEE Manchester PowerTech, Manchester, UK, 18–22 June 2017; pp. 1–6. [Google Scholar]
  13. Olival, P.C.; Madureira, A.G.; Matos, M. Advanced voltage control for smart microgrids using distributed energy resources. Electr. Power Syst. Res. 2017, 146, 132–140. [Google Scholar] [CrossRef]
  14. Rahbar, K.; Xu, J.; Zhang, R. Real Time Energy Storage Management for Renewable Integration in Microgrid An OffLine Optimization Approach in on Smart Grid. IEEE Trans. Smart Grid 2015, 6, 124–134. [Google Scholar] [CrossRef]
  15. Shivarudraswamy, R.; Gaonkar, D.N. Coordinated Voltage Regulation of Distribution Network with Distributed Generators and Multiple Voltage-control Devices. Electr. Power Compon. Syst. 2012, 40, 1072–1088. [Google Scholar] [CrossRef]
  16. Montoya, O.D.; Gil-González, W.; Grisales-Noreña, L.; Orozco-Henao, C.; Serra, F. Economic Dispatch of BESS and Renewable Generators in DC Microgrids Using Voltage-Dependent Load Models. Energies 2019, 2, 4494. [Google Scholar] [CrossRef] [Green Version]
  17. Marín, L.G.; Sumner, M.; nöz-Carpintero, D.M.; Köbrich, D.; Pholboon, S.; Sáez, D.; Núñez, A.N. Hierarchical Energy Management System for Microgrid Operation Based on Robust Model Predictive Control. Energies 2019, 12, 4453. [Google Scholar] [CrossRef] [Green Version]
  18. Wang, L.; Liang, D.H.; Crossl, A.F.; Taylor, P.C.; Jones, D.; Wade, N.S. Coordination of Multiple Energy Storage Units in a Low Voltage Distribution Network. IEEE Trans. Smart Grid 2015, 6, 2906–2918. [Google Scholar] [CrossRef] [Green Version]
  19. Costa, H.; Miranda, M.; Ramos, J.; Seca, L.; Madureira, A.; Lemos, D.; Santana, R.; Louro, M.; Matos, P.G.; Rosa, L.; et al. Voltage Control Demonstration for LV Networks with Controllable DER - The SuSTAINABLE Project Approach. In Proceedings of the Electrical Networks for Society and People, CIRED 2016 Workshop, Helsinki, Finland, 14–15 June 2016; pp. 1–4. [Google Scholar]
  20. Ou-Yang, J.X.; Long, X.X.; Du, X.; Diao, Y.B.; Li, M.Y. Voltage Control Method for Active Distribution Networks Based on Regional Power Coordination. Energies 2019, 12, 4364. [Google Scholar] [CrossRef] [Green Version]
  21. Hua, Y.; Shentu, X.; Xie, Q.; Ding, Y. Voltage/Frequency Deviations Control via Distributed Battery Energy Storage System Considering State of Charge. Energies 2019, 9, 1148. [Google Scholar] [CrossRef] [Green Version]
  22. InteGrid. Demonstration of INTElligent Grid Technologies for Renewables INTEgration and INTEractive Consumer Participation Enabling INTEroperable Market Solutions and INTErconnected Stakeholders (InteGrid), Horizon 2020 Project. Available online: https://integrid-h2020.eu/ (accessed on 31 January 2020).
  23. Costa, J.; Trocato, C.; Moreira, J.; Rua, D.; Madureira, A.; Fonseca, D. LV Network Control Architecture: H2020 InteGrid Case Study. In Proceedings of the Microgrids and Local Energy Communities, CIRED 2018 Workshop, Ljubljana, Slovenia, 7–8 June 2018; pp. 1–4. [Google Scholar]
  24. Simões, M.F.S.; Costa, H.M.; Madureira, A.G. Predictive Voltage Control for LV Distribution Grids exploiting Flexibility from Domestic Customers. In Proceedings of the Mediterranean Conference on Power Generation, Transmission, Distribution and Energy Conversion (MEDPOWER 2018), Dubrovnik, Croatia, 12–15 November 2018; pp. 1–7. [Google Scholar]
  25. Abreu, C.; Soares, I.; Oliveira, L.; Rua, D.; Machado, P.; Carvalho, L.; Lopes, J.A.P. Application of Genetic Algorithms and the Cross-Entropy Method in Practical Home Energy Management Systems. IET Renew. Power Gener. 2019, 13, 1474–1483. [Google Scholar] [CrossRef]
  26. Bessa, R.; Coelho, F.; Rodrigues, X.; Alonso, A.; Soares, T.; Pires, G.; Matos, P.G.; Prates, I.; Shahrokni, H.; Mäkivierikko, A. Grid and Market Hub: Empowering Local Energy Communities in InteGrid. In Proceedings of the CIRED 2018 Workshop, Ljubljana, Slovenia, 7–8 June 2018. [Google Scholar]
  27. Andrade, J.R.; Bessa, R.J. Improving renewable energy forecasting with a grid of numerical weather predictions. IEEE Trans. Sustain. Energy 2017, 8, 1571–1580. [Google Scholar] [CrossRef] [Green Version]
  28. Viana, J.; Bessa, R.J.; Sousa, J. Load Forecasting Benchmark for Smart Meter Data. In Proceedings of the 2019 IEEE Milan PowerTech, Milan, Italy, 23–27 June 2019. [Google Scholar]
  29. Bessa, R.J.; Sampaio, G.; Pereira, J.; Miranda, V. Probabilistic low voltage state estimation using analog-search techniques. In Proceedings of the 20th Power Systems Computation Conference (PSCC 2018), Dublin, Ireland, 11–15 June 2018. [Google Scholar]
  30. Simões, M.S.; Sampaio, G.; Madureira, A.; Bessa, R.; Pereira, J.; Lopes, D.; Pires, R.; Matos, P. Avoid technical problems in LV networks: from data-driven monitoring to predictive control. In Proceedings of the 25th International Conference and Exhibition on Electricity Distribution (CIRED 2019), Madrid, Spain, 3–6 June 2019. [Google Scholar]
  31. Crossl, A.F.; Jones, D.; Wade, N.S. Planning the location and rating of distributed energy storage in LV networks using a genetic algorithm with simulated annealing. Int. J. Electr. Power Energy Syst. 2014, 59, 103–110. [Google Scholar] [CrossRef] [Green Version]
  32. Madureira, A. Coordinated and Optimized Voltage Management of Distribution Networks with Multi-Microgrids. Ph.D. Thesis, Department of Electrical and Computer Engineering, Faculty of Engineering, University of Porto, Porto, Portugal, 2010. [Google Scholar]
  33. Ciric, R.M.; Feltrin, A.P.; Ochoa, L.F. Power flow in four-wire distribution networks—General approach. IEEE Trans. Power Syste. 2003, 18, 1283–1290. [Google Scholar] [CrossRef] [Green Version]
Figure 1. Proposed framework for the Low Voltage Control (LVC).
Applsci 10 02635 g001
Figure 2. Example system.
Applsci 10 02635 g002
Figure 3. Flowchart of Control Actions Management Module (CAMM).
Applsci 10 02635 g003
Figure 4. Preventive control module flowchart.
Applsci 10 02635 g004
Figure 5. Real-time control module flowchart.
Applsci 10 02635 g005
Figure 6. Model validation. Total active power consumption for the four representative days.
Applsci 10 02635 g006
Figure 7. Model validation. Voltage profiles—Winter day.
Applsci 10 02635 g007
Figure 8. Model validation. Voltage profiles—Spring day.
Applsci 10 02635 g008
Figure 9. Model validation. Voltage profiles—Summer day.
Applsci 10 02635 g009
Figure 10. Model validation. Voltage profiles—Autumn day.
Applsci 10 02635 g010
Figure 11. Simulation results. Single-line diagram of the network section where voltage violations are forecasted to occur. In yellow, nodes that violate the LVC’s limits; in red, nodes that violate the EN-50160 limit.
Applsci 10 02635 g011
Figure 12. Simulation results. Forecasted voltage profiles, before the application of the LVC.
Applsci 10 02635 g012
Figure 13. Simulation results. Forecasted voltage profiles, after the application of the LVC.
Applsci 10 02635 g013
Figure 14. Worst voltage deviation. Comparison of the voltage profiles forecasted for the feeder and time instant where the worst voltage violation is forecasted to occur, with and without the application of the LVC.
Applsci 10 02635 g014
Figure 15. Control action. DSO-owned storage device connected to node 117.
Applsci 10 02635 g015
Figure 16. Control action. HEMS connected to node 28.
Applsci 10 02635 g016
Figure 17. Control action. HEMS connected to node 40.
Applsci 10 02635 g017
Figure 18. Control action. HEMS connected to node 66.
Applsci 10 02635 g018
Figure 19. Control action. HEMS connected to node 88.
Applsci 10 02635 g019
Figure 20. Control action. HEMS connected to node 115.
Applsci 10 02635 g020
Figure 21. Control action. HEMS connected to node 132.
Applsci 10 02635 g021
Figure 22. Control action. Generator connected to node 19.
Applsci 10 02635 g022
Figure 23. Control action. Generator connected to node 27 (1).
Applsci 10 02635 g023
Figure 24. Control action. Generator connected to node 27 (2).
Applsci 10 02635 g024
Table 1. International Distribution System Operator (DSO) experiences and rules of thumb for Distributed Generation (DG) interconnections. Adapted from Reference [2].
CountryBased on Thermal Limits ConsiderationsBased on Short-Circuit Capacity ConsiderationsBased on Loading/Generation Percentage
South KoreaFor MV networks, the total DG ratings should be lower than 20% of the HV/LV transformer rating
  • For MV networks, the total DG ratings should be lower than 15% of the HV/MV transformer rating
  • The total DG ratings should be lower than 15% of the thermal limits of the affected feeders
N/A
Spain
  • The total DG ratings should be lower than 50% of the MV/LV transformer rating
  • The total DG ratings should be lower than 50% of the affected feeders
The total DG ratings should be lower than 10% of the short-circuit capacity at the point of common couplingN/A
South Africa
  • For LV networks, the total DG ratings should be lower than 25% of the MV/LV transformer rating
  • For LV networks, the total DG ratings should be lower than 25% of the feeding circuit breaker rating in case of shared feeder with other loads
  • For LV networks, the total DG ratings should be lower than 75% of the feeding circuit breaker rating, in case of dedicated feeder for the DGs
N/AThe total DG ratings should be lower than 15% of the feeder peak load
ChinaN/AThe total DG ratings should be lower than 10% of the short-circuit capacity at the point of common couplingN/A
USAN/A
  • The total DG ratings should be lower than 10% of the short-circuit capacity at the point of common coupling
  • The total short-circuit capacity of the DGs should be lower than 25% of the short-circuit capacity of the feeder at the point of common coupling
  • For radial circuits, the total DG ratings should be lower than 15% of the feeder annual peak load
  • The total DG ratings on a feeder should be lower than 5% of the total circuit annual peak load
  • For DGs fed from 3-phase, 4-wire feeding system, the total DG ratings on a feeder should be lower than 10% of the total line section peak load
BelgiumFor LV networks, total DG ratings should be lower than the MV/LV transformer ratingN/AN/A
CanadaReverse power flow occurred due to DG integration should not exceed 60% of the transformer rating at the substation and the minimum substation loadN/AThe total DG ratings should be lower than 50–100% of the feeder capacity or the substation annual minimum load
CzechAt the 110 kV networks, the total DG ratings should be lower than the HV transformer rating and the minimum substation loadN/AN/A
Italy
  • The total DG ratings should be lower than 65% of the LV/LV transformer rating
  • The total DG ratings should be lower than 60% of the thermal limit of the affected feeders
N/AN/A
PortugalFor LV networks, the total DG ratings should be lower than 25% of the MV/LV transformer ratingN/AN/A
Table 2. Network characterization. Generation installed capacity, according to the contracted power.
ContractedMicrogeneration Installed
Power, [kVA]Capacity, [kW]
1.150.50
3.451.00
4.601.50
5.751.75
6.902.00
10.352.50
20.704.00
27.605.00
41.407.50
Table 3. Network characterization. Summary of the number, contracted power and of consumers with and without Home Energy Management System (HEMS).
Phase RPhase SPhase TPhase RSTTotal
NumberTotal consumers4644318129
Consumers w/HEMS14139238
Consumers w/HEMS, %30.43%29.55%29.03%25.00%29.46%
ContractedTotal consumers212.75215.05143.75144.9716.45
power, [ kVA ] Consumers w/HEMS65.5565.5543.7027.60202.40
Consumers w/HEMS, %30.81%30.48%30.40%19.05%28.25%
MicrogenerationTotal producers61.7565.0042.5029.50198.75
installed capacity,Producers w/HEMS19.7521.0013.256.0060,00
[ kW ] Producers w/HEMS, %31.98%32.31%31.18%20.34%30.19%
Table 4. Model validation. Mean Absolute Percentage Error (MAPE) and the Root-Mean-Square Error (RMSE) values obtained for the electrically furthest node.
MAPE, %RMSE, p.u.
Phase RPhase SPhase TAveragePhase RPhase SPhase TAverage
Winter0.47%2.40%2.21%1.70%0.000030.000740.000690.00049
Spring0.42%0.18%0.41%0.34%0.000030.000000.000030.00002
Summer0.36%0.11%0.32%0.26%0.000020.000000.000020.00001
Autumn0.40%0,23%0,17%0.27%0.000020.000010.000000.00001
Average0.41%0.73%0.78%0.64%0.000030.000190.000180.00013
Table 5. Control action. Flexibility requested to consumers with HEMS.
ContractedTotalFlexibilityFlexibility
Power, [kVA]Flexibility, [kWh]Used, [kWh]Used, [%]
Node 283.4516.450.060.35%
Node 404.6022.170.673.02%
Node 666.9033.140.601.81%
Node 884.6022.091.406.32%
Node 1153.4516.701.076.41%
Node 1326.9033.121.544.64%
Total-143.675.333.71%
Table 6. Power losses, with and without the application of the LVC tool.
Simulation DayAnnual Estimation
Pre-LVC,Post-LVC,Reduction,Pre-LVCPost-LVC,Reduction,
[kWh][kWh][%][kWh][kWh][%]
Phase R5.905.772.21%3182.153137.551.40%
Phase S7.567.155.41%3354.743196.124.73%
Phase T3.723.700.57%1833.821816.170.96%
Phase N3.643.484.60%1830.031801.791.54%
Total20.8220.103.50%10200.749951.632.44%