Guidelines for Impact Echo Test Signal Interpretation Based on Wavelet Packet Transform for the Detection of Pile Defects


Abstract
1. Introduction
2. Theoretical Background
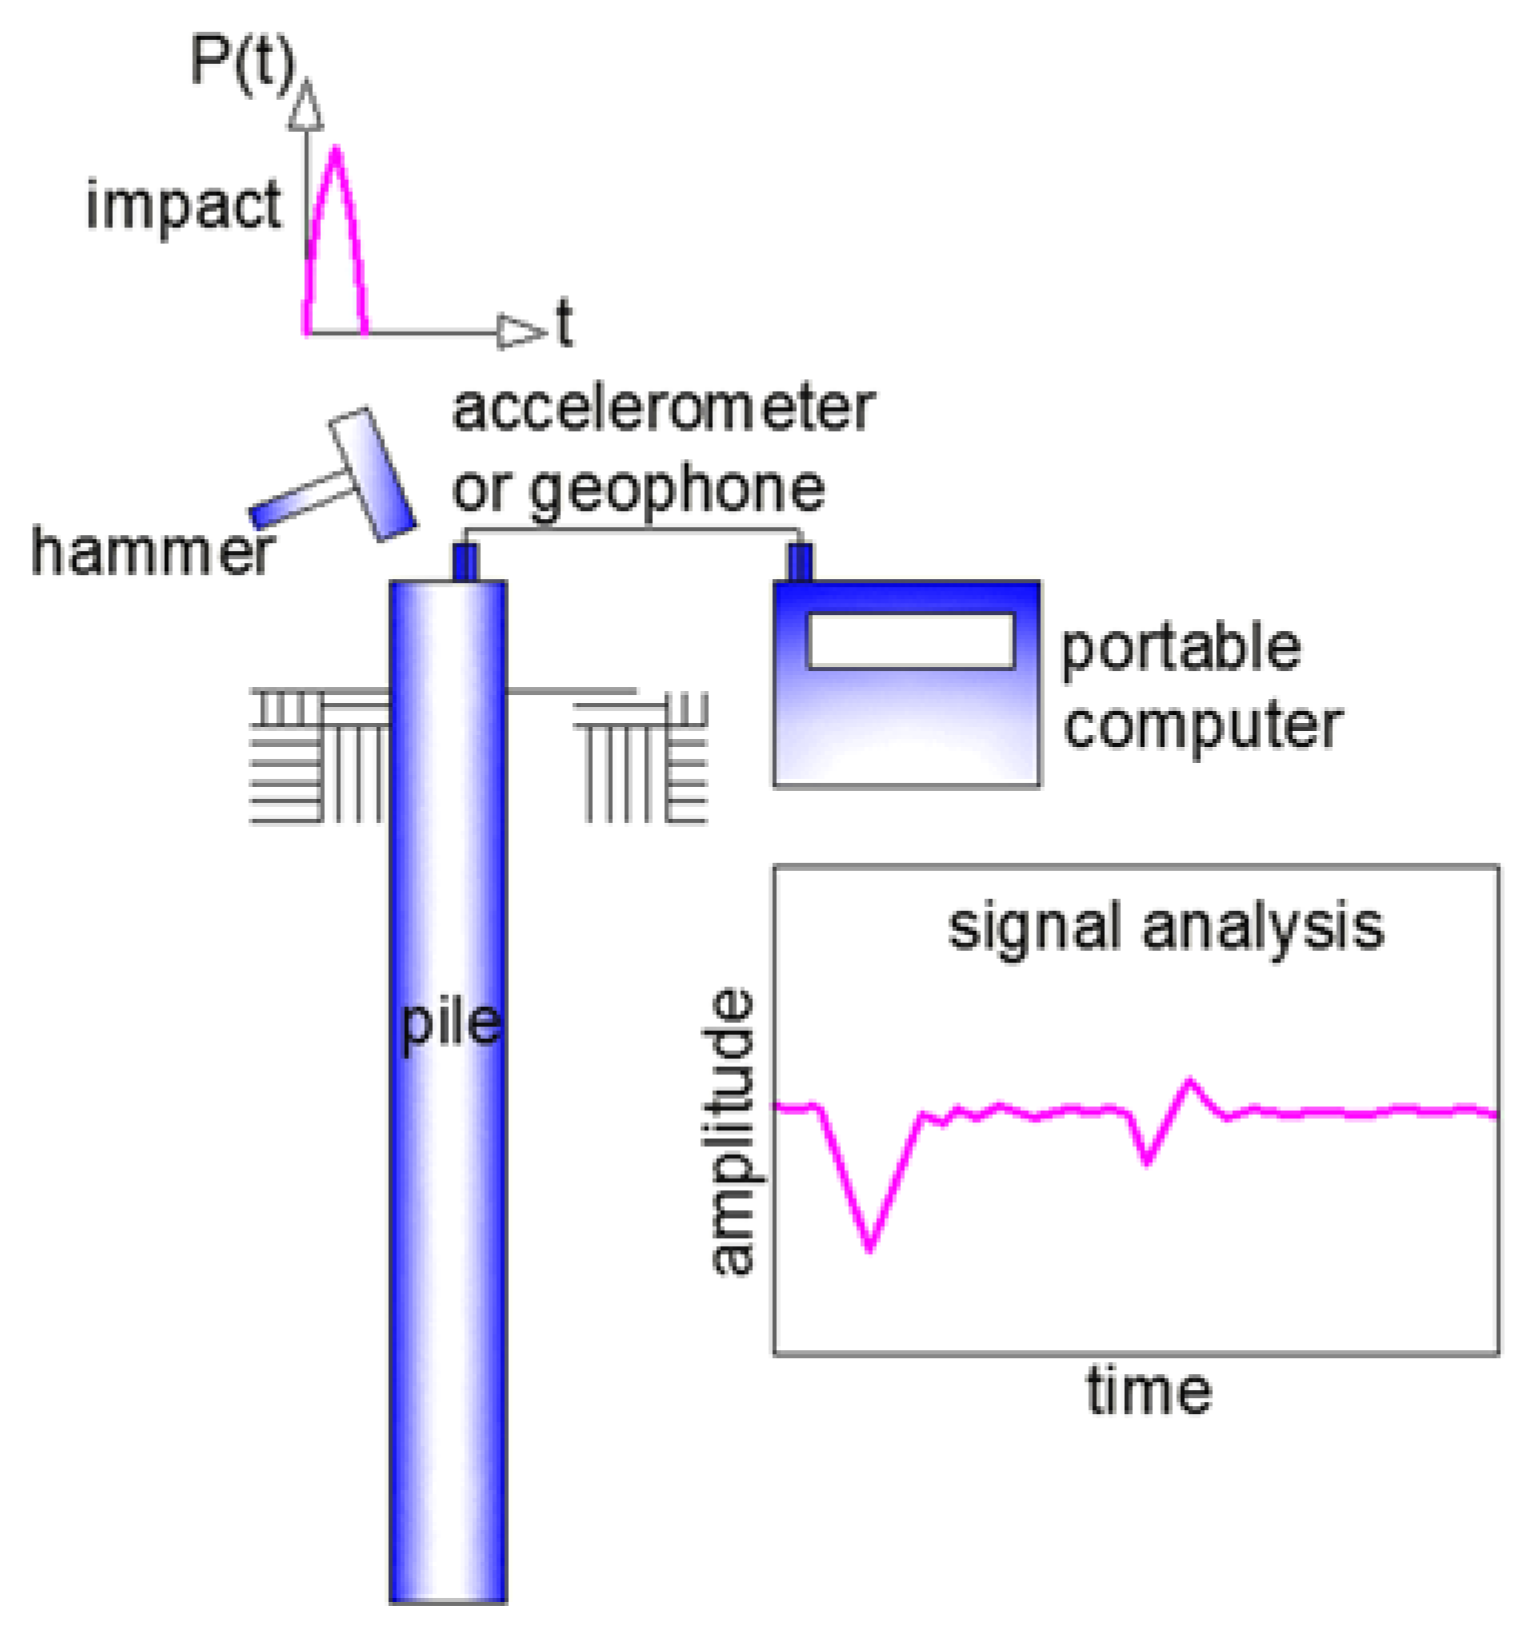
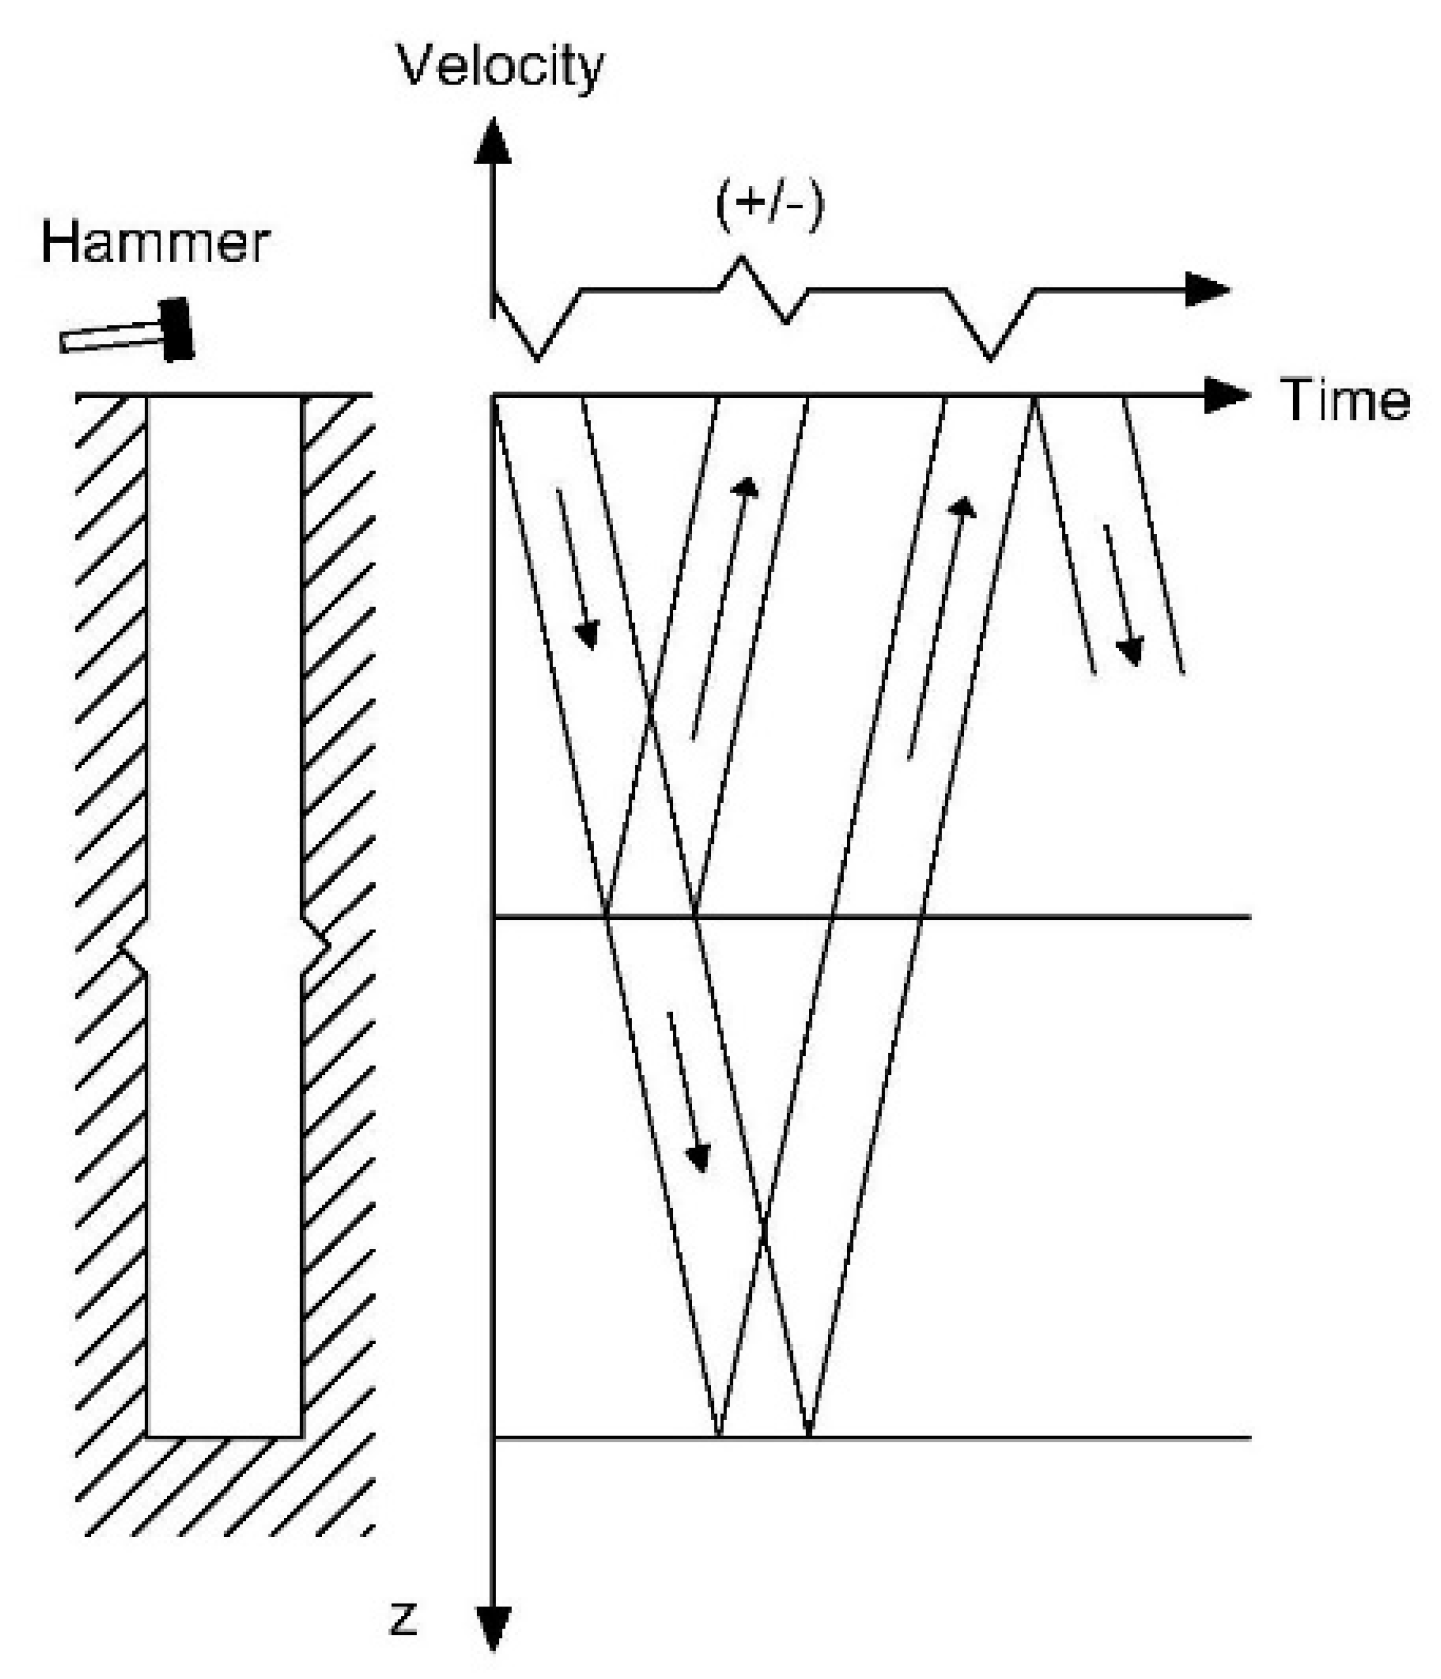
2.1. Pile Integrity Test by Impact Echo Method
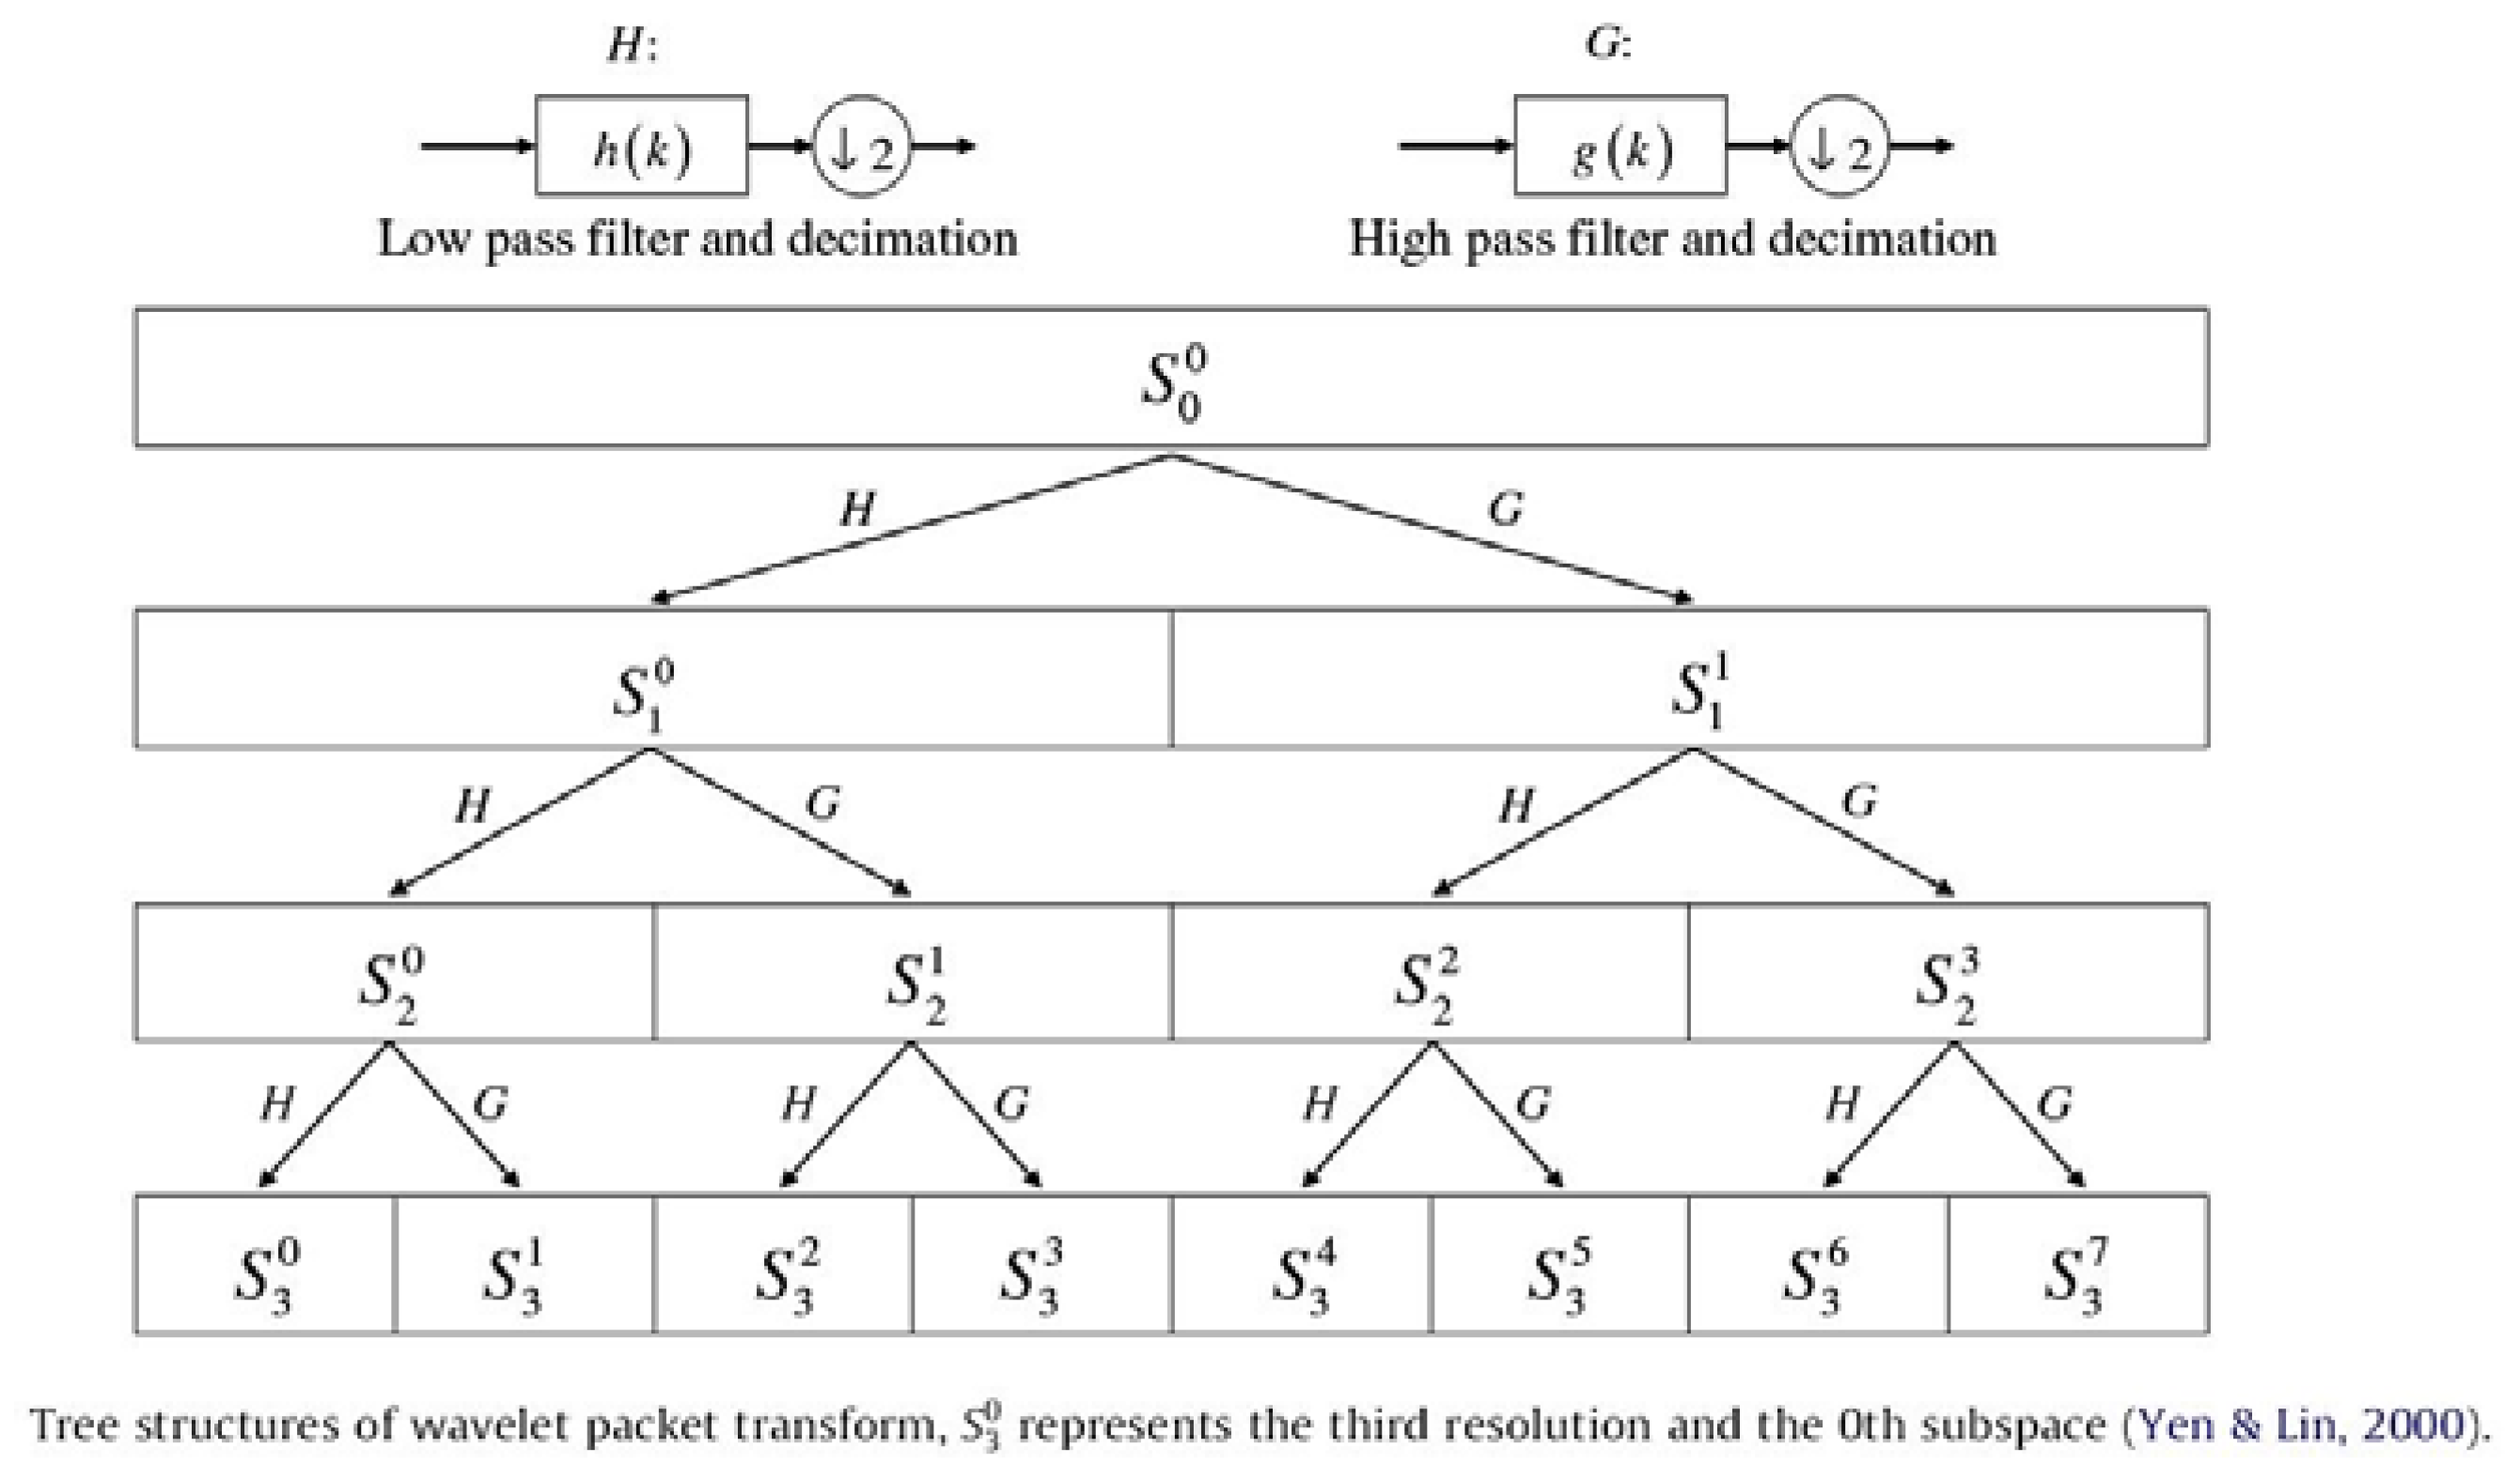
2.2. Principle of Wavelet Packet Transform
3. Interpretation of Velocity Signals from Impact Echo Method
3.1. Feature Parameters
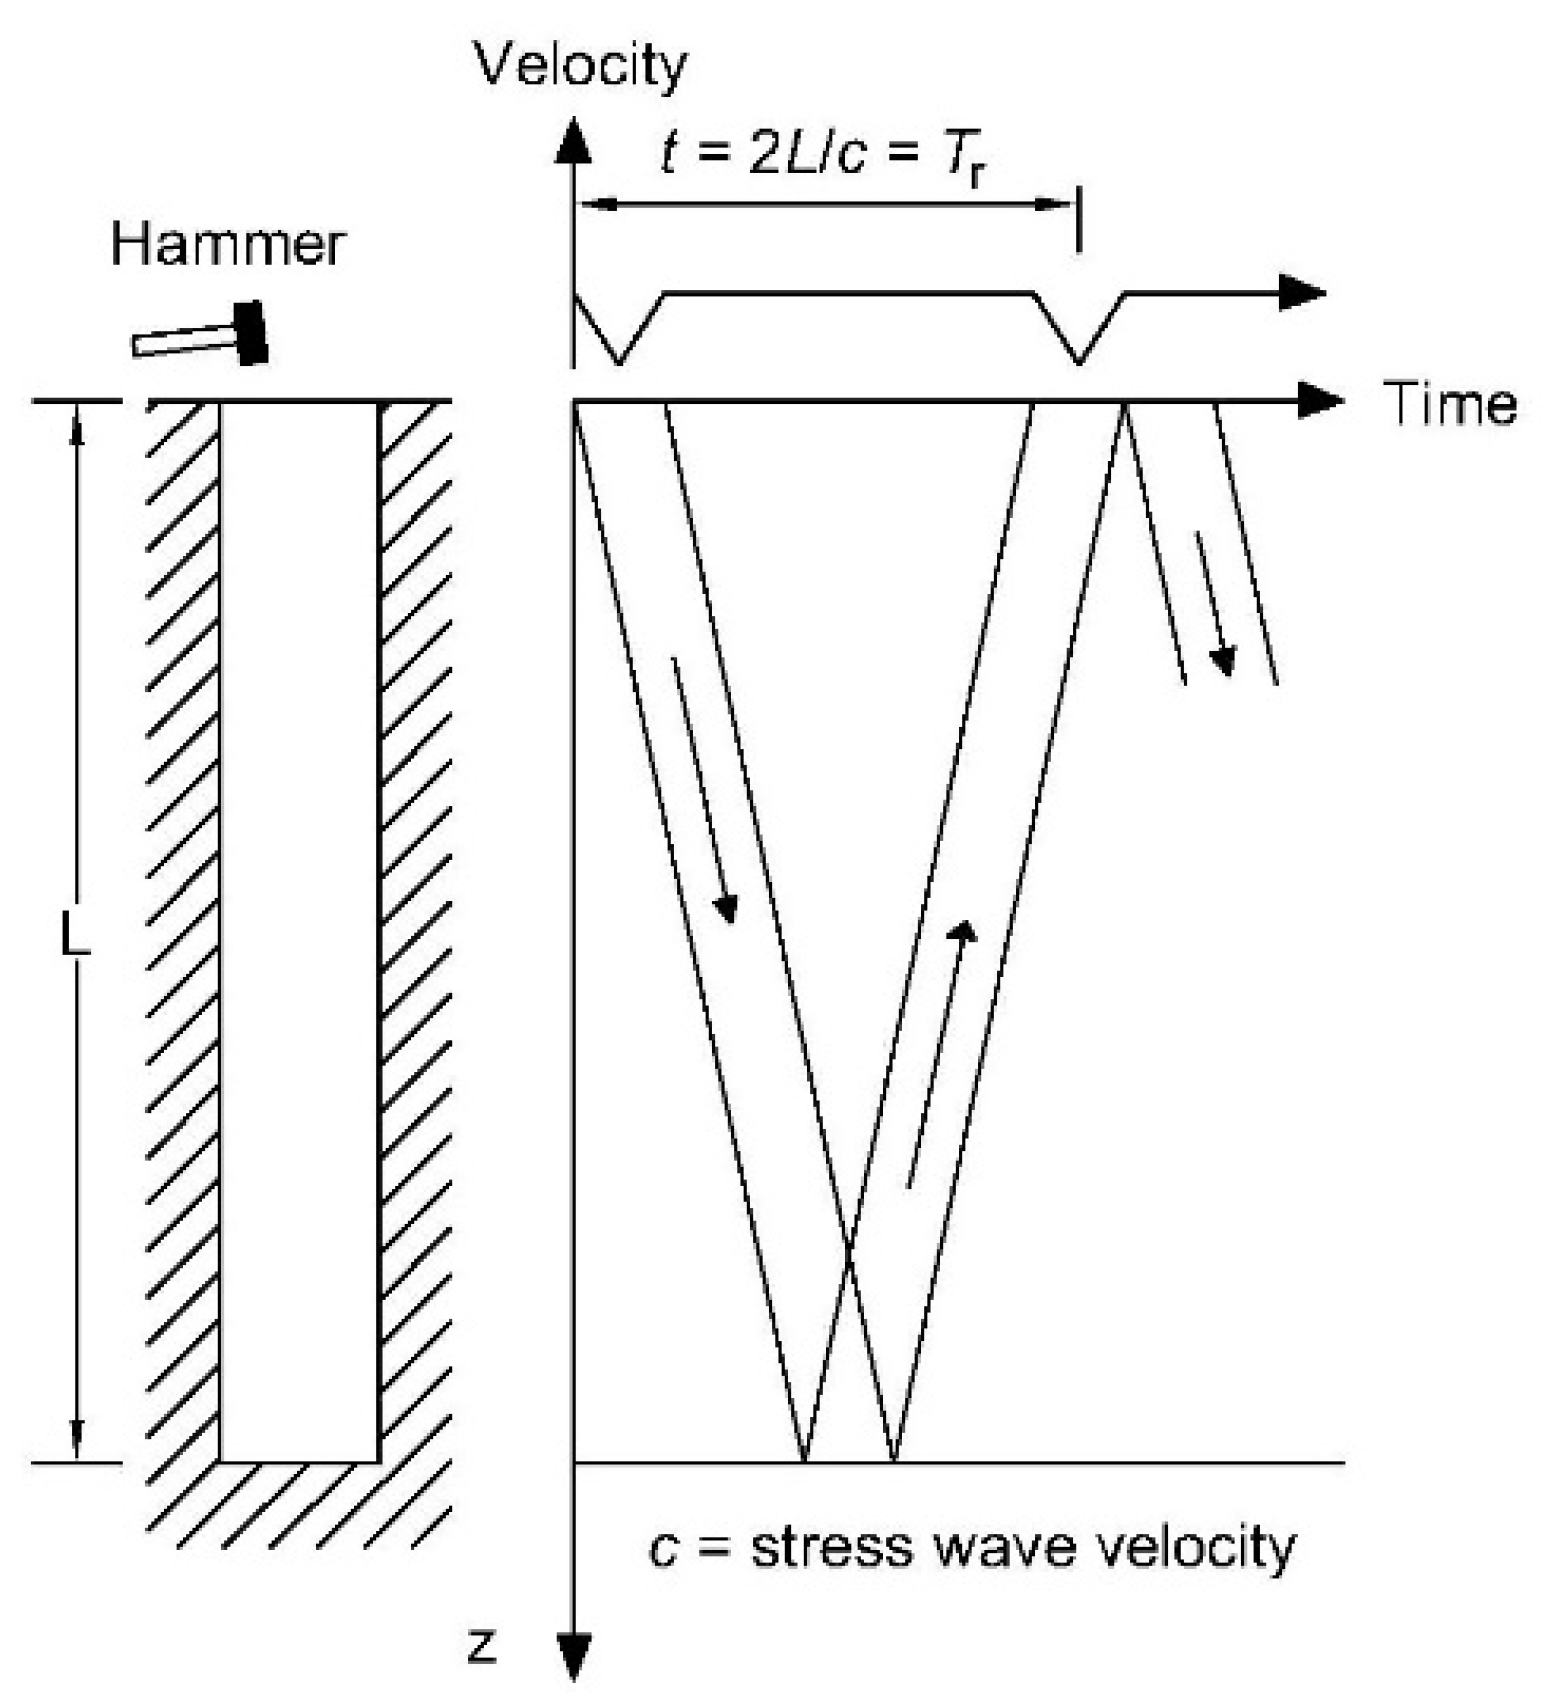
3.1.1. Total Reflection Time, T of the Pile Tip
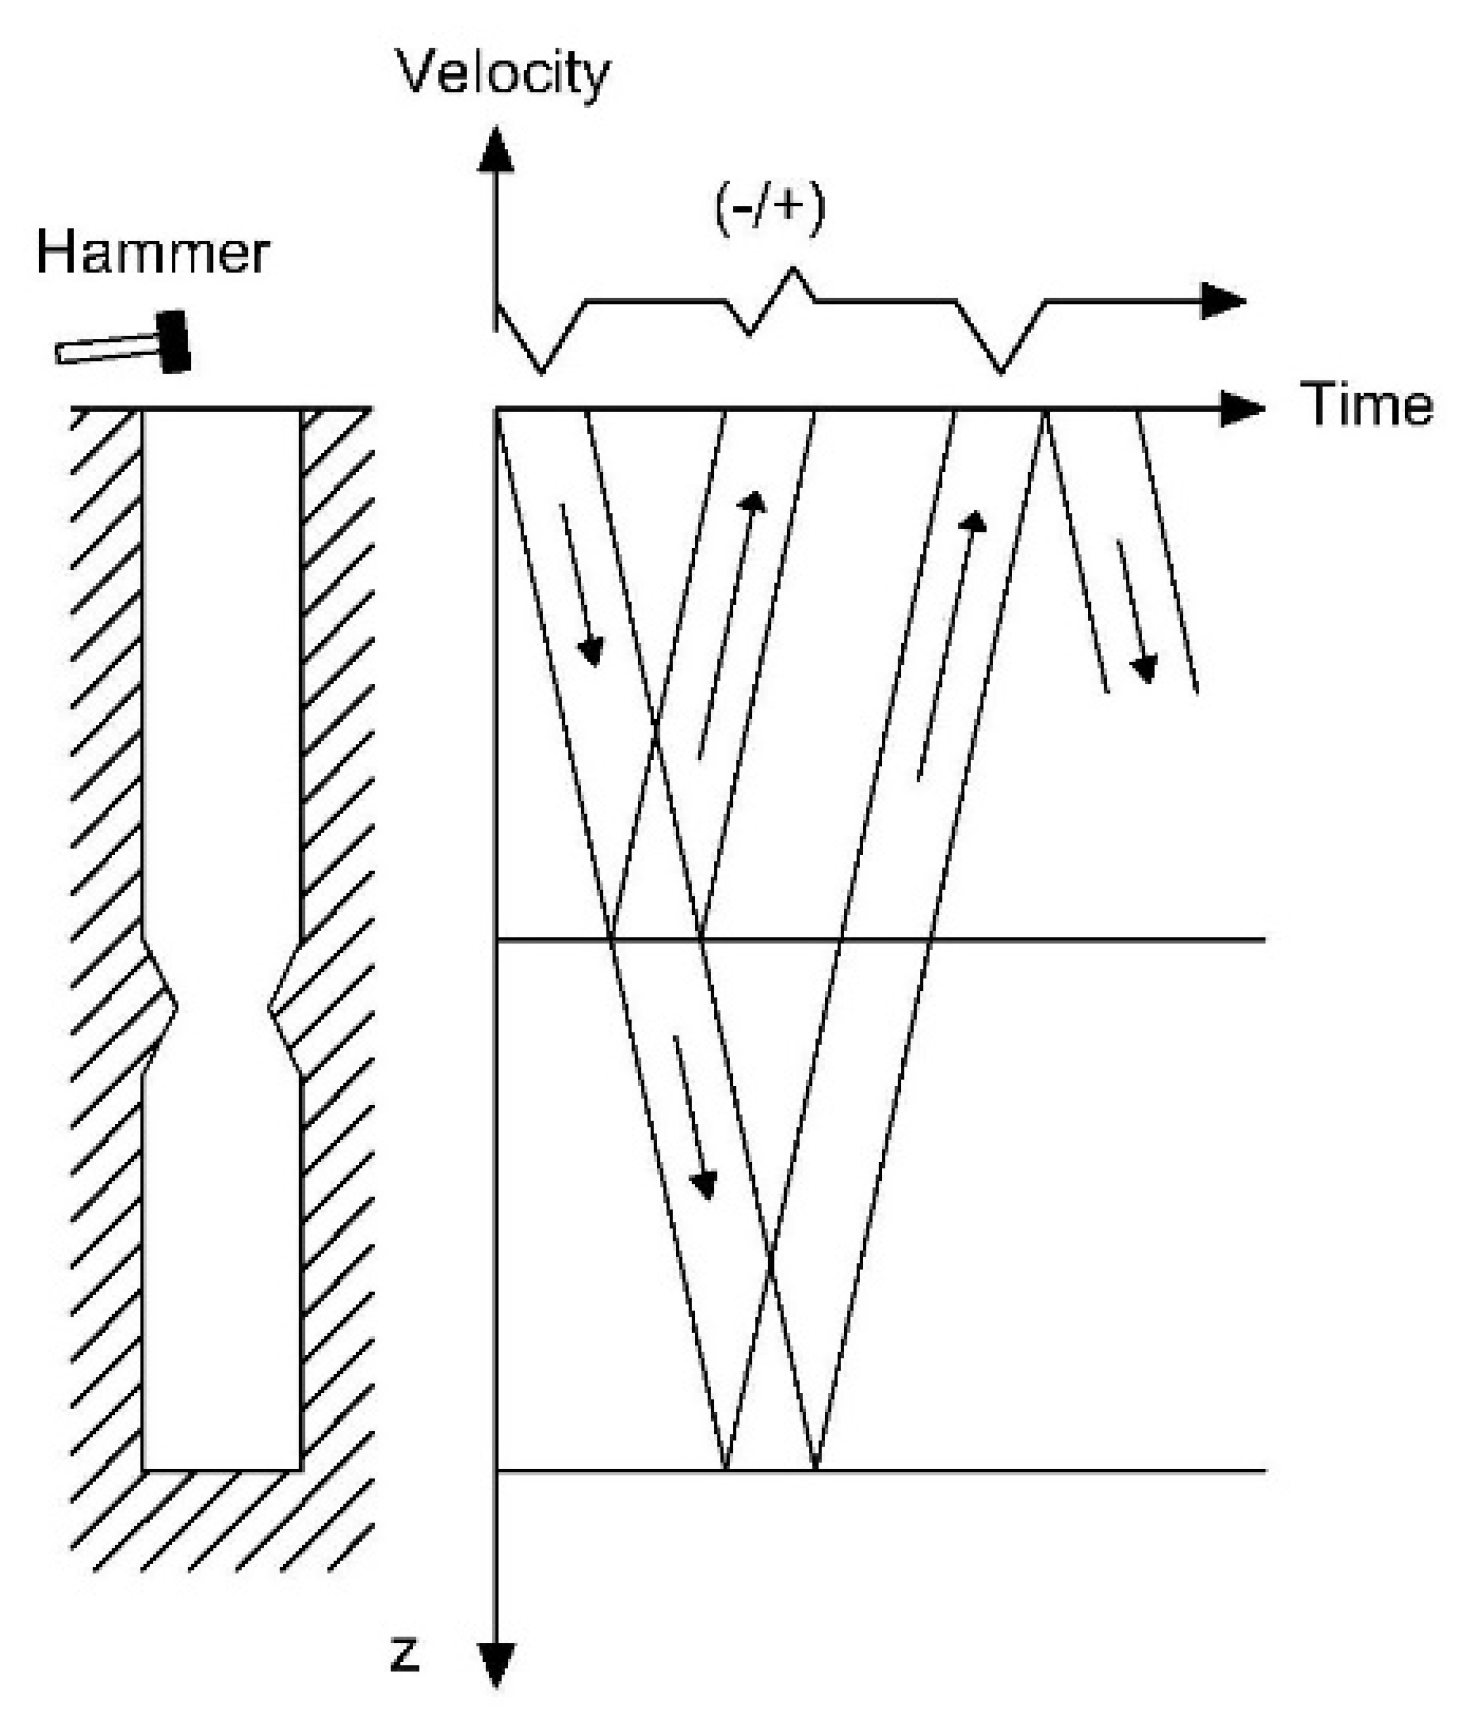
3.1.2. Number of Peaks, N
3.1.3. Direction or Sign of Peaks
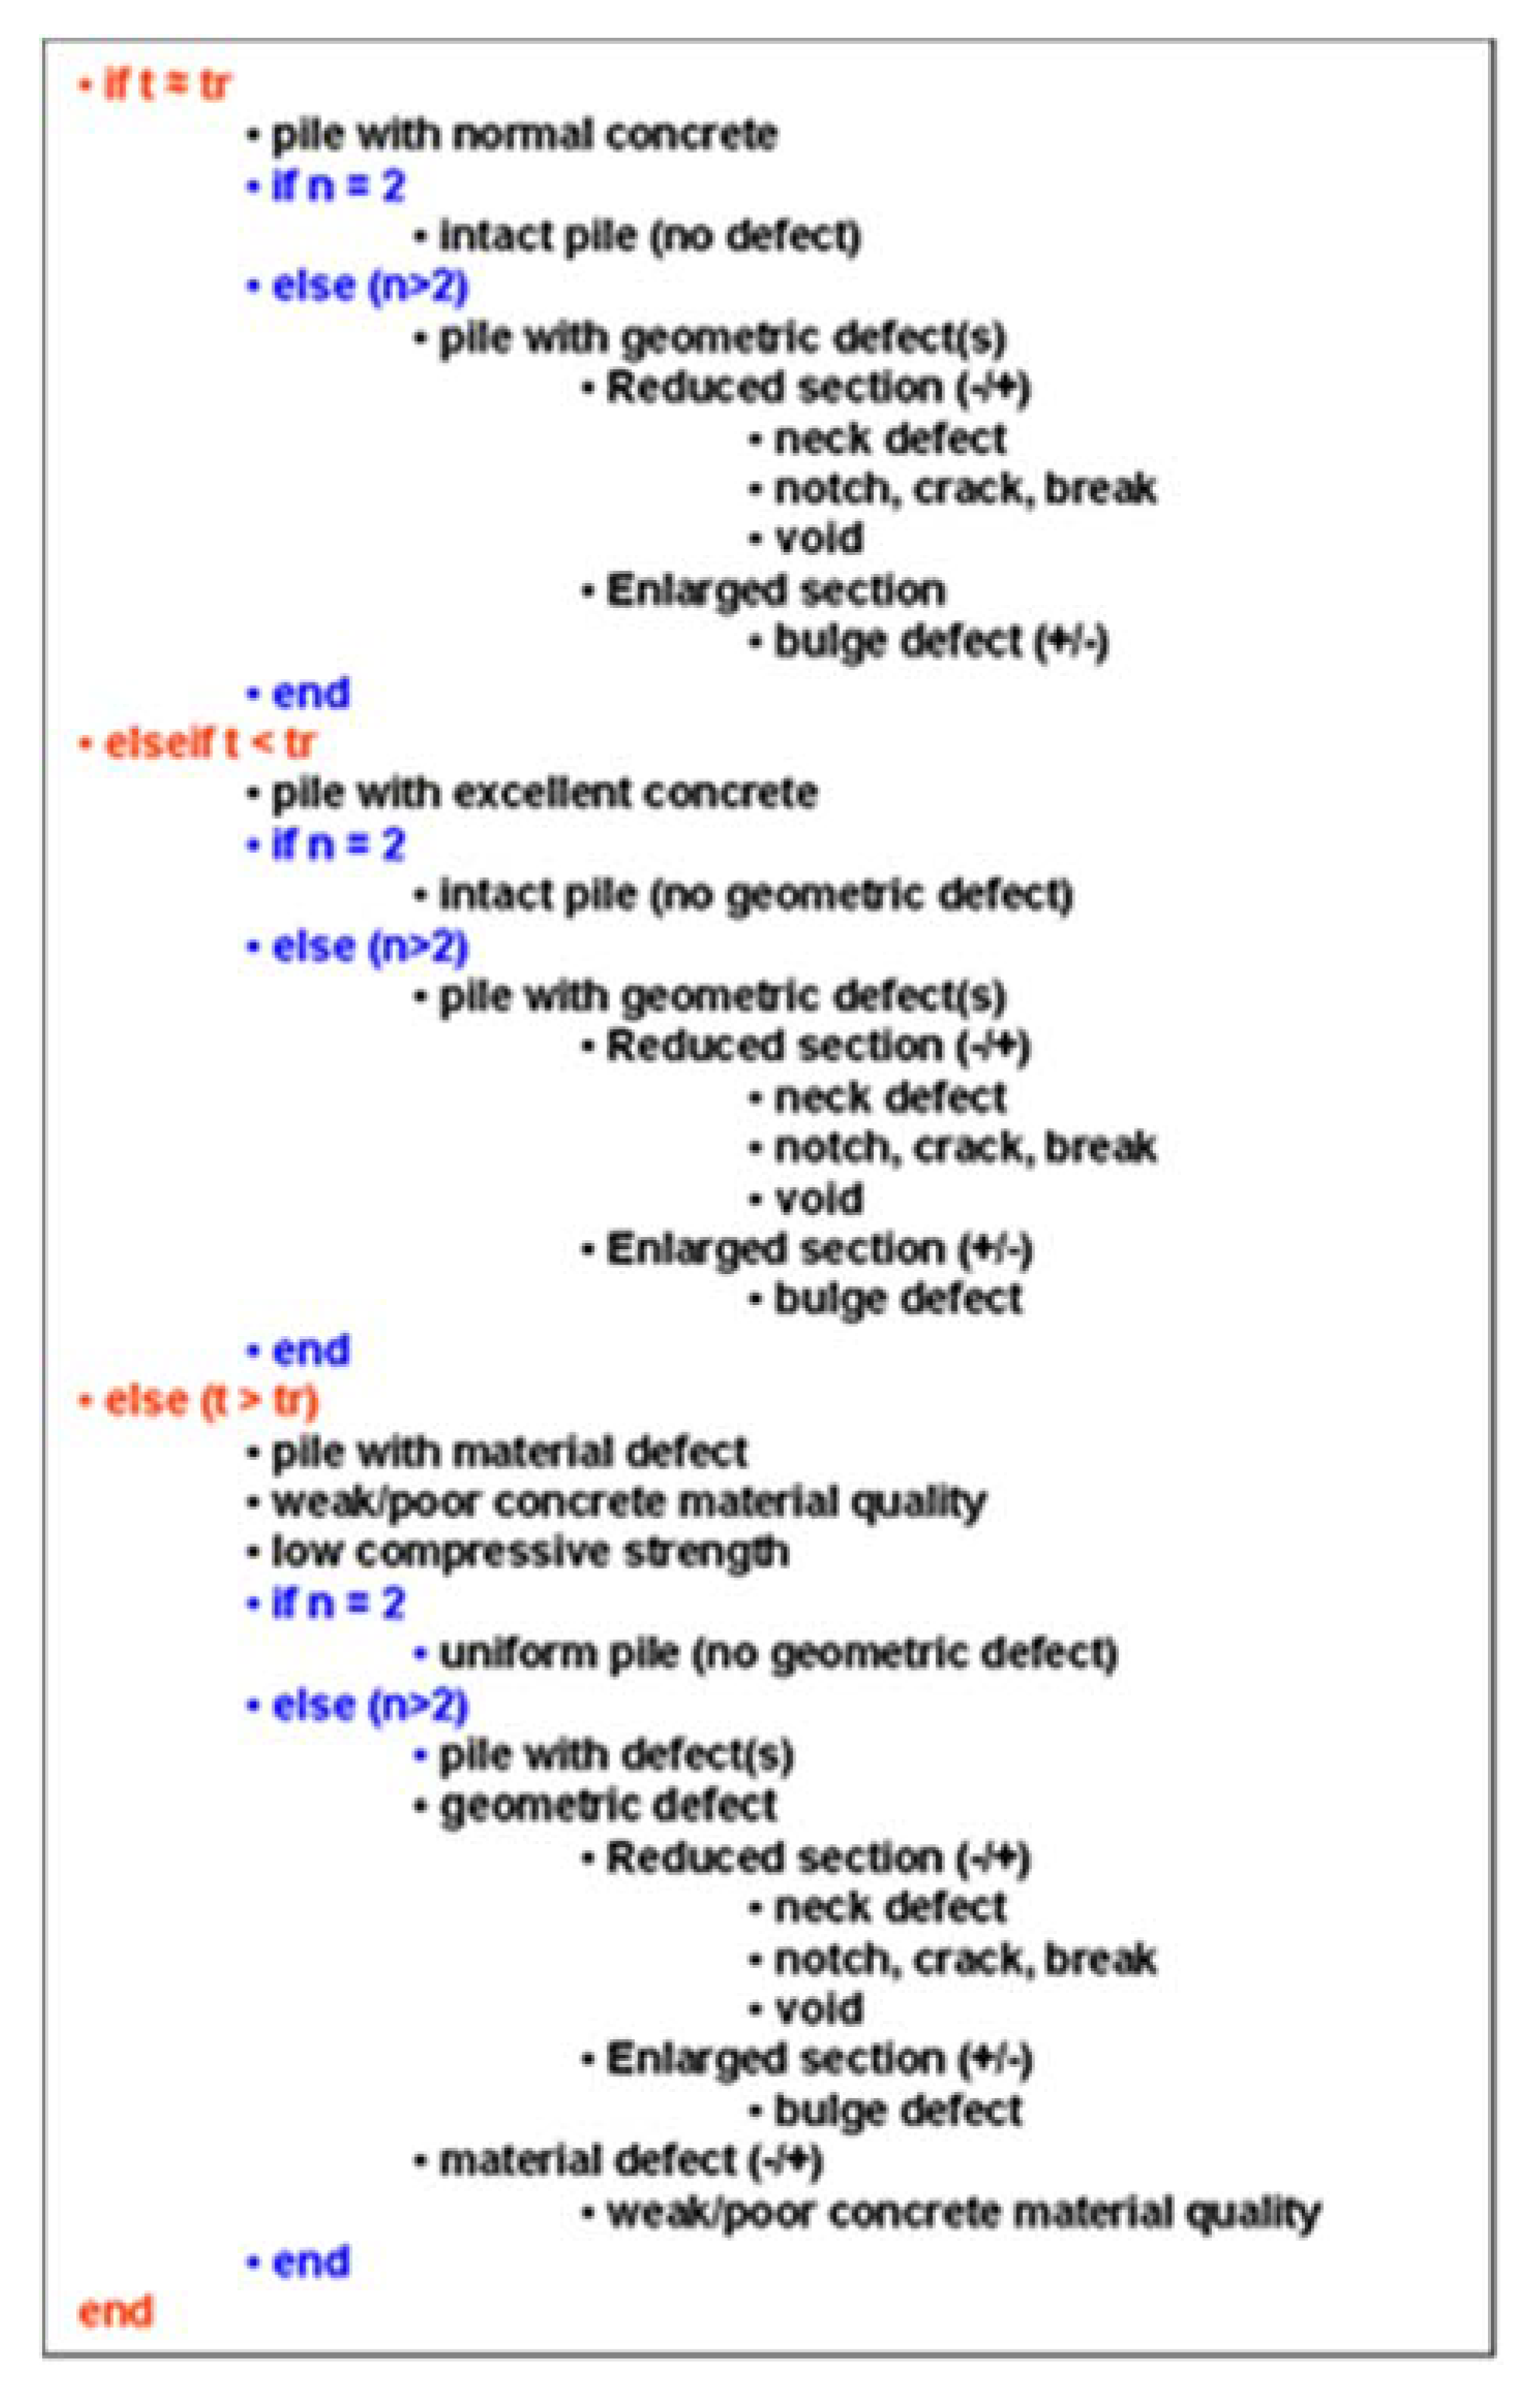
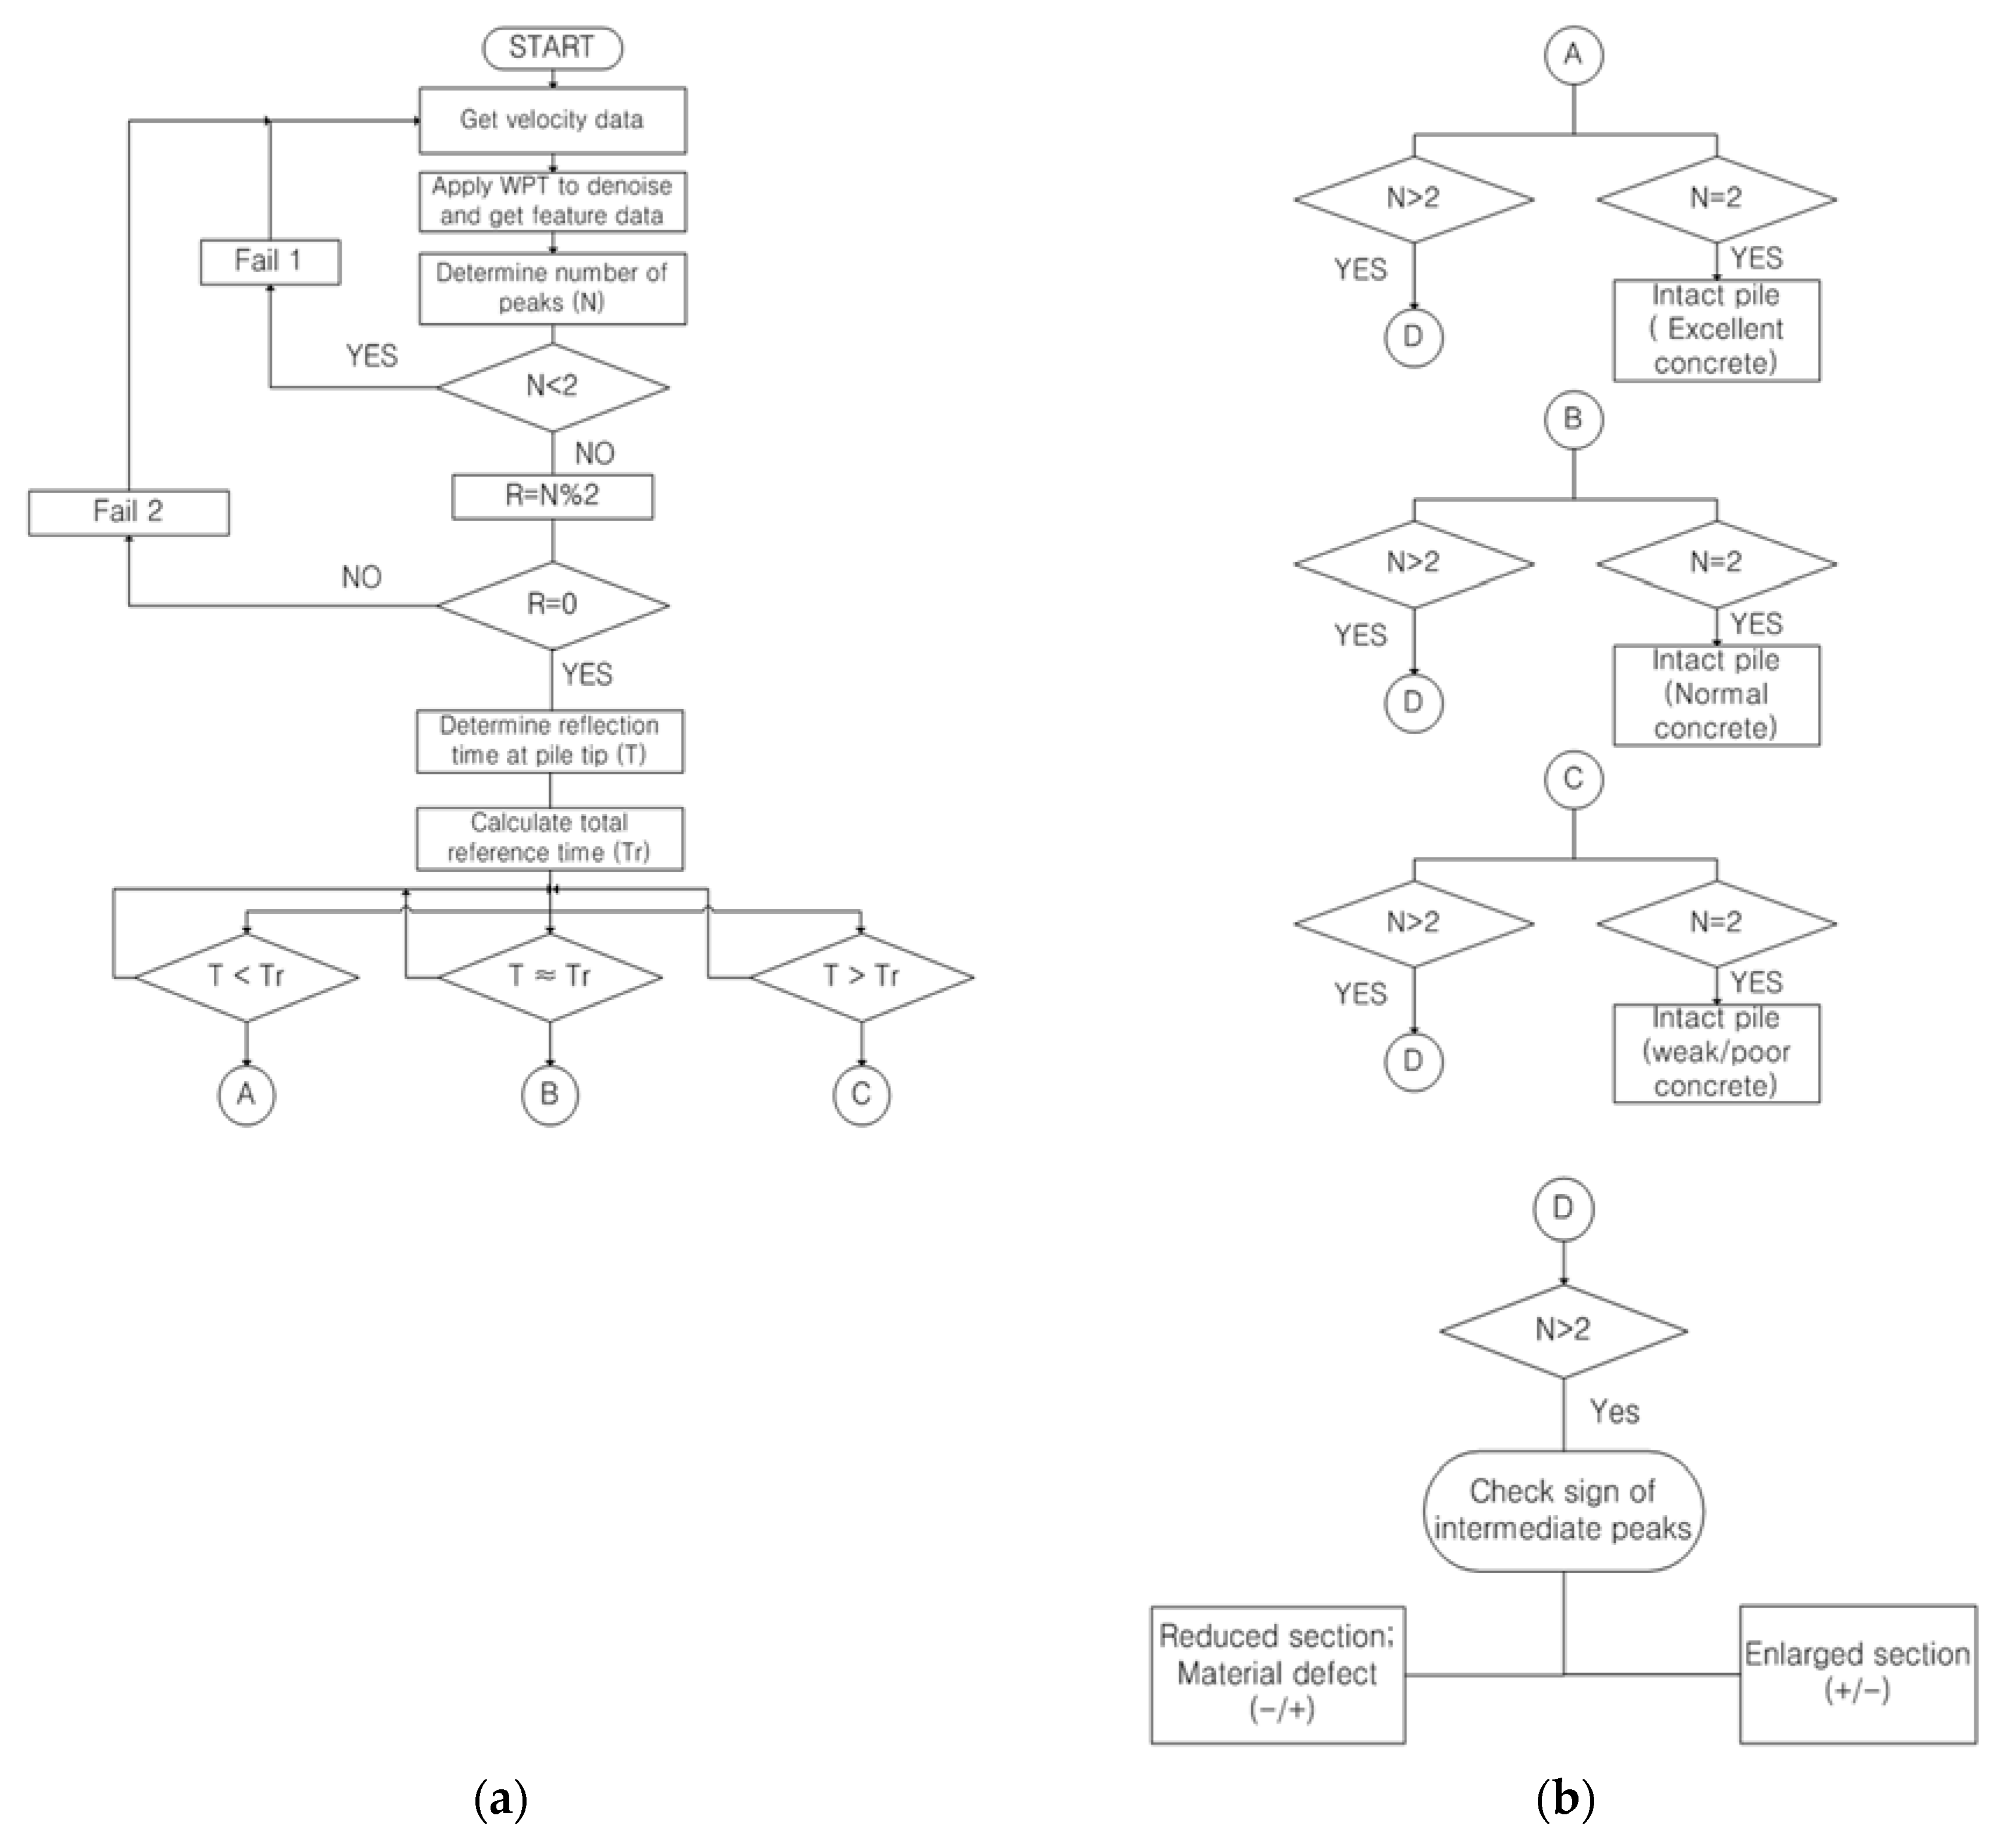
3.2. Identification and Classification of Defects from Feature Parameters
4. Finite Element Method (FEM) Simulation and Analysis of Impact Echo Test
5. Verification of the Proposed Scheme by Parametric Study
6. Conclusions
- Segments with weak concrete were hardly detected using method 2 (nonlinear amplification of the original signal without WPT applied) if its modulus of elasticity was almost the same as the reference modulus of elasticity and were moderately detected if the length and area of the very weak segment were short and small.
- Neck defects and bulge imperfections were hardly detected using method 2 if the defects were small and if the segment with the defect was long.
- Notches and cracks were hardly detected using method 2 if it was located nearer to the top of the pile and if the depth of the defect was shallow.
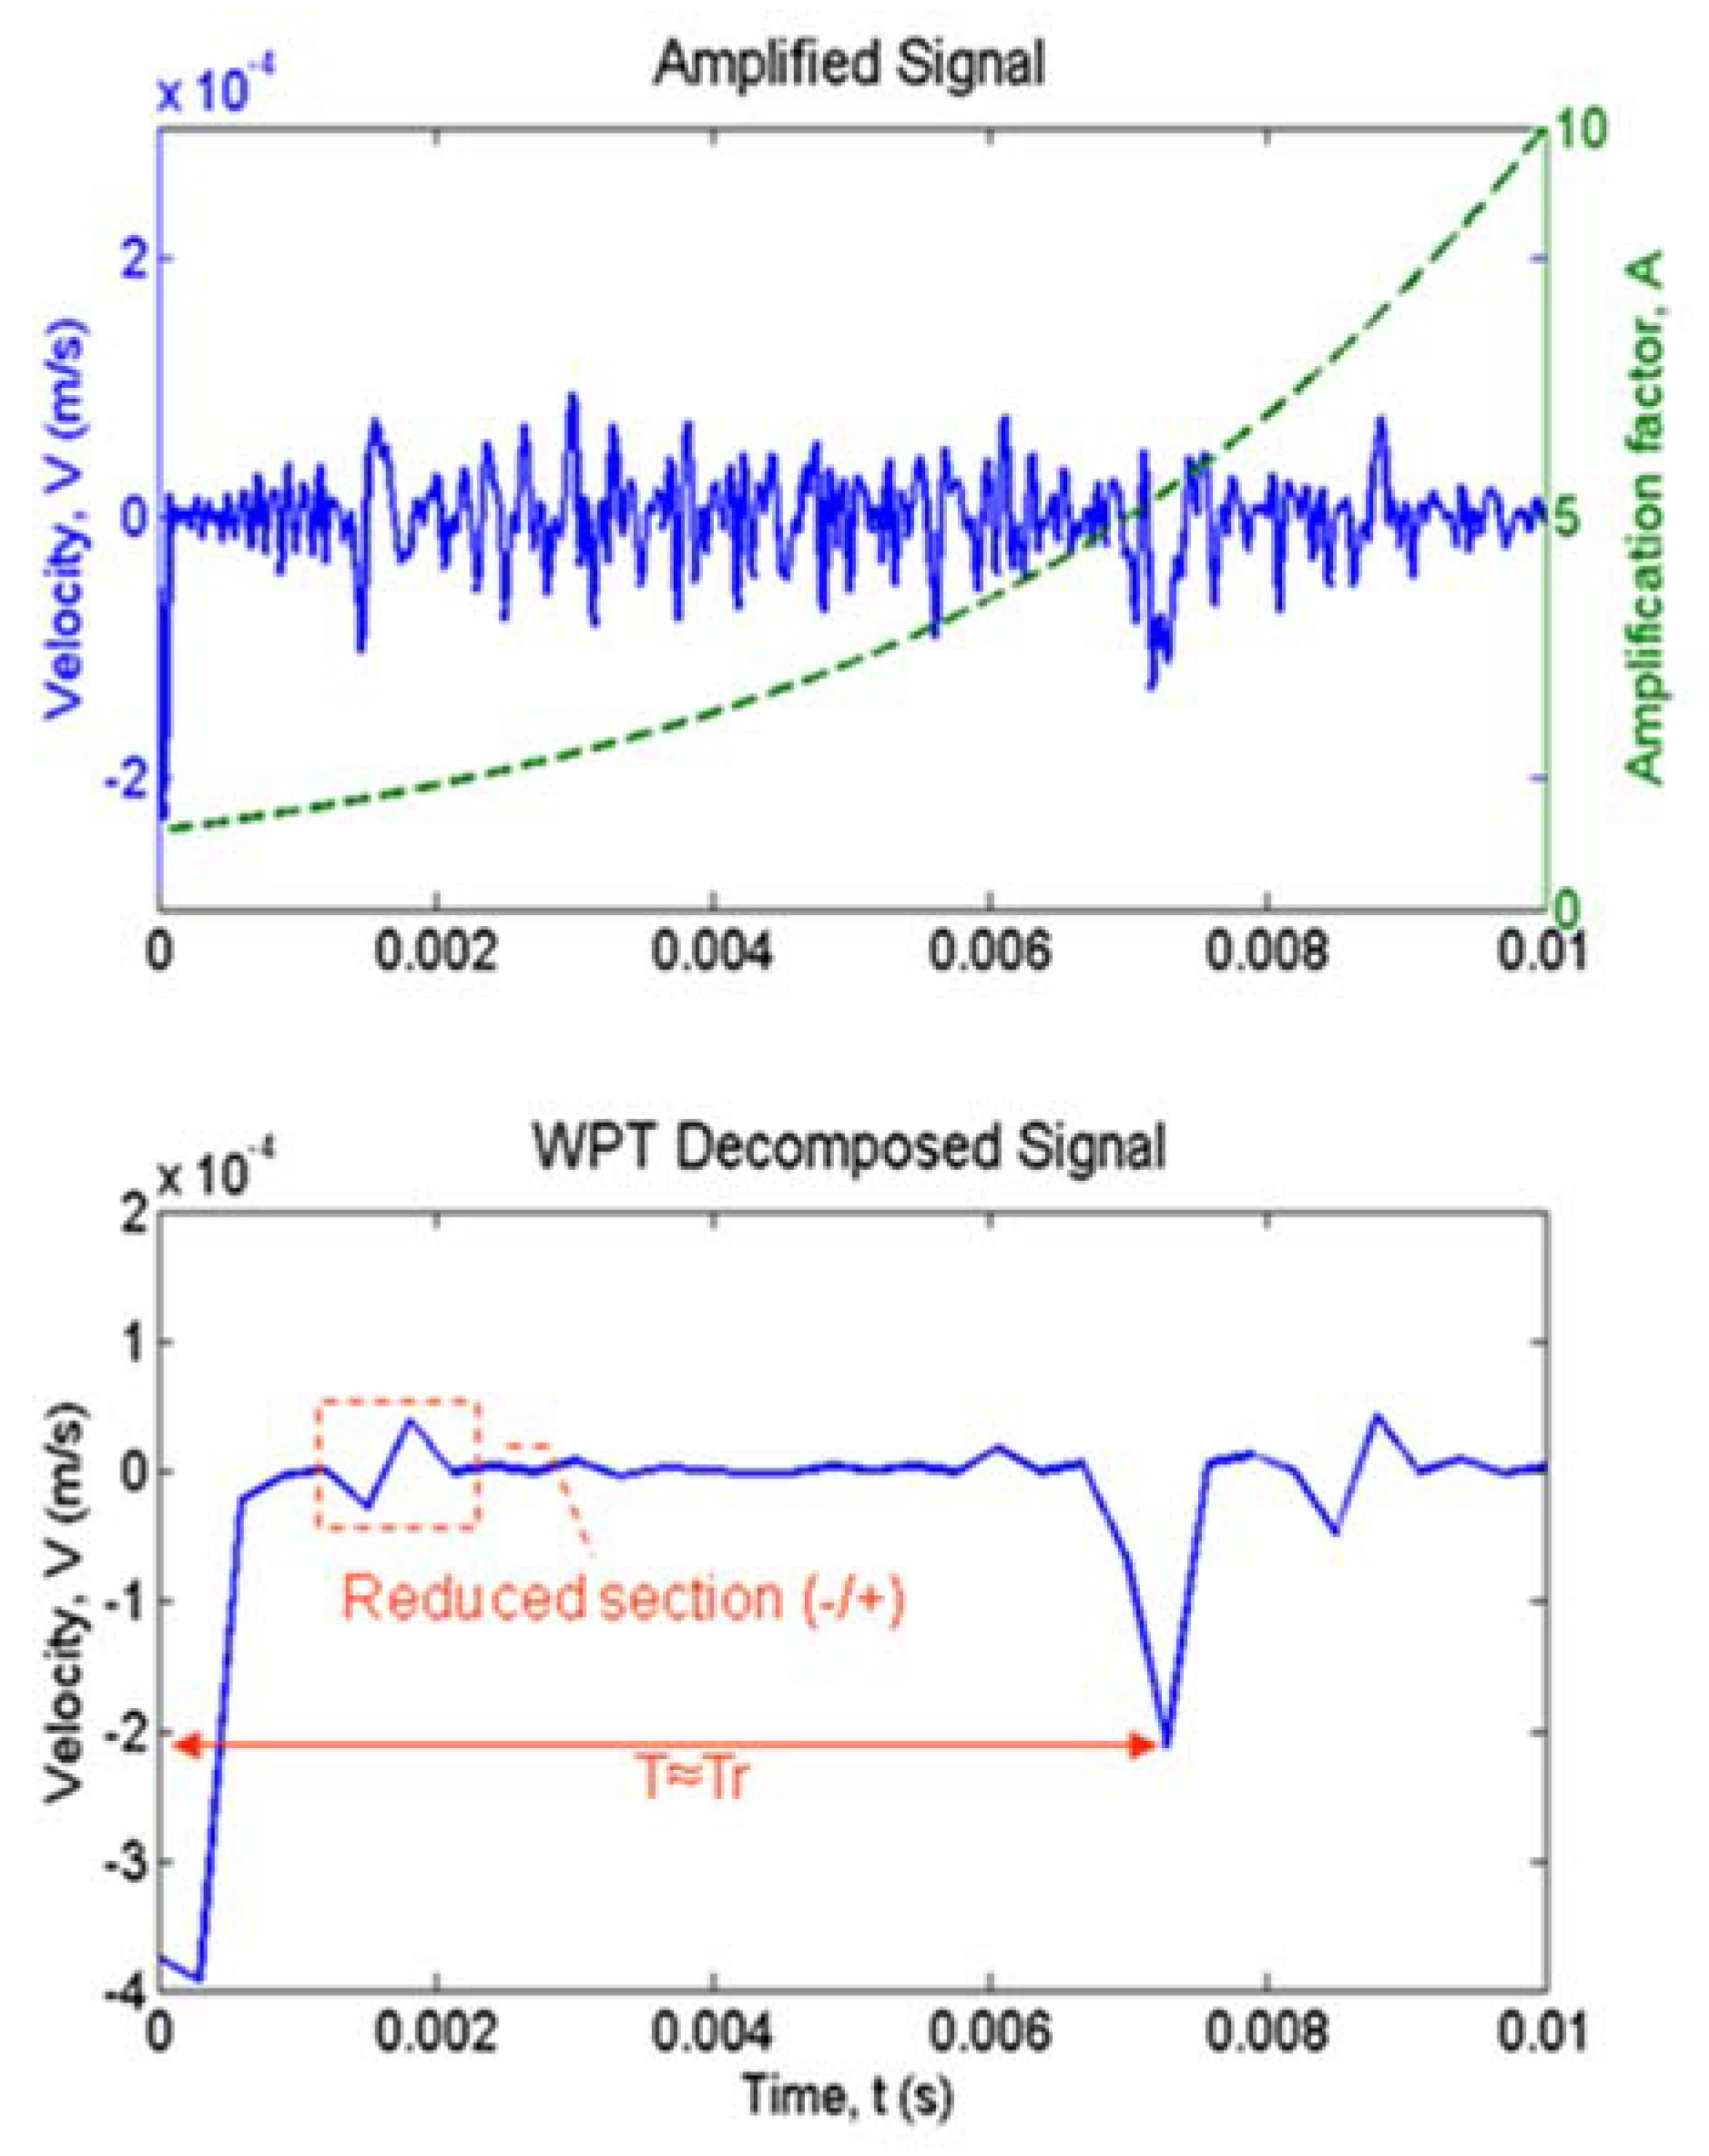
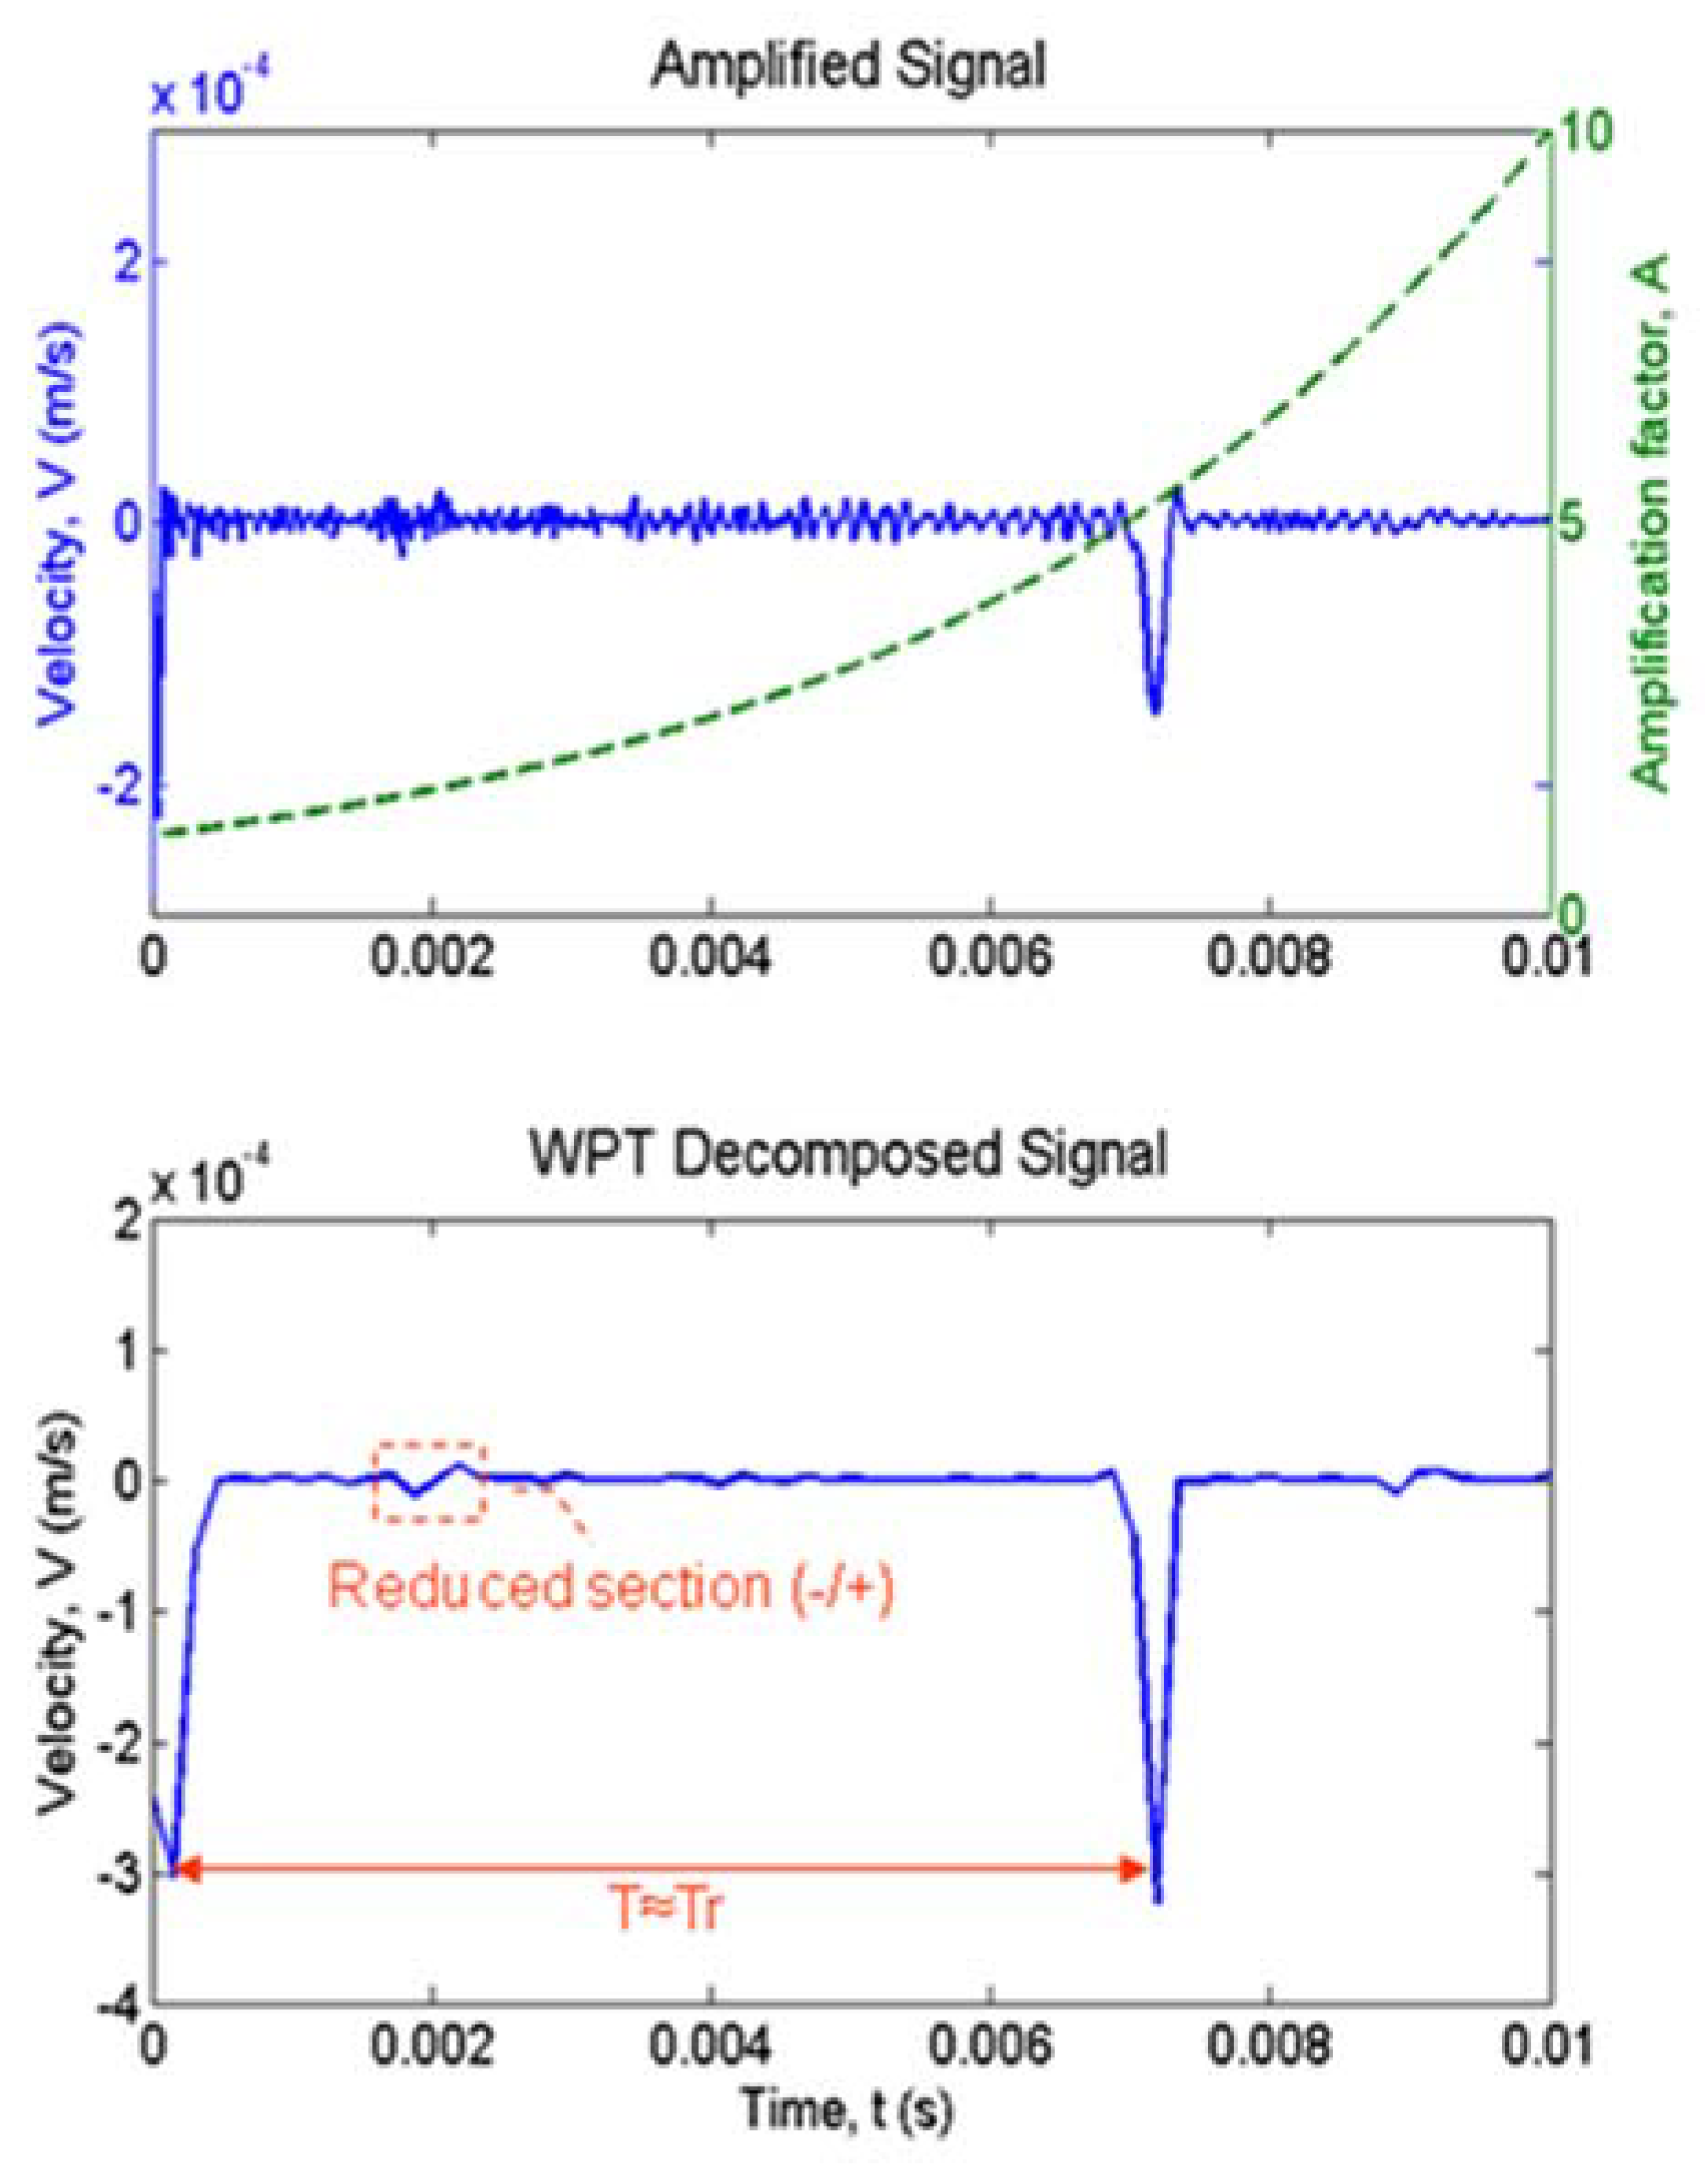
- Using method 1 (WPT-based method), a very short extent of a weak pile segment might be misinterpreted to be a defect due to a reduction in cross-section area, especially when the measured reflection time at the pile tip was almost equal to the reference time.
- Based on the observations of the velocity waveforms for pile defects due to reduction in the area of the pile section, it was not possible to distinguish among a neck, crack, and void using method 1 when the length of the neck or void was short.
- Using method 1, it might be difficult to distinguish a reduced pile area defect from being a long necking or a long and narrow void.
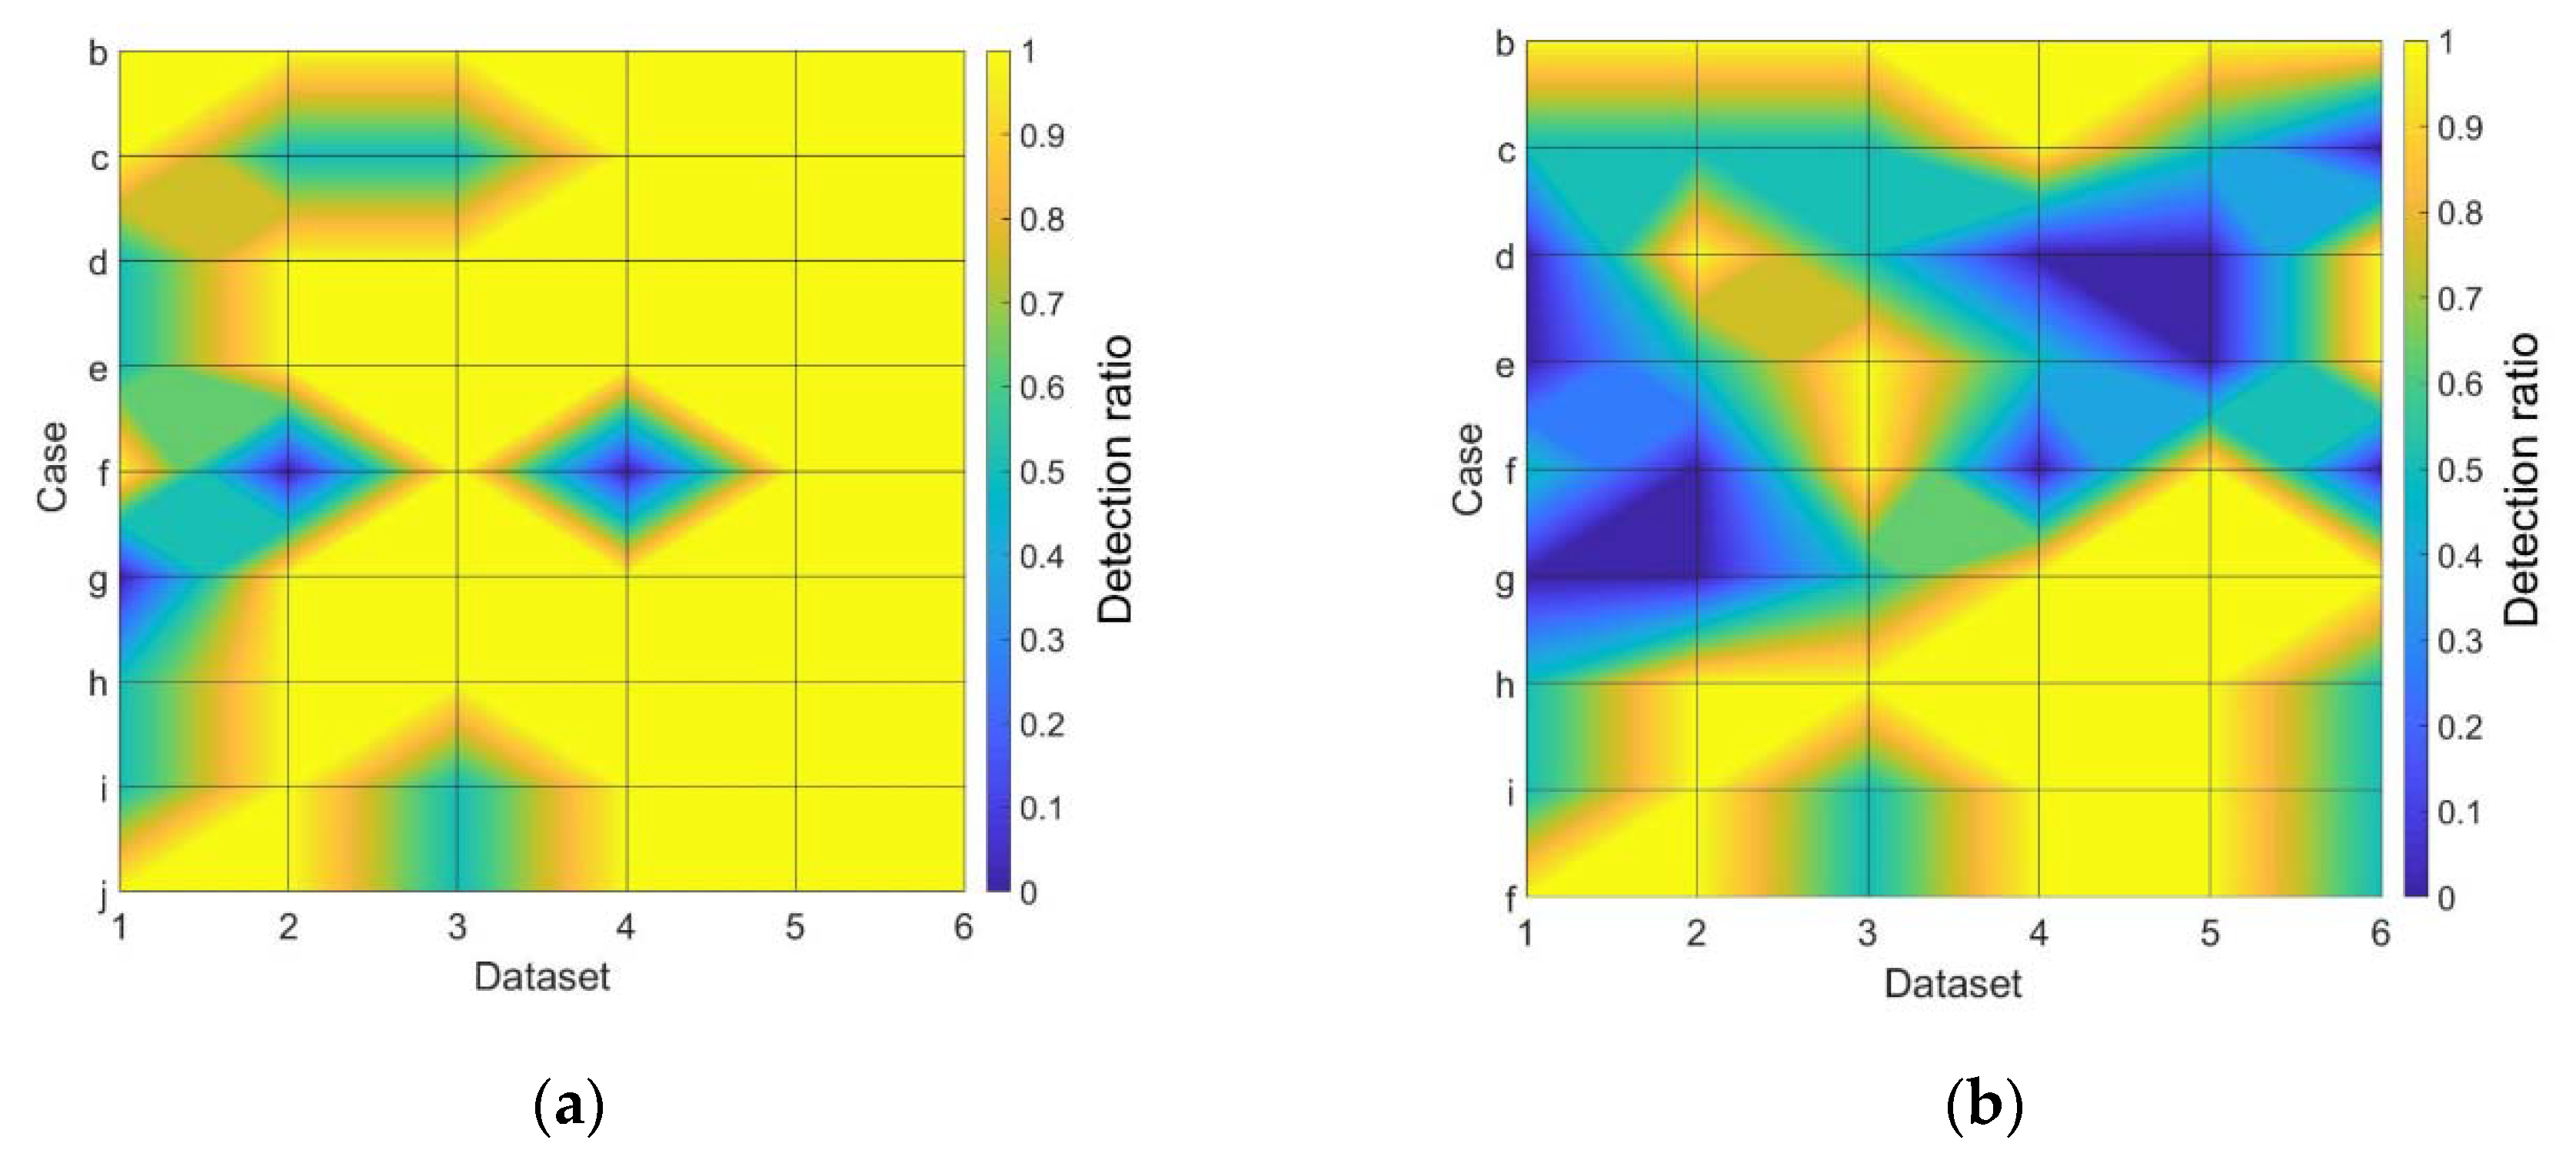
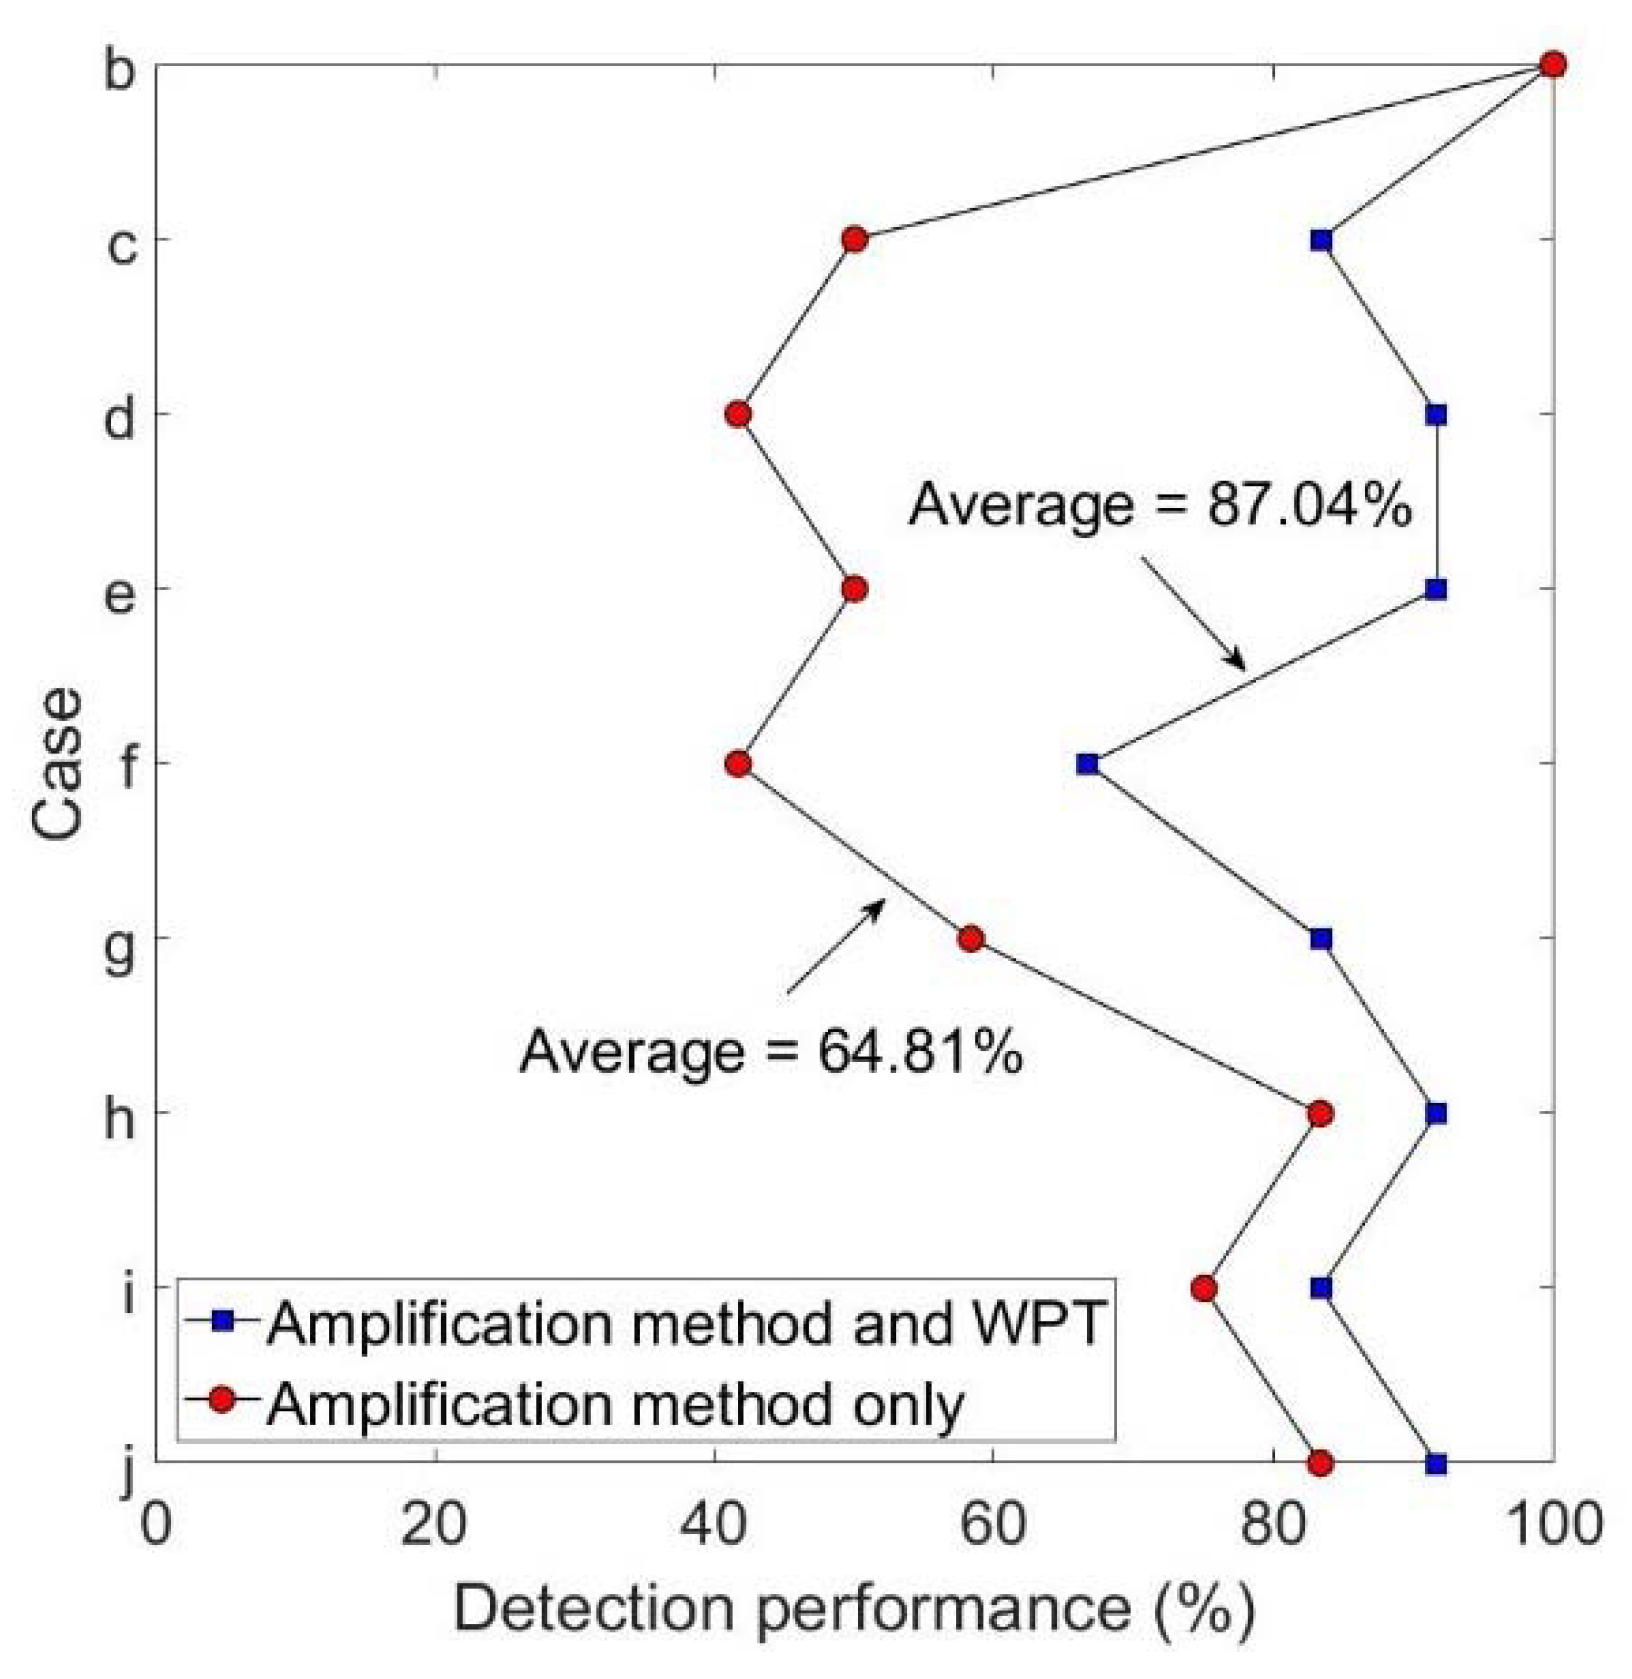
- Even though the integrity testing on piles might not identify all minor imperfections, the results of the study showed that the identification method based on WPT coupled with the conventional amplification method could be a useful tool in identifying major defects within the effective length of the pile compared to the method by signal amplification alone, wherein the identification method based on WPT detected defects 87.04% of the time compared to the conventional method, which only detected defects 64.81% of the time.
Author Contributions
Funding
Acknowledgments
Conflicts of Interest
References
- Hearne, T.M.; Stokoe, K.H.; Reese, L.C. Drilled-shaft integrity by wave propagation method. J. Geotech. Eng. Div. 1981, 107, 1327–1344. [Google Scholar]
- Olson, L.D.; Wright, C.C. Nondestructive Testing of Deep Foundations with Sonic Methods. In Proceedings of the Foundation Engineering: Current principles and practices, Evanston, IL, USA, 25–29 June 1989. [Google Scholar]
- Liu, S.A.; Zhuang, P.H.; Zhong, D.B. Distinguish Rock-Socketed Status of Pile Toe by Low Strain Testing. In Proceedings of the Fifth International Conference on the Application of Stress-Wave Theory to Piles (StressWave ’96), Orlando, FL, USA, 11–13 September 1996; pp. 607–611. [Google Scholar]
- Kim, D.S.; Woo, K.H. Evaluation of the Base Condition of Drilled Shafts by the Impact-Echo Method. Geotech. Test. J. 2004, 27, 1–8. [Google Scholar]
- Rausche, F.; Goble, G.G. Determination of pile damage by top measurements. In Behavior of Deep Foundations; Lundgren, R., Ed.; ASTM International: West Conshohocken, PA, USA, 1979; pp. 500–506. [Google Scholar]
- Kido, K.; Kaneko, Y.; Gao, X.; Kanai, H.; Abe, M.; Makino, S.; Tsukada, Y.; Sakai, T. Diagnosis of Local Buckling of Foundation Concrete Piles by Analyzing Reaction of Pile Head to Hammer Pulse. In Proceedings of the Third International Conference on Application of Stress Wave Theory to Pile, Ottawa, ON, Canada, 25–27 May 1988; pp. 115–122. [Google Scholar]
- Addison, P.S.; Watson, J.N. Wavelet Analysis for Low-Strain Integrity Testing of Foundation piles. In Proceedings of the Fifth International Conference on Inspection, Appraisals, Repairs, Maintenance of Buildings and Structures, Singapore, Singapore, 15–16 May 1997; pp. 15–16. [Google Scholar]
- Addison, P.S.; Sibbald, A.; Watson, J.N. Wavelet analysis: A mathematical microscope with civil engineering applications. Insight 1997, 39, 493–497. [Google Scholar]
- Mallat, S.G. A theory for multiresolution signal decomposition: The wavelet representation. IEEE Trans. Pattern Anal. Mach. Intell. 1989, 674–693. [Google Scholar] [CrossRef]
- Yuan, Q.; Zhou, W.; Zhang, L.; Zhang, F.; Xu, F.; Leng, Y.; Wei, D.; Chen, M. Epileptic seizure detection based on imbalanced classification and wavelet packet transform. Seizures 2017, 50, 99–108. [Google Scholar] [CrossRef] [PubMed]
- Mujeeb, S.; Alghamdi, T.A.; Ullah, S.; Fatima, A.; Javaid, N.; Saba, T. Exploiting deep learning for wind power forecasting based on big data analytics. Appl. Sci. 2019, 9, 4417. [Google Scholar] [CrossRef]
- Zhang, P.; Lu, D. A survey of condition monitoring and fault diagnosis toward integrated O&M for wind turbines. Energies 2019, 12, 2801. [Google Scholar] [CrossRef]
- Kong, Z.; Xia, Z.; Cui, Y.; Lv, H. Probabilistic forecasting of short-term electric load demand: An integration scheme based on correlation analysis and improved weighted extreme learning machine. Appl. Sci. 2019, 9, 4215. [Google Scholar] [CrossRef]
- Liu, B. Selection of wavelet packet basis for rotating machinery fault diagnosis. J. Sound Vib. 2005, 284, 567–582. [Google Scholar] [CrossRef]
- Han, J.G.; Ren, W.X.; Sun, Z.S. Wavelet packet based damage identification of beam structures. Int. J. Solids Struct. 2005, 42, 6610–6627. [Google Scholar] [CrossRef]
- Asgarian, B.; Aghaeidoost, V.; Shokrgozar, H.R. Damage detection of jacket type offshore platforms using rate of signal energy using wavelet packet transform. Mar. Struct. 2016, 45, 1–21. [Google Scholar] [CrossRef]
- García Plaza, E.; Núñez López, P.J. Application of the wavelet packet transform to vibration signals for surface roughness monitoring in CNC turning operations. Mech. Syst. Signal. Process. 2018, 98, 902–919. [Google Scholar] [CrossRef]
- Sohaib, M.; Kim, J.M. Data driven leakage detection and classification of a boiler tube. Appl. Sci. 2019, 9, 2450. [Google Scholar] [CrossRef]
- Yan, G.; Lu, X.; Tang, J. Guided wave-based monitoring of evolution of fatigue damage in glass fiber/epoxy composites. Appl. Sci. 2019, 9, 1394. [Google Scholar] [CrossRef]
- Chan, Y.T. Wavelet Basic; Sringer: New York, NY, USA, 1995. [Google Scholar]
- Van Koten, H.; Middendorp, P. Testing of Foundation Piles; Heron, Joint Publication of the Dept. of Civil Engineering of Delft University of Technology: Delft, The Netherlands; Institute of TNO for Building Materials and Sciences: Rigswijk, The Netherlands, 1981. [Google Scholar]
- Davis, A.G.; Dunn, C.S. From Theory to Field Experience with the Non-Destructive Vibration Testing of Piles. Proc. Inst. Civ. Eng. 1974, 57, 571–593. [Google Scholar] [CrossRef]
- Wang, J.; Ding, M. Quantitative Analysis of Pile Integrity. In Proceedings of the Fifth International Conference on the Application of Stress-Wave Theory to Piles (StressWave ’96), Orlando, FL, USA, 11–13 September 1996; pp. 939–944. [Google Scholar]
- Horiguchi, T.; Karkee, M.; Sakai, T.; Kishida, H. Assessment of the Pile Integrity and the Mobilized Bearing Resistance Using the Mid-range Dynamic Test. In Proceedings of the Fifth International Conference on the Application of Stress-Wave Theory to Piles (StressWave ’96), Orlando, FL, USA, 11–13 September 1996; pp. 971–979. [Google Scholar]
- Pessiki, S.; Johnson, M. In-Place Determination of Concrete Strength by the Impact-Echo Method. In Proceedings of the Structures Congress XII, Atlanta, Georgia, 24–28 April 1994; pp. 1340–1345. [Google Scholar]
- ACI 318-08: Building Code Requirements for Structural Concrete and Commentary; American Concrete Institute: Indianapolis, IN, USA, 2008; ISBN 0870312642.
- Bettayeb, F.; Haciane, S.; Aoudia, S. Improving the time resolution and signal noise ratio of ultrasonic testing of welds by the wavelet packet. NDTE Int. 2005, 38, 478–484. [Google Scholar] [CrossRef]
- Walczak, B.; Massart, D.L. Tutorial: Noise suppression and signal compression using the wavelet packet transform. Chemomet. Intell. Lab. Syst. 1997, 36, 81–94. [Google Scholar] [CrossRef]
- Misiti, M.; Misiti, Y.; Oppenheim, G.; Poggi, J.M. Wavelet Toolbox User Guide for Use with Matlab-Version 4; Math Works Inc.: Natick, MA, USA, 2009. [Google Scholar]
- Yen, G.G.; Lin, K.C. Wavelet packet feature extraction for vibration monitoring. IEEE Trans. Ind. Electron. 2000, 47, 650–667. [Google Scholar] [CrossRef]
- Liao, S. Nondestructive Testing of Piles. Ph.D. Thesis, The University of Texas at Austin, Austin, TX, USA, 1994. [Google Scholar]
- Kim, H.J.; Mission, J.L.; Park, I.S. Analysis of static axial load capacity of single piles and large diameter shafts using nonlinear load transfer curves. KSCE J. Civ. Eng. 2007, 11, 285–292. [Google Scholar] [CrossRef]
- ABAQUS User’s Manual-Version 6.7; SIMULIA Dassault Systemes: Vélizy-Villacoublay, France, 2007.
- Tchepak, S. Experiences with Low Strain Integrity Testing of Cast in Situ Piles. In Proceedings of the Fifth International Conference on the Application of Stress-Wave Theory to Piles (StressWave ’96), Orlando, FL, USA, 11–13 September 1996; pp. 612–625. [Google Scholar]
- Hartung, M.; Meier, K.; Rodatz, W. Integrity Testing of Model Piles. In Proceedings of the Fourth International Conference on the Application of Stress-Wave Theory to Piles, The Hague, The Netherlands, 21–24 September 1992; CRC Press: Boca Raton, FL, USA, 1992; pp. 265–269. [Google Scholar]


| Concrete Quality | Impact Wave Speed in Concrete, c (m/s) | Compressive Strength, f’c (MPa) | |
|---|---|---|---|
| Excellent | >4570 | >73.5 | >40,294 |
| Good | 3660–4570 | 20.4–73.5 | 21,228–40,294 |
| Not good | 3050–3660 | 8.6–20.4 | 13,783–21,228 |
| Bad | 2130–3050 | 2.4–8.6 | 7281–13,783 |
| Very bad | <2130 | <2.4 | <7281 |
| Property | Unit | Description or Quantity |
|---|---|---|
| Intact pile: | ||
| Pile type | Not applicable | Bored pile |
| Pile diameter, D | m | 0.5 |
| Pile length, L | m | 15 |
| Elastic modulus, E1 | GPa | 38.40 |
| Density, ρ | kg/m3 | 2400 |
| Poission ratio, µ | Dimensionless | 0.20 |
| Bearing layer: | ||
| Elastic modulus, Eb | GPa | 5 GPa |
| Density, ρb | kg/m3 | 2000 |
| Poission ratio, µb | Dimensionless | 0.30 |
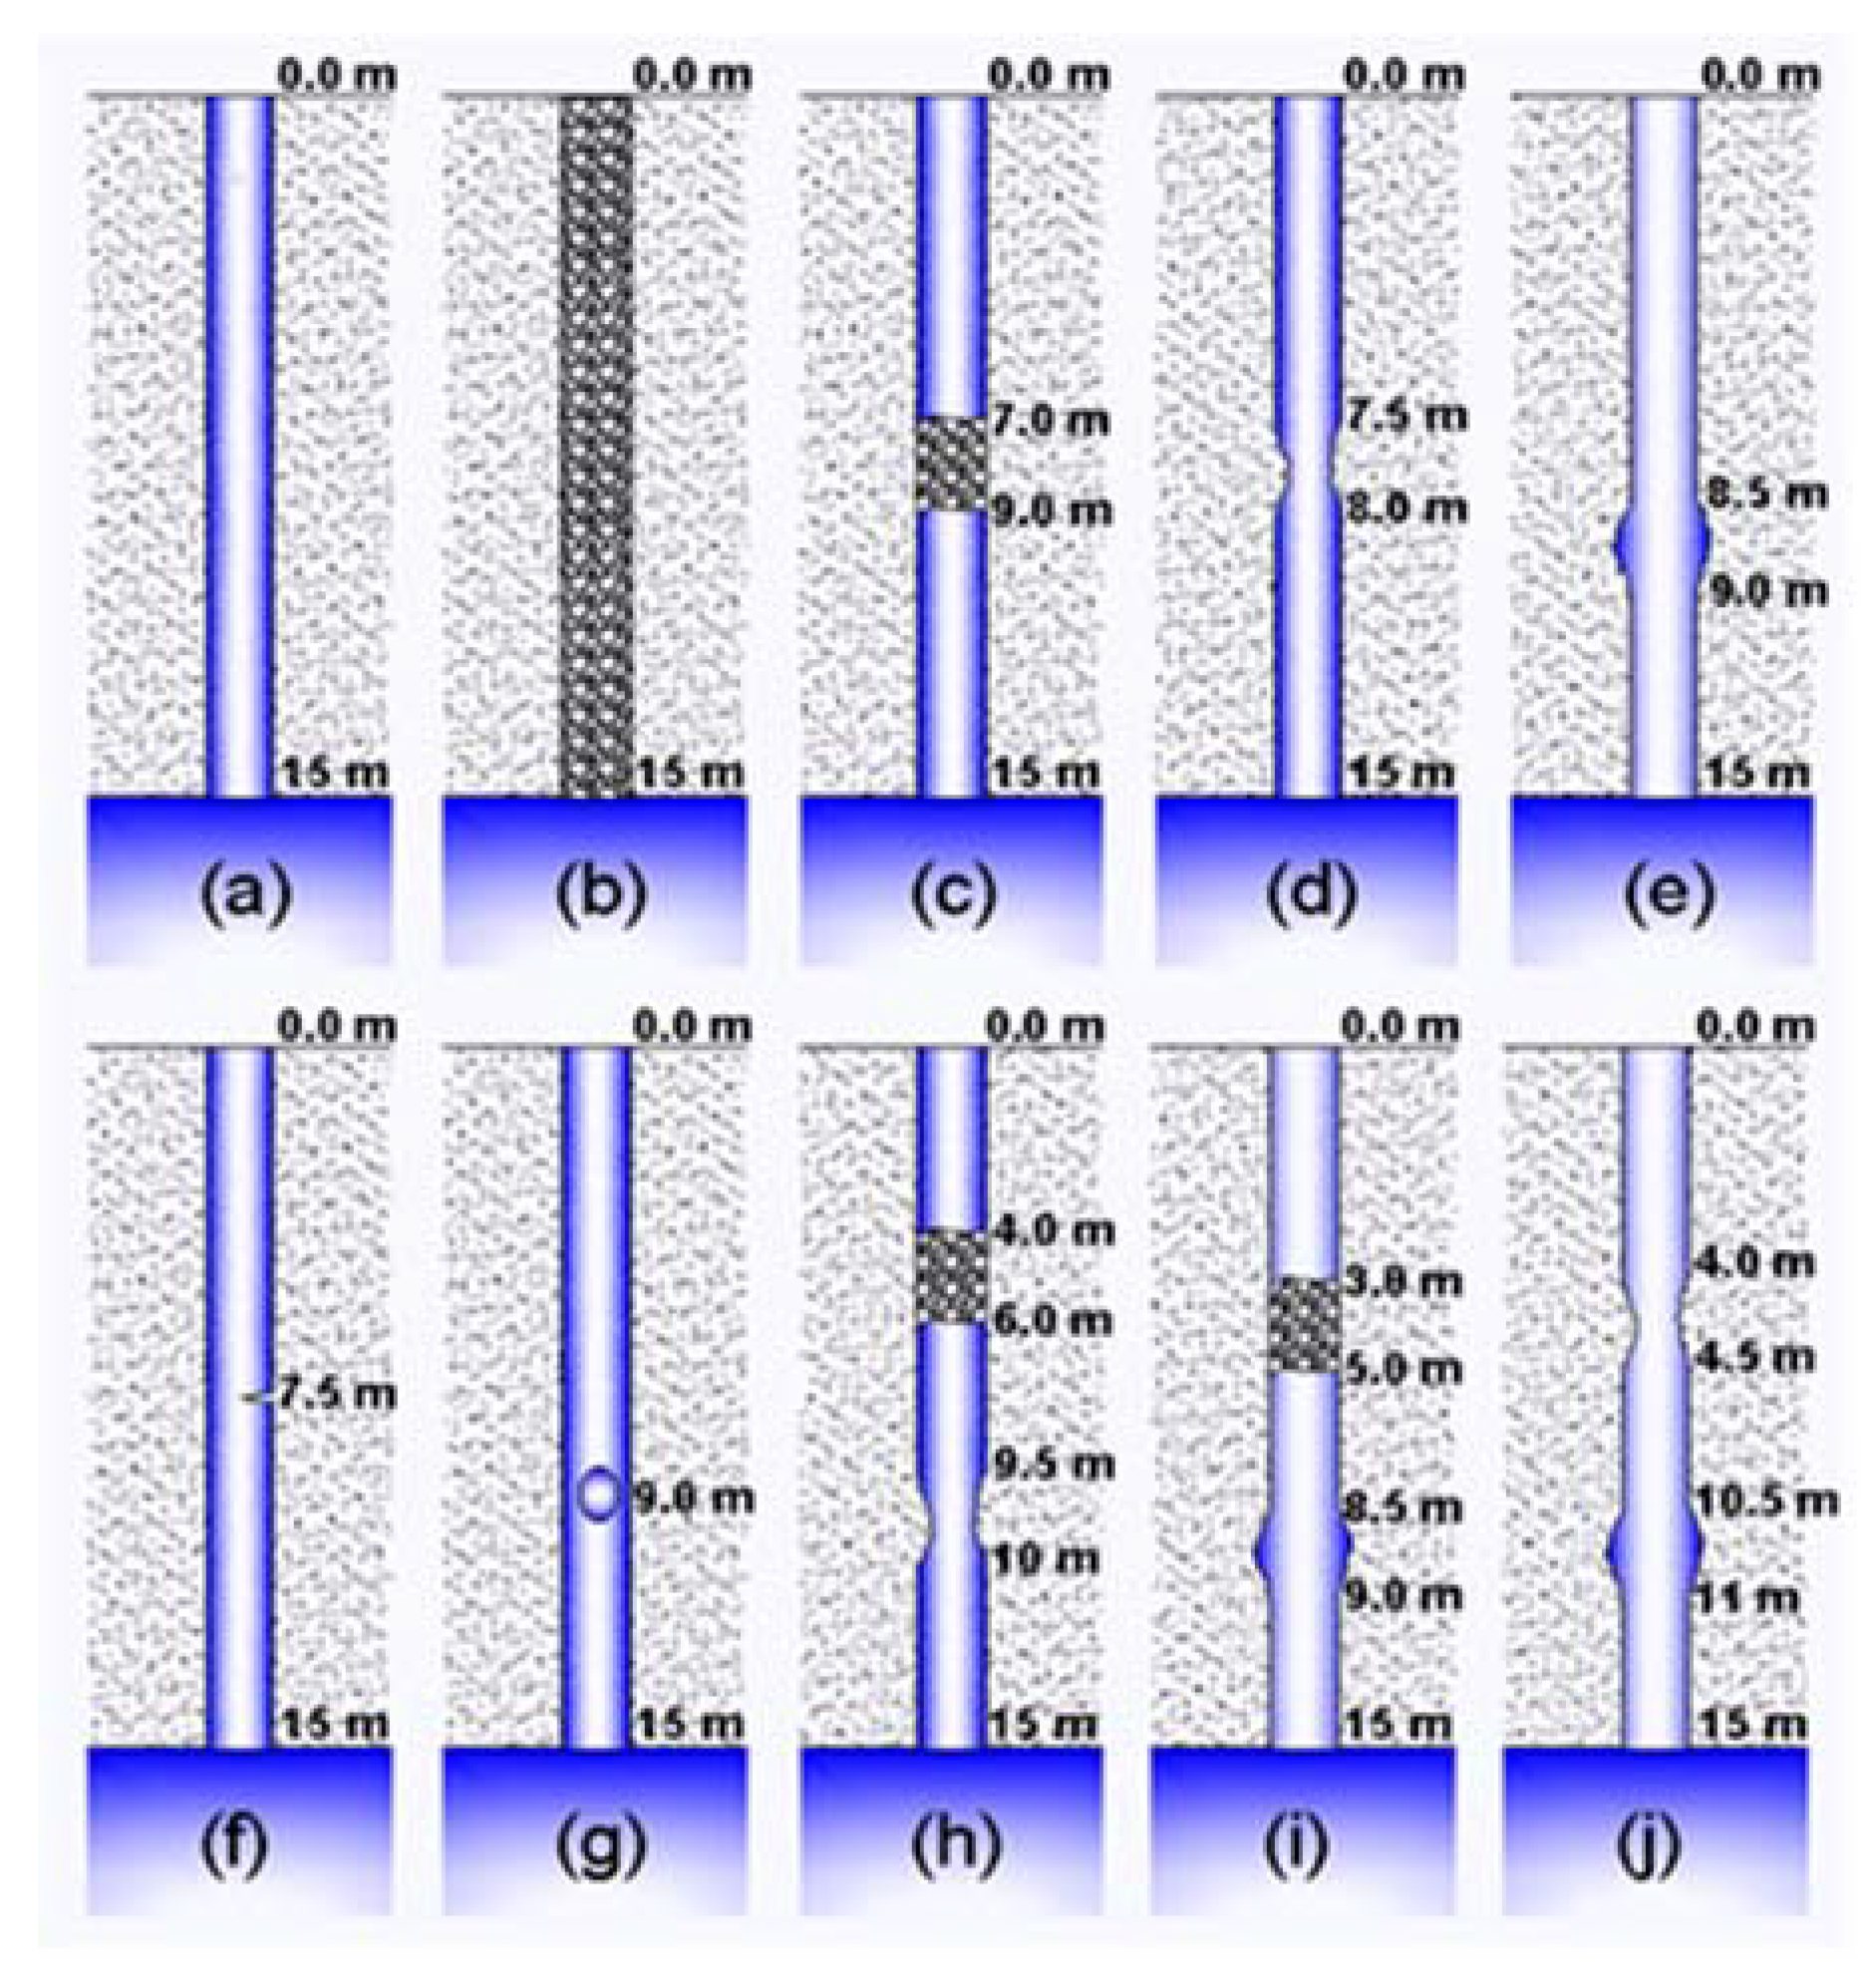
| Case | Location of Pile Defect (z1 = First Pile Defect; z2 = Second Pile Defect) | Description of Pile Defect |
|---|---|---|
| b | z1 = 0–15.0 m | Poor concrete quality (E2 = 20 GPa) |
| c | z1 = 7.0–9.0 m | Weak material at a section (E2 = 20 GPa) |
| d | z1 = 7.5–8.0 m | Neck (Dn = 0.9D) |
| e | z1 = 8.5–9.0 m | Bulge (Db = 1.2D) |
| f | z1 = 7.5 m | Notch (50 mm wide and 0.20 m deep) |
| g | z1 = 9.0 m | Spherical void (0.20 m in diameter) |
| h | z1 = 4.0–6.0 m | Weak material at a section (E2 = 20 GPa) |
| z2 = 9.5–10.0 m | Neck (Dn = 0.9D) | |
| i | z1 = 3.7–5.0 m | Weak material at a section (E2 = 20 GPa) |
| z2 = 9.5–10.0 m | Bulge (Db = 1.2D) | |
| j | z1 = 4.0–4.5 m | Neck (Dn = 0.9D) |
| z2 = 10.5–11.0 m | Bulge (Db = 1.2D) |
| Case | Dataset | ||||||
|---|---|---|---|---|---|---|---|
| 1 | 2 | 3 | 4 | 5 | 6 | ||
| b | z1 = 7–7.25 m E2 = 7 GPa | z1 = 7–7.25 m E2 = 10 GPa | z1 = 7–7.25 m E2 = 15 GPa | z1 = 7–7.25 m E2 = 25 GPa | z1 = 7–7.25 m E2 = 30 GPa | z1 = 7–7.25 m E2 = 35 GPa | |
| c | z1 = 7–7.25 m E2 = 7 GPa (25% area) | z1 = 8–8.50 m E2 = 10 GPa (25% area) | z1 = 9–10 m E2 = 15 GPa (50% area) | z1 = 10–11 m E2 = 25 GPa (50% area) | z1 = 3–4 m E2 = 30 GPa (75% area) | z1 = 12–13 m E2 = 35 GPa (75% area) | |
| d | z1 = 7.5–8 m Dn = 0.95D | z1 = 7.5–8 m Dn = 0.8D | z1 = 7–9 m Dn = 0.7D | z1 = 3–4 m Dn = 0.9D | z1 = 6–10 m Dn = 0.8D | z1 = 12–13 m Dn = 0.7D | |
| e | z1 = 7.5–8 m Db = 1.1D | z1 = 7.75–8 m Db = 1.2D | z1 = 7–9 m Db = 1.3D | z1 = 3–4 m Db = 1.2D | z1 = 6–10 m Db = 1.3D | z1 = 12–13 m Db = 1.3D | |
| f | z1 = 12 m notch (30 mm wide 0.20 m deep) | z1 = 3 m notch (20 mm wide 0.10 m deep) | z1 = 10 m notch (10 mm wide 0.20 m deep) | z1 = 8 m crack (5 mm wide 0.10 m deep) | z1 = 12 m crack (3 mm wide 0.20 m deep) | z1 = 3 m crack (3 mm wide 0.20 m deep) | |
| g | z1 = 7 m spherical void (0.10 m diameter) | z1 = 4 m cylindrical void (0.1 m dia. × 0.5 m) | z1 = 6–7 m cylindrical void (0.2 m dia. × 1.0 m) | z1 = 7–7.5 m elliptical void (0.5 × 0.2 m dia.) | z1 = 9–10 m, elliptical void (1.0 × 0.2 m dia.) | z1 = 12–12.5 m elliptical void (0.5 × 0.1 m dia.) | |
| h | 1 | z1 = 3–3.25 m E2 = 7 GPa | z1 = 4–4.5 m E2 = 10 GPa | z1 = 4–5 m E2 = 15 GPa | z1 = 5–6 m E2 = 25 GPa | z1 = 3–3.10 m E2 = 30 GPa | z1 = 4–5 m E2 = 35 GPa |
| 2 | z2 = 8–8.5 m Dn = 0.95D | z2 = 8.5–9 m Dn = 0.8D | z2 = 7–9 m Dn = 0.7D | z2 = 10–11 m Dn = 0.9D | z2 = 8–12 m Dn = 0.8D | z2 = 12–13 m Dn = 0.7D | |
| i | 1 | z1 = 3–3.25 m E2 = 7 GPa | z1 = 4–4.5 m E2 = 10 GPa | z1 = 4–5 m E2 = 15 GPa | z1 = 5–6 m E2 = 25 GPa | z1 = 3–4 m E2 = 30 GPa | z1 = 4–5 m E2 = 30 GPa |
| 2 | z2 = 8–8.5 m Db = 1.1D | z2 = 8.5–9 m Db = 1.2D | z2 = 7–9 m Db = 1.3D | z2 = 10–11 m Db = 1.1D | z2 = 8–12 m Db = 1.3D | z2 = 12–13 m Db = 1.3D | |
| j | 1 | z1 = 4.5–5 m Dn = 0.95D | z1 = 3–4 m Dn = 0.8D | z1 = 4–7 m Dn = 0.7D | z1 = 3–4 m Dn = 0.9D | z1 = 4–8 m Dn = 0.8D | z1 = 4–5 m Dn = 0.7D |
| 2 | z2 = 10.5–11 m Db = 1.1D | z2 = 7.5–8 m Db = 1.2D | z2 = 9–12 m Db = 1.3D | z2 = 8–10 m Db = 1.2D | z2 = 12–13 m Db = 1.3D | z2 = 8–12 m Db = 1.3D | |
| Method 1: Diagnostic Result Using Amplification Method and Wavelet Packet Transform (WPT) | ||||||
| Case | 1 | 2 | 3 | 4 | 5 | 6 |
| b | 1.0 | 1.0 | 1.0 | 1.0 | 1.0 | 1.0 |
| c | 1.0 | 0.5 | 0.5 | 1.0 | 1.0 | 1.0 |
| d | 0.5 | 1.0 | 1.0 | 1.0 | 1.0 | 1.0 |
| e | 0.5 | 1.0 | 1.0 | 1.0 | 1.0 | 1.0 |
| f | 1.0 | 0 | 1.0 | 0 | 1.0 | 1.0 |
| g | 0 | 1.0 | 1.0 | 1.0 | 1.0 | 1.0 |
| h | 0.5 | 1.0 | 1.0 | 1.0 | 1.0 | 1.0 |
| i | 0.5 | 1.0 | 0.5 | 1.0 | 1.0 | 1.0 |
| j | 1.0 | 1.0 | 0.5 | 1.0 | 1.0 | 1.0 |
| Method 2: Diagnostic Result Using Visual Inspection Scheme Based on Peaks and Amplification | ||||||
| Case | 1 | 2 | 3 | 4 | 5 | 6 |
| b | 1.0 | 1.0 | 1.0 | 1.0 | 1.0 | 1.0 |
| c | 0.5 | 0.5 | 0.5 | 1.0 | 0.5 | 0 |
| d | 0 | 1.0 | 0.5 | 0 | 0 | 1.0 |
| e | 0 | 0.5 | 1.0 | 0.5 | 0 | 1.0 |
| f | 0.5 | 0 | 1.0 | 0 | 1.0 | 0 |
| g | 0 | 0 | 0.5 | 1.0 | 1.0 | 1.0 |
| h | 0.5 | 1.0 | 1.0 | 1.0 | 1.0 | 0.5 |
| i | 0.5 | 1.0 | 0.5 | 1.0 | 1.0 | 0.5 |
| j | 1.0 | 1.0 | 0.5 | 1.0 | 1.0 | 0.5 |
© 2020 by the authors. Licensee MDPI, Basel, Switzerland. This article is an open access article distributed under the terms and conditions of the Creative Commons Attribution (CC BY) license (http://creativecommons.org/licenses/by/4.0/).
Share and Cite
Kim, H.-J.; Mission, J.L.; Dinoy, P.R.; Kim, H.-S.; Park, T.-W. Guidelines for Impact Echo Test Signal Interpretation Based on Wavelet Packet Transform for the Detection of Pile Defects. Appl. Sci. 2020, 10, 2633. https://doi.org/10.3390/app10072633
Kim H-J, Mission JL, Dinoy PR, Kim H-S, Park T-W. Guidelines for Impact Echo Test Signal Interpretation Based on Wavelet Packet Transform for the Detection of Pile Defects. Applied Sciences. 2020; 10(7):2633. https://doi.org/10.3390/app10072633
Chicago/Turabian StyleKim, Hyeong-Joo, Jose Leo Mission, Peter Rey Dinoy, Hyeong-Soo Kim, and Tae-Woong Park. 2020. "Guidelines for Impact Echo Test Signal Interpretation Based on Wavelet Packet Transform for the Detection of Pile Defects" Applied Sciences 10, no. 7: 2633. https://doi.org/10.3390/app10072633
APA StyleKim, H.-J., Mission, J. L., Dinoy, P. R., Kim, H.-S., & Park, T.-W. (2020). Guidelines for Impact Echo Test Signal Interpretation Based on Wavelet Packet Transform for the Detection of Pile Defects. Applied Sciences, 10(7), 2633. https://doi.org/10.3390/app10072633