Review

Planar Microwave Resonant Sensors: A Review and Recent Developments

1
CIMITEC, Departament d’Enginyeria Electrònica, Universitat Autònoma de Barcelona, 08193 Bellaterra, Spain
2
Departamento de Ingeniería Audiovisual y Comunicaciones, Universidad Politécnica de Madrid, 28031 Madrid, Spain
*
Author to whom correspondence should be addressed.
Appl. Sci. 2020, 10(7), 2615; https://doi.org/10.3390/app10072615
Submission received: 2 March 2020 / Revised: 26 March 2020 / Accepted: 7 April 2020 / Published: 10 April 2020
(This article belongs to the Special Issue Passive Planar Microwave Devices )

Abstract

:
Microwave sensors based on electrically small planar resonant elements are reviewed in this paper. By virtue of the high sensitivity of such resonators to the properties of their surrounding medium, particularly the dielectric constant and the loss factor, these sensors are of special interest (although not exclusive) for dielectric characterization of solids and liquids, and for the measurement of material composition. Several sensing strategies are presented, with special emphasis on differential-mode sensors. The main advantages and limitations of such techniques are discussed, and several prototype examples are reported, mainly including sensors for measuring the dielectric properties of solids, and sensors based on microfluidics (useful for liquid characterization and liquid composition). The proposed sensors have high potential for application in real scenarios (including industrial processes and characterization of biosamples).

1. Introduction

Within the paradigm of the internet of things (IoT), or more generally the internet of everything (IoE), and the advent of the fourth industrial revolution (also known as Industry 4.0), the use of sensors has experienced an exponential growth. Moreover, this trend will continue with the progressive implantation of the 5th generation of mobile networks, designated as 5G, which is expected to satisfy the large-scale connectivity requirements that today’s modern society demands (an interesting example is the autonomous and connected vehicle, necessarily equipped with hundreds of sensors). There are many available technologies for the implementation of sensors. Aspects such as diverse as sensor cost, size, and complexity, as well as the type of measurand, among others, dictate the preferred option. Although the most extended technology in modern sensors is probably optics/photonics (examples include optical fiber sensors, laser-based sensors, wearable chemical and biological sensors, nanophotonic biosensors, image sensors, etc.), significant efforts have been dedicated in recent years to the research and development of microwave sensors, especially for applications related to material characterization and composition. Microwaves are very sensitive to the properties of the materials to which they interact. Therefore, microwave technology is very useful for material sensing. Moreover, microwaves exhibit further interesting properties for sensing, such as low-cost generation and detection systems, interaction to the materials at different scales (i.e., through the near-field or the far-field), compatibility with planar technology, wireless connectivity, and robustness against harsh environments, among others. Thus, highly sensitive, robust, low cost, small size, and low-profile microwave sensors and wireless sensors based on the above-cited properties can be implemented.
This review paper focuses on microwave sensors, and particularly on planar sensors based on resonant elements for material characterization, including solids or liquids. Planar sensors are of special interest as their low-profile is compatible with many applications, where bulk sensors (e.g., cavity sensors or waveguide-based sensors [1,2], among others) may find a severe limitation, e.g., conformal sensors [3], wearable sensors [4], submersible sensors [5], integrated sensors [6], lab-on-a-chip sensors [7], microfluidic sensors [8,9,10,11], etc. On the other hand, despite the fact that non-resonant planar sensors operating at microwave frequencies have been reported [12,13,14], the combination of sensor size and performance (sensitivity) of resonant-type sensor is difficult to achieve with non-resonant methods. Finally, to end this introductory section, let us mention that although probably most planar microwave resonant sensors have been devoted to material characterization (the main interest in this review paper, to be discussed in detail later), there are many reported realizations focused on motion control applications (linear and angular displacement and velocity measurements) [15,16,17,18,19,20,21,22,23,24,25,26,27,28,29,30].

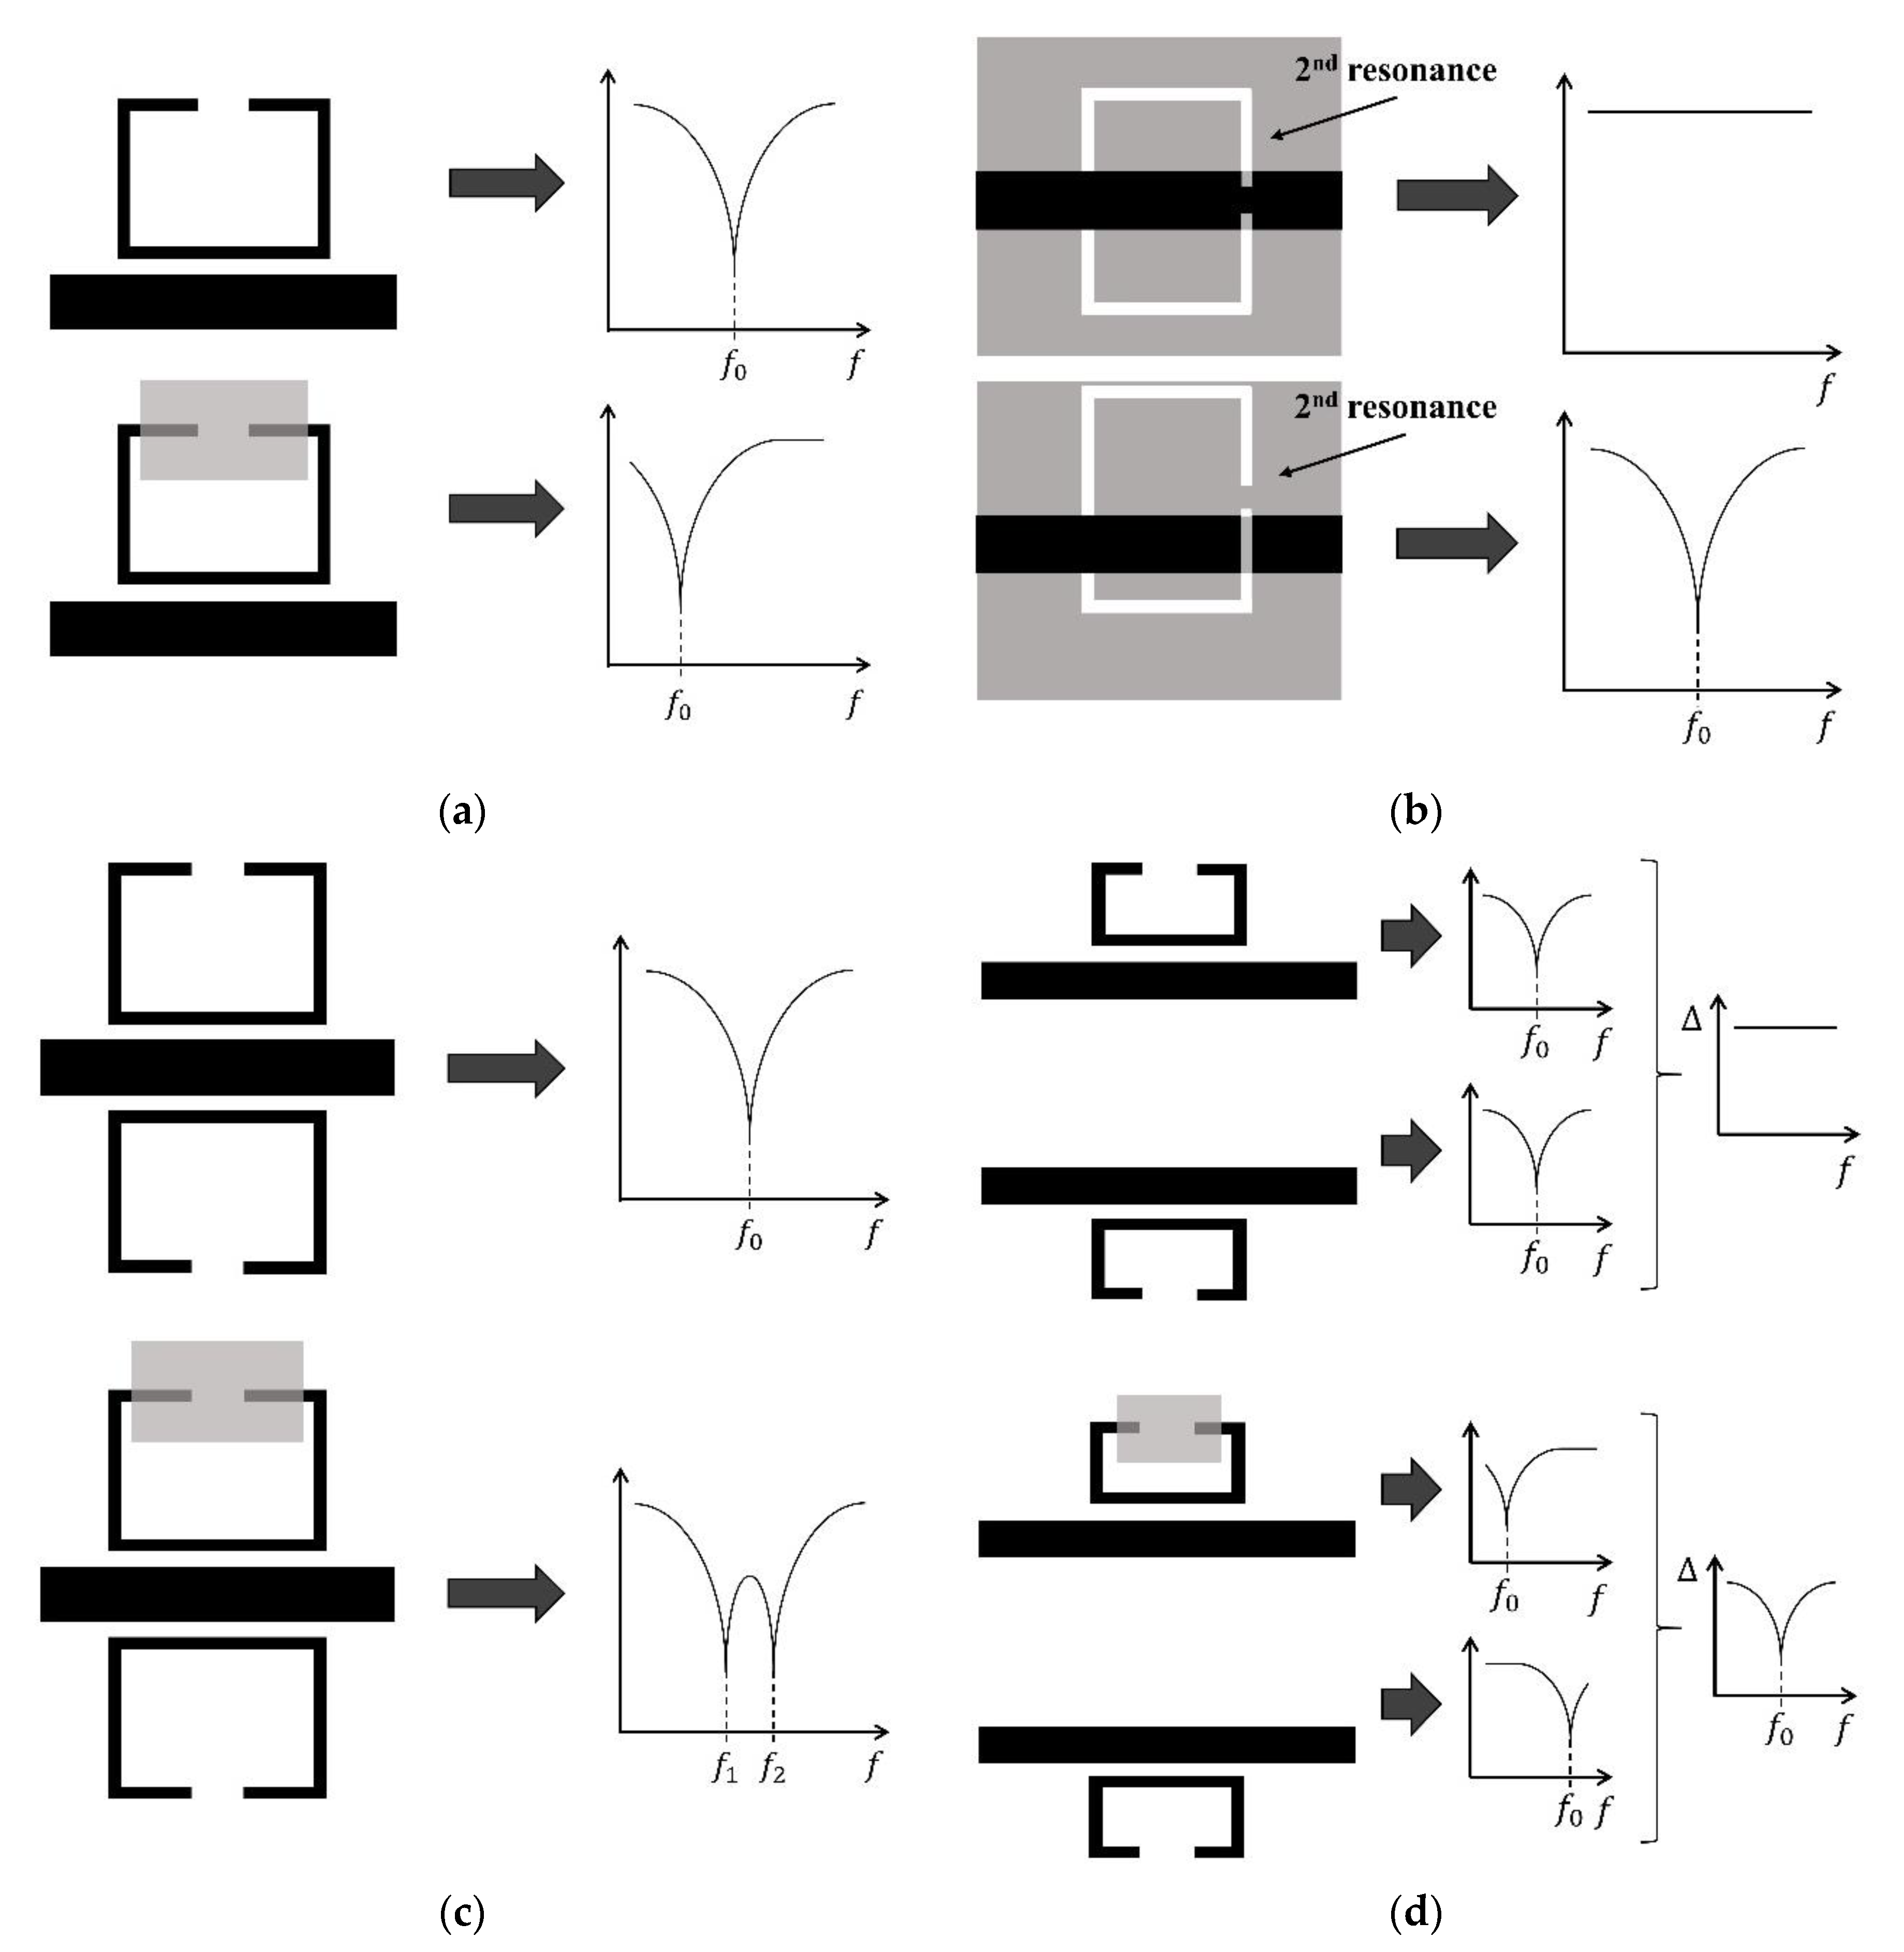
2. Classification of Planar Microwave Resonant Sensors

The classification subject of this section obeys the operating principle of the considered sensors (alternatively, sensors can be categorized by their applications, or frequency range, etc.). Thus, according to their working principle, planar resonant sensors can be divided in four main types: (i) frequency variation sensors, (ii) coupling modulation sensors, (iii) frequency splitting sensors, and (iv) differential-mode sensors. Let us briefly describe their working principle in the next paragraphs.
Frequency variation sensors are based on the variation of the resonance frequency (and eventually quality factor or peak/notch magnitude) of a resonant element, caused by the measurand. The typical, although not exclusive, configuration of such sensors is a transmission line loaded with the resonant element (either in contact or coupled to it), see Figure 1a. Although examples of frequency variation sensors devoted to the measurement of spatial variables have been reported [15], typically these sensors have been applied to dielectric characterization of solids and liquids [31,32,33,34,35,36,37,38,39,40,41,42,43,44,45,46], as far as the resonance frequency and quality factor depend on the complex dielectric constant of the surrounding material (the so-called material under test (MUT)). These sensors are very simple, but they are potentially subjected to cross-sensitivities caused by variations in ambient factors, such as temperature and humidity, and therefore they need calibration before their use.
To alleviate or minimize the impact of cross-sensitivities, symmetry-based sensors are the solution [47]. As symmetry is invariant under potential changes in environmental factors, at least at the typical scales of the sensors, it is expected that sensors based on symmetry properties exhibit certain robustness against environment-related cross-sensitivities. Coupling modulation sensors belong to this category [16,17,18,19,20,21,22,23,24,25,26,27,48]. Such sensors are implemented by symmetrically loading a transmission line by means of a symmetric resonator (Figure 1b). However, the combination of line and resonant element should not be arbitrary. Namely, it is necessary that the symmetry plane of the resonator and the one of the line are of different electromagnetic sort, i.e., one must be an electric wall and the other one must be a magnetic wall. By this means, if symmetry is preserved, line-to-resonator coupling is prevented [47], the resonator is not excited, and the line is transparent, i.e., the frequency response does not exhibit any notch (lack of resonance). However, by truncating symmetry (e.g., by means of an asymmetric dielectric loading or through a relative linear or angular displacement between the line and the resonant element), line-to-resonator coupling arises and, consequently, the resonance appears. The magnitude of the notch (the typical output variable) is determined by the coupling degree, intimately related to the level of the asymmetry. Thus, coupling modulation by symmetry disruption is useful for sensing purposes. Nevertheless, as the most natural procedure for symmetry truncation is by a relative displacement between the resonator and the line, most sensors based on this principle have been devoted to angular and linear measurements [16,17,18,19,20,21,22,23,24,25,26,27,48]. For such application, the most limitative aspect of these sensors is the input dynamic range, related to the small dimensions of the sensing resonators. A variant of this approach, providing the solution to such limitation, was presented in [28,29,30], where circular chains of resonant elements were applied to the implementation of microwave rotary encoders based on pulse counting (linear encoders, potentially exhibiting an unlimited dynamic range, were also presented in [49,50]). Another drawback of these sensors is related to the fact that measuring the notch magnitude is more sensitive to the effects of noise, as compared to frequency measurements. However, a small frequency scan, or even a single-frequency measurement, suffices to collect the sensor information.
Frequency splitting sensors combine the advantages of frequency measurements (noise tolerant) and symmetry properties (robustness against cross-sensitivities) [24,51,52,53,54,55,56,57,58,59]. In these sensors, a symmetric transmission line-based structure is symmetrically loaded with a pair of (not necessarily symmetric) resonators (Figure 1c). If symmetry is preserved, a single notch in the transmission coefficient arises. However, if symmetry is truncated, e.g., by an asymmetric dielectric loading, the original notch splits in two notches separated a distance that depends on the level of asymmetry. Thus, in frequency splitting sensors, the output variable is such frequency separation, and, eventually, the difference in the notch magnitude (two variables are needed, for instance, for the measurement of the dielectric constant and loss tangent of materials [56,58]). A potential weakness of these sensors is the limited sensitivity and resolution if the resonant elements are coupled [51,52,55]. Nevertheless, solutions to this problem have been reported, as discussed in [56,57], at the expense of significantly separating the sensing resonators (either by using a splitter/combiner scheme [57,58] or a cascaded topology [56]). Although these sensors are not true differential sensors (in the sense that two independent sensors are not used), the input and the output variable are typically differential variables. The differential dielectric constant or loss tangent (between a reference (REF) sample, or material, and the material under test (MUT)) is the usual input variable, whereas the differential notch frequency and/or magnitude is the natural output variable/s. Moreover, frequency splitting sensors can be easily used as comparators, as they are able to detect differences between the REF and MUT samples. For this application, sensor resolution is the key aspect. However, in terms of resolution, such sensors cannot compete, in general, against true differential sensors, to be discussed next.
Differential-mode sensors also belong to the group of symmetry-based sensors. Such devices are composed of two independent sensors, one sensitive to the REF sample (or measurand in general), and the other one sensitive to the MUT sample (Figure 1d). These sensors can operate as single-ended sensors as well, e.g., based on frequency variation, where only one of the individual sensing elements is used. However, exploiting the differential input and output variable/s provides robustness against cross-sensitivities. As far as independent sensing elements are used, the abovementioned coupling effects, which typically limit the resolution, can be prevented in differential sensors. The output variable in these sensors is merely the difference between the output variable of each sensing element. It has been demonstrated that highly sensitive differential sensors for dielectric constant measurements can be implemented by means of a pair of meander lines. These sensors are based on the measurement of the phase difference between the pair of lines, and the penalty to achieve high sensitivity is sensor size [14]. Nevertheless, it has been demonstrated that by replacing the meander lines with artificial lines, sensitivity optimization can be made compatible with moderate or even small sizes [12,60]. Many differential sensors based on resonator-loaded lines (the interest in this work) have been reported, including microfluidic sensors for liquid characterization [61,62,63,64,65,66,67]. In some realizations, the output variable is the cross-mode transmission coefficient [62,63,64,65,66,67], proportional to the difference between the transmission coefficients of both sensing lines, provided such lines are uncoupled. Huge sensitivities and resolutions, useful to detect, e.g., small volume fractions or electrolyte concentrations in liquid solutions, have been achieved by means of these sensors. Although, typically, differential-mode sensors involve four-port measurements (these sensors are four-port devices), it has been demonstrated that by adding extra (microwave) circuitry, differential sensing by means of two-port devices (and measurements) can be achieved [68,69]. In [69], the differential sensor works in reflection (other reflective-mode sensors have been reported [70], also including single-ended sensors [71]). The sensor reported in [72] is also remarkable, where symmetry truncation in a pair of slotted resonators generates quasi-microstrip to slot-mode conversion, useful for sensing.
Although examples of the different sensor types highlighted in this section will be provided, the main emphasis in this paper is on differential-mode sensors. Nevertheless, before reviewing the different implementations, let us first present the potential candidates for resonant sensing elements, and discuss their advantages and disadvantages.

3. Planar Resonant Elements for Sensing

There are dozens of planar resonant elements that can be useful for sensing purposes. In this paper, the interest is in electrically small (quasi-lumped) resonators that can be described by means of a lumped-element equivalent circuit model up to frequencies beyond their fundamental resonance (the authors recommend the books [73,74], and the paper [75], where a review of many of these resonators is carried out). Probably the simplest classification of such resonators can be made by differentiating on whether they are metallic or slot resonators. In the first group, resonant elements of interest for sensing include the step impedance resonator (SIR) [76], the step impedance shunt stub (SISS) [77], the split-ring resonator (SRR) [78], the open split-ring resonator (OSRR) [79], and the electric-LC (ELC) resonator [80], among others (see Figure 2). Slot resonators are typically etched in the ground plane and are sometimes designated as defect ground structure (DGS) resonators. Examples of such resonators include the complementary counterparts of the SRR and the OSRR, that is, the complementary split-ring resonator (CSRR) [81] and the open complementary split-ring resonator (OCSRR) [82], respectively, the dumbbell-shaped DGS (DB-DGS) resonator [83], and the magnetic-LC (MLC) resonator [84], among others (see Figure 3). There are many other electrically small resonators, including the S-shaped-SRR [85], the spiral resonator [86], the non-bi-anisotropic-SRR [87] (as well as their complementary counterparts), the broadside-coupled-SRR [88], etc., but their use for sensing has been more limited.
A comparative analysis of electrically small resonators, with the focus on metamaterial and metamaterial-inspired circuit design, was carried out in [75]. For sensing, the most important aspect is the effect of resonator topology on sensor performance, mainly sensitivity, resolution, and dynamic range. Nevertheless, compatibility of the sensing element (resonator), including the dielectric load, with the required hardware and mechanical parts of the sensor is also important. For instance, for microfluidic applications, the fluidic channels plus the required mechanical accessories should not affect the transmission lines used for resonator’s excitation. In this regard, slot resonators constitute, in general, a good solution, as the ground plane provides backside isolation, thereby preventing for any potential effect of the dielectric load on sensor functionality. The size of the resonant element may be also important in certain applications devoted to the characterization of small dielectric loads. Obviously, increasing the frequency is a possibility, but this has the effect of raising the cost of the associated electronics. Therefore, considering resonant elements with small electrical size is expected to provide a good tradeoff, allowing for the implementation of compact sensors (sensitive element) operating at moderate (or even low) frequencies. In this regard, the OSRR and the OCSRR are electrically smaller than the SRR and the CSRR, respectively, by a factor of two [74,89], and are therefore good candidates from the point of view of sensor size.
Concerning sensitivity and resolution (intimately related), it is difficult to firmly establish the preferred resonator topology, as it may be determined by several aspects, including the sensing working principle, the considered input and output variables, etc. For instance, for complex permittivity measurements, both the real and the imaginary part of the complex permittivity (input variables) must be determined, and two output variables (e.g., the frequency position and notch magnitude) are needed to unequivocally infer both measurands. For this kind of application, with more than one input variable (or measurand), several sensitivities, including cross-sensitivities, can be defined, and this further prevents from obtaining concluding remarks with regard to the effects of resonator topology on sensitivity and resolution. However, the real part of the complex permittivity (or the dielectric constant) of the MUT mainly affects the resonance frequency of the sensing element (through the effects on the capacitance), whereas the imaginary part (related to the loss tangent) primarily affects the quality factor or the notch magnitude. For a given resonator, the strategy for optimizing such “natural sensitivities” (in terms of geometry) typically coincides (e.g., for the OCSRR and dumbbell-DGS, as it was demonstrated in [62,64], respectively).
It is difficult, however, to determine absolutely the optimum resonator (among those depicted in Figure 2) in terms of sensitivity (and resolution) optimization. Nonetheless, to the light of a comparative analysis of the circuit model of the considered resonators, it is possible to infer some helpful hints. As an example, let us compare three slot resonators: the CSRR, the OCSRR, and the DB-DGS. The circuit models of such resonant elements loading a transmission line are depicted in Figure 4.
Let us assume that the resonant element (the sensing part) is loaded with a dielectric material slab (MUT) of sufficient thickness to ensure that the field lines generated in the slot do not reach the opposite interface, and let us consider that the substrate thickness satisfies also this requirement. If these sensors are intended to work based on frequency variation, the key figure of merit is the relative sensitivity of the resonance frequency, f0, with the dielectric constant of the MUT, εMUT, given by
S = 1 f 0 d f 0 d ε M U T
where the resonance frequency is given by
f o = 1 2 π { L ( C + C c ε r + ε M U T ε r + 1 ) } 1 / 2
Expression (2) is valid for the CSRR-loaded line, whereas for the OCSRR- and the DB-DGS-loaded line, the previous expression is valid by skipping C, the coupling capacitance between the line, and the CSRR. The unloaded resonators are described by the capacitance Cc and by the inductance L. Notice that if the dielectric constant of the MUT is different than the one of air (i.e., εair = 1), the result is a variation of the capacitance of the resonator (and hence a shift in f0), as expected. In (1), εr is the dielectric constant of the substrate. Introducing (2) in (1), the relative sensitivity is found to be
S = 1 2 C c C c ( ε r + ε M U T ) + C ( ε r + 1 )
In view of (3), we can conclude that it is convenient to reduce C and εr as much as possible for sensitivity optimization. Consequently, the DB-DGS and the OCSRR are good candidates for the implementation of high sensitive frequency variation sensors, at least as compared to CSRRs. In [90], it was demonstrated that the relative sensitivity of DB-DGS-loaded lines is better than the one of CSRR-loaded lines. To gain further insight on this, we have designed an OCSRR-loaded line (Figure 5a), and we have inferred the relative sensitivity as defined in (1), from the simulated responses obtained by considering MUTs of different dielectric constant. The results, depicted in Figure 6, and compared to those reported in [90], confirm that the relative sensitivity of the OCSRR-loaded line is comparable to the one of the DB-DGS, as predicted by the theory. Note that one difference between the OCSRR- and the CSRR- or the DB-DGS-loaded line is the type of response, with a maximum at f0 for the OCSRR-based line, and notched at resonance for the other lines.

4. Prototype Examples

In this section, several examples of planar microwave resonant sensors, categorized according to the classification of Section 2, are reported. These sensors are devoted to dielectric characterization, with the exception of the coupling modulation sensor of Section 4.2, a rotary encoder.

4.1. Frequency Variation Sensors

The first example is a frequency variation sensor equipped with a microfluidic channel for liquid characterization [46]. In this sensor, the sensitive element is a SISS resonator, loading a microstrip line. The most relevant aspect of this sensor is the high achieved relative sensitivity, by virtue of the specific arrangement, where the ground plane beneath the SISS is removed, and a metallization is added on the top surface, surrounding the rectangular SISS patch with a gap of width s (see Figure 7). Such metallization is connected to the backside ground plane by means of metallic vias. By these means, the single capacitance of the resonant element is the edge capacitance of the SISS, which can be easily perturbed by means of the MUT (either a solid or a liquid), placed on top of it. Note that with this configuration, any extra capacitance that degrades the sensitivity is removed (see Section 3). This sensor has been equipped with a microfluidic channel, in order to perform measurements of the complex permittivity of liquids (Figure 8).
The measured frequency responses of the sensor for different mixtures of DI water and ethanol are depicted in Figure 9a, whereas Figure 9b shows the resonance frequency position and the magnitude of the notch as a function of the volume fraction of water. The water–ethanol solutions offer a wide range of complex permittivity values, which are appropriate for sensor calibration. That is, with this set of measurements, a mathematical model for the sensor can be developed. Specifically, a mathematical relation linking the frequency shift and the notch magnitude to the complex relative permittivity of the test water–ethanol solutions was derived in [46]. As the complex permittivities of water–ethanol as a function of the volume fraction can be independently inferred, a nonlinear least square curve fitting in MATLAB can be used in order to derive an equation describing the relation between variations of the resonance frequency and notch magnitude as a function of the complex permittivity variations.
In [46], the authors used the complex permittivity values of water-ethanol mixtures provided in [91]. With such model, given in [46], the complex permittivity of other liquid solutions can be inferred from the measured values of the resonance frequency and notch magnitude. For instance, in [46], the authors characterized solutions of water–methanol. The measured resonance frequency and notch magnitude for the different concentrations is shown in Figure 10, whereas Figure 11 depicts the real and the imaginary part of the permittivity inferred from the mathematical model. In this figure, the values inferred from the literature are also depicted, and the good agreement between both sets of data can be appreciated. It is remarkable that the relative sensitivity of this sensor is very good, as compared to the one of similar sensors reported in the literature (see [46] for further details).

4.2. Coupling Modulation Sensors

As discussed in Section 2, coupling modulation sensors are implemented by symmetrically loading a transmission line with a symmetric resonator. The symmetry planes of the line and resonant element should be of different electromagnetic sort, i.e., one should be a magnetic wall and the other one an electric wall. Figure 12 illustrates the working principle of coupling modulation sensors, by considering a CPW loaded with a SRR [47]. The line exhibits a magnetic wall at the axial symmetry plane for the fundamental CPW mode, whereas the symmetry plane of the SRR is an electric wall at the fundamental resonance. For perfect symmetry, the electromagnetic field generated by the line is not able to excite the SRR, and the structure is all-pass in the vicinity of the SRR fundamental resonance. This situation is preserved if the SRR is symmetrically loaded with a dielectric material. However, if symmetry is truncated, e.g., by means of an asymmetric dielectric load, as depicted in Figure 12, then the resonator is driven by the line (i.e., line-to-resonator coupling is activated), and a notched response (bandstop-type) appears. Although this type of sensor can be used for dielectric characterization or for comparison purposes by exploiting their electromagnetic symmetry properties, most coupling modulation sensors have been applied to the implementation of linear or angular displacement and velocity sensors [16,17,18,19,20,21,22,23,24,25,26,27,28,29,30,48]. The reason is that a relative linear or angular displacement between the line and the resonant element also truncates symmetry (except if the resonant element displaces linearly in the direction of the line axis). Thus, in this subsection, this sensing approach is illustrated by means of two examples, to be discussed next.
In the first example [22], an angular displacement and velocity sensor based on a circular-shaped CPW loaded with a movable circular ELC resonator is reported. The ELC resonator is a bisymmetric particle, exhibiting orthogonal electric and magnetic walls. Thus, significant variation of line-to-resonator coupling by ELC rotation can be achieved, and this is interesting in terms of the output dynamic range. Figure 13 shows the picture of the CPW and ELC resonator, as well as the experimental set-up used for measuring the angular displacement and velocity.
By rotor motion with regard to the stator, the transmission coefficient at f0, the resonance frequency of the ELC, experiences a roughly linear variation with the rotation angle, as can be appreciated in Figure 14. Thus, the output variable for measuring angular displacement is the magnitude of the transmission coefficient. The sensitivity is reasonable, but the dynamic range is restricted to 90°, as it can be explained from obvious symmetry considerations. To measure the (average) angular velocity, the strategy proposed in [22] is based on an amplitude modulation (AM) scheme. By feeding the line with a harmonic signal tuned to the resonance frequency of the ELC, the amplitude at the output port is expected to be modulated due to the time-varying coupling between the line and the resonant element, and two pulses of the envelope function per cycle are expected. Thus, from the time distance between adjacent pulses, the angular velocity can be inferred. The envelope function can be simply obtained by means of an envelope detector, preceded by an isolator (implemented by means of a circulator) in order to protect the CPW line against mismatching reflections from the diode (a highly nonlinear device). The schematic diagram of the approach is presented in Figure 15. Figure 16 depicts a pair of recorded envelope functions (visualized in an oscilloscope in [22]), corresponding to different angular velocities of the rotor (particularly, 1 rpm and 50 rpm). The measured envelope functions reveal that the method is useful to provide the angular velocity. However, it is not possible to obtain instantaneous velocities with this approach, as only two pulses per cycle are generated. Namely, only the average angular speed corresponding to time lapses between adjacent pulses can be measured. In order to improve this limitative aspect, a very large number of pulses is necessary (like in optical encoders [92,93,94]). Thus, a different approach for the measurement of angular displacements and velocities was reported in [28], where a completely different configuration (edge configuration), providing hundreds of pulses per revolution, was implemented.
In the rotation sensor of Figure 13, the axis of the resonator coincides with the axis of the rotor (axial configuration). In [28], a rotor consisting of a circular chain of resonant elements etched along its edge was proposed as a means to boost the number of pulses (see Figure 17). The working principle is indeed very similar to the one used to infer the angular velocity with the sensor based on the axial configuration. Namely, by rotor motion, the amplitude of the feeding harmonic signal is modulated, but at least as many pulses as resonators in the chain can be generated per each revolution. Indeed, it was demonstrated in [29,30] that by conveniently choosing the frequency of the feeding signal, up to two pulses per resonant element can be achieved, and the sensor reported in [30] exhibits 1200 pulses per revolution (i.e., 600 resonators), which is a relevant figure of merit. Moreover, this sensor is equipped with a resonator’s chain devoted to detect the motion direction (see details in [30]). Note that in this sensor based on the so-called edge configuration, the working principle is coupling modulation as well. By this means, the transmission coefficient of the line at the frequency of the feeding signal periodically varies with time, generating a pulsed AM signal at the output port of the line. However, coupling modulation is achieved by the consecutive crossings of the resonant elements of the chain over the axis of the line (stator), when the rotor is in motion. The working principle is very similar to the one of optical encoders, with apertures in a metallic disc. In such encoders, the apertures are detected by means of an optical beam (when an aperture lies in the path between the source and the detector, a pulse is generated). By contrast, in the sensor based on the edge configuration, the resonators are detected by means of an electromagnetic signal. Therefore, such sensors can be designated as electromagnetic (or microwave) rotary encoders.
Figure 18 depicts the sketch of the sensor with a double chain of resonators to measure the angular speed, and an additional non-periodic chain to discriminate the motion direction. As it can be seen, two harmonic signals are needed in this case (injected through a combiner), one of them tuned to the resonance frequency of the resonators of the velocity chain, and the other one tuned to the resonance of the resonant elements of the direction chain. Rotor motion AM modulates each harmonic signal, and the corresponding envelope functions can be inferred by means of envelope detectors, after filtering each signal by means of a diplexer. Figure 19 shows the photograph of rotor (zoom view) and the stator, as well as a picture of the overall experimental set-up. The envelope functions inferred with such sensing system, corresponding to the angular velocity and direction detection, are shown in Figure 20 (note that the direction is detected by the increasing or decreasing sequence of pulses in the corresponding envelope function).
In these angular displacement and velocity sensors based on the edge configuration, the number of cumulative pulses from a reference (REF) position provides the angle of rotation. Thus, the angular resolution (in degrees) is simply 360°/PPR, where PPR is the number of pulses per revolution. For the specific sensor system of Figure 19, with PPR = 1200, the angular resolution is thus 0.3°, a competitive value. Further details of this sensor (dimensions, considered substrates, specific components, and instrumentation) are given in [30]. A detailed analysis of angular velocity resolution and error for these sensors, out of the scope of this paper, can be found in [29]. As highlighted in [29,30], microwave rotary encoders represent a low-cost alternative to optical encoders. Moreover, microwave encoders can be of interest for operation in harsh and hostile environments (i.e., subjected to radiation, pollution, dirtiness, grease, etc.), where the optical counterparts may offer a limited robustness. Note that the dynamic range of these rotation sensors for angle measurement is theoretically unlimited, as these sensors are based on pulse counting. This is a clear advantage as compared to other sensors based on symmetry disruption and implemented by means of a single resonant element [21,22,23,26,27]. This unlimited dynamic range plus the achievable angular resolution situates these sensors as excellent candidates for angular displacement and velocity sensing.

4.3. Frequency Splitting Sensors

The operation principle of frequency splitting sensors is illustrated in Figure 21 [47]. A transmission line is symmetrically loaded with a pair of (not necessarily symmetric) resonators. If symmetry is preserved, a single notch in the transmission coefficient arises (provided the resonators are coupled to the line). Conversely, if symmetry is disrupted, two notches appear (splitting), and their relative distance depends on symmetry imbalance. Thus, this principle can be used for sensing. Although most frequency splitting sensors are implemented by symmetrically loading a line with a resonator pair (as indicated in Figure 21), in some implementations a cascade configuration, where the two resonant elements are placed at different locations in a transmission line, has been considered [56]. In this subsection, we report a frequency splitting sensor for dielectric characterization of liquids as an illustrative example, where a splitter/combiner configuration is used [58]. With such configuration, the effects of inter-resonator coupling (with negative impact on sensor sensitivity) can be avoided, as it was discussed in [57].
The topology of the designed sensor is shown in Figure 22a, whereas Figure 22b depicts a photograph (in perspective view) of the device, equipped with fluidic channels (device dimensions, substrate, as well as other details related to the fluidic channels and mechanical accessories can be found in [58]). Figure 23 depicts the frequency response for different configurations of channel loading, where the splitting effect for those cases of device imbalance can be observed. With the data of Figure 23 (resonance frequency splitting and difference in the notch magnitude, the output variables), a mathematical model following a scheme similar to the one reported in Section 4.1 can be inferred, provided the complex permittivity of mixtures of DI water, the reference sample, and ethanol can be obtained from independent sources. Such a model links the differential complex permittivity (real and imaginary parts), i.e., the input variables, to the differential output variables. Once the model is known, it can be used to determine the complex permittivity of liquid samples, by considering DI water as reference (REF) sample. In Figure 24, the measured responses of the device for different solutions of water–ethanol injected in the MUT channel, considering water as the REF liquid, are depicted. The inferred output variables are also represented in the figure. With these results and the mathematical model, the complex permittivity of such water–ethanol mixtures was obtained, and the results are depicted in Figure 25. It can be appreciated in that figure that the results lie within the limits of the Weiner model, and consequently these results validate the functionality of the sensor. Although these sensors belong to the category of symmetry-based sensors, and are therefore robust against the effects of ambient factors, the resolution and sensitivity of these sensors is, in general, not as good as the one of true differential sensors, as is discussed in the next section.

4.4. Differential-Mode Sensors

Differential sensors based on a pair of uncoupled lines each one loaded with a resonant sensing element have been reported. The considered resonant elements are OCSRRs [62], SRRs [63], OSRRs [67,69], CSRRs [66], and DB-DGS resonators [64,65]. We report in this paper three prototype examples, including a sensor for complex permittivity measurement of liquids (based on DB-DGSs) [64], a sensor for the determination of volume fraction of solute in liquid solutions (based on OSRRs) [69], and a sensor devoted to the measurement of extremely small concentrations of electrolytes in DI water [66].

4.4.1. Measuring Electrolyte Concentration

Electrolytes are ions, such as sodium (Na+), potassium (K+), calcium (Ca2+), chloride (Cl), and bicarbonate (HCO3), among others, present in the blood and urine. Electrolytes play a key role in several vital functions, such as blood pH and pressure control, body hydration, nerve and muscle functions, etc. [95]. There are electrochemical methods to determine selectively the concentration of electrolytes in blood and urine, mainly based on the so-called ion-selective electrodes (ISE), but such methods are expensive. Measuring the total concentration of ions does not provide complete information, but it may be indicative of certain pathologies, or it can be useful as a prescreening diagnosis tool. Moreover, monitoring the real-time variations of the total electrolyte content in urine or blood samples, as compared to a reference (REF), is also of interest from a medical viewpoint. These functionalities can be achieved by means of the differential sensors reported in this section, where the main advantageous aspect is sensor cost (e.g., as compared to electrochemical sensors), and real-time functionality. Within this context, the development of low-cost microwave methods able to provide the electrolyte concentration in samples of blood and urine is of high interest. Nevertheless, to avoid using biosamples, and for the sake of easy comparisons, it is usual to estimate sensor performance by considering electrolyte solutions of standard liquid, typically DI water.
The reported differential sensor aimed to the measurement of electrolyte concentration in DI water is the one reported in [66], as it provides (to the best of our knowledge) the finest achieved resolution (0.125 g/L). Such a sensor is based on a pair of CSRR-loaded microstrip lines. The topology and a perspective view, including the fluidic channels, are depicted in Figure 26, whereas Figure 27 shows a photograph of the fabricated device. The output variable in these sensors is the cross-mode transmission coefficient, proportional to the difference between the transmission coefficient of both lines (the REF and the MUT line), namely,
S 21 D C = 1 2 ( S 21 S 43 )
This proportionality is valid provided the lines are uncoupled (otherwise, the cross-mode transmission coefficient is given by S21DC = (1/2) · (S21 + S23S41S43). The input variable is the electrolyte concentration of the MUT sample (provided pure DI water is the REF sample). The cross-mode transmission coefficient obtained after subsequently injecting solutions with different electrolyte content (with DI water in the REF channel) is depicted in Figure 28a. The considered electrolyte precursor is NaCl (which dissociates into anions and cations when dissolved in water). As the electrolyte concentration increases, the magnitude of the cross mode transmission coefficient shifts up. As it can be seen, a concentration as small as 0.125 g/L can be discriminated, as far as the corresponding curve is perfectly differentiated form the one of the REF sample (with 0 g/L of electrolyte concentration, i.e., pure DI water). Figure 28b depicts the dependence of the maximum cross-mode transmission coefficient with the electrolyte concentration. The maximum sensitivity (achieved for small electrolyte concentrations) is 0.034 (g/L)−1, whereas the input dynamic range is at least 60 g/L. From the data points of Figure 28, the following calibration curve, with correlation coefficient of R2 = 0.9996, results
N a C l ( g L ) = 0.41 e ( Δ S 21 D C 4.2 ) + 4.91 · 10 8 e ( Δ S 21 D C 0.65 ) 0.59
This calibration curve can be used to determine unknown concentrations of NaCl in DI water, from the measured cross mode transmission coefficient. Note that other similar sensors for the measurement of electrolyte concentration have been reported [62,63,64,65]. However, the sensor of Figure 27 is the one exhibiting better resolution.

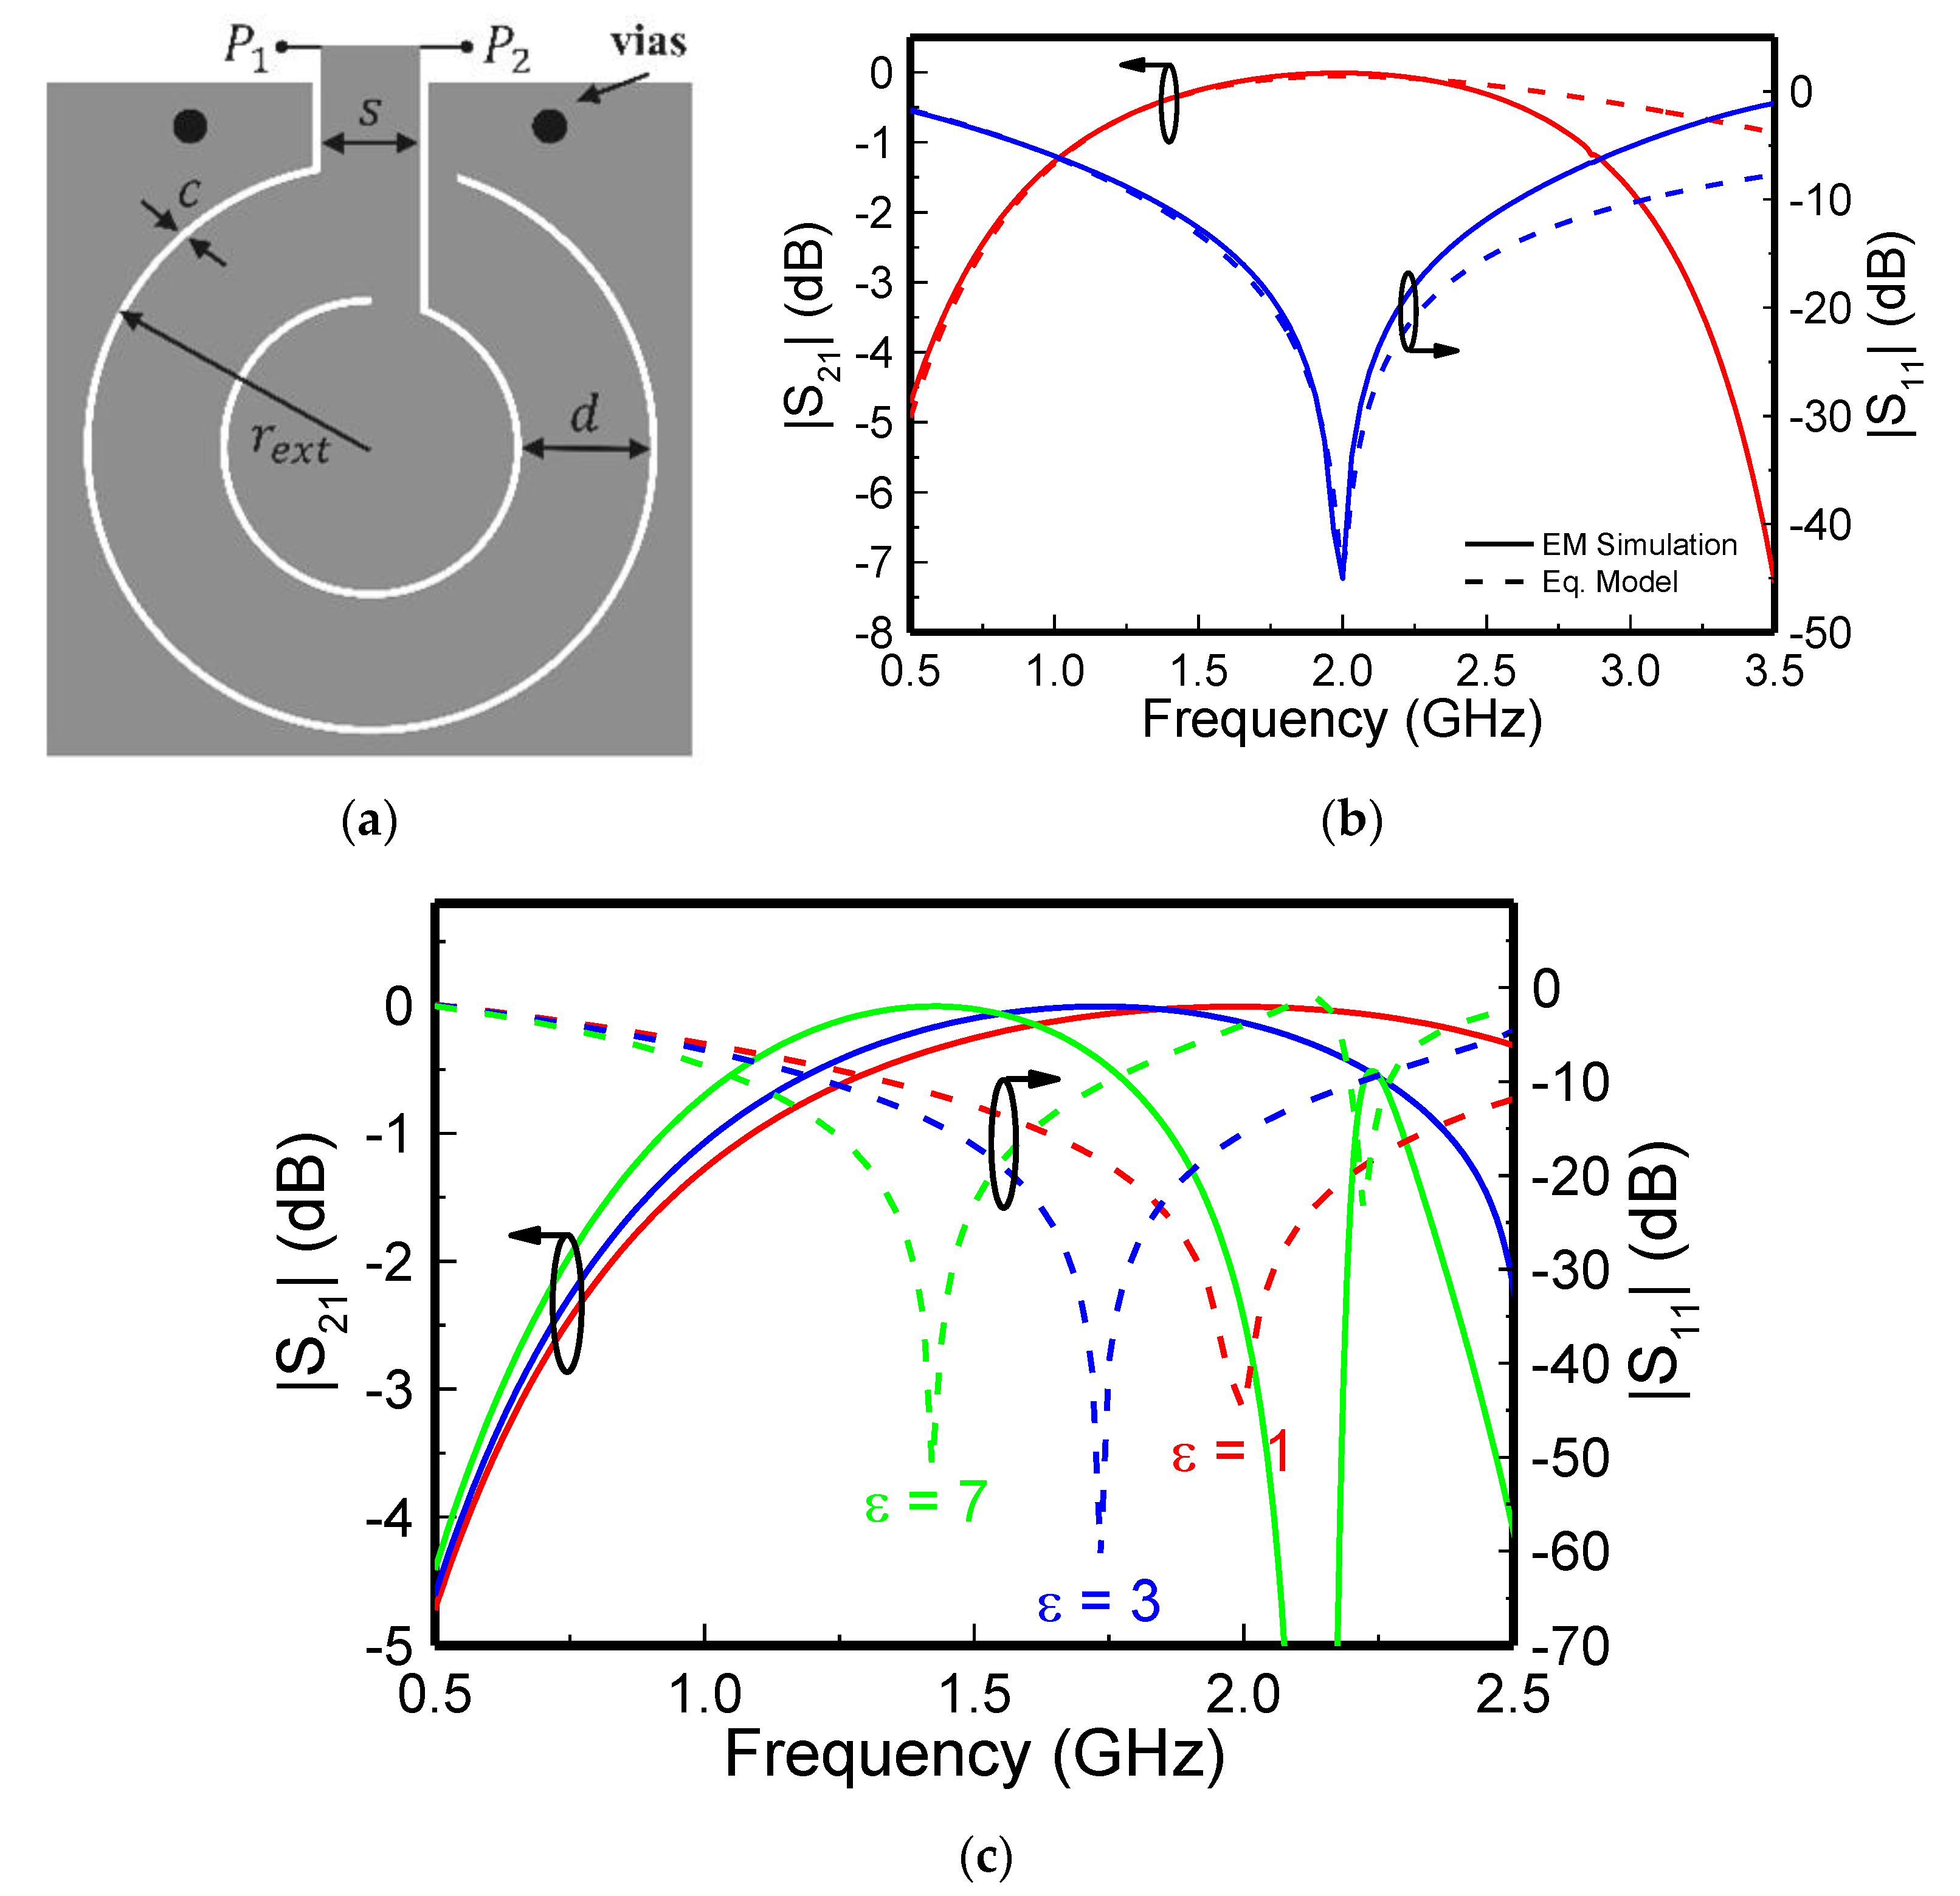
4.4.2. Complex Permittivity Measurement of Liquids

Determination of the complex permittivity of liquids from the measurement of the cross-mode transmission coefficient in differential-mode sensors was first reported in [62], where the sensing elements were OCSRRs. In this subsection, we report a similar sensor, but the sensing elements are DB-DGSs [64]. The device layout and photographs of the top and bottom view (including the fluidic channels) are depicted in Figure 29. The considered reference (REF) liquid is pure DI water, whereas different solutions of isopropanol in DI water constitute the MUT liquids. The measured cross mode transmission coefficients for the different solutions (where the volume fraction of isopropanol is the varying parameter) are depicted in Figure 30a. From this figure, the variation of the maximum of the cross mode transmission coefficient (magnitude) and the variation in the frequency where the maximum appears, as compared to the REF sample, are obtained. The results are depicted in Figure 30b. These are the two variables required to determine the complex permittivity of MUT liquids (consisting of the real and the imaginary parts). From the results of pure DI water, pure isopropanol, and a mixture of 50% isopropanol in DI water, a mathematical model linking the complex permittivity with the above-cited output variables was inferred. Then this model was used to obtain the complex dielectric constant of the different mixtures of isopropanol in DI water from the measured values of the output variable. The results are depicted in Figure 31, where it can be appreciated the good agreement with the results given by the Weiner model.
It is remarkable that the device is able to resolve volume fractions of at least 5%, i.e., better than the volume fraction resolved with the frequency splitting sensor reported in Section 4.3, and identical to the resolution of the differential sensor reported in [62]. It should be highlighted that the sensor of Figure 29 can be also used as single-ended sensor, and, in this case, the sensitivity is excellent, as discussed in [64]. Finally, let us emphasize that, as compared to the sensor reported in [62], in the sensor reported in this subsection, the fluidic channels are placed at the opposite side of the strip lines, thereby being simpler from the fabrication viewpoint.

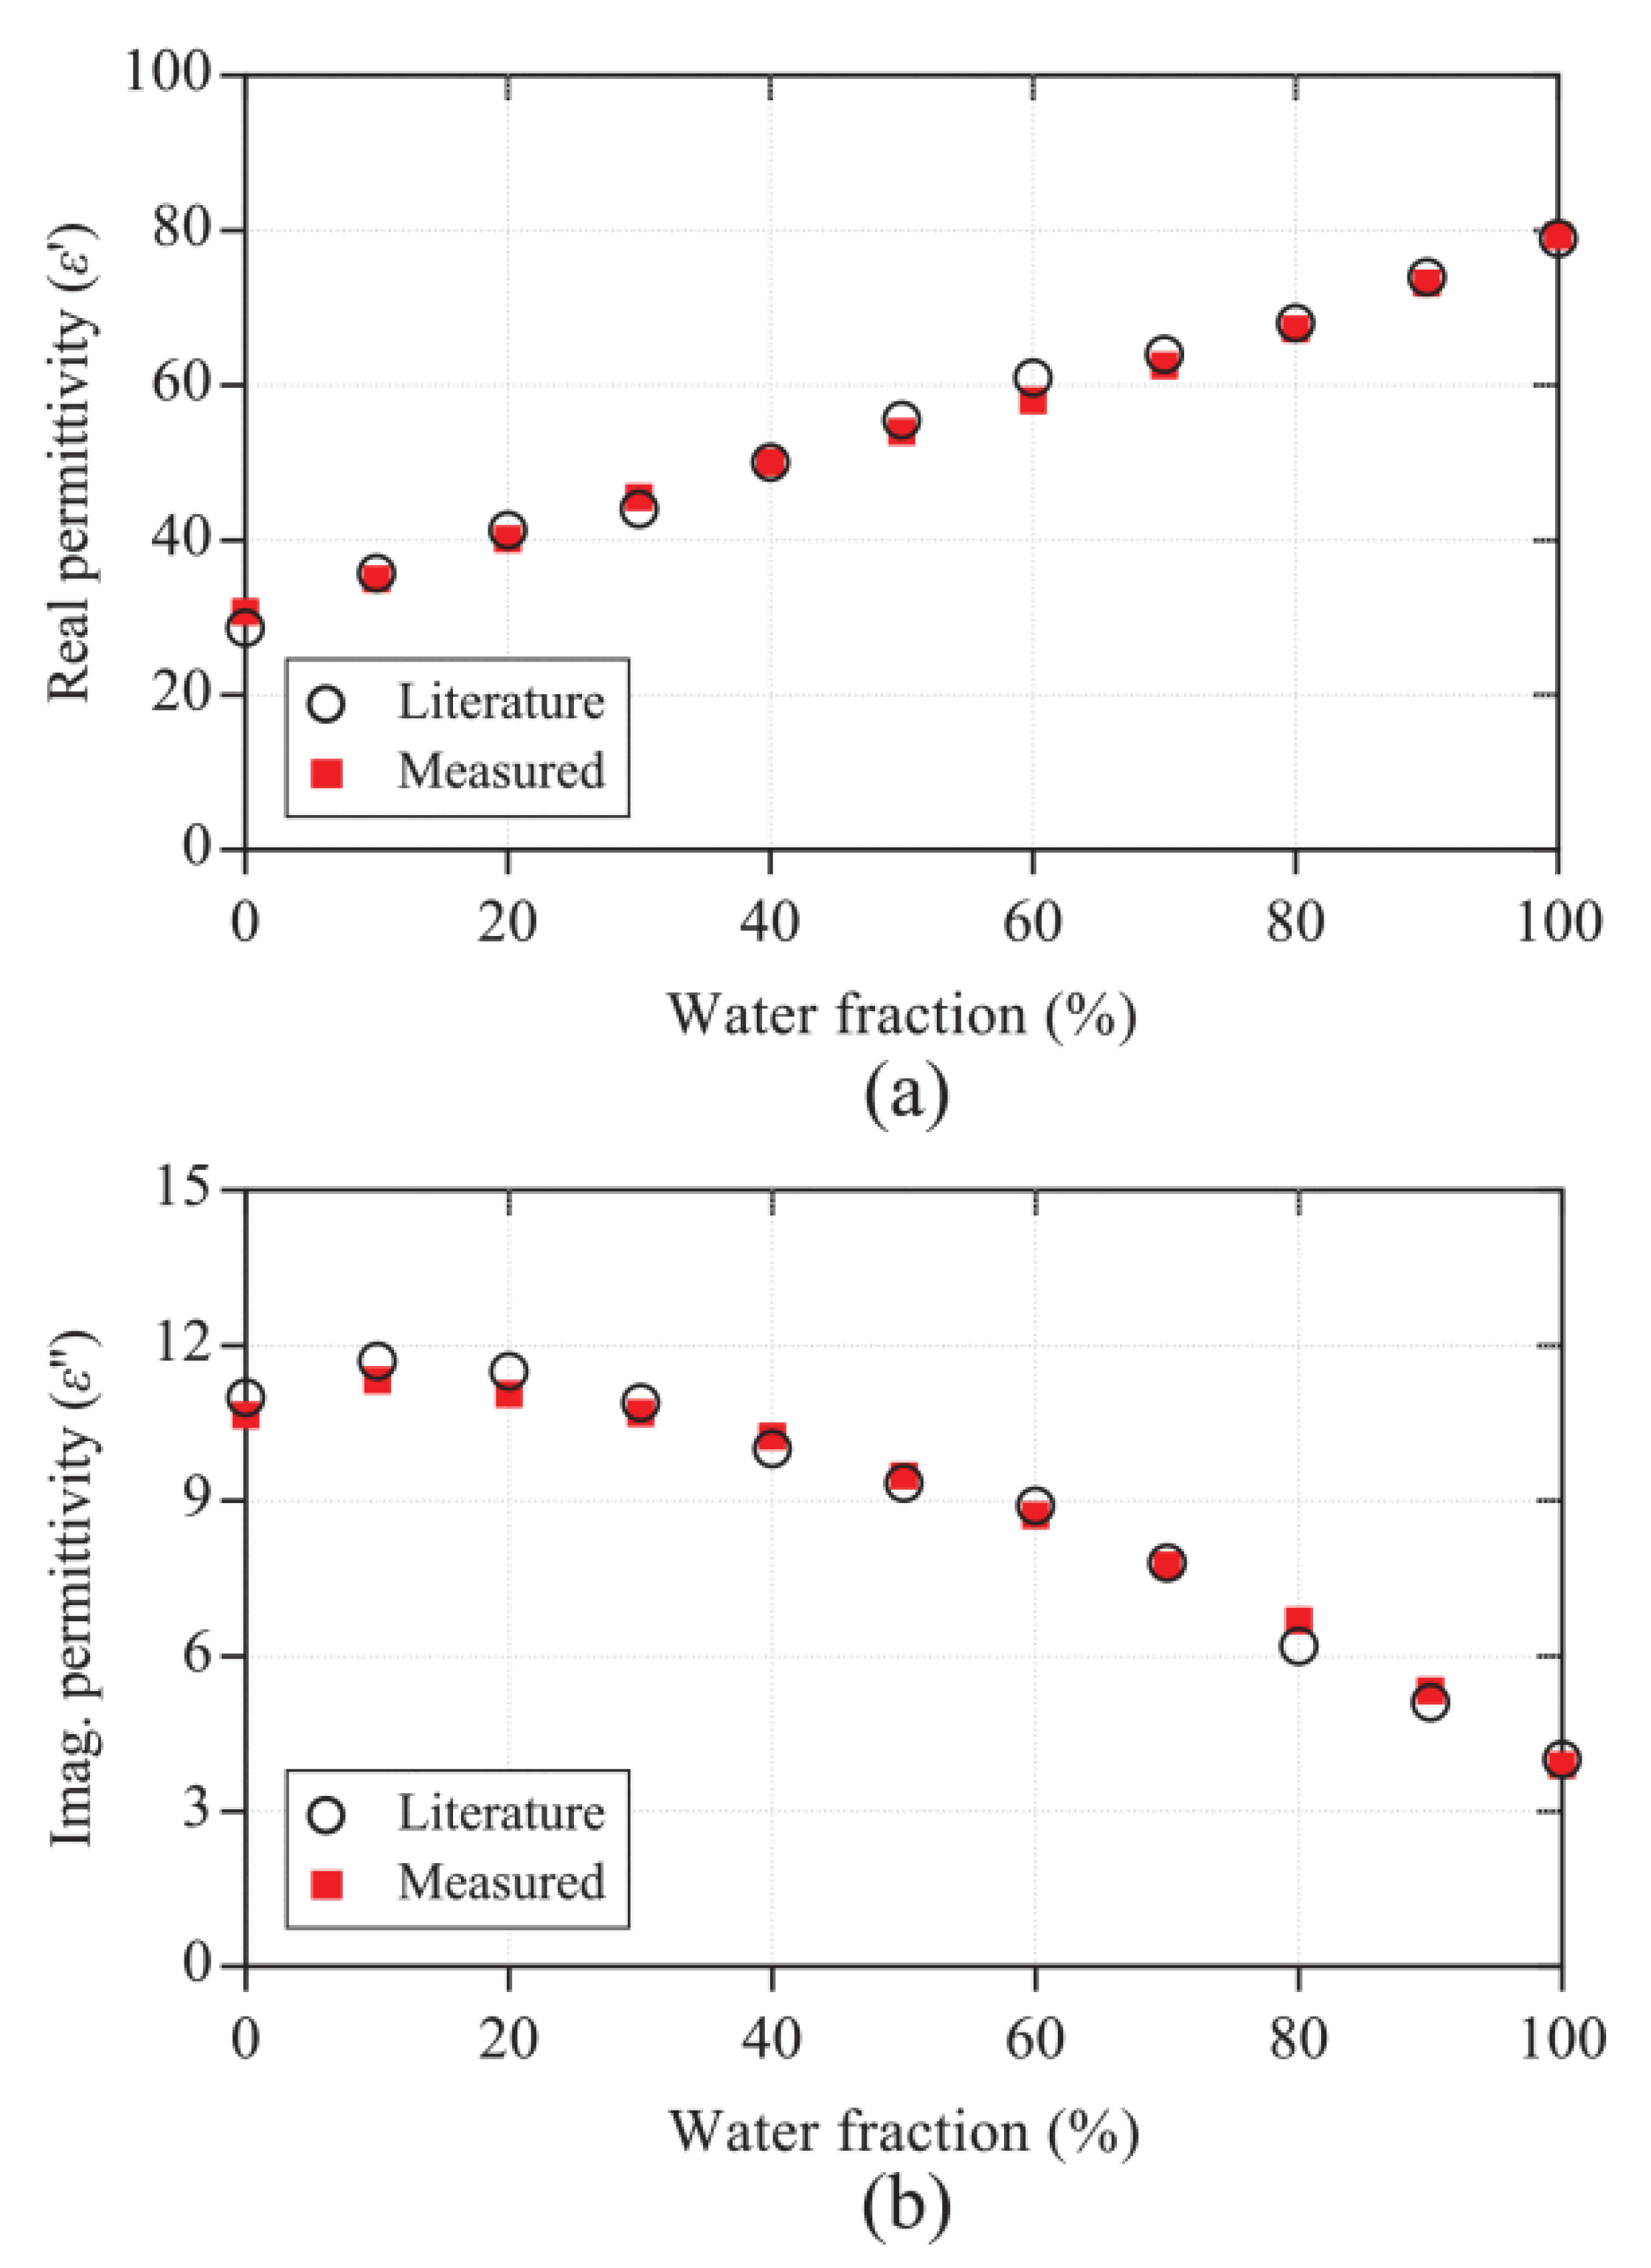
4.4.3. Volume Fraction Determination in Liquid Solutions

Obviously, with the sensors reported in Section 4.4.1 and Section 4.4.2, determination of the volume fraction in liquid solutions is possible. As this measurement involves only one input variable (the volume fraction), a single output variable suffices. In the sensor of Section 4.4.1, devoted to the measurement of electrolyte concentration in water, the output variable was the maximum of the cross mode transmission coefficient. The frequency position of such maximum slightly varies, but it is possible to obtain the value at a fixed frequency, particularly the resonance frequency of the resonant element. In this case, a single-frequency measurement suffices, and, in this case, the cross-mode transmission coefficient can be inferred by means of a reflective-mode differential measurement, involving a simple two-port measurement, as reported in [69]. The sensor device consists of two pairs of grounded OSRR-loaded lines connected to the coupled ports of a rat race coupler by means of two identical transmission line sections. The input signal is injected to the Δ-port, whereas the output port is the Σ-port (see the schematic in Figure 32).
The transmission coefficient at f0, the operating frequency of the rat-race coupler, in the structure of Figure 32 can be expressed as
S 12 = j 2 e j 2 ϕ   ( ρ R E F ρ M U T )
namely, S12 is proportional to the differential reflection coefficient. Therefore, by asymmetrically loading the sensing loads (OSRRs), it follows that differential sensing can be achieved. In Figure 33, the fabricated device, where microfluidic channels have been introduced in order to perform measurements of liquids, is shown. The objective of this sensor was the measurement of volume fraction of isopropanol in DI water. The measured transmission coefficients after subsequently injecting different solutions of isopropanol–water in the MUT channel, with DI water in the REF channel, are depicted in Figure 34. It can be seen that the transmission coefficient at f0 experiences a strong variation as the concentration of isopropanol increases. Moreover, the sensor is able to resolve amounts of isopropanol content as small as 2.5%. Figure 35 depicts the dependence of the transmission coefficient at f0 with the isopropanol concentration, including the calibration curve (with a correlation coefficient of R2 = 0.9987), i.e.,
F v ( % ) = 184.942 e ( S 21 ( d B ) 5.687 ) + 81.618 e ( S 21 ( d B ) 45.449 ) 34.793
From this curve, the concentration of volume fraction of isopropanol can be inferred differentially, by means of a single two-port measurement.
The main differential aspect of the sensor of Figure 33 is the fact that a simple two-port measurement suffices to infer the differential output variable. Other differential sensor involving two-port measurements have been reported [12,68], but, in such sensors, neither resonant element is used, nor is operation in reflection mode considered. Nevertheless, note that in the recently presented sensor of [68], based on the phase difference generated in a pair of meandered lines, high sensitivity (11.52 dB/%) and resolution (1% of volume fraction) is obtained for the measurement of isopropanol content in DI water. This high sensitivity and resolution is in part due to the specific arrangement considered in [68], where a pair of rat race couplers is used (see further details in [68]). It is also important to highlight that in the sensor of Figure 33, a single rat-race coupler is used, because the sensor operates in reflection. By contrast in [68], the sensing device utilizes a pair of rat race couplers, with the consequently penalty in terms of size and cost.

5. Conclusions

In conclusion, a review and recent developments of techniques for the implementation of planar microwave resonant sensors have been reported in this paper. These sensors have been classified in four groups, according to their working principle, i.e., frequency variation sensors, coupling modulation sensors, frequency splitting sensors, and differential-mode sensors. Their advantages and limitations have been pointed out and discussed. We have also presented the most usual electrically small resonant elements utilized for the implementation of sensors, and have provided some hints regarding the convenient resonator topologies for sensitivity and resolution optimization. Finally, we have illustrated the paper with some prototype sensors, mainly including sensors for dielectric characterization, but also sensors for measuring spatial variables.

Funding

This research activity was funded by MINECO-Spain (project TEC2016-75650-R), by Generalitat de Catalunya (project 2017SGR-1159), and by FEDER (European Union) funds.

Acknowledgments

F.M. is in debt to Institució Catalana de Recerca i Estudis Avançats (ICREA) for supporting his work. J.M.E. acknowledges Secreteraria d’Universitats i Recerca (Gen. Cat.) and European Social Fund for the FI grant. P.V. acknowledges the Juan de la Cierva Program for supporting him through Project IJCI-2017-31339. M.G. acknowledges the Universidad Politécnica de Madrid Young Researchers Support Program (VJIDOCUPM18MGB) for its support.

Conflicts of Interest

The authors declare no conflicts of interest.

References

  1. Gennarelli, G.; Romeo, S.; Scarfì, M.R.; Soldovieri, F. A microwave resonant sensor for concentration measurements of liquid solutions. IEEE Sens. J. 2013, 13, 1857–1864. [Google Scholar] [CrossRef]
  2. Jha, A.K.; Akhtar, M.J. A generalized rectangular cavity approach for determination of complex permittivity of materials. IEEE Trans. Instrum. Meas. 2014, 63, 2632–2641. [Google Scholar] [CrossRef]
  3. Wei, P.; Morey, B.; Dyson, T.; McMahon, N.; Hsu, Y.Y.; Gazman, S.; Klinker, L.; Ives, B.; Dowling, K.; Rafferty, C. A Conformal Sensor for Wireless Sweat Level Monitoring. In Proceedings of the IEEE Sensors, Baltimore, MD, USA, 3–6 November 2013. [Google Scholar]
  4. Rodgers, M.M.; Pai, V.M.; Conroy, R.S. Recent advances in wearable sensors for health monitoring. IEEE Sens. J. 2014, 15, 3119–3126. [Google Scholar] [CrossRef]
  5. Galindo-Romera, G.; Herraiz-Martínez, F.J.; Gil, M.; Martínez-Martínez, J.J.; Segovia-Vargas, D. Submersible printed split-ring resonator-based sensor for thin-film detection and permittivity characterization. IEEE Sens. J. 2016, 16, 3587–3596. [Google Scholar] [CrossRef]
  6. Dehe, A.; Krozer, V.; Fricke, K.; Klingbeil, H.; Beilenhoff, K.; Hartnagel, H.L. Integrated microwave power sensor. Electron. Lett. 1995, 31, 2187–2188. [Google Scholar] [CrossRef]
  7. Castillo-León, J.; Svendsen, W.E. Lab-on-a-Chip Devices and Micro-Total Analysis Systems; Springer: New York, NY, USA, 2015; ISBN 978-3-319-08686-6. [Google Scholar]
  8. Grenier, K.; Dubuc, D.; Poleni, P.E.; Kumemura, M.; Toshiyoshi, H.; Fujii, T.; Fujita, H. Integrated broadband microwave and microfluidic sensor dedicated to bioengineering. IEEE Trans. Microw. Theory Tech. 2009, 57, 3246–3253. [Google Scholar] [CrossRef]
  9. Chretiennot, T.; Dubuc, D.; Grenier, K. A microwave and microfluidic planar resonator for efficient and accurate complex permittivity characterization of aqueous solutions. IEEE Trans. Microw. Theory Tech. 2012, 61, 972–978. [Google Scholar] [CrossRef] [Green Version]
  10. Salim, A.; Kim, S.H.; Park, J.Y.; Lim, S. Microfluidic Biosensor Based on Microwave Substrate-Integrated Waveguide Cavity Resonator. J. Sens. 2018, 2018, 1324145. [Google Scholar] [CrossRef] [Green Version]
  11. Zarifi, M.H.; Sadabadi, H.; Hejazi, S.H.; Daneshmand, M.; Sanati-Nezhad, A. Noncontact and nonintrusive microwave-microfluidic flow sensor for energy and biomedical engineering. Sci. Rep. 2018, 8, 139. [Google Scholar] [CrossRef] [Green Version]
  12. Damm, C.; Schüßler, M.; Puentes, M.; Maune, H.; Maasch, M.; Jakoby, R. Artificial transmission lines for high sensitive microwave sensors. In Proceedings of the IEEE Sensors, Christchurch, New Zealand, 25–28 October 2009; pp. 755–758. [Google Scholar]
  13. Ferrández-Pastor, F.; García-Chamizo, J.; Nieto-Hidalgo, M. Electromagnetic differential measuring method: Application in microstrip sensors developing. Sensors 2017, 17, 1650. [Google Scholar] [CrossRef] [Green Version]
  14. Muñoz-Enano, J.; Vélez, P.; Gil, M.; Martín, F. An Analytical Method to Implement High Sensitivity Transmission Line Differential Sensors for Dielectric Constant Measurements. IEEE Sens. J. 2019, 20, 178–184. [Google Scholar] [CrossRef]
  15. Mandel, C.; Kubina, B.; Schüßler, M.; Jakoby, R. Passive chipless wireless sensor for two-dimensional displacement measurement. In Proceedings of the 41st European Microwave Conference, Manchester, UK, 9–14 October 2011; pp. 79–82. [Google Scholar]
  16. Naqui, J.; Durán-Sindreu, M.; Martín, F. Novel sensors based on the symmetry properties of split ring resonators (SRRs). Sensors 2011, 11, 7545–7553. [Google Scholar] [CrossRef] [PubMed] [Green Version]
  17. Naqui, J.; Durán-Sindreu, M.; Martín, F. On the symmetry properties of coplanar waveguides loaded with symmetric resonators: Analysis and potential applications. In Proceedings of the 2012 IEEE/MTT-S International Microwave Symposium Digest, Montreal, QC, Canada, 17–22 June 2012; pp. 1–3. [Google Scholar]
  18. Naqui, J.; Durán-Sindreu, M.; Martín, F. Alignment and position sensors based on split ring resonators. Sensors 2012, 12, 11790–11797. [Google Scholar] [CrossRef] [Green Version]
  19. Naqui, J.; Durán-Sindreu, M.; Martín, F. Transmission lines loaded with bisymmetric resonators and applications. In Proceedings of the IEEE MTT-S International Microwave Symposium Digest, Seattle, WA, USA, 7 June 2013; pp. 1–3. [Google Scholar]
  20. Horestani, A.K.; Fumeaux, C.; Al-Sarawi, S.F.; Abbott, D. Displacement sensor based on diamond-shaped tapered split ring resonator. IEEE Sens. J. 2012, 13, 1153–1160. [Google Scholar] [CrossRef]
  21. Horestani, A.K.; Abbott, D.; Fumeaux, C. Rotation sensor based on horn-shaped split ring resonator. IEEE Sens. J. 2013, 13, 3014–3015. [Google Scholar] [CrossRef]
  22. Naqui, J.; Martı, F. Transmission lines loaded with bisymmetric resonators and their application to angular displacement and velocity sensors. IEEE Trans. Microw. Theory Tech. 2013, 61, 4700–4713. [Google Scholar] [CrossRef]
  23. Ebrahimi, A.; Withayachumnankul, W.; Al-Sarawi, S.F.; Abbott, D. Metamaterial-inspired rotation sensor with wide dynamic range. IEEE Sens. J. 2014, 14, 2609–2614. [Google Scholar] [CrossRef]
  24. Horestani, A.K.; Naqui, J.; Shaterian, Z.; Abbott, D.; Fumeaux, C.; Martín, F. Two-dimensional alignment and displacement sensor based on movable broadside-coupled split ring resonators. Sens. Actuators A 2014, 210, 18–24. [Google Scholar] [CrossRef] [Green Version]
  25. Horestani, A.K.; Naqui, J.; Abbott, D.; Fumeaux, C.; Martín, F. Two-dimensional displacement and alignment sensor based on reflection coefficients of open microstrip lines loaded with split ring resonators. Electron. Lett. 2014, 50, 620–622. [Google Scholar] [CrossRef] [Green Version]
  26. Naqui, J.; Martín, F. Angular displacement and velocity sensors based on electric-LC (ELC) loaded microstrip lines. IEEE Sens. J. 2013, 14, 939–940. [Google Scholar] [CrossRef] [Green Version]
  27. Naqui, J.; Coromina, J.; Karami-Horestani, A.; Fumeaux, C.; Martín, F. Angular displacement and velocity sensors based on coplanar waveguides (CPWs) loaded with S-shaped split ring resonators (S-SRR). Sensors 2015, 15, 9628–9650. [Google Scholar] [CrossRef] [PubMed] [Green Version]
  28. Naqui, J.; Martín, F. Application of broadside-coupled split ring resonator (BC-SRR) loaded transmission lines to the design of rotary encoders for space applications. In Proceedings of the IEEE MTT-S International Microwave Symposium, San Francisco, CA, USA, 22–27 May 2016; pp. 1–4. [Google Scholar]
  29. Mata-Contreras, J.; Herrojo, C.; Martín, F. Application of split ring resonator (SRR) loaded transmission lines to the design of angular displacement and velocity sensors for space applications. IEEE Trans. Microw. Theory Tech. 2017, 65, 4450–4460. [Google Scholar] [CrossRef] [Green Version]
  30. Mata-Contreras, J.; Herrojo, C.; Martín, F. Detecting the rotation direction in contactless angular velocity sensors implemented with rotors loaded with multiple chains of resonators. IEEE Sens. J. 2018, 18, 7055–7065. [Google Scholar] [CrossRef]
  31. Puentes, M. Planar Metamaterial Based Microwave Sensor Arrays for Biomedical Analysis and Treatment; Springer: Heidelberg, Germany, 2014; ISBN 978-3319060408. [Google Scholar]
  32. Ebrahimi, A.; Withayachumnankul, W.; Al-Sarawi, S.; Abbott, D. High-sensitivity metamaterial-inspired sensor for microfluidic dielectric characterization. IEEE Sens. J. 2013, 14, 1345–1351. [Google Scholar] [CrossRef] [Green Version]
  33. Schueler, M.; Mandel, C.; Puentes, M.; Jakoby, R. Metamaterial inspired microwave sensors. IEEE Microw. Mag. 2012, 13, 57–68. [Google Scholar] [CrossRef]
  34. Boybay, M.S.; Ramahi, O.M. Material characterization using complementary split-ring resonators. IEEE Trans. Instrum. Meas. 2012, 61, 3039–3046. [Google Scholar] [CrossRef]
  35. Lee, C.S.; Yang, C.L. Complementary split-ring resonators for measuring dielectric constants and loss tangents. IEEE Microw. Wirel. Compon. Lett. 2014, 24, 563–565. [Google Scholar] [CrossRef]
  36. Yang, C.L.; Lee, C.S.; Chen, K.W.; Chen, K.Z. Noncontact measurement of complex permittivity and thickness by using planar resonators. IEEE Trans. Microw. Theory Tech. 2015, 64, 247–257. [Google Scholar] [CrossRef]
  37. Withayachumnankul, W.; Jaruwongrungsee, K.; Tuantranont, A.; Fumeaux, C.; Abbott, D. Metamaterial-based microfluidic sensor for dielectric characterization. Sens. Actuators A 2013, 189, 233–237. [Google Scholar] [CrossRef] [Green Version]
  38. Salim, A.; Lim, S. Complementary split-ring resonator-loaded microfluidic ethanol chemical sensor. Sensors 2016, 16, 1802. [Google Scholar] [CrossRef] [Green Version]
  39. Su, L.; Mata-Contreras, J.; Vélez, P.; Fernández-Prieto, A.; Martín, F. Analytical method to estimate the complex permittivity of oil samples. Sensors 2018, 18, 984. [Google Scholar] [CrossRef] [PubMed] [Green Version]
  40. Abdolrazzaghi, M.; Zarifi, M.H.; Daneshmand, M. Sensitivity enhancement of split ring resonator based liquid sensors. In Proceedings of the IEEE Sensors, 30 October–3 November 2016. [Google Scholar]
  41. Abdolrazzaghi, M.; Zarifi, M.H.; Pedrycz, W.; Daneshmand, M. Robust ultra-high resolution microwave planar sensor using fuzzy neural network approach. IEEE Sens. J. 2016, 17, 323–332. [Google Scholar] [CrossRef]
  42. Zarifi, M.H.; Daneshmand, M. Monitoring solid particle deposition in lossy medium using planar resonator sensor. IEEE Sens. J. 2017, 17, 7981–7989. [Google Scholar] [CrossRef]
  43. Zarifi, M.H.; Deif, S.; Abdolrazzaghi, M.; Chen, B.; Ramsawak, D.; Amyotte, M.; Vahabisani, N.; Hashisho, Z.; Chen, W.; Daneshmand, M. A microwave ring resonator sensor for early detection of breaches in pipeline coatings. IEEE Trans. Ind. Electron. 2017, 65, 1626–1635. [Google Scholar] [CrossRef]
  44. Abdolrazzaghi, M.; Daneshmand, M.; Iyer, A.K. Strongly enhanced sensitivity in planar microwave sensors based on metamaterial coupling. IEEE Trans. Microw. Theory Tech. 2018, 66, 1843–1855. [Google Scholar] [CrossRef] [Green Version]
  45. Su, L.; Mata-Contreras, J.; Vélez, P.; Martín, F. Estimation of the Complex Permittivity of Liquids by means of Complementary Split Ring Resonator (CSRR) Loaded Transmission Lines. In Proceedings of the IEEE MTT-S International Microwave Workshop Series on Advanced Materials and Processes, Pavia, Italy, 20–22 September 2017; pp. 1–3. [Google Scholar]
  46. Ebrahimi, A.; Scott, J.; Ghorbani, K. Ultrahigh-Sensitivity Microwave Sensor for Microfluidic Complex Permittivity Measurement. IEEE Trans. Microw. Theory Tech. 2019, 67, 4269–4277. [Google Scholar] [CrossRef]
  47. Naqui, J. Symmetry Properties in Transmission Lines Loaded with Electrically Small Resonators: Circuit Modeling and Applications; Springer: Heidelberg, Germany, 2016; ISBN 978-3-319-24566-9. [Google Scholar]
  48. Naqui, J.; Martín, F. Microwave sensors based on symmetry properties of resonator-loaded transmission lines. J. Sens. 2015, 2015, 741853. [Google Scholar] [CrossRef] [Green Version]
  49. Herrojo, C.; Muela, F.J.; Mata-Contreras, J.; Paredes, F.; Martín, F. High-Density Microwave Encoders for Motion Control and Near-Field Chipless-RFID. IEEE Sens. J. 2019, 19, 3673–3682. [Google Scholar] [CrossRef]
  50. Herrojo, C.; Paredes, F.; Martín, F. Double-stub loaded microstrip line reader for very high data density microwave encoders. IEEE Trans. Microw. Theory Tech. 2019, 67, 3527–3536. [Google Scholar] [CrossRef]
  51. Naqui, J.; Damm, C.; Wiens, A.; Jakoby, R.; Su, L.; Martín, F. Transmission lines loaded with pairs of magnetically coupled stepped impedance resonators (SIRs): Modeling and application to microwave sensors. In Proceedings of the IEEE MTT-S International Microwave Symposium, Tampa, FL, USA, 1–6 June 2014; pp. 1–4. [Google Scholar]
  52. Su, L.; Naqui, J.; Mata-Contreras, J.; Martín, F. Modeling metamaterial transmission lines loaded with pairs of coupled split-ring resonators. IEEE Antennas Wirel. Propag. Lett. 2014, 14, 68–71. [Google Scholar] [CrossRef] [Green Version]
  53. Su, L.; Naqui, J.; Mata, J.; Martín, F. Dual-band epsilon-negative (ENG) transmission line metamaterials based on microstrip lines loaded with pairs of coupled complementary split ring resonators (CSRRs): Modeling, analysis and applications. In Proceedings of the 9th International Congress on Advanced Electromagnetic Materials in Microwaves and Optics, Metamaterials 2015, Oxford, UK, 7–12 September 2015; pp. 298–300. [Google Scholar]
  54. Su, L.; Naqui, J.; Mata-Contreras, J.; Vélez, P.; Martín, F. Transmission line metamaterials based on pairs of coupled split ring resonators (SRRs) and complementary split ring resonators (CSRR): A comparison to the light of the lumped element equivalent circuits. In Proceedings of the International Conference on Electromagnetics for Advanced Applications, ICEAA 2015, Torino, Italy, 7–11 September 2015; pp. 891–894. [Google Scholar]
  55. Su, L.; Naqui, J.; Mata-Contreras, J.; Martín, F. Modeling and applications of metamaterial transmission lines loaded with pairs of coupled complementary split-ring resonators (CSRRs). IEEE Antennas Wirel. Propag. Lett. 2015, 15, 154–157. [Google Scholar] [CrossRef] [Green Version]
  56. Naqui, J.; Damm, C.; Wiens, A.; Jakoby, R.; Su, L.; Mata-Contreras, J.; Martín, F. Transmission lines loaded with pairs of stepped impedance resonators: Modeling and application to differential permittivity measurements. IEEE Trans. Microw. Theory Tech. 2016, 64, 3864–3877. [Google Scholar] [CrossRef] [Green Version]
  57. Su, L.; Mata-Contreras, J.; Vélez, P.; Martín, F. Splitter/combiner microstrip sections loaded with pairs of complementary split ring resonators (CSRRs): Modeling and optimization for differential sensing applications. IEEE Trans. Microw. Theory Tech. 2016, 64, 4362–4370. [Google Scholar] [CrossRef]
  58. Vélez, P.; Su, L.; Grenier, K.; Mata-Contreras, J.; Dubuc, D.; Martín, F. Microwave microfluidic sensor based on a microstrip splitter/combiner configuration and split ring resonators (SRRs) for dielectric characterization of liquids. IEEE Sens. J. 2017, 17, 6589–6598. [Google Scholar] [CrossRef] [Green Version]
  59. Ebrahimi, A.; Scott, J.; Ghorbani, K. Differential sensors using microstrip lines loaded with two split-ring resonators. IEEE Sens. J. 2018, 18, 5786–5793. [Google Scholar] [CrossRef]
  60. Gil, M.; Vélez, P.; Aznar-Ballesta, F.; Muñoz-Enano, J.; Martín, F. Differential Sensor based on Electro-Inductive Wave (EIW) Transmission Lines for Dielectric Constant Measurements and Defect Detection. IEEE Trans. Antennas Propag. 2020, 68, 1876–1886. [Google Scholar] [CrossRef]
  61. Shi, D.; Guo, J.; Chen, L.; Xia, C.; Yu, Z.; Ai, Y.; Li, C.M.; Kang, Y.; Wang, Z. Differential microfluidic sensor on printed circuit board for biological cells analysis. Electrophoresis 2015, 36, 1854–1858. [Google Scholar] [CrossRef]
  62. Velez, P.; Grenier, K.; Mata-Contreras, J.; Dubuc, D.; Martín, F. Highly-sensitive microwave sensors based on open complementary split ring resonators (OCSRRs) for dielectric characterization and solute concentration measurement in liquids. IEEE Access 2018, 6, 48324–48338. [Google Scholar] [CrossRef]
  63. Vélez, P.; Muñoz-Enano, J.; Grenier, K.; Mata-Contreras, J.; Dubuc, D.; Martín, F. Split Ring Resonator-Based Microwave Fluidic Sensors for Electrolyte Concentration Measurements. IEEE Sens. J. 2018, 19, 2562–2569. [Google Scholar] [CrossRef]
  64. Vélez, P.; Muñoz-Enano, J.; Gil, M.; Mata-Contreras, J.; Martín, F. Differential Microfluidic Sensors Based on Dumbbell-Shaped Defect Ground Structures in Microstrip Technology: Analysis, Optimization, and Applications. Sensors 2019, 19, 3189. [Google Scholar] [CrossRef] [Green Version]
  65. Muñoz-Enano, J.; Vélez, P.; Gil, M.; Mata-Contreras, J.; Martín, F. Microwave comparator based on defect ground structures. In Proceedings of the European Microwave Conference in Central Europe, Prague, Czech Republic, 13–15 May 2019. [Google Scholar]
  66. Vélez, P.; Muñoz-Enano, J.; Martín, F. Electrolyte concentration measurements in DI water with 0.125 g/L resolution by means of CSRR-based structures. In Proceedings of the 49th European Microwave Conference, Paris, France, 1–3 October 2019. [Google Scholar]
  67. Muñoz-Enano, J.; Vélez, P.; Gil, M.; Mata-Contreras, J.; Grenier, K.; Dubuc, D.; Martín, F. Microstrip Lines Loaded with Metamaterial-Inspired Resonators for Microwave Sensors/Comparators with Optimized Sensitivity. In Proceedings of the 49th European Microwave Conference, Paris, France, 1–3 October 2019; pp. 754–757. [Google Scholar]
  68. Muñoz-Enano, J.; Vélez, P.; Gil, M.; Martín, F. Differential-mode to common-mode conversion detector based on rat-race couplers: Analysis and application to microwave sensors and comparators. IEEE Trans. Microw. Theory Tech. 2020, 68, 1312–1325. [Google Scholar] [CrossRef]
  69. Muñoz-Enano, J.; Vélez, P.; Gil, M.; Martín, F. Microfluidic reflective-mode differential sensor based on open split ring resonators (OSRRs). Int. J. Microw. Wirel. Technol. 2020. to be published. [Google Scholar]
  70. Ebrahimi, A.; Scott, J.; Ghorbani, K. Transmission Lines Terminated with LC Resonators for Differential Permittivity Sensing. IEEE Microw. Wirel. Compon. Lett. 2018, 28, 1149–1151. [Google Scholar] [CrossRef]
  71. Ebrahimi, A.; Scott, J.; Ghorbani, K. Microwave reflective biosensor for glucose level detection in aqueous solutions. Sens. Actuators A 2019, 301, 111662. [Google Scholar] [CrossRef]
  72. Vélez, P.; Muñoz-Enano, J.; Martín, F. Differential Sensing Based on Quasi-Microstrip Mode to Slot-Mode Conversion. IEEE Microw. Wirel. Compon. Lett. 2019, 29, 690–692. [Google Scholar] [CrossRef]
  73. Marqués, R.; Martin, F.; Sorolla, M. Metamaterials with Negative Parameters: Theory, Design, and Microwave Applications; John Wiley & Sons: Hoboken, NJ, USA, 2013; ISBN 978-0-471-74582-2. [Google Scholar]
  74. Martín, F. Artificial Transmission Lines for RF and Microwave Applications; John Wiley & Sons: Hoboken, NJ, USA, 2015; ISBN 9781119058403. [Google Scholar]
  75. Durán-Sindreu, M.; Naqui, J.; Paredes, F.; Bonache, J.; Martín, F. Electrically small resonators for planar metamaterial, microwave circuit and antenna design: A comparative analysis. Appl. Sci. 2012, 2, 375–395. [Google Scholar] [CrossRef] [Green Version]
  76. Makimoto, M.; Yamashita, S. Compact bandpass filters using stepped impedance resonators. Proc. IEEE 1979, 67, 16–19. [Google Scholar] [CrossRef]
  77. Naqui, J.; Durán-Sindreu, M.; Bonache, J.; Martín, F. Implementation of shunt-connected series resonators through stepped-impedance shunt stubs: Analysis and limitations. IET Microw. Antennas Propag. 2011, 5, 1336–1342. [Google Scholar] [CrossRef]
  78. Pendry, J.B.; Holden, A.J.; Robbins, D.J.; Stewart, W.J. Magnetism from conductors and enhanced nonlinear phenomena. IEEE Trans. Microw. Theory Tech. 1999, 47, 2075–2084. [Google Scholar] [CrossRef] [Green Version]
  79. Martel, J.; Marqués, R.; Falcone, F.; Baena, J.D.; Medina, F.; Martín, F.; Sorolla, M. A new LC series element for compact bandpass filter design. IEEE Microw. Wirel. Compon. Lett. 2004, 14, 210–212. [Google Scholar] [CrossRef]
  80. Schurig, D.; Mock, J.J.; Smith, D.R. Electric-field-coupled resonators for negative permittivity metamaterials. Appl. Phys. Lett. 2006, 88, 041109. [Google Scholar] [CrossRef] [Green Version]
  81. Falcone, F.; Lopetegi, T.; Baena, J.D.; Marqués, R.; Martín, F.; Sorolla, M. Effective negative-ε stop-band microstrip lines based on complementary split ring resonators. IEEE Microw. Wirel. Compon. Lett. 2004, 14, 280–282. [Google Scholar] [CrossRef]
  82. Velez, A.; Aznar, F.; Bonache, J.; Velazquez-Ahumada, M.C.; Martel, J.; Martin, F. Open complementary split ring resonators (OCSRRs) and their application to wideband CPW band pass filters. IEEE Microw. Wirel. Compon. Lett. 2009, 19, 197–199. [Google Scholar] [CrossRef]
  83. Ahn, D.; Park, J.S.; Kim, C.S.; Kim, J.; Qian, Y.; Itoh, T. A design of the low-pass filter using the novel microstrip defected ground structure. IEEE Trans. Microw. Theory Tech. 2001, 49, 86–93. [Google Scholar] [CrossRef]
  84. Naqui, J.; Durán-Sindreu, M.; Martín, F. Differential and single-ended microstrip lines loaded with slotted magnetic-LC resonators. Int. J. Antennas Propag. 2013, 2013. [Google Scholar] [CrossRef]
  85. Chen, H.; Ran, L.; Huangfu, J.; Zhang, X.; Chen, K.; Grzegorczyk, T.M.; Au Kong, J. Left-handed materials composed of only S-shaped resonators. Physical Review E 2004, 70, 057605. [Google Scholar] [CrossRef] [Green Version]
  86. Baena, J.D.; Marqués, R.; Medina, F.; Martel, J. Artificial magnetic metamaterial design by using spiral resonators. Phys. Rev. B 2004, 69, 014402. [Google Scholar] [CrossRef]
  87. Marqués, R.; Baena, J.D.; Martel, J.; Medina, F.; Falcone, F.; Sorolla, M.; Martín, F. Novel small resonant electromagnetic particles for metamaterial and filter design. In Proceedings of the Electromagnetics in Advanced Applications, Torino, Italy, 8–12 September 2003; pp. 439–442. [Google Scholar]
  88. Marqués, R.; Medina, F.; Rafii-El-Idrissi, R. Role of bianisotropy in negative permeability and left-handed metamaterials. Phys. Rev. B 2002, 65, 144440. [Google Scholar] [CrossRef]
  89. Vélez, A.; Aznar, F.; Durán-Sindreu, M.; Bonache, J.; Martin, F. Open complementary split ring resonators (OCSRRs): The missing particle. In Proceedings of the Metamaterials 2009, London, UK, 30 August–4 September 2009. [Google Scholar]
  90. Muñoz-Enano, J.; Vélez, P.; Herrojo, C.; Gil, M.; Martín, F. On the Sensitivity of Microwave Sensors based on Slot Resonators and Frequency Variation. In Proceedings of the International Conference on Electromagnetics in Advanced Applications (ICEAA), Granada, Spain, 9–13 September 2019; pp. 0112–0115. [Google Scholar]
  91. Bao, J.Z.; Swicord, M.L.; Davis, C.C. Microwave dielectric characterization of binary mixtures of water, methanol, and ethanol. J. Chem. Phys. 1996, 104, 4441–4450. [Google Scholar] [CrossRef]
  92. Eitel, E. Basics of rotary encoders: Overview and new technologies. Mach. Des. Mag. 2014, 7. [Google Scholar]
  93. McMillan, G.K.; Considine, D.M. Process Instruments and Controls Handbook, 5th ed.; McGraw Hill: New York, NY, USA, 1999; ISBN 978-0-07-012582-7. [Google Scholar]
  94. Li, X.; Qi, J.; Zhang, Q.; Zhang, Y. Bias-tunable dual-mode ultraviolet photodetectors for photoelectric tachometer. Appl. Phys. Lett. 2014, 104, 041108. [Google Scholar] [CrossRef]
  95. Hogan, M.A. Pearson Reviews & Rationales: Fluids, Electrolytes, and Acid-Base Balance with Nursing Reviews & Rationales, 4th ed.; Pearson: London, UK, 2017; ISBN 978-0134457710. [Google Scholar]
Figure 1. Typical topology and working principle of the considered planar microwave resonant sensors. (a) Frequency variation; (b) coupling modulation; (c) frequency splitting; (d) differential-mode.
Applsci 10 02615 g001
Figure 2. Typical topology of some electrically small metallic resonators useful for sensing. (a) Step impedance resonator (SIR), (b) step impedance shunt stub (SISS), (c) split-ring resonator (SRR), (d) open split-ring resonator (OSRR), (e) electric-LC (ELC).
Applsci 10 02615 g002
Figure 3. Typical topology of some electrically small slot resonators useful for sensing. (a) Complementary split-ring resonator (CSRR), (b) open complementary split-ring resonator (OCSRR), (c) dumbbell-shaped DGS (DB-DGS), (d) magnetic-LC (MLC).
Applsci 10 02615 g003
Figure 4. Circuit models of the CSRR- (a), OCSRR- (b), and DB-DGS-loaded line (c).
Applsci 10 02615 g004
Figure 5. Topology of the designed OCSRR-loaded microstrip line (a), frequency response of the structure inferred from circuit and electromagnetic simulation (b), and simulated frequency response for various MUTs with the indicated dielectric constants (c). Dimensions (in mm) are rext = 4, c = 0.1, d = 1.8 and s = 1.4. The considered substrate is the Rogers RO4003C with dielectric constant εr = 3.55 and thickness h = 1.524 mm. Circuit parameters are Cc = 1.23 pF and L = 5.1484 nH. The ports in panel (a) can be separated (if needed for connector soldering) by merely adding 50 Ω access lines.
Applsci 10 02615 g005
Figure 6. Relative sensitivity of the OCSRR-loaded line, as compared to those reported in [90].
Applsci 10 02615 g006
Figure 7. Topology of the SISS-based frequency variation sensor reported in [46], including the top (a) and bottom (b) views, and lumped element equivalent circuit model (c). From [46], reprinted with permission.
Applsci 10 02615 g007
Figure 8. Schematic views (a) and photographs (b) of the fabricated sensor, including the top (left) and bottom (right) views. From [46], reprinted with permission.
Applsci 10 02615 g008
Figure 9. Measured frequency response of the sensor for various water–ethanol solutions (a) and representation of the resonance frequency and notch magnitude as a function of the water concentration (b). From [46], reprinted with permission. In panel (a), the step variation of water content is 10%.
Applsci 10 02615 g009
Figure 10. Measured frequency response of the sensor for various water-methanol solutions (a) and representation of the resonance frequency and notch magnitude as a function of the water concentration (b). From [46], reprinted with permission. In panel (a), the step variation of water content is 10%.
Applsci 10 02615 g010
Figure 11. Real (a) and imaginary (b) part of the complex dielectric constant of water–methanol solutions as a function of the water content, inferred from the data of Figure 10 and the mathematical model developed in [46]. From [46], reprinted with permission.
Applsci 10 02615 g011
Figure 12. Illustration of symmetry disruption by means of square-shaped inclusions in a CPW loaded with a SRR. From [47], reprinted with permission.
Applsci 10 02615 g012
Figure 13. Set-up for the angular displacement and velocity measurement. (a) Cross section view, (b) photographs of the rotor (circular ELC resonator) and stator (CPW), and (c) photograph of the step-motor providing rotor motion and zoom view of the stator-rotor. From [22], reprinted with permission.
Applsci 10 02615 g013
Figure 14. Transmission coefficient at f0 as a function of the rotation angle. From [22], reprinted with permission.
Applsci 10 02615 g014
Figure 15. Sketch of the system for the measurement of angular velocities based on an AM modulation scheme.
Applsci 10 02615 g015
Figure 16. Measured envelope functions. (a) 1 rpm; (b) 50 rpm. From [22], reprinted with permission.
Applsci 10 02615 g016
Figure 17. Sketch of the rotation sensor based on the edge configuration. From [29], reprinted with permission.
Applsci 10 02615 g017
Figure 18. Sketch and working principle of the rotation sensor based on the edge configuration with two velocity chains and one direction detection chain. From [30], reprinted with permission.
Applsci 10 02615 g018
Figure 19. Photograph of the rotor (a), experimental set-up (b), and stator (c). From [30], reprinted with permission.
Applsci 10 02615 g019
Figure 20. Envelope functions providing the angular velocity (a) and motion direction (b). The nominal rotary speed is 60 rpm. From [30], reprinted with permission.
Applsci 10 02615 g020
Figure 21. Illustration of frequency splitting through symmetry imbalance (considering square-shaped inclusions) in a CPW symmetrically loaded with a pair SRRs. From [47], reprinted with permission.
Applsci 10 02615 g021
Figure 22. Layout (a) and perspective view (b) of the designed frequency-splitting sensor. From [58], reprinted with permission.
Applsci 10 02615 g022
Figure 23. Measured responses of the sensor for different combinations of dielectric loads in the channels. From [58], reprinted with permission.
Applsci 10 02615 g023
Figure 24. Measured frequency response of the sensor for various water–ethanol solutions (a) and representation of the resonance frequency splitting and notch magnitude difference, as a function of the ethanol concentration (b). From [58], reprinted with permission.
Applsci 10 02615 g024
Figure 25. Real (a) and imaginary (b) part of the complex dielectric constant of water–ethanol solutions as a function of the ethanol content, inferred from the data of Figure 24 and the mathematical model developed in [58]. From [58], reprinted with permission.
Applsci 10 02615 g025
Figure 26. Topology (top view (a) and bottom view (b)) and 3D view (c) of the proposed CSRR-based sensor. From [66], reprinted with permission.
Applsci 10 02615 g026
Figure 27. Perspective photographs of the CSRR-based differential sensor. (a) Top; (b) bottom. From [66], reprinted with permission.
Applsci 10 02615 g027
Figure 28. Measured cross-mode transmission coefficient for different NaCl concentrations (a) and dependence of the maximum incremental cross-mode transmission coefficient on the NaCl concentration (b). The calibration curve in (b) is included. From [66], reprinted with permission.
Applsci 10 02615 g028
Figure 29. Layout (a) and photograph (top view (b) and 3D view (c)) of the DB-DGS-based sensor. From [64], reprinted with permission.
Applsci 10 02615 g029
Figure 30. Measured cross-mode transmission coefficients for the different solutions of isopropanol in DI water (a) and representation of the output variables as a function of the isopropanol concentration (b). From [64], reprinted with permission.
Applsci 10 02615 g030
Figure 31. Real (a) and imaginary (b) parts of the complex dielectric constant for the different solutions of isopropanol in DI water. From [64], reprinted with permission.
Applsci 10 02615 g031
Figure 32. Schematic of the reflective-mode differential sensor based in OSRRs. From [69], reprinted with permission.
Applsci 10 02615 g032
Figure 33. Top view of the sensor topology (a) and perspective view of the whole fabricated sensor (b). From [69], reprinted with permission.
Applsci 10 02615 g033
Figure 34. Frequency response of the sensing structure for different concentrations of isopropanol in DI water injected in the MUT channel, and pure DI water injected in the REF channel. From [69], reprinted with permission.
Applsci 10 02615 g034
Figure 35. Variation of the transmission coefficient measured at f0 (1.77GHz) with the isopropanol content, and calibration curve. From [69], reprinted with permission.
Applsci 10 02615 g035

