Quantitative Phase Dynamics of Cancer Cell Populations Affected by Blue Light

 ,
,  ,
,  ,
, 
Abstract
Featured Application
Abstract
1. Introduction
2. Materials and Methods
2.1. Chemical and Biochemical Reagents
2.2. Cell Lines
2.3. Cell Cultivation
2.4. QPI and Holographic Microscopy and Fluorescence Setting
2.5. Image Analysis and Statistics
3. Results
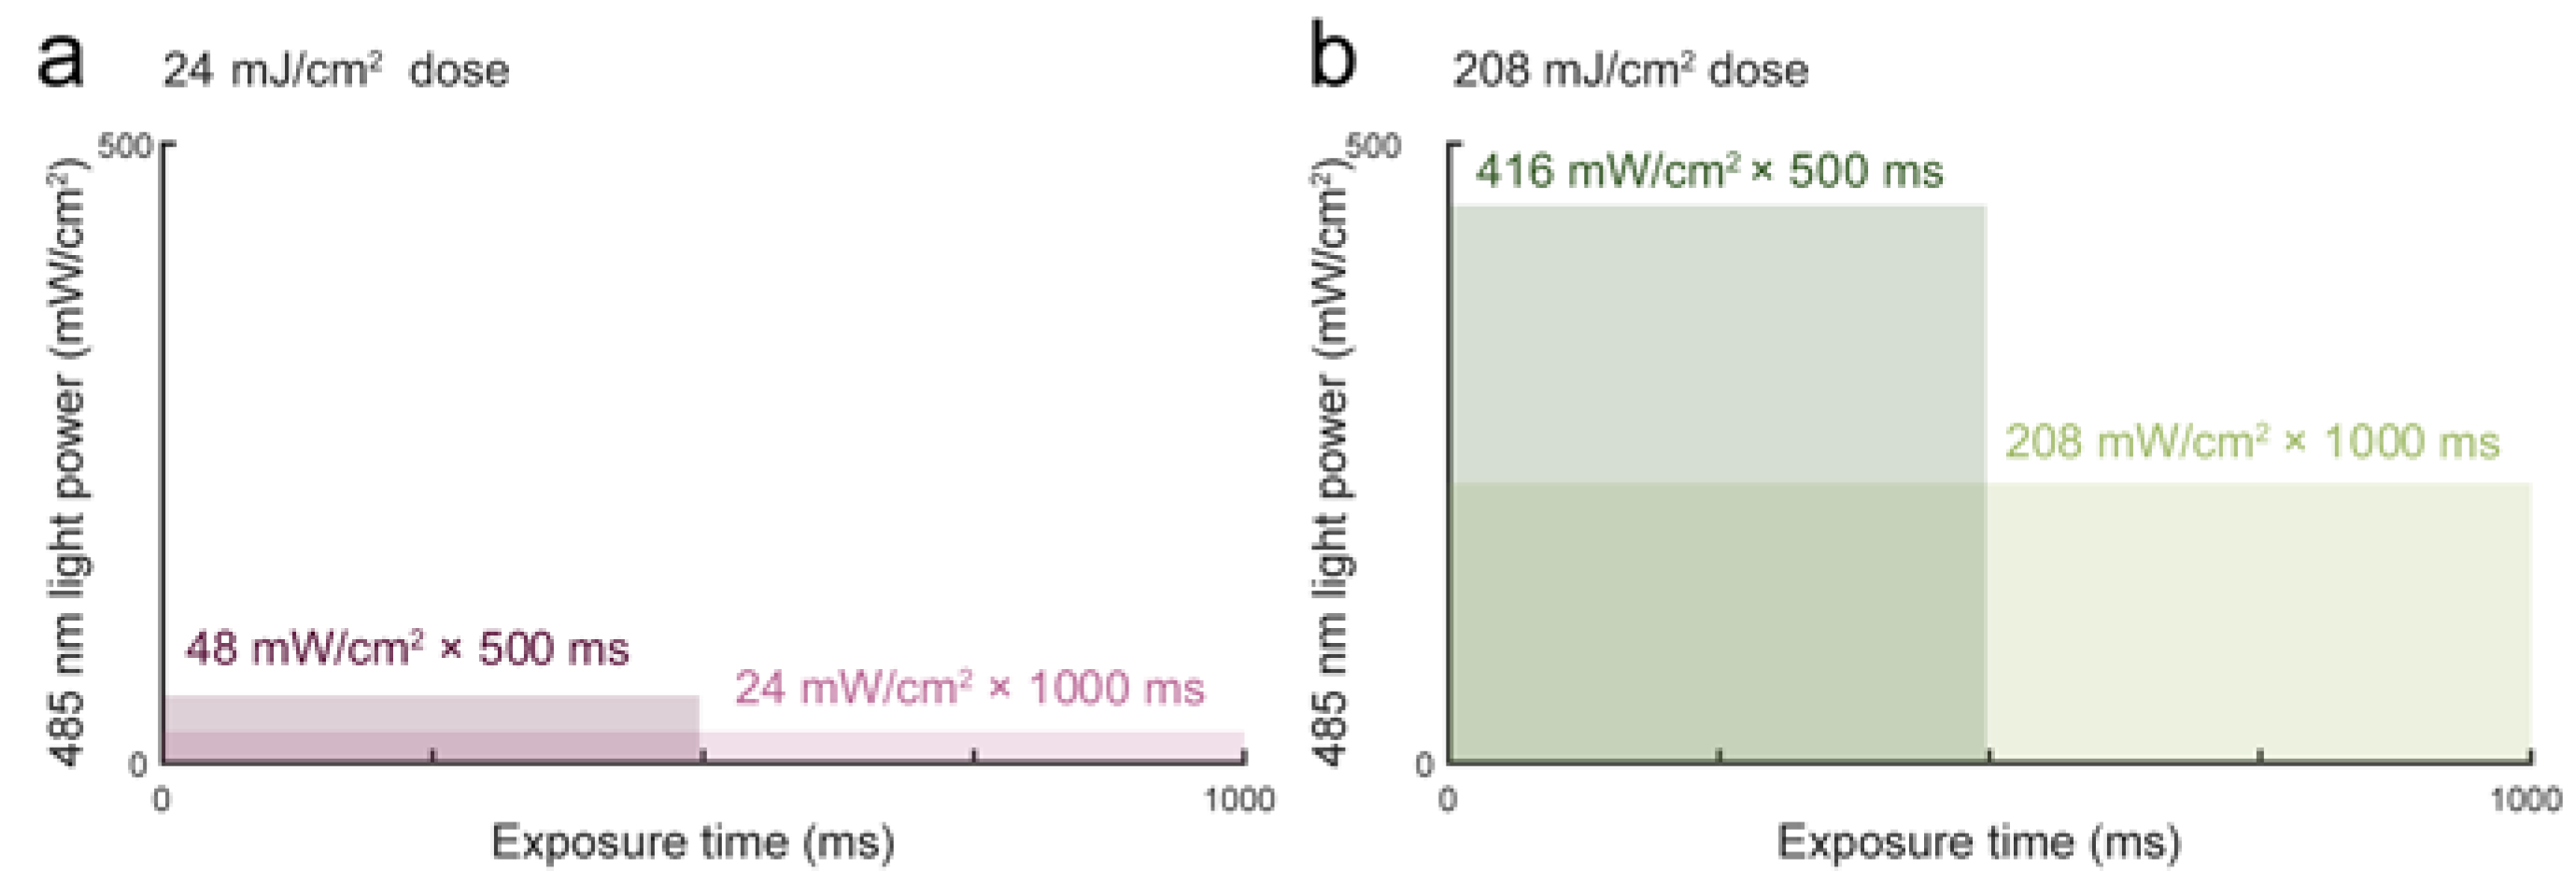
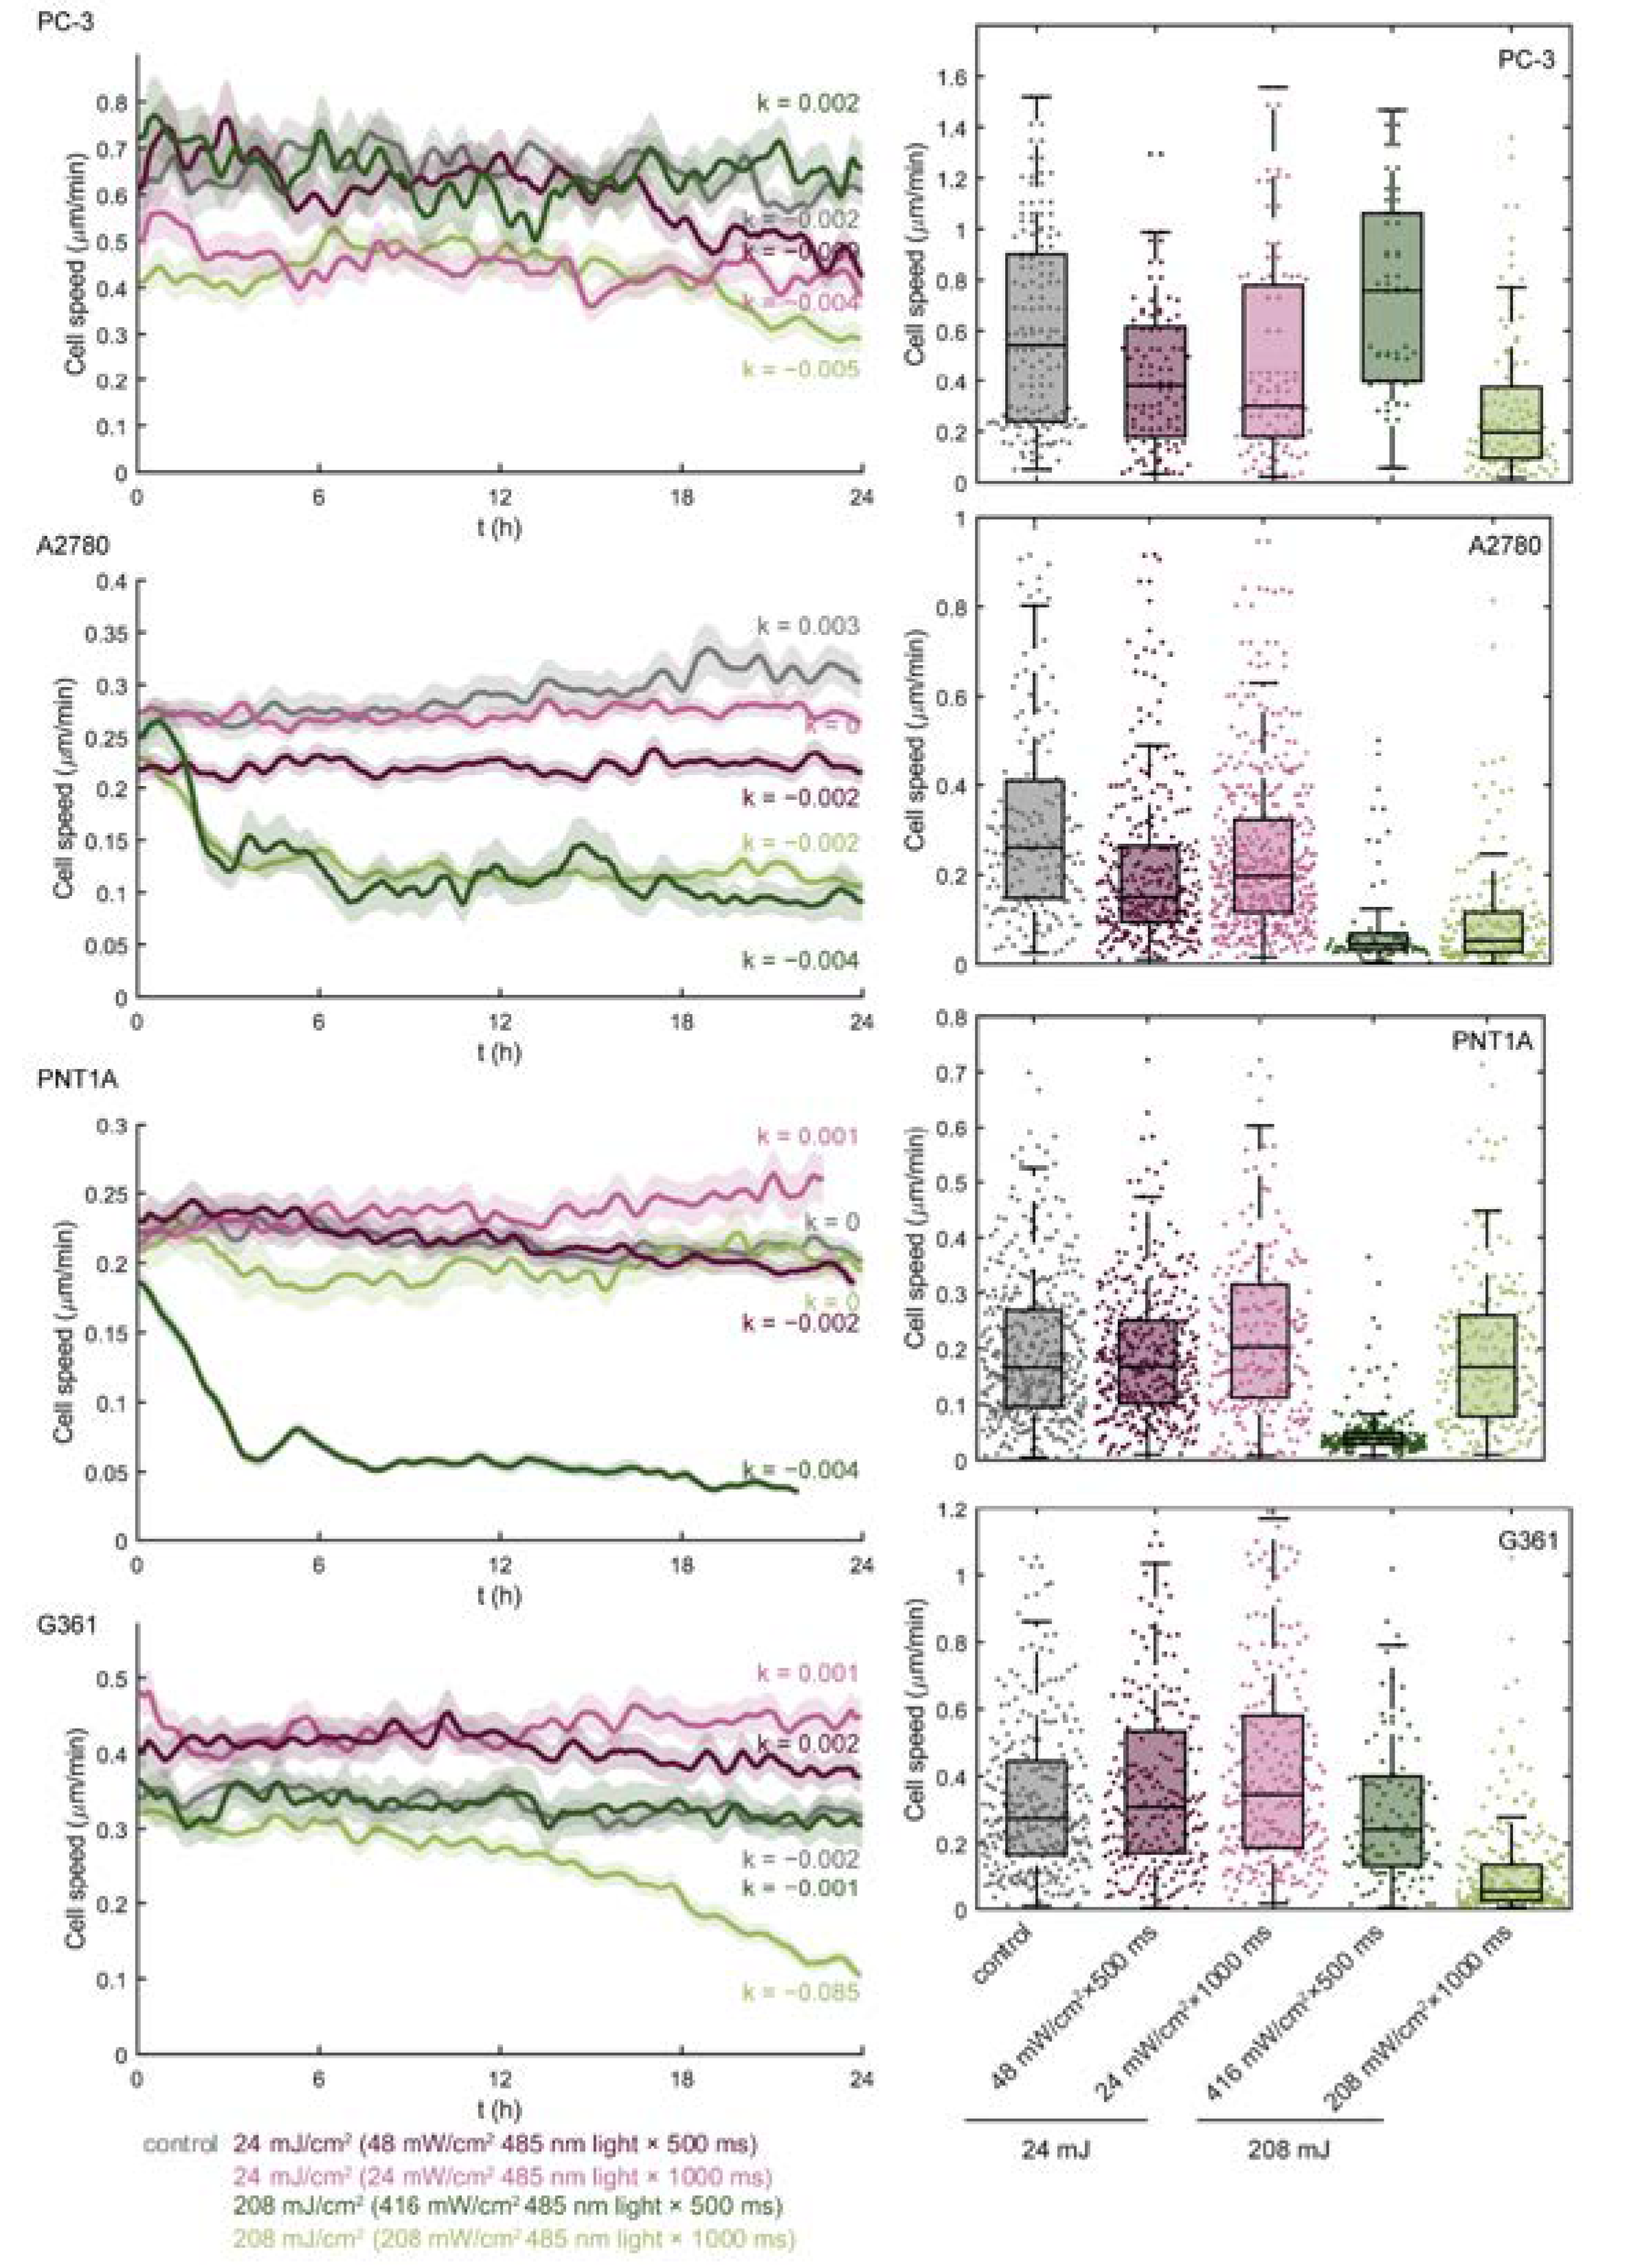
3.1. Blue Light Dose 208 mJ/cm2, 1000 ms Affects Malignant Cell Motility and Does Not Change Motility of Benign Cell Line PNT1A
3.2. Blue Light Doses 208 mJ/cm2, 1000 ms Significantly Decrease Proliferation Activity in All Tested Cell Lines
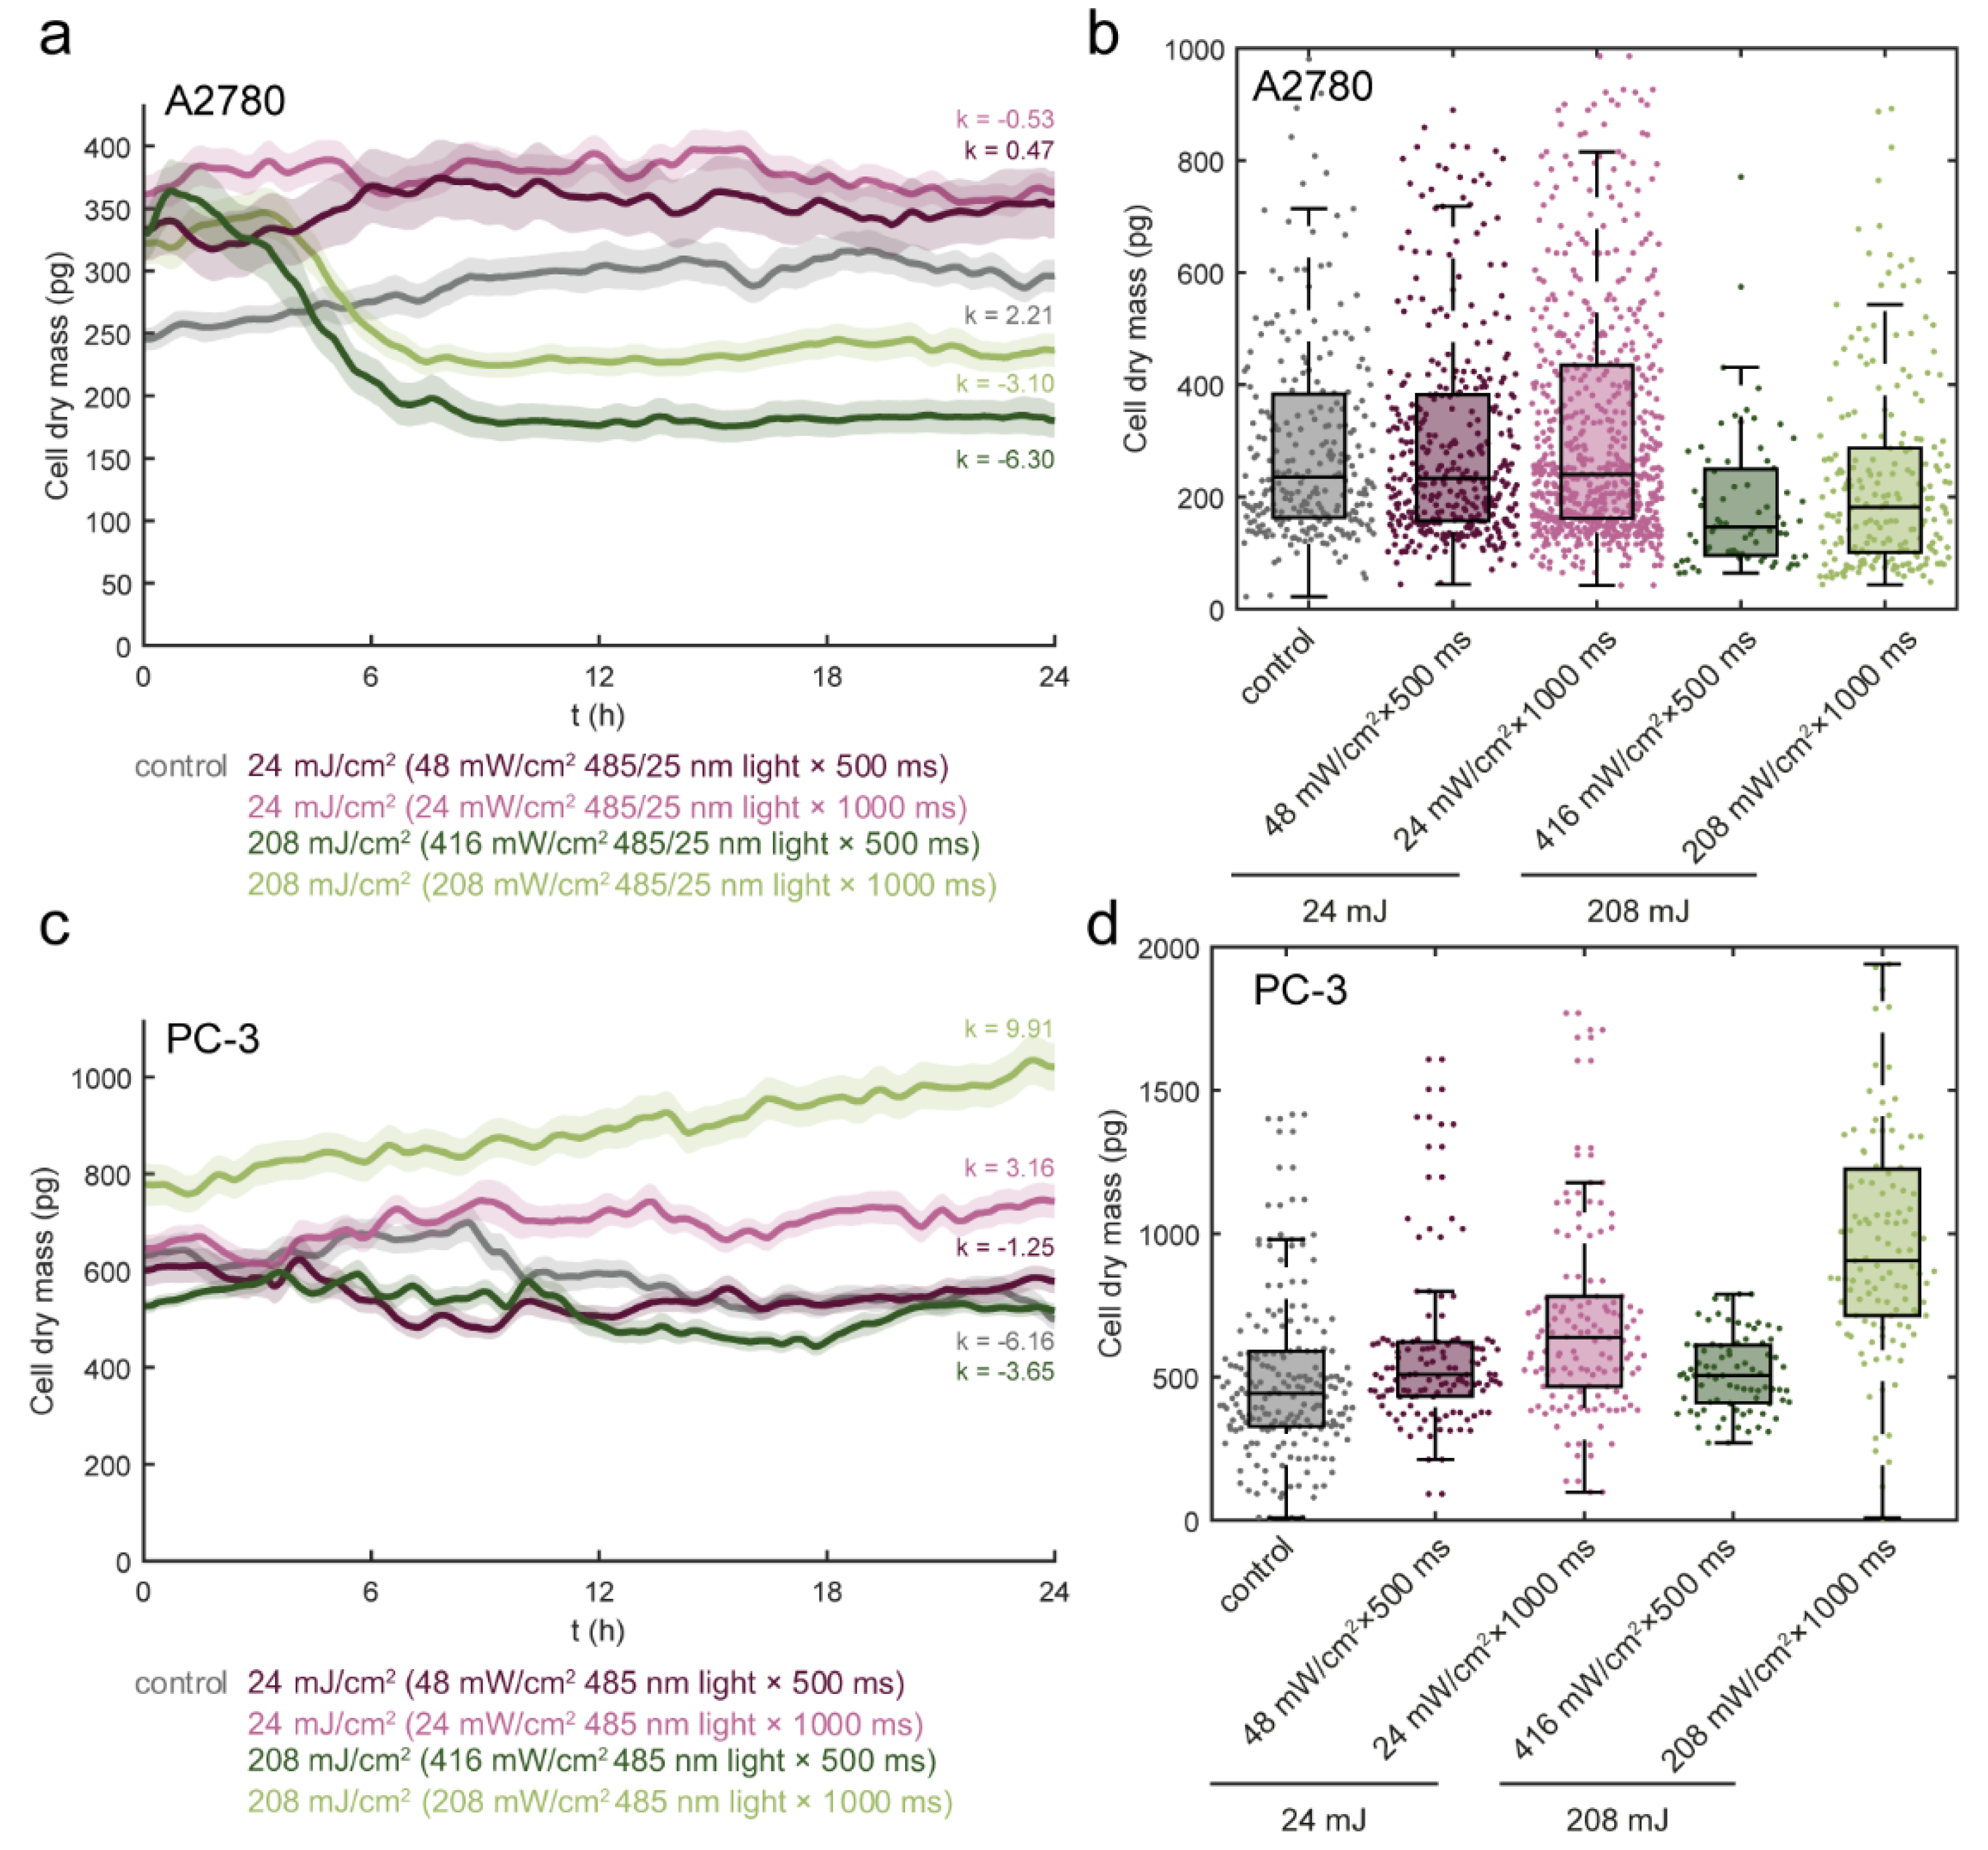
3.3. Light Dose 208 mJ/cm2 × 1000 ms Oppositely Affects Cell Mass in A2780 and PC-3
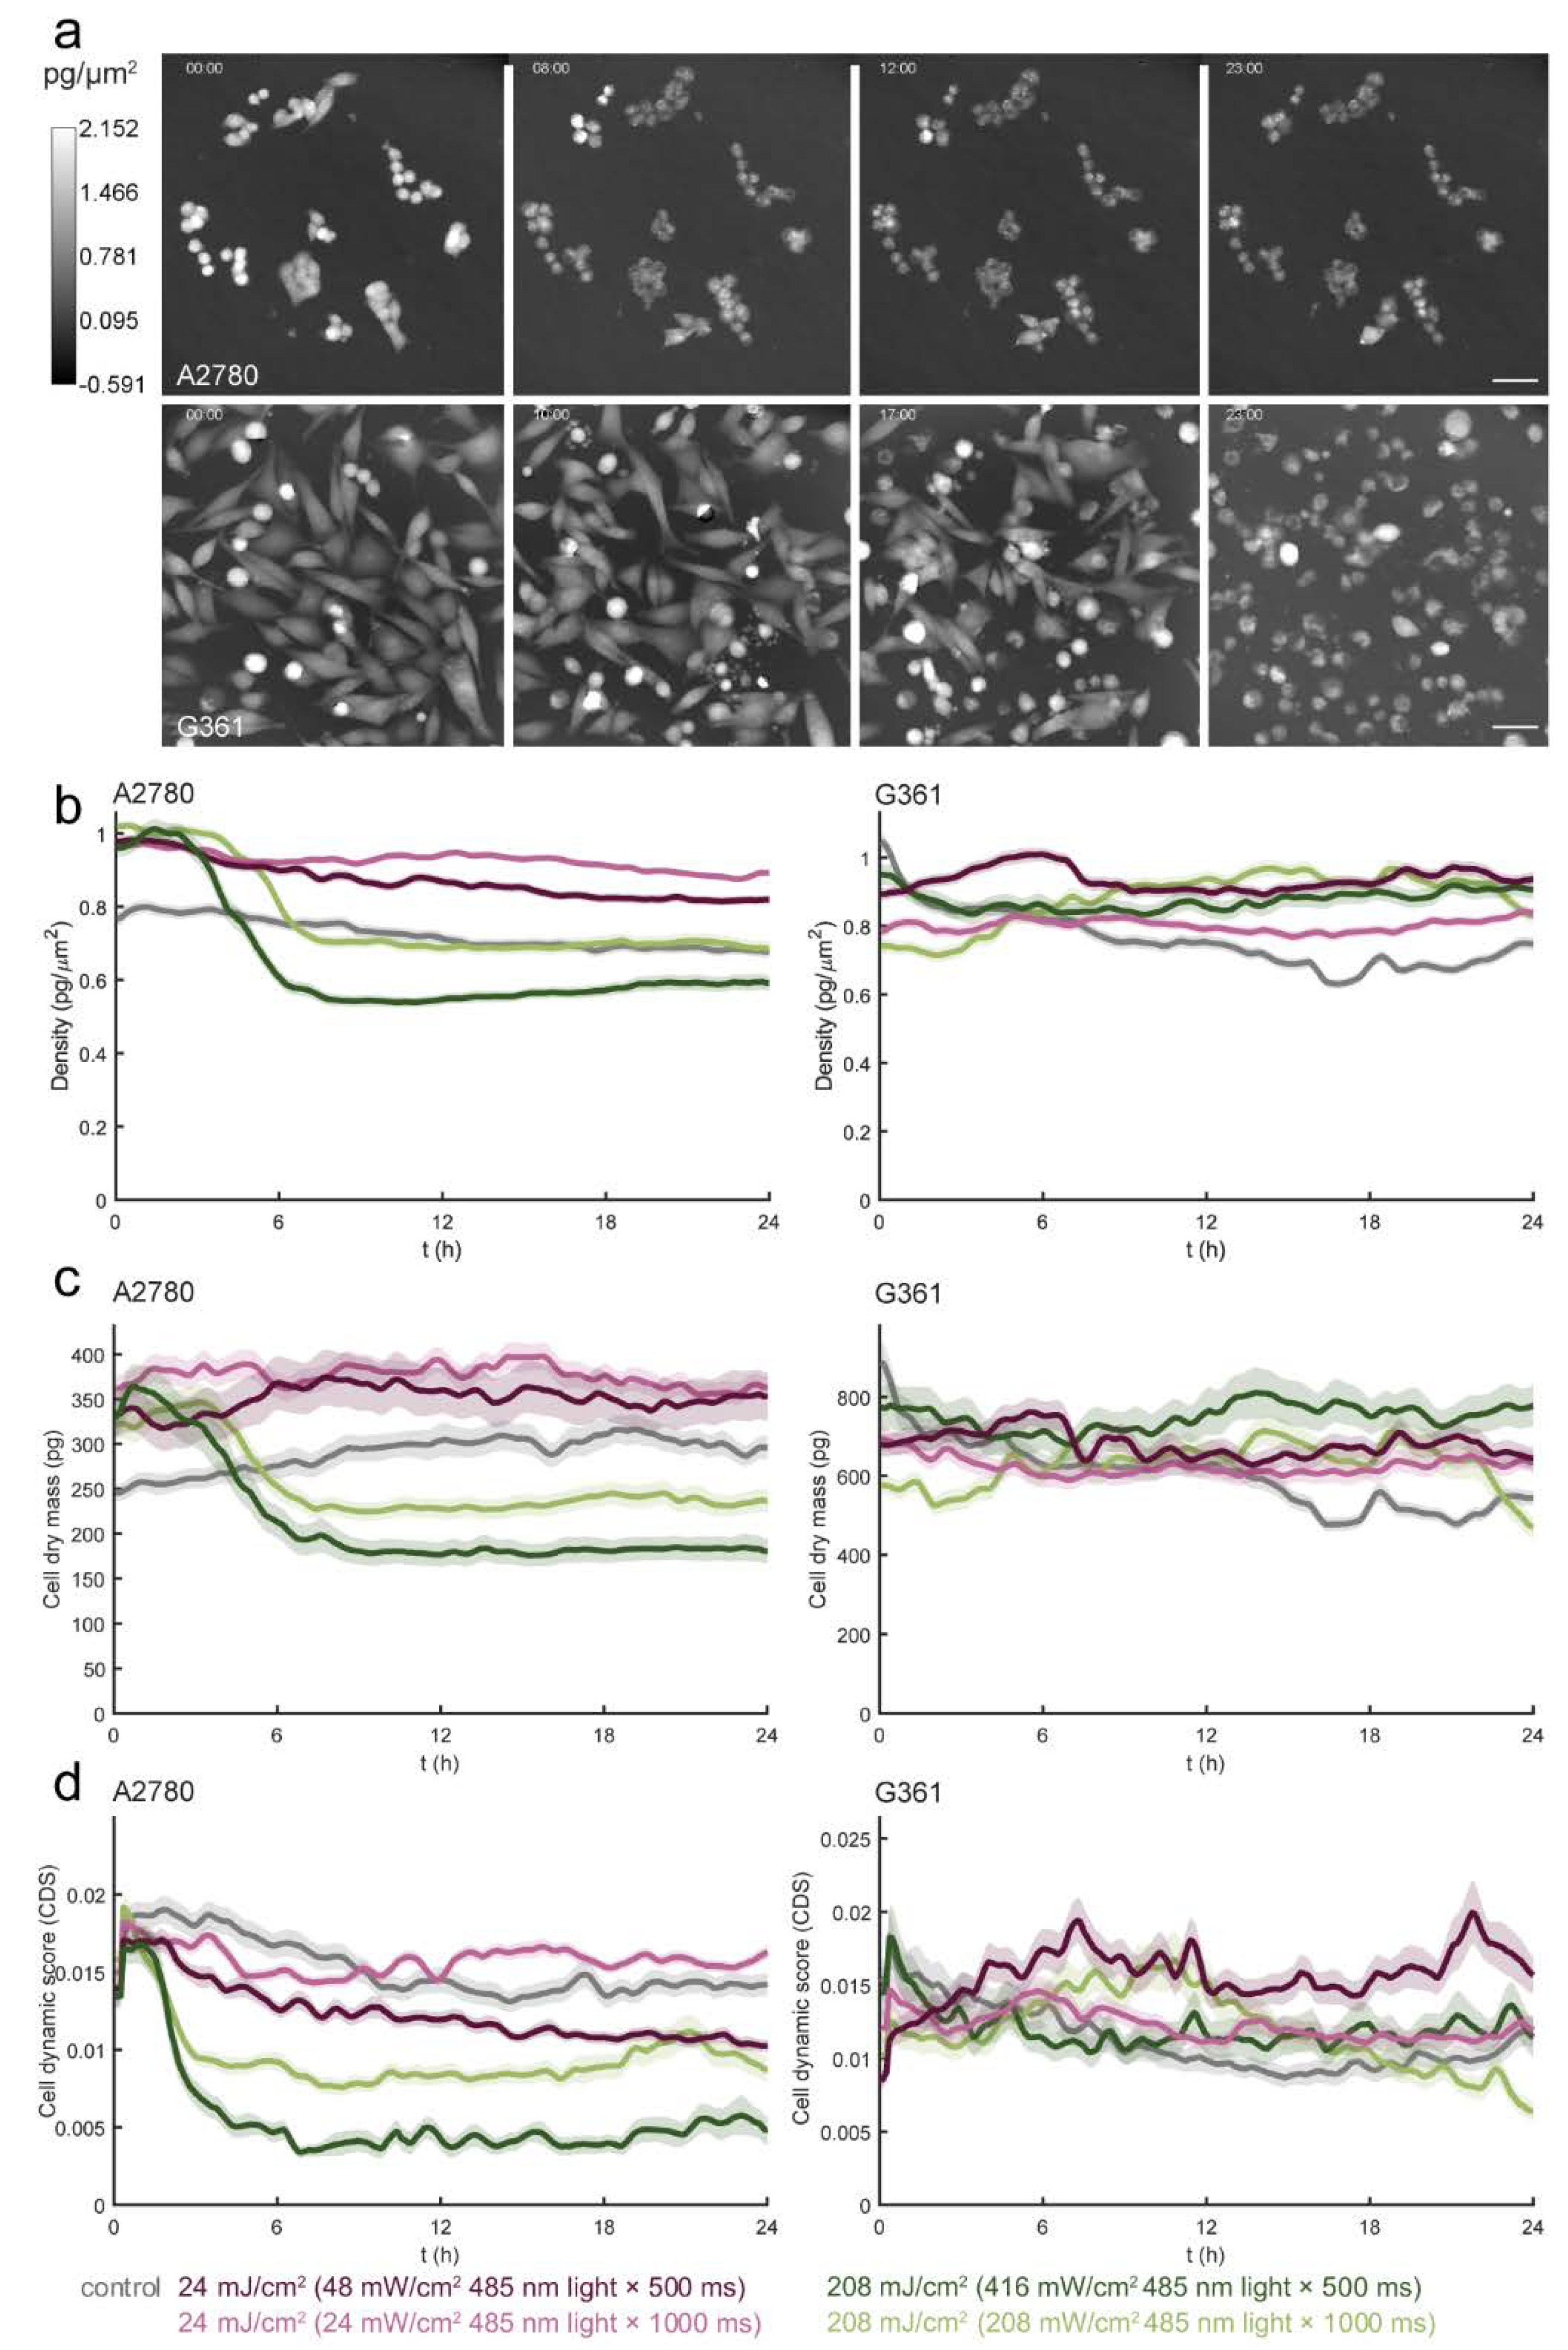
3.4. Different Types of Cell Death Are Induced by Blue Light in A2780 and G361 Cell Lines
4. Discussion
5. Conclusions
Supplementary Materials
Author Contributions
Funding
Acknowledgments
Conflicts of Interest
References
- Phan, T.X. Intrinsic Photosensitivity Enhances Motility of T Lymphocytes. Sci. Rep. 2016, 6, 39479. [Google Scholar] [CrossRef] [PubMed]
- Lewis, J.B. Blue light differentially alters cellular redox properties. J. Biomed. Mater. Res. Part B Appl. Biomater. 2005, 72, 223–229. [Google Scholar] [CrossRef] [PubMed]
- Omata, Y. Intra- and extracellular reactive oxygen species generated by blue light. J. Biomed. Mater. Res. Part A 2006, 77, 470–477. [Google Scholar] [CrossRef] [PubMed]
- Chotikasemsri, P.; Tangtrakulwanich, B.; Sangkhathat, S. The Effect of Phototherapy on Cancer Predisposition Genes of Diabetic and Normal Human Skin Fibroblasts. Biomed Res. Int. 2017, 2017, 7604861. [Google Scholar] [CrossRef]
- Winkler, B.S. Oxidative damage and age-related macular degeneration. Mol. Vis. 1999, 5, 32. [Google Scholar]
- Kuse, Y. Damage of photoreceptor-derived cells in culture induced by light emitting diode-derived blue light. Sci. Rep. 2014, 4, 5223. [Google Scholar] [CrossRef]
- Osborne, N.N.; Nunez-Alvarez, C.; del Olmo-Aguado, S. The effect of visual blue light on mitochondrial function associated with retinal ganglions cells. Exp. Eye Res. 2014, 128, 8–14. [Google Scholar] [CrossRef]
- Triesscheijn, M. Photodynamic therapy in oncology. Oncologist 2006, 11, 1034–1044. [Google Scholar] [CrossRef]
- Ochsner, M. Photophysical and photobiological processes in the photodynamic therapy of tumours. J. Photochem. Photobiol. B-Biol. 1997, 39, 1–18. [Google Scholar] [CrossRef]
- Sullivan, R.M. Photo-induced inactivation of protein kinase C alpha by dequalinium inhibits motility of murine melanoma cells. Mol. Pharmacol. 2000, 58, 729–737. [Google Scholar] [CrossRef]
- Petty, H.R. Fluorescence microscopy: Established and emerging methods, experimental strategies, and applications in immunology. Microsc. Res. Tech. 2007, 70, 687–709. [Google Scholar] [CrossRef]
- Sanderson, M.J. Fluorescence Microscopy. Cold Spring Harb. Protoc. 2014, 2014, pdb.top071795-p. [Google Scholar] [CrossRef] [PubMed]
- Slaby, T. Off-axis setup taking full advantage of incoherent illumination in coherence-controlled holographic microscope. Opt. Express 2013, 21, 14747–14762. [Google Scholar] [CrossRef] [PubMed]
- Miniotis, M.F.; Mukwaya, A.; Wingren, A.G. Digital Holographic Microscopy for Non-Invasive Monitoring of Cell Cycle Arrest in L929 Cells. PLoS ONE 2014, 9, e106546. [Google Scholar]
- Sebesta, M. HoloMonitor M4: Holographic imaging cytometer for real-time kinetic label-free live-cell analysis of adherent cells. In Proceedings of the 2nd Conference on Quantitative Phase Imaging (QPI II), San Francisco, CA, USA, 14–17 February 2016; Spie-Int Soc Optical Engineering: San Francisco, CA, USA, 2016. [Google Scholar]
- El-Schich, Z. Induction of morphological changes in death-induced cancer cells monitored by holographic microscopy. J. Struct. Biol. 2015, 189, 207–212. [Google Scholar] [CrossRef]
- Kemper, B. Multimodal label-free growth and morphology characterization of different cell types in a single culture with quantitative digital holographic phase microscopy. In Proceedings of the 1st Conference on Quantitative Phase Imaging (QPI), San Francisco, CA, USA, 7–9 February 2015; Spie-Int Soc Optical Engineering: San Francisco, CA, USA, 2015. [Google Scholar]
- Fojtu, M. Black Phosphorus Cytotoxicity Assessments Pitfalls: Advantages and Disadvantages of Metabolic and Morphological Assays. Chem.-A Eur. J. 2019, 25, 349–360. [Google Scholar] [CrossRef]
- Park, Y.; Depeursinge, C.; Popescu, G. Quantitative phase imaging in biomedicine. Nat. Photonics 2018, 12, 578–589. [Google Scholar] [CrossRef]
- Chmelik, R. Chapter 5—The Role of Coherence in Image Formation in Holographic Microscopy. In Progress in Optics; Wolf, E., Ed.; Elsevier: Amsterdam, The Netherlands, 2014; pp. 267–335. [Google Scholar]
- Shaffer, E.; Pavillon, N.; Depeursinge, C. Single-shot, simultaneous incoherent and holographic microscopy. J. Microsc. 2012, 245, 49–62. [Google Scholar] [CrossRef]
- Balvan, J. Multimodal Holographic Microscopy: Distinction between Apoptosis and Oncosis. PLoS ONE 2015, 10, e0121674. [Google Scholar] [CrossRef]
- Vicar, T. The Quantitative-Phase Dynamics of Apoptosis and Lytic Cell Death. Sci. Rep. 2020, 10, 1566. [Google Scholar] [CrossRef]
- Yu, X. Four-dimensional motility tracking of biological cells by digital holographic microscopy. J. Biomed. Opt. 2014, 19, 045001. [Google Scholar] [CrossRef]
- Wingren, A.G. Moving into a new dimension: Tracking migrating cells with digital holographic cytometry in 3D. Cytom. Part A 2019, 95, 144–146. [Google Scholar] [CrossRef] [PubMed]
- Mitchell, S. Phenotypic and genotypic characterization of commonly used human prostatic cell lines. BJU Int. 2000, 85, 932–944. [Google Scholar] [CrossRef] [PubMed]
- Sharrard, R.M.; Maitland, N.J. Regulation of Protein Kinase B activity by PTEN and SHIP2 in human prostate-derived cell lines. Cell. Signal. 2007, 19, 129–138. [Google Scholar] [CrossRef] [PubMed]
- Schmieg, F.I.; Simmons, D.T. Characterization of the Invitro Interaction between Sv40 T-Antigen and P53—Mapping the P53 Binding-Site. Virology 1988, 164, 132–140. [Google Scholar] [CrossRef]
- Kreis, T. Digital Holographic Interference-Phase Measurement Using the Fourier-Transform Method. J. Opt. Soc. Am. A-Opt. Image Sci. Vis. 1986, 3, 847–855. [Google Scholar] [CrossRef]
- Goldstein, R.M.; Zebker, H.A.; Werner, C.L. Satellite Radar Interferometry—Two-Dimensional Phase Unwrapping. Radio Sci. 1988, 23, 713–720. [Google Scholar] [CrossRef]
- Ghiglia, D.C.; Pritt, M.D. Two-Dimensional Phase Unwrapping: Theory, Algorithms, and Software; Wiley: Hoboken, NJ, USA, 1998. [Google Scholar]
- Prescher, J.A.; Bertozzi, C.R. Chemistry in living systems. Nat. Chem. Biol. 2005, 1, 13–21. [Google Scholar] [CrossRef]
- Loewke, N.O. Automated Cell Segmentation for Quantitative Phase Microscopy. IEEE Trans. Med. Imaging 2018, 37, 929–940. [Google Scholar] [CrossRef]
- Chalfoun, J. Empirical gradient threshold technique for automated segmentation across image modalities and cell lines. J. Microsc. 2015, 260, 86–99. [Google Scholar] [CrossRef]
- Vicar, T. Cell segmentation methods for label-free contrast microscopy: Review and comprehensive comparison. BMC Bioinform. 2019, 20, 360. [Google Scholar] [CrossRef] [PubMed]
- Meyer, F. Topographic distance and watershed lines. Signal Process. 1994, 38, 113–125. [Google Scholar] [CrossRef]
- Maurer, C.R.; Qi, R.S.; Raghavan, V. A linear time algorithm for computing exact Euclidean distance transforms of binary images in arbitrary dimensions. IEEE Trans. Pattern Anal. Mach. Intell. 2003, 25, 265–270. [Google Scholar] [CrossRef]
- R Core Team. R: A Language and Environment for Statistical Computing; R Foundation for Statistical Computing: Vienna, Austria, 2019. [Google Scholar]
- Kassambara, A. Ggpubr: ‘ggplot2’ Based Publication Ready Plots; R Package Version 0.2.4; 2019. [Google Scholar]
- Oh, P.-S. Inhibitory effect of blue light emitting diode on migration and invasion of cancer cells. J. Cell. Physiol. 2017, 232, 3444–3453. [Google Scholar] [CrossRef] [PubMed]
- Lan, C.C. Directional migration of cancer cells induced by a blue light intensity gradient. Biomed. Opt. Express 2015, 6, 2624–2632. [Google Scholar] [CrossRef] [PubMed]
- Nakashima, Y.; Ohta, S.; Wolf, A.M. Blue light-induced oxidative stress in live skin. Free Radic. Biol. Med. 2017, 108, 300–310. [Google Scholar] [CrossRef]
- Nash, T.R. Daily blue-light exposure shortens lifespan and causes brain neurodegeneration in Drosophila. NPJ Aging Mech. Dis. 2019, 5, 8. [Google Scholar] [CrossRef]
- Moore, P. Effect of wavelength on low-intensity laser irradiation-stimulated cell proliferation in vitro. Lasers Surg. Med. 2005, 36, 8–12. [Google Scholar] [CrossRef]
- Oh, P.-S. Effect of blue light emitting diodes on melanoma cells: Involvement of apoptotic signaling. J. Photochem. Photobiol. B Biol. 2015, 142, 197–203. [Google Scholar] [CrossRef]
- Gilchrest, B.A. Mechanisms of Ultraviolet Light-Induced Pigmentation. Photochem. Photobiol. 1996, 63, 1–10. [Google Scholar] [CrossRef]
- Tolde, O. Quantitative phase imaging unravels new insight into dynamics of mesenchymal and amoeboid cancer cell invasion. Sci. Rep. 2018, 8, 12020. [Google Scholar] [CrossRef] [PubMed]
- Khmaladze, A. Cell volume changes during apoptosis monitored in real time using digital holographic microscopy. J. Struct. Biol. 2012, 178, 270–278. [Google Scholar] [CrossRef] [PubMed]
- Trump, B.F. The pathways of cell death: Oncosis, apoptosis, and necrosis. Toxicol. Pathol. 1997, 25, 82–88. [Google Scholar] [CrossRef] [PubMed]
- Edinger, A.L.; Thompson, C.B. Death by design: Apoptosis, necrosis and autophagy. Curr. Opin. Cell Biol. 2004, 16, 663–669. [Google Scholar] [CrossRef]
- Rello, S. Morphological criteria to distinguish cell death induced by apoptotic and necrotic treatments. Apoptosis 2005, 10, 201–208. [Google Scholar] [CrossRef]


© 2020 by the authors. Licensee MDPI, Basel, Switzerland. This article is an open access article distributed under the terms and conditions of the Creative Commons Attribution (CC BY) license (http://creativecommons.org/licenses/by/4.0/).
Share and Cite
Feith, M.; Vičar, T.; Gumulec, J.; Raudenská, M.; Gjörloff Wingren, A.; Masařík, M.; Balvan, J. Quantitative Phase Dynamics of Cancer Cell Populations Affected by Blue Light. Appl. Sci. 2020, 10, 2597. https://doi.org/10.3390/app10072597
Feith M, Vičar T, Gumulec J, Raudenská M, Gjörloff Wingren A, Masařík M, Balvan J. Quantitative Phase Dynamics of Cancer Cell Populations Affected by Blue Light. Applied Sciences. 2020; 10(7):2597. https://doi.org/10.3390/app10072597
Chicago/Turabian StyleFeith, Marek, Tomáš Vičar, Jaromír Gumulec, Martina Raudenská, Anette Gjörloff Wingren, Michal Masařík, and Jan Balvan. 2020. "Quantitative Phase Dynamics of Cancer Cell Populations Affected by Blue Light" Applied Sciences 10, no. 7: 2597. https://doi.org/10.3390/app10072597
APA StyleFeith, M., Vičar, T., Gumulec, J., Raudenská, M., Gjörloff Wingren, A., Masařík, M., & Balvan, J. (2020). Quantitative Phase Dynamics of Cancer Cell Populations Affected by Blue Light. Applied Sciences, 10(7), 2597. https://doi.org/10.3390/app10072597