Article

Simulation of Radiation and Crop Activity in a Greenhouse Covered with Semitransparent Organic Photovoltaics

by
Catherine Baxevanou
1,
Dimitrios Fidaros
1,
Nikolaos Katsoulas
1,*,
Evangelos Mekeridis
2,
Chrisostomos Varlamis
2,
Alexandros Zachariadis
3 and
Stergios Logothetidis
3
1
Laboratory of Agricultural Constructions and Environmental Control, Department of Agriculture Crop Production and Rural Environment, University of Thessaly, Fytokou Street, 38446 Volos, Greece
2
Organic Electronic Technologies P.C. (OET), Antoni Tritsi 21b, 54124 Thessaloniki, Greece
3
Laboratory for Thin Films, Nanobiomaterials, Nanosystems & Nanometrology (LTFN), Department of Physics, Aristotle University of Thessaloniki, 54124 Thessaloniki, Greece
*
Author to whom correspondence should be addressed.
Appl. Sci. 2020, 10(7), 2550; https://doi.org/10.3390/app10072550
Submission received: 23 March 2020 / Revised: 2 April 2020 / Accepted: 3 April 2020 / Published: 8 April 2020
(This article belongs to the Special Issue Greenhouse Integrated Photovoltaic System II)

Abstract

:
A solution to the problem of reduction of available photosynthetically active radiation (PAR) due to the cover with conventional opaque photovoltaics (PV) of greenhouses is the use of semitransparent PV. The question is how dense the semitransparent PV should be and how dense the coverage should be in order not to burden plant growth. The present paper assesses the effect of the use of semitransparent organic photovoltaics (OPV) on the greenhouse roof cover on the available PAR inside the greenhouse. The method used is to simulate the transmission of radiation through the cover and into the greenhouse with computational fluid dynamics (CFD) using the discrete ordinates (DO) model. Three combinations of OPV/cover that give a normal (perpendicular) transmittance to PAR of 30%, 45%, and 60%, defining the required PV covering, were examined. Then the radiation transmission during eight indicative solar days was simulated. The results are given in terms of available PAR radiation inside the greenhouse and of crop photosynthesis rate, comparing them with the results of a polyethylene cover without OPVs and external conditions. The reduction observed to the mean daily PAR radiation integral for the cases with normal PAR transmittance of 30%, 45%, and 60% in relation to the bare polyethylene (PE) was 77%, 66%, and 52%, respectively while the respective simulated reduction to the daily average photosynthesis rate was 33%, 21%, and 12%, respectively. Finally, the yearly power production from the OPV per greenhouse length meter for the cases with normal PAR transmittance of 30%, 45%, and 60% was 323, 242, and 158 kWh m−1 y−1, respectively. The results of this work could be further used for the optimization of greenhouse design for maximizing the PAR at the crop level.

1. Introduction

The use of photovoltaics (PV) for power production needed for the operation of greenhouses addresses the problem of land occupation for their installation, land that could be valuable for food production [1]. One solution is to place them in the greenhouse cover itself. However, this can lead to a decrease in available photosynthetically active radiation (PAR) at the plant level, making it difficult for the plants to grow, as well as altering other parameters describing the thermal and flow field developed inside the greenhouse (e.g., temperature, pressure, velocity, etc.), which are influenced by the cover materials transmissivity. As a solution to this problem, it is suggested to use semi-transparent PVs in film form which do not burden the greenhouse statics and in addition allow quantities of natural light to enter since they are not completely opaque like ordinary PV panels. However, these also limit the entry of PAR and are expected to alter the internal microclimate by many mechanisms (smaller amounts of available PAR, lower heat exchange through the cover, modification of the thermal and flow field, etc.).
The issue of PV integration into the greenhouse cover has been a matter of great concern to the scientific community in recent years investigating: (a) to what extent they are able to meet greenhouse energy needs and/or (b) to what extent they influence plant growth in the greenhouse. The majority of the research works begin with experiments or field measurements trying to develop some analytical models for the expansion of the measurement results.
Therefore, one issue that is being investigated is how the geometry of the greenhouse cover affects the performance of PV. In [2], the power production of four amorphous-silicon photovoltaic modules were measured, and an analytical model was developed. The PVs were arranged in an arch formation at the northern end of the Gothic-arch style roof of a north–south oriented greenhouse. The investigations in [3,4] focus on the ability to meet with the cover-integrated PV the power demand for the internal climate control of a greenhouse with Welsh onion crops. They measure the energy production and the solar radiation inside the greenhouse for a 12.9% PV covering and in parallel they develop an analytical model for the prediction of solar energy at specific points inside the greenhouse during the day. In [5], the electricity production, the greenhouse temperature, and the PAR radiation are measured in experimental configuration with PVs causing 20% shading, and an analytical model is developed in order to expand the conclusions. In [6], the power produced by bifacial PVs covering 37% of a greenhouse cover is investigated.
The other issue is the effect of PVs on the internal microclimate and productivity of the greenhouse. The integration of semitransparent PV panels placed at a distance of 8 cm from the greenhouse pitched roof, covering 20% of the roof, causes solar radiation reduction of 35%–40% and a temperature reduction of 1–3 °C according to field measurements for tomato and lettuce crops [1,7]. In [8], the replacement of the 50% of a pitched roof with multi-crystalline PV measuring the temperature and the solar radiation inside the greenhouse is examined. With field measurements the influence of roof integrated PVs on the evapotranspiration rate, and consequently on water management, is also approached [9]. Finally, the effect of the PV incorporation on the roof depends on the percentage of cover but also on the cultivation with tomato and lettuce being less vulnerable than onion [1,3,5,7].
Calculating the available PAR inside a greenhouse throughout a solar day requires extensive and difficult calculations that become even more difficult in the case of an arched greenhouse. For that reason, the majority of the relevant research works concerns itself with either the examination of the panel level [10] or with the examination of pitched roofs [11]; when they deal with arched roofs, they usually adopt simplified assumptions concerning the real roof geometry [12]. In fact, these calculations can be done with numerical methods like computational fluid dynamics (CFD) [13]. Thus, one method of studying the effect of semi-transparent PV incorporation on a greenhouse cover is to simulate the transport phenomena developed therein by a CFD model which allows the detailed and accurate simulation of an arched roof geometry.
This work examines the impact of the use of semitransparent PVs incorporated in the greenhouse cover on the inner microclimate and on the parameters that affect the growth of plants with a numerical simulation of the microclimate. To the best of our knowledge, the estimation of PAR levels inside an arched roof greenhouse covered with semitransparent PVs has not been carried out. Thus, a main objective of this work is to examine three PV densities and to calculate the available PAR above the plant level, as well as the corresponding photosynthesis rates. In addition to the three densities, the use of a bare polyethylene covering film without any PV is also considered. The purpose is to determine the density of PVs, and consequently the installed power, per cover unit area which allows for the normal growth of plants, as well as to determine the rates of reduction of growth factors resulting from the use of PVs. For that, a computational fluid mechanics model is developed that studies the microclimate distribution of radiation in a tunnel greenhouse examining a 2D geometry for eight typical solar days. Finally, beyond the evaluation of the PV influence on the internal microclimate, the power produced by PVs in an arched roof greenhouse is assessed, something that has not been studied yet for an arched roof greenhouse.

2. Materials and Methods

The simulations of the greenhouse microclimate were made using the CFD model developed by the authors in [13,14,15].

2.1. Models and Assumptions

The flow inside the greenhouse is considered 2D, unsteady, incompressible, and turbulent. The heat and flow transport phenomena are described by the Reynolds-averaged Navier–Stokes (RANS) equations [16,17]. The energy equation is also solved in solid regions where the general energy transport equation is reduced to the Fourier equation. The effect of turbulence on the flow was implemented via the high Re k-ε model (standard) [16] with wall functions. The effect of solar incident radiation in the roof cover, the emitted thermal radiation, and the radiation transport inside the computation domain are simulated using the discrete ordinates (DO) model [18,19]. Plants are modelled as porous materials through a source term addition in the momentum equations [13]. The partial differential equations are solved with the finite volume method.
Air velocity in the left opening of the greenhouse is considered constant during the solar day with a distribution corresponding to fully developed turbulent flow and with an average value taken from local climatic data and considering a discharge coefficient equal to 0.6 and with 3% turbulence intensity. The temperature at the inlet and in the atmosphere around the greenhouse is assumed to follow a sinusoidal distribution over the day [13]. The calculation of the incident radiation on the cover (total, beam, and diffusive) at horizontal level is first calculated for every time step, taking into account the local climatic data. Then the normal incident radiation on each computational cell of the cover is calculated according to the segment inclination.

2.2. Simulated Geometry

The computational domain of the simulation coincides with the cross-section of an arc type greenhouse with the geometry presented in Figure 1, with its main axis oriented from North to South. Thus, the simulated cross section geometry corresponds to an east–west axis. The greenhouse has a total length of 20 m, width of 8 m, eaves height of 2.4 m, and ridge height of 4.1 m [13,14,15]. It is considered to contain four double rows of tomato plants. Greenhouse ventilation is performed by means of two side vents. Since the length of the greenhouse is big enough in relation to width, the examination of a 2D cross section is feasible. Two basic geometries were used. The first one corresponds to summer months with the side vents fully open (opening height 0.9 m), and the second one corresponds to winter months, with the vents partially open (opening height 0.2 m).

2.3. Boundary and Initial Conditions

The external surface of the cover is considered semi-transparent wall with mixed boundary condition (heat exchange by radiation and convection) thermally and optically coupled with a finite width transparent solid material, which allows radiation and heat transport according to its optical and thermal properties. The internal surface of the cover is also considered a semi-transparent surface thermally and optically coupled with the solid material and the internal air. Side walls are considered opaque isothermal walls with a temperature equal to the external environment temperature. The ground is considered an adiabatic wall. In all cases, the boundary condition of the wall corresponds to non-slip and non-penetrate conditions. The tomato crop is considered porous material that introduces a sink term in the momentum equations and participates in the heat transfer. In order to take into account the crop optical properties, the properties of the participating fluid (air) are modified. Finally, a source term is added in the energy equation corresponding to the thermal radiation from the crop. The air is considered to enter from the left opening where an inlet boundary condition is applied and to leave the computational domain from the right opening where an exit boundary condition is applied with known constant pressure equal to the atmospheric pressure.
The temperature in the boundary domain starts at a value equal to the external atmosphere at sunrise. The initial air velocity and the initial values of turbulence parameters inside the greenhouse are considered equal to the air entrance values.

2.4. Numerical Details—Grid

The semi-implicit method for pressure-linked equations (SIMPLE) algorithm [17] is used for the pressure–velocity coupling. The convection terms of the momentum and radiation equations are discretized using a second order upwind (SOU) scheme [20], while central differences are used for the diffusion terms. For the convection terms of turbulence model and energy equations, the quadratic upstream interpolation for convective kinematics (QUICK) [21] and monotonic upstream-centered scheme for conversation laws (MUSCL) [22] are used, respectively, while for the temporal discretization, a second order scheme is used. The convergence criterion has been set to 10−5 for the continuity, momentum, and turbulence equations, to 10−8 for the energy equation, and to 10−6 for the radiation equations. The radiation transport equations for the DO model are solved for four wavelength bands λ = 0.1–0.4–0.76–1.4–1000 μm. The computational domain is discretized using 19,372 cells, while care has been taken in order for the dimensionless wall distance y+ of the first node to take values between 30 and 40. The time step has been set to 60 s. The simulations’ executions begin from at sunrise and finish at the sunset of every examined day, and the solution initialization is obtained by a steady-state solution field.

2.5. Materials

2.5.1. Structure Description

The examined transparent organic photovoltaic (OPV) examined in the present work consists of two structures. The first (structure I) contains the photovoltaic device, and the second one (structure II) is transparent, since it does not contain the photoactive material. Thus, the semitransparent OPV consists of stripes from the two different structures, each one having different optical properties. When the OPV is placed on the greenhouse cover three combinations occur: (a) the greenhouse cover (in the present work a polyethylene film of 150 μm thickness) with structure I, (b) the greenhouse cover with structure II, (c) bare polyethylene film without any OPV covering in order to increase the roof transmittance. In Figure 2, a top view and a cross-section of the above combinations are presented.

2.5.2. OPV Structure Optical Properties

The optical properties of structures I and II were calculated from the analysis of spectroscopic ellipsometry measurements in the 190 nm to 2066 nm spectral range. Each layer sequence of the photovoltaic multilayer stack was measured successively, and the optical constants of the materials along with the thickness of each layer were determined by numerical fit in an optical model. The optical properties of the overall structure were calculated by the formulation of a theoretical model which approximates the structure architecture. The resulted values were compared by transmittance measurements in the corresponding spectral range and reported excellent agreement. The average values of the optical properties for both structures are presented in Table 1 and Table 2, respectively. All the optical properties correspond to normal (perpendicular) incident radiation.
In the present work, an OPV panel with average PAR transmittance equal to 30% for normal incident radiation was considered. This corresponds to a combination of 78% structure I and 22% structure II.
The optical properties of the cover—polyethylene (PE) sheet of 150 μm thickness—were measured in a range from 300 to 2000 nm. The average values in the examined spectrum are given in Table 3.

2.5.3. Calculation of Equivalent Optical Properties

The optical properties of the combinations of structure I/PE cover and structure II/PE cover are calculated using the following relationships [23]:
τ t = τ t 1 x τ t 2 1 ρ t 1 x ρ t 2
ρ t = ρ t 1 + τ t x ρ t 2 x τ t 1 τ t 2
α t = 1 ρ t τ t
where the subscript t corresponds to the whole combination structure/cover, the subscript t1 corresponds to the OPV structure I or II, and the subscript t2 corresponds to the polyethylene film. Thus, the optical properties of the combinations are summarized in Table 4 and Table 5.

2.5.4. Other Materials Properties

The thermal properties of the OPV are not taken into account in the simulation of the cover, since are not expected to modify the thermal properties of the cover. The bare cover is a polyethylene film (PE) with density ρ = 950 kg m−3, thermal conductivity k = 0.38 W m−1 K−1, and specific heat capacity Cp = 1900 J kg−1 K−1. The thermal and optical properties of the other materials present in the greenhouse are summarized in Table 6.
The optical properties values marked with an asterisk (*) correspond to the four wavelength spectrum ranges presented in the previous tables. The porosity of the tomato crop was 40%. Side walls have the same thermal properties with the cover, but they are considered opaque. The optical properties of air inside the greenhouse have been calculated [26,27,28,29] for a mixture of air and humidity corresponding to air temperature of 25 °C and relative humidity HR of 65%.
According to the Boussinesq approximation, the density is considered constant in all the solved equations except from the buoyancy term in the momentum equation [15]. In the current simulation, the value 1.225 [kg m−3] corresponds to the density reference value used in Boussinesq approximation.

2.6. Parametric Investigation

In the parametric investigation, eight characteristic solar days were simulated. The climatic data for each examined day are given in Table 7. The climatic data were taken from the Hellenic National Meteorological Service for a simulated greenhouse which is located in Central Greece (city of Agchialos). The greenhouse is situated in Velestino with φ = 39° 23.4′ and λ = 22° 45′. For the days with average external temperature less than 22 °C, the winter geometry was used (with the small openings), while for the other days, the summer geometry was used.
For each day, four simulations were performed for the three examined combinations of OPV/cover, corresponding to normal transmittance in the PAR spectrum equal to 30%, 45%, and 60% and for the case of the bare PE cover with PAR normal transmittance (89%). The examined OPV/cover combinations are presented in Table 8. In the last column, the corresponding installed PV power per meter of greenhouse is given considering the whole width of the arched roof (8.93 m).
Simulation results are presented in terms of available PAR and photosynthesis rate. The photosynthesis rate, P (in μmol (CO2) m−2 s−1) was calculated according to the following relationship:
P = α I + P max ( α I + P max ) 2 4 θ α IP max 2 θ
where α, light-limited quantum efficiency (~0.5 μmol (CO2) μmol−1 (photons)); I, the incident PAR radiation in μmol (photons) m−2 s−1 (in the PAR spectrum 1 W m−2 ~ 2 μmol m−2 s−1); Pmax, the maximum photosynthesis rate (here considered equal to 30 μmol CO2 m−2 s−1); and θ, the convexity (here considered equal to 0.7, dimensionless).

3. Results and Discussion

3.1. PAR Isocontours

The PAR isocontours in the simulation domain are presented in Figure 3a–f, for the 21 June for normal transmittance at PAR spectrum, τn,PAR = 30% for 6 different hours of the day. It should be noted that in all the presented results the solar time is considered.
In addition, Figure 4a–f, Figure 5a–f, and Figure 6a–f present the PAR for the same date for normal transmittance at the PAR spectrum equal to 45%, 60%, and 89% (bare PE cover), respectively.
It can be seen in Figure 3, Figure 4, Figure 5 and Figure 6 that the radiation distribution changes during the different time periods of the day and for the different case studies considered. The crop lines and their effect on the radiation distribution inside the greenhouses are also obvious in each figure.
The levels of PAR are clearly different (higher) under the case of the bare PE film (Figure 6) compared to the case studies of covers with integrated OPVs (Figure 3, Figure 4 and Figure 5).

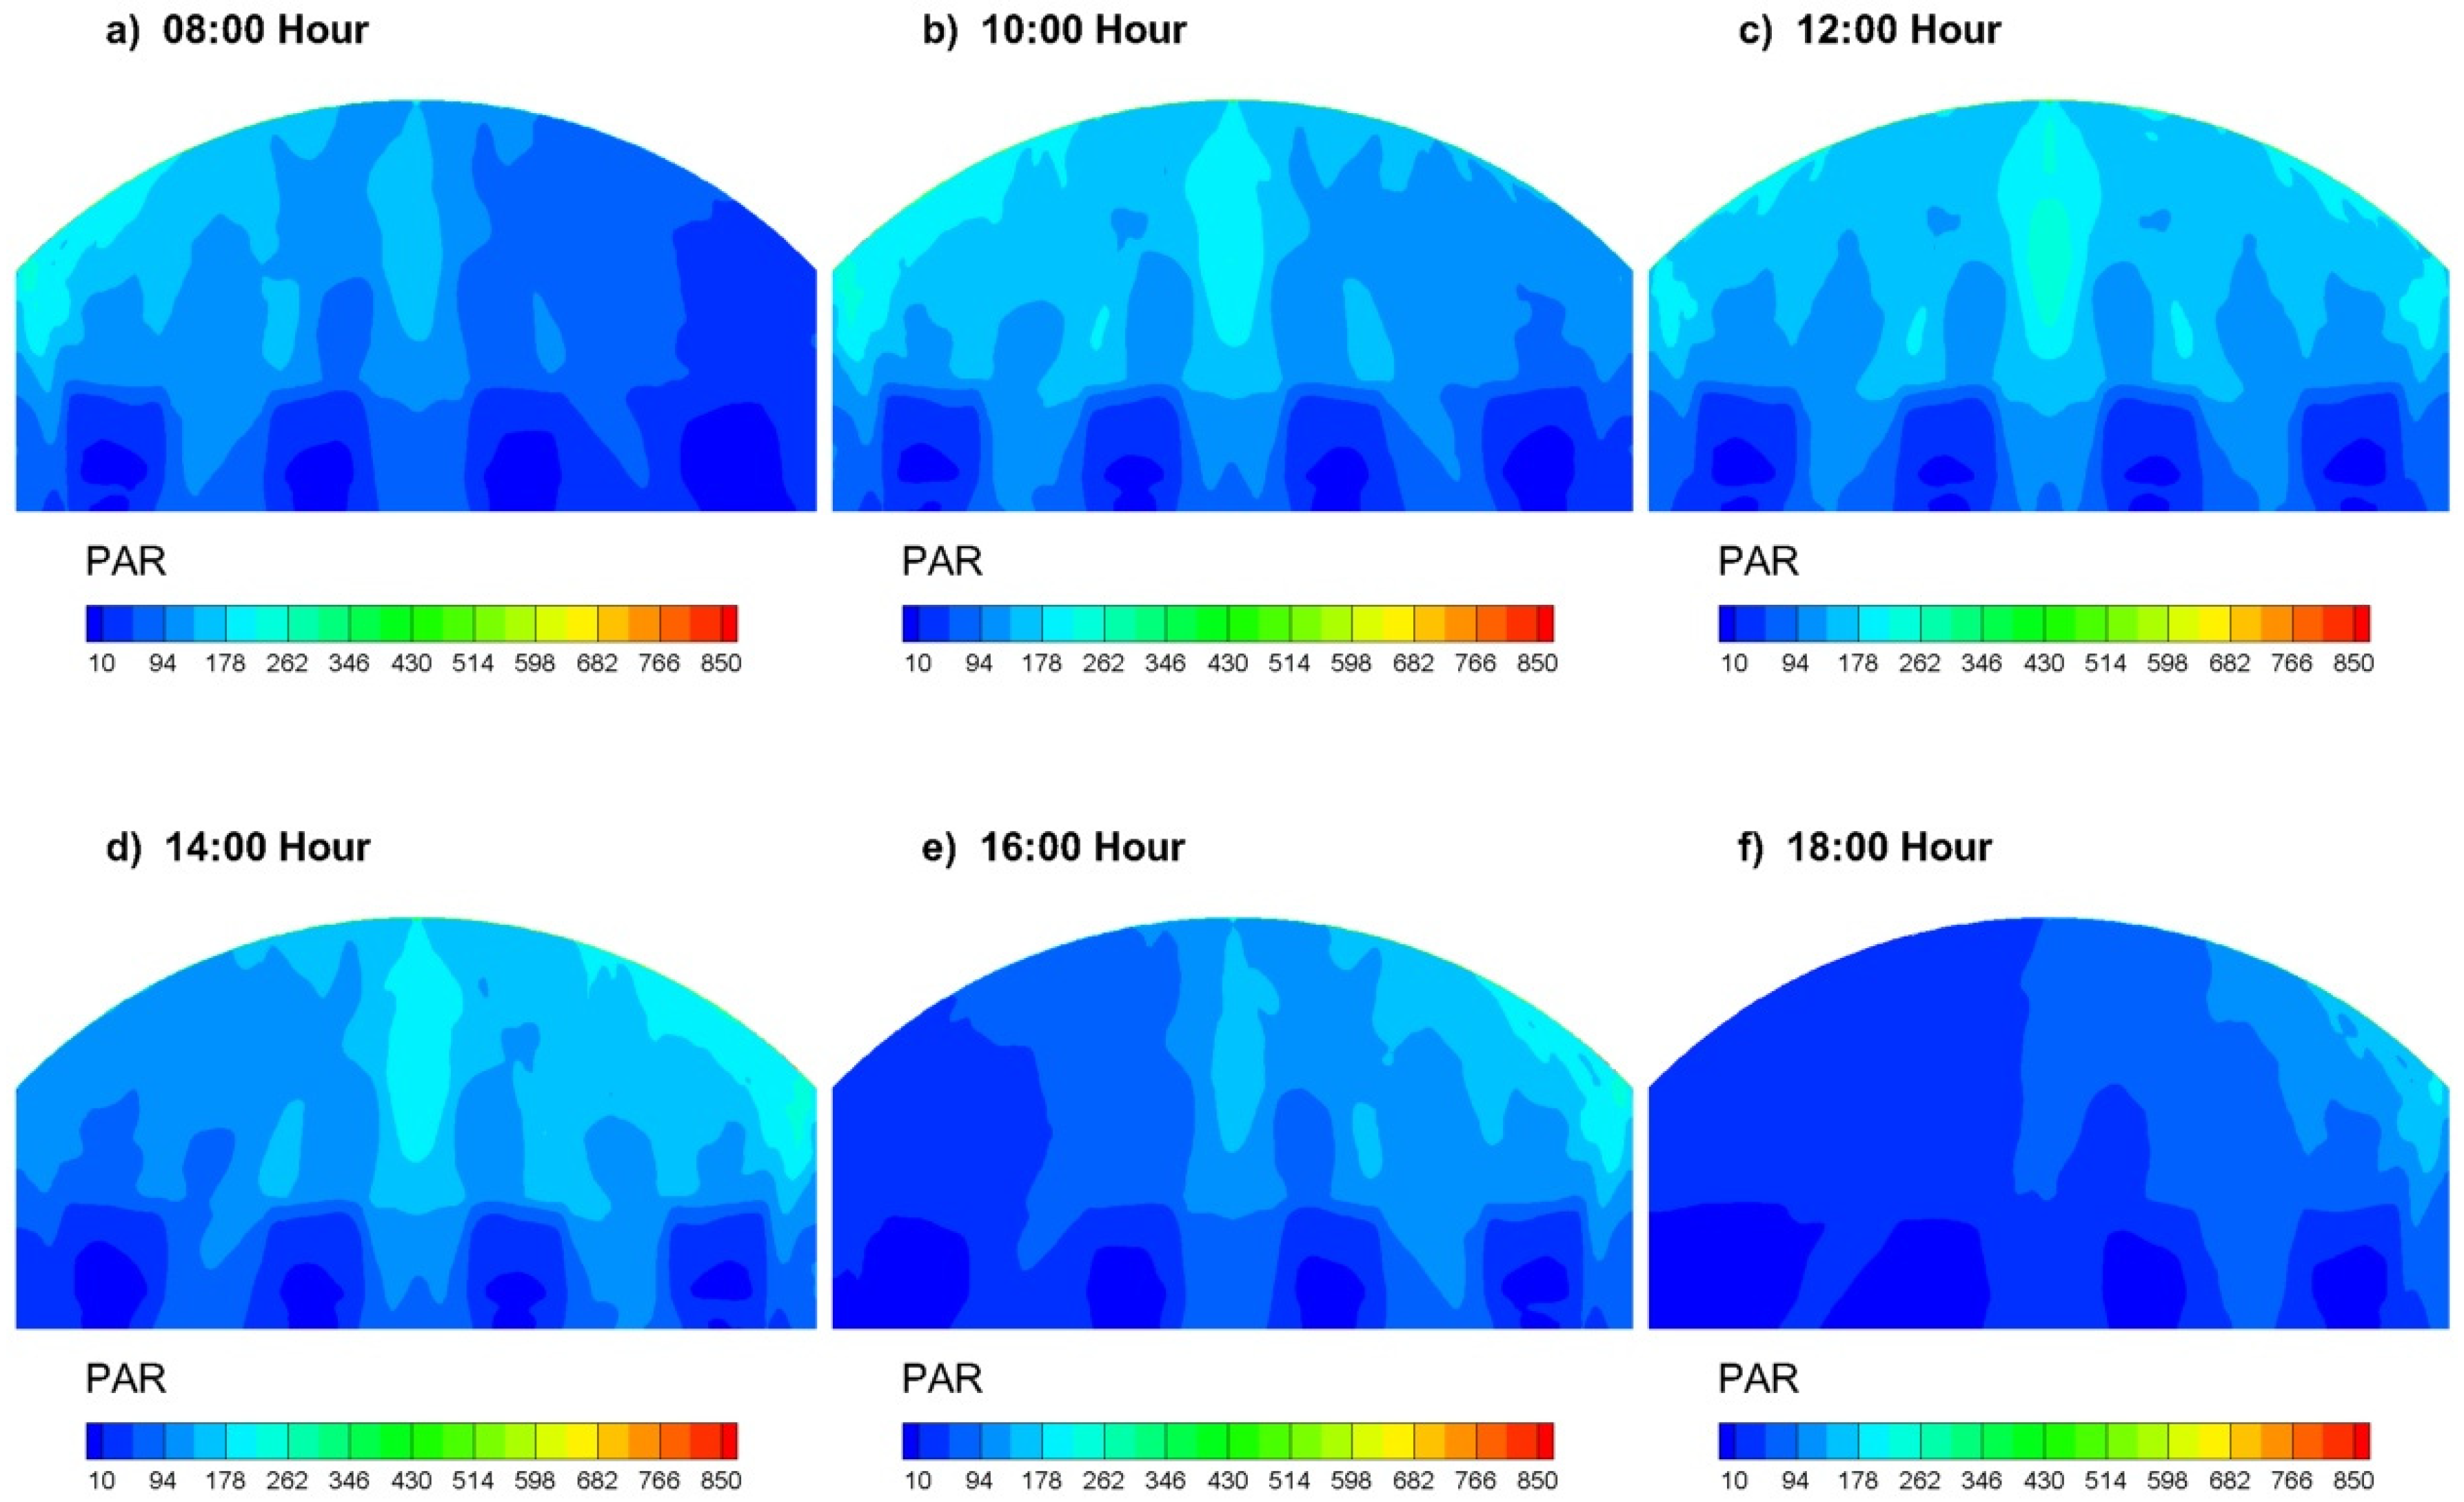
3.2. Average PAR at Plant Level

The daily evolution of the average PAR values at a horizontal level 10 cm above the crop is given in Figure 7a–h for eight indicative days of the year. Five lines are given in each graph, corresponding to (i) τn,PAR = 30% (green line continuous), (ii) τn,PAR = 45% (red dashed line), (iii) τn,PAR = 60% (brown dot-dashed line), (iv) τn,PAR = 89%—bare cover (black dotted line), and (v) PAR incident to a horizontal surface in open field (blue continuous line with blue circles).
It can be seen that for the region of Thessaly in Central Greece (the region of the case studies considered) the outside incident PAR had a maximum value of about 125 W m−2 during 21 December (date with the lowest radiation level among the dates studied) and of about 340 W m−2 during 21 June (date with the highest radiation level among the dates studied). The corresponding values for the case of the greenhouse covered with a bare PE film are 100 W m−2 and 270 W m−2, respectively.
The daily PAR solar energy at plant level for the examined days and for the examined cover/PV combinations is given in Table 9. The values given in parenthesis correspond to the daily average greenhouse transmission to PAR.
The most commonly grown species in greenhouses are vegetables with medium thermal requirements (tomato, pepper, cucumber, melon, watermelon, marrow, green bean, eggplant); the aim is to extend the growing calendars beyond the conventional open-air cultivation season, and thus increase profitability. Tomato cultivation requires high solar radiation levels, but there are other crops that do not need so much sunlight for proper growth. PAR light may not be considered as a limiting growth factor for a tomato crop at levels greater than 200 W m−2. Of course, optimal light levels are difficult to define since the crop productivity is also related to many other parameters like air temperature, relative humidity, and CO2 concentration [29]. Considering the above threshold for solar radiation and taking into account the results presented in Figure 7, it can be seen that the PAR levels inside the PE-covered greenhouse without integrated OVPs were higher than the above radiation level for a long part of the day from April to September, while for the other months studied, the radiation levels were lower than 200 Wm−2. In addition, in all the case studies with different OPV/PE combinations, the PAR levels estimated are lower than 200 W m−2.
Nevertheless, since it is not only the intensity of radiation but also the duration of the lighting period that plays a significant role, the solar radiation integral value will have to be taken into account. Furthermore, the fraction of diffuse to total light plays a significant role, since higher diffuse ratios result in higher radiation use efficiency. The minimum levels of the daily total solar radiation integral requirements of the above species are estimated at around 8.5 MJ m−2 d−1 (which is equivalent to about 4.05 MJ m−2 d−1 of PAR) [30]).
The reduction observed to the mean daily PAR radiation integral (Table 9) due to the presence of the OPVs for the cases with normal PAR transmittance of 30%, 45%, and 60% in relation to the bare PE was 77%, 66%, and 52%, respectively. Considering the threshold of 4 MJ m−2 d−1 and the results presented in Table 9, it can be seen that only the case of the OPV/PE combination that results in normal τn,PAR of 60% can satisfy this threshold for the period between May to September. The rest of the OPV/PE combinations result in a daily PAR radiation integral lower than this threshold all year round.
Another important finding presented in Table 9 is that although the daily average greenhouse transmission to PAR simulated for the case of the PE-covered greenhouse without integrated OVPs (87%) was close to the normal PAR transmission value given for this case (89%). The simulated values estimated for the other cases were significantly lower than the normal PAR transmission of each case. More specifically, the daily average greenhouse transmission to PAR simulated for the cases of combinations OPV/cover that correspond to normal transmittance in the PAR spectrum equal to 30%, 45%, and 60% were 19%, 29%, and 41%, respectively. The respective difference between the normal PAR transmission and the simulated daily average greenhouse transmission to PAR for the cases of OPV/cover combinations with normal PAR transmittance of 30%, 45%, 60%, and 89% were 36%, 35%, 31%, and 6%, respectively. This nonlinearity is due, on the one hand, to the logarithmic relation that links transmissivity to the extinction coefficient and to the light path length [20] and, on the other hand, to the fact that the average equivalent transmissivity is the result of reflections within the interior of the greenhouse. The above difference was lower during the period from September to December for almost all the OPVs/PE combinations studied. This is in agreement with the measurements presented by [8] who showed that the lowest difference was found in December, and it increased during the rest of the year until reaching the maximum in June and July. In practice, the overall greenhouse transmissivity is lower than the normal transmission value declared for the cover material due to factors such as shading of the structural elements of the roof, dust, and the angle of incidence of the sunrays, which is always different from the perpendicular rays used by manufacturers to test the transmissivity of their materials [31,32]. In addition, the results presented in [8], which studied the propagation of solar radiation in a greenhouse with south-oriented photovoltaic roofs, showed that the solar radiation measured below the photovoltaic roof consists only of diffuse radiation.

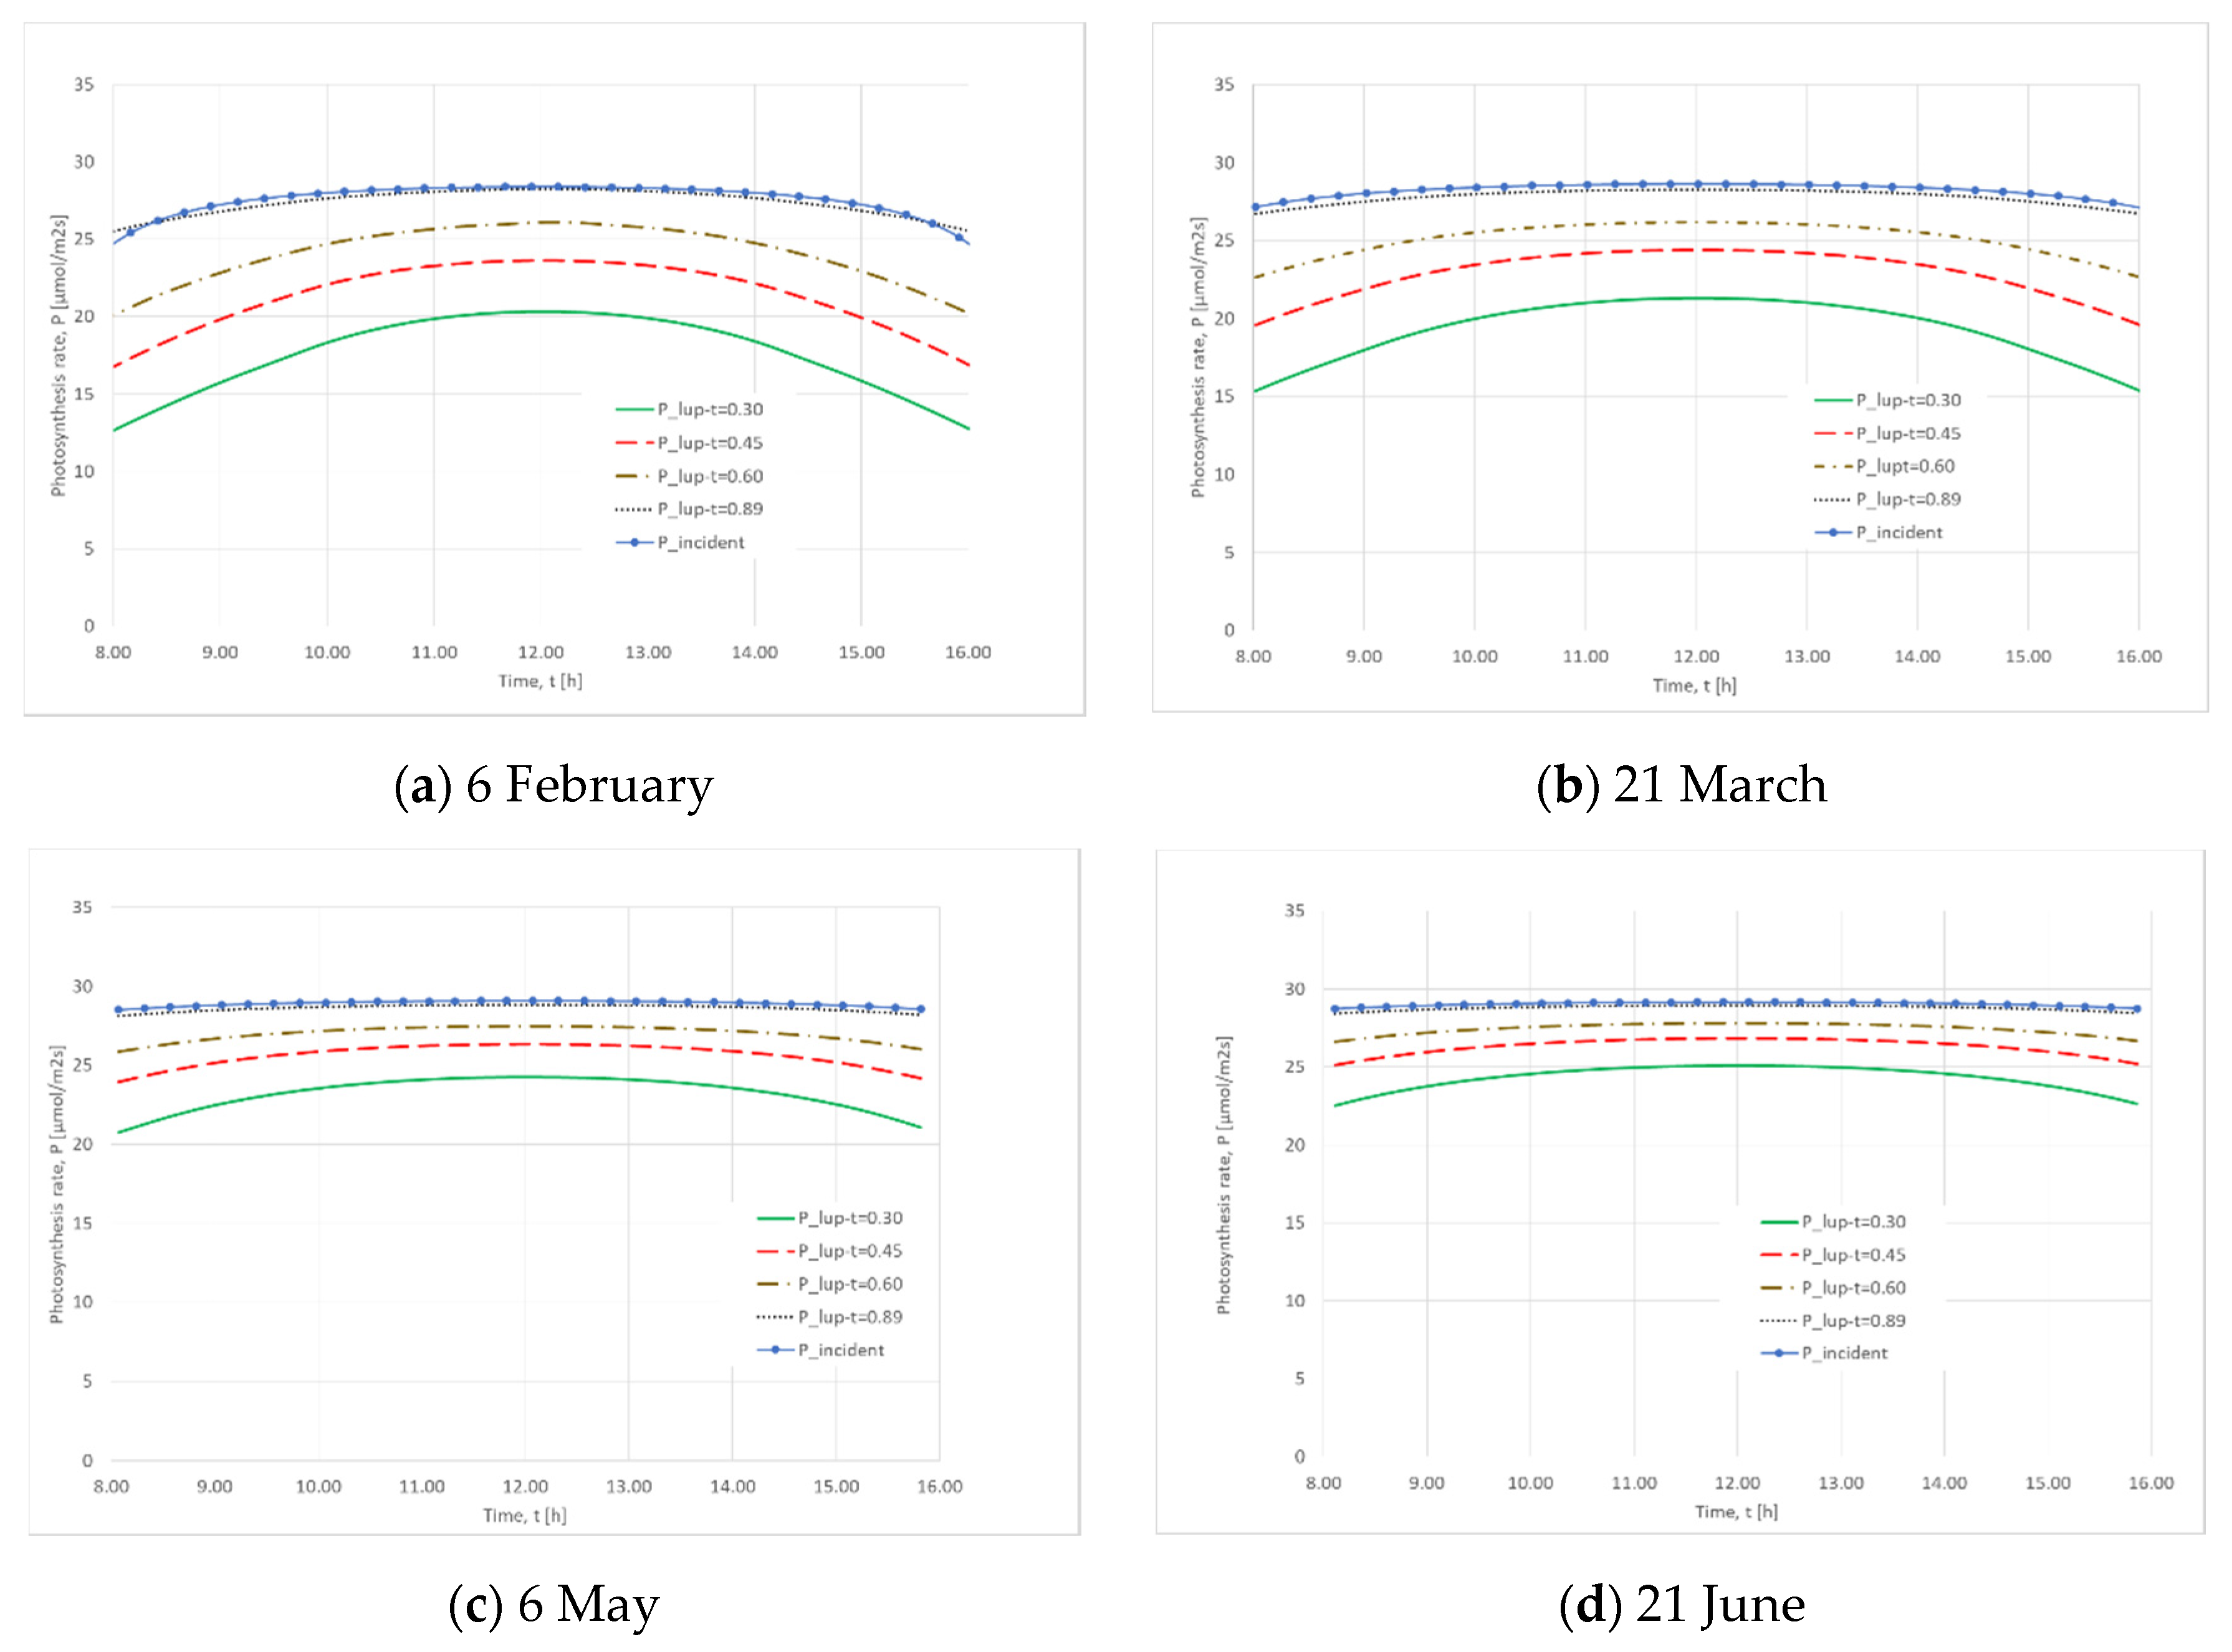
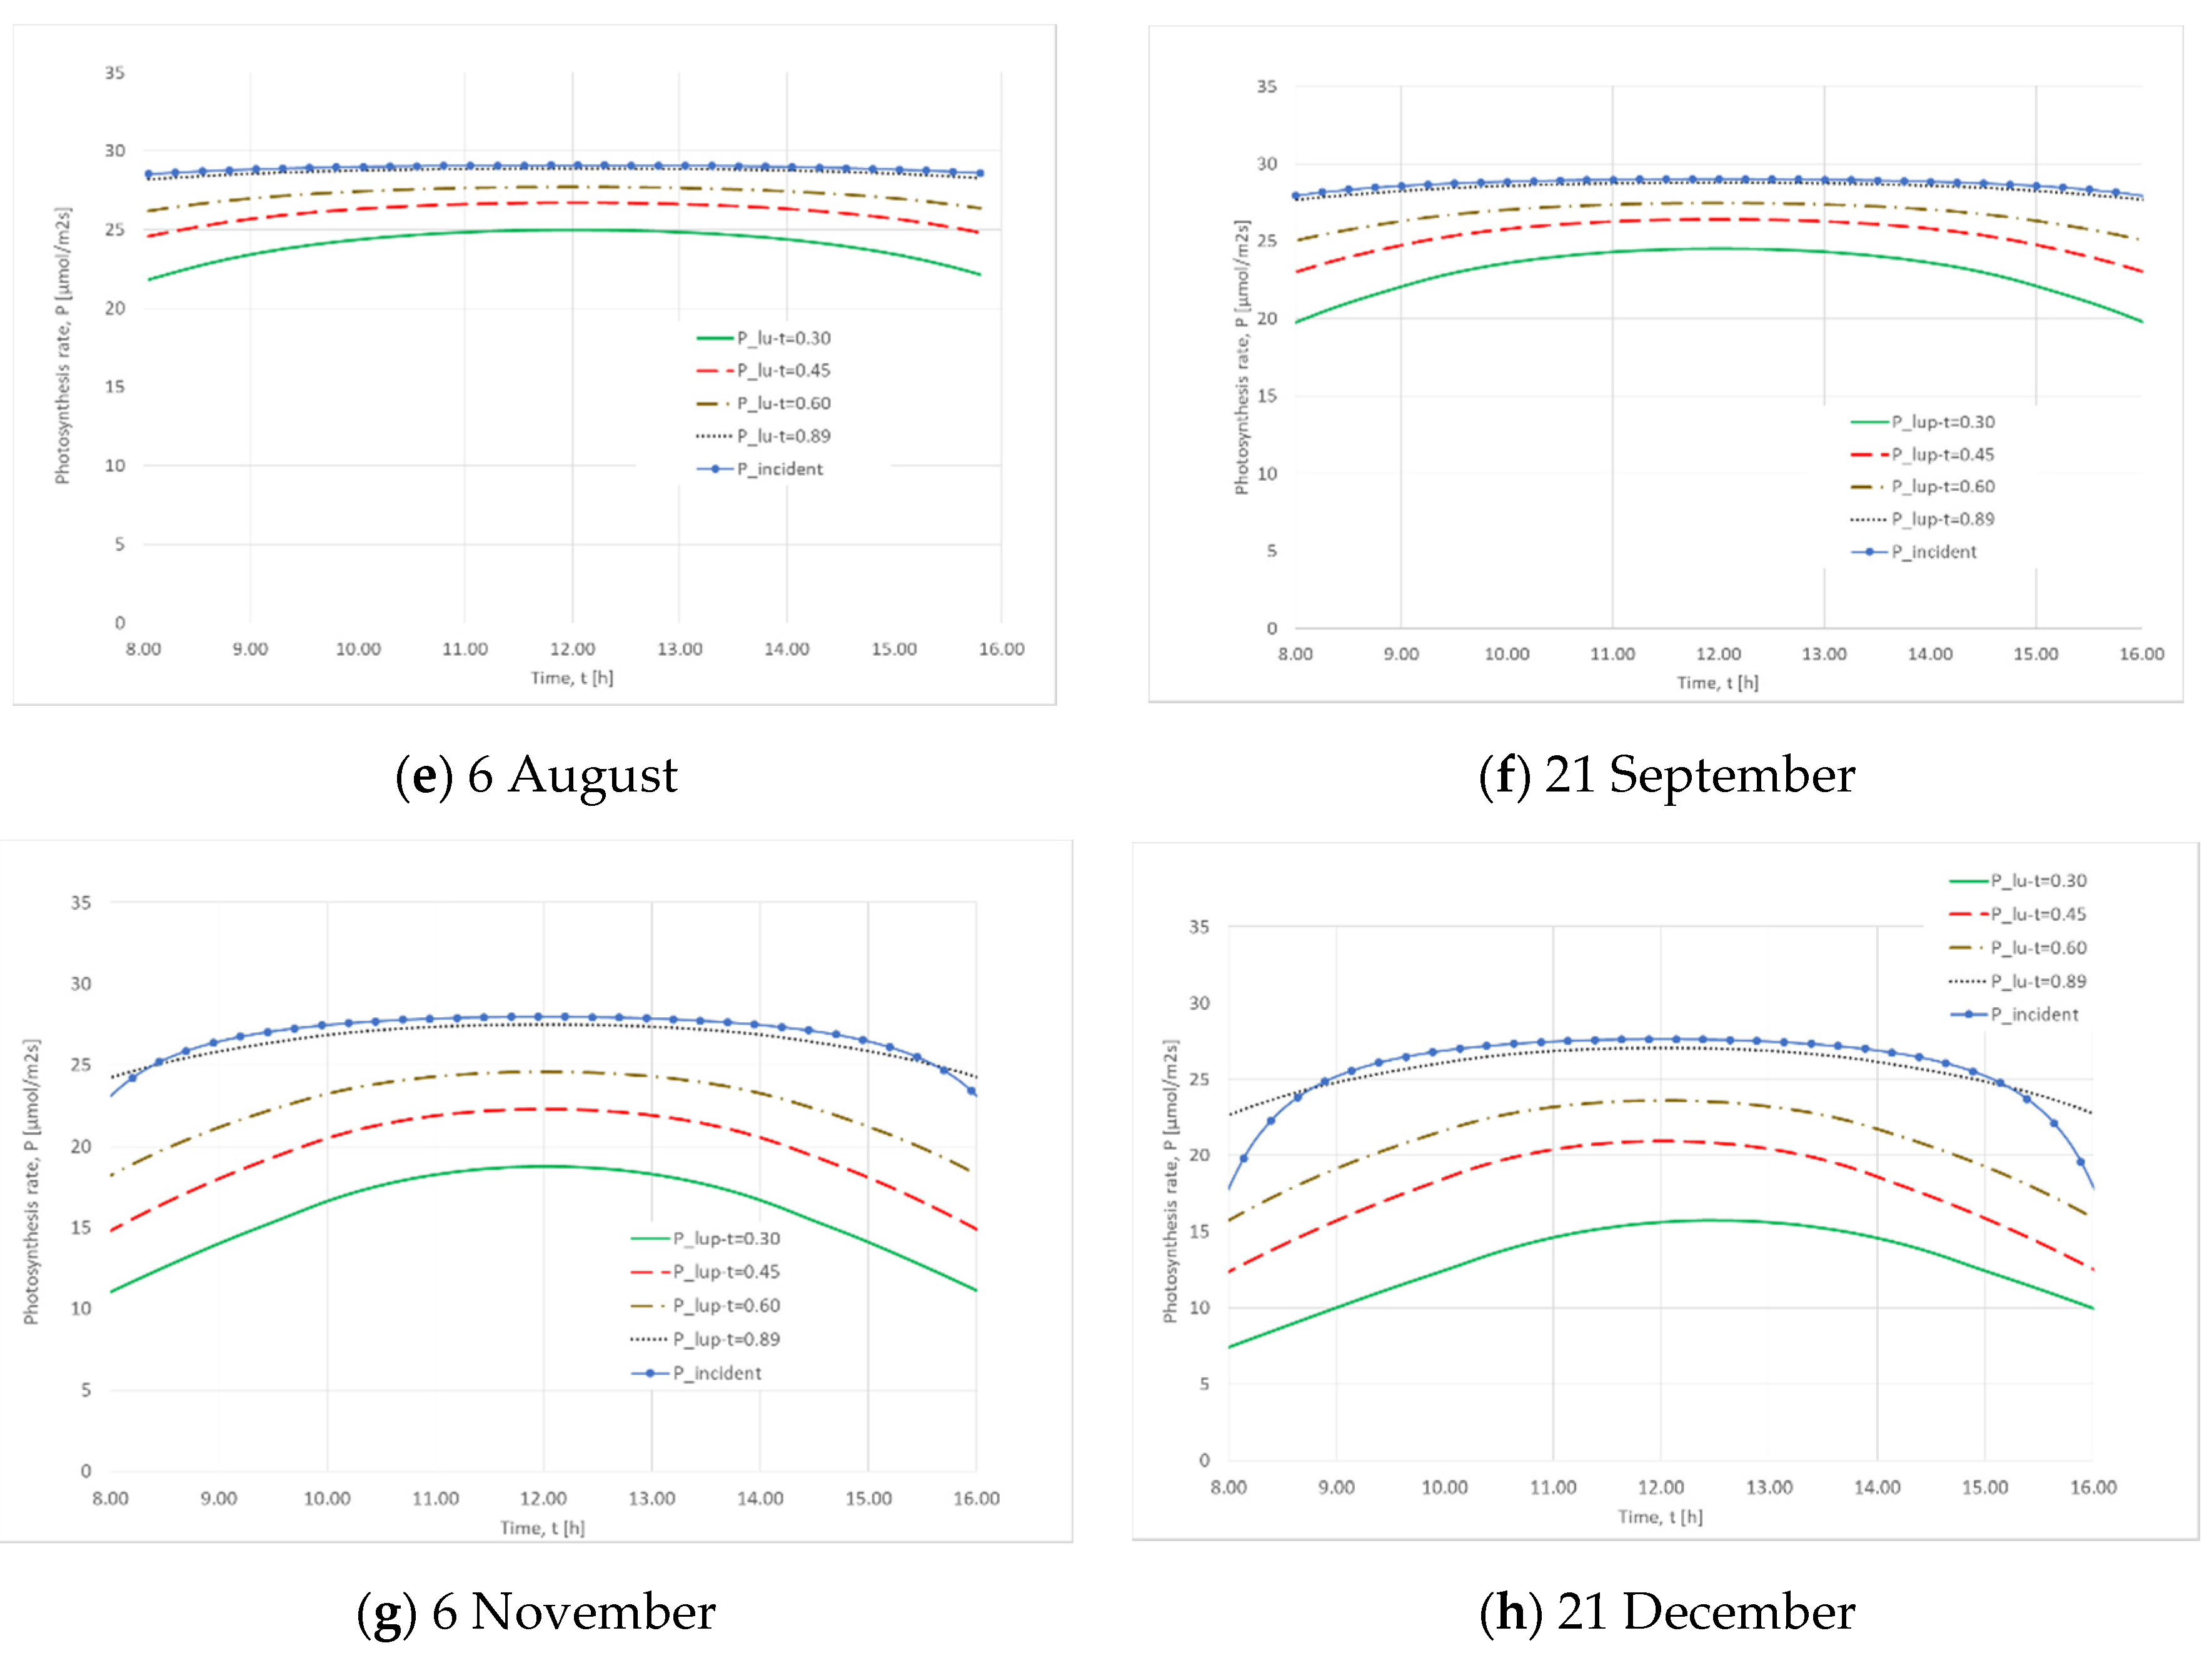
3.3. Average Photosynthesis Rate at Plant Level

In the same way, Figure 8a–h presents the evolution of average photosynthesis rate in a line 10 cm above the plants during the day, for eight indicative days of the year. Again, in each graph, five lines are given corresponding to (i) τn,PAR = 30% (green line continuous), (ii) τn,PAR = 45% (red dashed line), (iii) τn,PAR = 60% (brown dot-dashed line), (iv) τn,PAR = 89%—bare cover (black dotted line), and (v) photosynthesis rate in open field (blue continuous line with blue circles). It should be noted that in the current simulation the side walls are considered opaque and the radiation enters the domain only through the arched roof.
The daily photosynthesis rate at the plant level is given for the examined days and for the examined cover/PV combinations is given in Table 10.
The year-round mean values of the daily average photosynthesis rate simulated for the cases of OPV/cover combinations with normal PAR transmission of 30%, 45%, 60%, and 89% were 18.1, 21.3, 23.7, and 27.1, respectively. Based on the above findings, it could be seen that the reduction observed in the mean daily average photosynthesis rate (Table 10) due to the presence of the OPVs for the cases with normal PAR transmittance of 30%, 45%, and 60% in relation to the bare PE was 33%, 21%, and 12%, respectively. Similar results were also observed in the reduction of the cumulative daily photosynthesis rate.
The results of a literature survey [33] showed that a 1% radiation reduction results in a 0.6% to 1.1% yield reduction in tomato crop, whereas interviews held with growers indicated values between 0.7% and 1.0%. It is difficult to survey the growth and yield reduction. Shading of a crop at high light intensities only slightly reduces photosynthesis of the upper leaves in the light saturation range. On the other hand, shading at low light intensities may change the net photosynthesis from positive to negative values, especially for the lower leaves. Accordingly, it could be also stated that photosynthesis is significantly affected by shading mainly in regions or periods with low radiation levels.
Kläring and Krumbein (2013) [34] studied the response of tomato to constraining the intensity of solar radiation. They found that although they reduced the PAR radiation by 57% and 34%, the measured plant dry matter increment decreased only by 31% and 19%, respectively, that is, light use efficiency increased markedly. This indicates a strong adaptation of the plant’s metabolism to cope with the limitation in light availability such as increasing the specific leaf area and reducing respiration.
Excessive solar reduction caused by high shading rates can decrease the total and marketable yield of tomato grown in a greenhouse [35]. In contrast, light to moderate shading does not affect total and marketable yield [36,37] and can even improve production under warm growing conditions and high solar radiation [35,38].
Aroca-Delgado et al. (2019) [39] found no differences in the total or cumulative marketable yield associated with the use of shading of 9.8% by photovoltaic panels.
There are other crops that do not need so much sunlight for proper growth. Examples of this, and their interaction with semitransparent PV solar panels on the greenhouse roofs, have been described in [40]. In addition [41], in strawberry and raspberry cultivation, concluded that the parameters of fruit quality (sugars, anthocyanins, phenols, organic acids, etc.) are not affected by the shading of solar panels on the greenhouse roof. Moreover, tests with PV panels on the greenhouse roof (20%) in pepper cultivation have been described in [42]. These authors concluded that the quality of the pepper fruit is not affected.

3.4. Power Production

Two challenges are faced when calculating the power production from OPV panels incorporated in an arched greenhouse. The first challenge concerns the arched section geometry since each point of a section of the roof has a different inclination angle. Consequently, the energy production of the entire panel surface will be determined by the cell with the worst inclination depending on the internal inter-connection. This challenge was treated with the choice of narrow OPV panels (0.15 × 0.82 m) arranged along the main greenhouse axis in such a way that each panel traversed only 0.15 m across the cross-section. In this way the inclination angles of the beginning and the end differ only by 1.54° allowing us to consider for each panel an average inclination angle. The OPV electrical characteristics are Voc = 6 V, Isc = 1 A, Vmp = 4.3 V, Imp = 0.9 A.
The second challenge concerns the choice of inverter due to the low Vmp and power which prevents them to collaborate with the majority of existing inverters who have a voltage threshold in the order of 250 V or higher. This challenge was treated with the choice of a mini inverter with power threshold 3 W and minimum MPP voltage 28 V, considering appropriate panel interconnection. This way, the yearly power production from the OPV in the greenhouse roof per greenhouse meter was calculated for the whole section and is presented in Table 11 for the three examined cases. For the calculation, the overall temperature coefficient was considered 0.02%/°C [12]. In the same table, the primary energy and CO2 saving offered by the PV are presented considering that electrical power is replaced.
Nevertheless, the design of a PV system incorporated in an arched greenhouse in terms of its environmental footprint depends on many factors, including the type of the crop, the greenhouse operating strategy, and the size of the greenhouse, which affect the yearly power demand profile and the available roof area.

4. Conclusions

The effect of three different densities of semitransparent organic photovoltaics (OPV) integrated on the polyethylene cover located on the roof of an arched greenhouse on the PAR radiation levels entering the greenhouse and the photosynthesis rate were studied using computational fluid dynamics (CFD). The studied combinations of OPVs/PE cover corresponded to a normal PAR transmittance of 30%, 45%, and 60%. The results were compared with those obtained for a greenhouse covered with PE film (without OPVs) with a normal PAR transmittance of 89%. Considering a threshold of 4 MJ m−2 d−1 of PAR as the minimum level of the daily total solar radiation integral requirements of several greenhouse species, it was found that only the case of the OPV/PE combination with normal PAR transmittance of 60% could satisfy this threshold for the period between May to September. It has to be noted that this OPV/PE combination corresponds to 47% coverage of the greenhouse roof by semi-transparent OPVs. The rest of the OPV/PE combinations result in a daily PAR radiation integral lower than this threshold all year round. The reduction observed in the mean daily PAR radiation integral for the cases with normal PAR transmittance of 30%, 45%, and 60% in relation to the bare PE was 77%, 66%, and 52%, respectively, while the respective simulated reduction to the daily average photosynthesis rate was 33%, 21%, and 12%, respectively. Finally, the yearly power production from the OPV per greenhouse length meter for the cases with normal PAR transmittance of 30%, 45%, and 60% was 323, 242, and 158 kWh m−1 y−1, respectively. The results of this work could be further used for the optimization of greenhouse design for maximizing the PAR at the crop level.

Author Contributions

Conceptualization, N.K.; methodology, N.K., C.B. and D.F.; formal analysis, C.B., D.F. and N.K.; data curation, C.B. and D.F.; writing—original draft preparation, C.B.; writing—review and editing, N.K., E.M., C.V., A.Z., S.L.; supervision, N.K.; project administration, N.K.; funding acquisition, N.K. and S.L. All authors have read and agreed to the published version of the manuscript.

Funding

This research has been co-financed by the European Union and Greek national funds through the Operational Program Competitiveness, Entrepreneurship and Innovation, under the call RESEARCH—CREATE—INNOVATE (project code: T1EDK-01701).

Conflicts of Interest

The authors declare no conflict of interest.

Abbreviations

2Dtwo-dimensional
CFDcomputational fluid dynamics
DOdiscrete ordinates
IRinfra-red
MUSCLmonotonic upstream-centered scheme for conversation laws
NIRnear infra-red
OPVorganic photovoltaic
PARphotosynthetically active radiation
PEpolyethylene
PVphotovoltaic
QUICKquadratic upstream interpolation for convective kinematics
RANSReynolds-averaged Navier–Stokes
SIMPLEsemi-implicit method for pressure-linked equations
SOUsecond-order upwind
UVultra-violet

References

  1. Hassanien, R.H.E.; Li, M.; Yin, F. The integration of semi-transparent photovoltaics on greenhouse roof for energy and plant production. Renew. Energy 2018, 121, 377–388. [Google Scholar] [CrossRef]
  2. Yano, A.; Furue, A.; Kadowaki, M.; Tanaka, T.; Hiraki, E.; Miyamoto, M.; Ishizu, F.; Noda, S. Electrical energy generated by photovoltaic modules mounted inside the roof of a north-south oriented greenhouse. Biosyst. Eng. 2009, 103, 228–238. [Google Scholar] [CrossRef]
  3. Kadowaki, M.; Yano, A.; Ishizu, F.; Tanaka, T.; Noda, S. Effects of greenhouse photovoltaic array shading on Welsh onion growth. Biosyst. Eng. 2012, 111, 290–297. [Google Scholar] [CrossRef]
  4. Yano, A.; Kadowaki, M.; Furue, A.; Tamaki, N.; Tanaka, T.; Hiraki, E.; Kato, Y.; Ishizu, F.; Noda, S. Shading and electrical features of a photovoltaic array mounted inside the roof of an east-west oriented greenhouse. Biosyst. Eng. 2010, 106, 367–377. [Google Scholar] [CrossRef]
  5. Trypanagnostopoulos, G.; Kavga, A.; Souliotis, M.; Tripanagnostopoulos, Y. Greenhouse performance results for roof installed photovoltaics. Renew. Energy 2017, 111, 724–731. [Google Scholar] [CrossRef]
  6. Yano, A.; Onoe, M.; Nakata, J. Prototype semi-transparent photovoltaic modules for greenhouse roof applications. Biosyst. Eng. 2014, 122, 62–73. [Google Scholar] [CrossRef] [Green Version]
  7. Hassanien, R.H.E.; Li, M. Influences of greenhouse-integrated semi-transparent photovoltaics on microclimate and lettuce growth. Int. J. Agric. Biol. Eng. 2017, 10, 11–22. [Google Scholar] [CrossRef] [Green Version]
  8. Cossu, M.; Murgia, L.; Ledda, L.; Deligios, P.A.; Sirigu, A.; Chessa, F.; Pazzona, A. Solar radiation distribution inside a greenhouse with south-oriented photovoltaic roofs and effects on crop productivity. Appl. Energy 2014, 133, 89–100. [Google Scholar] [CrossRef]
  9. Marrou, H.; Dufour, L.; Wery, J. How does a shelter of solar panels influence water flows in a soilecrop system? Eur. J. Agron. 2013, 50, 38–51. [Google Scholar] [CrossRef]
  10. Friman Peretz, M.; Geoola, F.; Yehia, I.; Ozer, S.; Levi, A.; Magadley, E.; Brikman, R.; Rosenfeld, L.; Levy, A.; Kacira, M.; et al. Testing organic photovoltaic modules for application as greenhouse cover or shading element. Biosyst. Eng. 2019, 184, 24–36. [Google Scholar] [CrossRef]
  11. Teranaka, K.; Ikeda, T.; Doi, M. Simulation of seasonal changes in radiant flux energy in a greenhouse installed with light-transmitting organic photovoltaics. Acta Hortic. 2018, 1208, 339–346. [Google Scholar] [CrossRef]
  12. Okada, K.; Yehia, I.; Teitel, M.; Kacira, M. Crop production and energy generation in a greenhouse integrated with semi-transparent organic photovoltaic film. Acta Hortic. 2018, 1227, 231–239. [Google Scholar] [CrossRef]
  13. Baxevanou, C.; Fidaros, D.; Bartzanas, T.; Kittas, C. Yearly numerical evaluation of greenhouse cover materials. Comput. Electron. Agric. 2018, 149, 54–70. [Google Scholar] [CrossRef]
  14. Baxevanou, C.; Fidaros, D.; Bartzanas, T.; Kittas, C. Numerical simulation of solar radiation, air flow and temperature distribution in a naturally ventilated tunnel greenhouse. Agric. Eng. Int. CIGR J. 2010, 12, 48–67. [Google Scholar]
  15. Fidaros, D.K.; Baxevanou, C.A.; Bartzanas, T.; Kittas, C. Numerical simulation of thermal behavior of a ventilated arc greenhouse during a solar day. Renew. Energy 2010, 35, 1380–1386. [Google Scholar] [CrossRef]
  16. Launder, B.E.; Spalding, D.B. The numerical computation of turbulent flows. Comput. Methods Appl. Mech. 1974, 3, 269–289. [Google Scholar] [CrossRef]
  17. Ferziger, J.H.; Peric, M. Computational Methods for Fluid Dynamics; Springer: London, UK, 1996. [Google Scholar]
  18. Raithby, G.D.; Chui, E.H. A Finite-Volume Method for predicting a Radiant Heat Transfer in Enclosures with Participating Media. J. Heat Trans-Trans ASME 1990, 112, 415–423. [Google Scholar] [CrossRef]
  19. Kim, S.H.; Huh, K.Y. A new angular discretization scheme of the finite volume method for 3-D radiative heat transfer in absorbing, emitting and anisotropically scattering media. Int. J. Heat Mass Tran. 2000, 43, 1233–1242. [Google Scholar] [CrossRef]
  20. Tamamidis, P.; Assanis, D.N. Evaluation of various high order accuracy schemes with and without flux limiters. Int. J. Numer. Methods Fluids 1993, 16, 931–948. [Google Scholar] [CrossRef]
  21. Leonard, B.P. A stable and accurate convective modelling procedure based on quadratic upstream interpolation. Comput. Methods Appl. Mech. 1979, 19, 59–98. [Google Scholar] [CrossRef]
  22. Van Leer, B. Towards the Ultimate Conservative Difference Scheme, V. A Second Order Sequel to Godunov’s Method. J. Comput. Phys. 1979, 32, 101–136. [Google Scholar] [CrossRef]
  23. Duffie, J.A.; Beckman, W.A. Solar Engineering of Thermal Processes, 3rd ed.; Wiley: Hoboken, NJ, USA, 2006. [Google Scholar]
  24. Higashide, T. Ligth interception by tomato plants (Solanum lycopersicum) grown on a sloped field. Agric. For. Meteorol. 2009, 149, 756–762. [Google Scholar] [CrossRef]
  25. Kichah, A.; Bournet, P.E.; Migeon, C. Measurement and CFD simulations of the transpiration and leaf temperatures of an Impatients pot plant crop in a greenhouse. Biosyst. Eng. 2012, 112, 22–34. [Google Scholar] [CrossRef]
  26. Hubbell, J.H.; Seltzer, S.M. Tables of x-ray mass attenuation coefficients and mass energy absorption coefficients. Nat. Inst. Stand. Techn. NIST Publ. 1995. NISTIR 5632. [Google Scholar]
  27. Mehra, R. Application of refractive index mixing rules in binary systems of hexadecane and heptadecane with n-alkanols at different temperatures. J. Chem. Sci. 2003, 115, 147–154. [Google Scholar] [CrossRef]
  28. Guzzi, R.; Rizzi, R. Water vapor absorption in the visible and near infrared results of field measurement. Appl Opt. 1984, 25, 1853–1861. [Google Scholar] [CrossRef]
  29. Stanghellini, C.; Van’t Ooster, B.; Heuvelink, E. Greenhouse Horticulture: Technology for Optimal Crop Production; Wageningen Academic Publishers: Wageningen, The Netherlands, 2019; p. 311. [Google Scholar]
  30. Nisen, A.; Grafiadellis, M.; Jiménez, R.; La Malfa, G.; Martínez-García, P.F.; Monteiro, A.; Verlodt, H.; Villele, O.; Zabeltitz, C.H.; Denis, J.C.; et al. Cultures Protégées en Climat Mediterraneen; FAO: Rome, Italy, 1988; Volume 90, p. 317. [Google Scholar]
  31. Pieters, J.G.; Deltour, J.M. Modelling solar energy input in greenhouses. Sol. Energy 2000, 67, 119–130. [Google Scholar] [CrossRef]
  32. Teitel, M.; Deriugin, M.; Haslavsky, V.; Tanny, J. Light distribution in multi span gutter-connected greenhouses: Effects of gutters and roof openings. Biosyst. Eng. 2012, 113, 120–128. [Google Scholar] [CrossRef]
  33. Marcelis, L.F.M.; Broekhuijsen, A.G.M.; Meinen, E.; Nijs, E.M.; Raaphorst, M.G.M. Quantification of the growth response to light quantity of greenhouse grown crops. Acta Hortic. 2006, 711, 97–103. [Google Scholar] [CrossRef]
  34. Kläring, H.P.; Krumbein, A. The effect of constraining the intensity of solar radiation on the photosynthesis, growth, yield and product quality of tomato. J. Agron. Crop Sci. 2013, 199, 351–359. [Google Scholar] [CrossRef]
  35. Lorenzo, P.; García, M.L.; Sánchez-Guerrero, M.C.; Medrano, E.; Caparros, I.; Giménez, M. Influence of mobile shading on yield, crop transpiration and water use efficiency. Acta Hortic. 2006, 719, 471–478. [Google Scholar] [CrossRef]
  36. Ureña-Sánchez, R.; Callejón-Ferre, Á.; Pérez-Alonso, J.; Carreño-Ortega, Á. Greenhouse tomato production with electricity generation by roof-mounted flexible solar panels. Sci. Agric. 2012, 69, 233–239. [Google Scholar] [CrossRef]
  37. Ezzaeri, K.; Fatnassi, H.; Bouharroud, R.; Gourdo, L.; Bazgaou, A.; Wifaya, A.; Demrati, H.; Bekkaoui, A.; Aharoune, A.; Poncet, C.; et al. The effect of photovoltaic panels on the microclimate and on the tomato production under photovoltaic canarian greenhouses. Sol. Energy 2018, 173, 1126–1134. [Google Scholar] [CrossRef]
  38. Ahemd, H.A.; Al-Faraj, A.A.; Abdel-Ghany, A.M. Shading greenhouses to improve the microclimate, energy and water saving in hot regions: A review. Sci. Hortic. Amst. 2016, 201, 36–45. [Google Scholar] [CrossRef]
  39. Aroca-Delgado, R.; Pérez-Alonso, J.; Callejón-Ferre, A.J.; Díaz-Pérez, M. Morphology, yield and quality of greenhouse tomato cultivation with flexible photovoltaic rooftop panels (Almería-Spain). Sci. Hortic. 2019, 257, 108768. [Google Scholar] [CrossRef]
  40. Buttaro, D.; Renna, M.; Gerardi, C.; Blando, F.; Santamaria, P.; Serio, F. Soilless production of wild rocket as affected by greenhouse coverage with photovoltaic modules. Acta Sci. Pol. Hortorum Cultus 2016, 15, 129–142. [Google Scholar]
  41. Blando, F.; Gerardi, C.; Renna, M.; Castellano, S.; Serio, F. Characterisation of bioactive compounds in berries from plants grown under innovative photovoltaic greenhouses. J. Berry Res. 2018, 8, 55–69. [Google Scholar] [CrossRef]
  42. Kavga, A.; Strati, I.F.; Sinanoglou, V.J.; Fotakis, C.; Sotiroudis, G.; Christodoulou, P.; Zoumpoulakis, P. Evaluating the experimental cultivation of peppers in lowenergy-demand greenhouses. An interdisciplinary study. J. Sci. Food Agric. 2019, 99, 781–789. [Google Scholar] [CrossRef]
Figure 1. Simulated greenhouse geometry.
Applsci 10 02550 g001
Figure 2. Transparent organic photovoltaic (OPV)/greenhouse cover combinations.
Applsci 10 02550 g002
Figure 3. Photosynthetically active radiation (PAR) isocontours for 21 June and τn,PAR = 30%.
Applsci 10 02550 g003
Figure 4. PAR isocontours for 21 June and τn,PAR =45%.
Applsci 10 02550 g004
Figure 5. PAR isocontours for 21 June and τn,PAR =60%.
Applsci 10 02550 g005
Figure 6. PAR isocontours for 21 June and τn,PAR = 89%—bare PE cover without OPV.
Applsci 10 02550 g006
Figure 7. Average PAR at plant level during the solar day for 8 indicative days of the year. (i) τn,PAR = 30% (green line continuous), (ii) τn,PAR = 45% (red dashed line), (iii) τn,PAR = 60% (brown dot-dashed line), (iv) τn,PAR = 89%—bare cover (black dotted line), and (v) PAR incident to horizontal surface in open field (blue continuous line with blue circles).
Applsci 10 02550 g007aApplsci 10 02550 g007b
Figure 8. Photosynthesis rate at plant level during the solar day for 8 indicative days of the year. (i) τn,PAR = 30% (green line continuous), (ii) τn,PAR = 45% (red dashed line), (iii) τn,PAR = 60% (brown dot-dashed line), (iv) τn,PAR = 89%—bare cover (black dotted line), and (v) photosynthesis rate in open field (blue continuous line with blue circles).
Applsci 10 02550 g008aApplsci 10 02550 g008b
Table 1. Optical properties of OPV structure Ι.
SpectrumρI—Reflectance [%]τI—Transmittance [%]αI—Absorptance [%]
UV (100–400 nm)13.20.686.2
PAR (400–700 nm)16.419.464.2
NIR (700–1400 nm)40.229.230.6
IR (1400–100,000 nm)67.711.021.3
Table 2. Optical properties of OPV structure ΙΙ.
SpectrumρII—Reflectance [%]τII—Transmittance [%]αII—Absorptance [%]
UV (100–400 nm)13.46.979.7
PAR (400–700 nm)19.868.511.7
NIR (700–1400 nm)38.051.610.4
IR (1400–100,000 nm)55.631.512.9
Table 3. Optical properties of polyethylene cover.
Spectrumρc—Reflectance [%]τc—Transmittance [%]αc—Absorptance [%]
UV (100–400 nm)6.428.065.6
PAR (400–700 nm)10.088.91.1
NIR (700–1400 nm)8.890.60.7
IR (1400–100,000 nm)7.688.04.4
Table 4. Optical properties for the combination of structure I/polyethylene (PE) cover.
SpectrumρI/c—Reflectance [%]τI/c—Transmittance [%]αI/c—Absorptance [%]
UV (100–400 nm)13.20.286.6
PAR (400–700 nm)16.817.565.7
NIR (700–1400 nm)41.027.431.6
IR (1400–100,000 nm)14.560.125.4
Table 5. Optical properties for the combination of structure II/PE cover.
SpectrumρII/c—Reflectance [%]τII/c—Transmittance [%]αII/c—Absorptance [%]
UV (100–400 nm)13.41.984.6
PAR (400–700 nm)24.662.213.3
NIR (700–1400 nm)40.448.311.2
IR (1400–100,000 nm)52.428.818.8
Table 6. Thermal and optical properties of the rest greenhouse materials considered in the simulations.
PropertyGroundTomato Solid PartTomato Fluid Part [24,25]Air
Absorption coef, αs [1/m] *10,000/10,000/10,000/10,0001.23 (for thickness 0.5 m)3.075/3.075/7.5/7.50.000582/0.000582/0.0015/0.0015
Refractive index, n *1.92/1.82/2.03/2.032.772.69/2.69/1.58/1.581.009
Density, ρ [kg m−3]1300700Boussinesq (1.225)Boussinesq (1.225)
Thermal conductivity, k, [W m−1 K−1]10.1730.02420.0242
Emissivity 0.920.50.003430.9
Scattering coefficient−100.461.7894 × 10−50.15
Specific heat capacity, Cpef [J kg−1 K−1]800213010061.7894 × 10−5
Table 7. Climatic data parametric investigation.
DayMonthly Average Day Temperature [°C]Monthly Average Air Velocity [m s−1]Monthly Average Minimum Temperature [°C]Monthly Average Maximum Temperature [°C]Monthly Average Total Solar Radiation in Horizontal Plane [kWh m−2]Monthly Average Diffusive Radiation [kWh m−2]
6 February9.12.93.512.374.330.9
21 March11.32.74.914.4112.549.1
6 May20.92.412.224189.782.1
21 June25.92.816.429212.786.1
6 August27.72.818.730.8195.173.5
21 September23.72.615.727.1146.854.7
6 November13.52.38.216.863.124.8
21 December9.42.74.512.551.520.5
Table 8. Examined OPV/cover combinations.
Normal PAR Transmittance OPV/PE Cover [%]Structure I/PE Cover [%]Structure II/PE Cover [%]Bare PE Cover [%]Installed PV Power [W/m]
τn,PAR = 30%9675214278
τn,PAR = 45%72561628209
τn,PAR = 60%47371053136
τn,PAR = 89%0001000
Table 9. Daily cumulative PAR solar energy at plant level and daily average greenhouse transmission to PAR (in parentheses) for the different OPV/PE combinations studied.
DayPAR Energy at Plant Level [MJ m−2d−1] and Greenhouse Transmission Coefficient to PAR
τn,PAR = 30%τn,PAR = 45%τn,PAR = 60%τn,PAR = 89%
6 February0.84 (0.19)1.25 (0.28)2.13 (0.46)4.48 (0.88)
21 March1.08 (0.18)1.64 (0.27)2.33 (0.38)4.92 (0.81)
6 May1.84 (0.18)2.66 (0.27)3.79 (0.39)8.25 (0.81)
21 June2.20 (0.19)3.28 (0.29)4.59 (0.40)9.38 (0.82)
6 August2.09 (0.20)3.09 (0.29)4.29 (0.41)8.64 (0.82)
21 September1.67 (0.20)2.45 (0.30)3.40 (0.42)6.79 (0.83)
6 November0.71 (0.20)1.05 (0.30)1.46 (0.42)2.96 (0.85)
21 December0.50 (0.18)0.82 (0.30)1.14 (0.42)2.34 (0.87)
Table 10. Daily photosynthesis rate at plant level.
DayDaily Average [in μmol m−2d−1] and Cumulative [in Parenthesis, in 103 μmol m−2d−1] Photosynthesis Rate Values
τn,PAR = 30%τn,PAR = 45%τn,PAR = 60%τn,PAR = 89%
6 February17.71 (580)21.45 (713)24.04 (851)26.74 (962)
21 March19.41 (717) 22.95 (870)25.15 (977)27.83 (1122)
6 May23.20 (996)25.63 (1073)27.02 (1178)28.64 (1358)
21 June24.29 (1071)26.30 (1197)27.43 (1275)28.80 (1373)
6 August24.06 (1045)26.10 (1174)27.28 (1256)28.70 (1363)
21 September23.09 (877)25.41 (990)26.78 (1062)28.46 (1157)
6 November16.04 (523)19.85 (655)22.63 (756)26.53 (910)
21 December13.09 (399)17.97 (549)21.05 (647)25.74 (801)
Table 11. Yearly power production per greenhouse length meter.
PAR normal transmittance, τn [-]30%45%60%
Power generation [kWh m−1 y−1]323242158
Primary electrical energy saving [kWh m−1 y−1]937702458
CO2 reduction [kg m−1 y−1]319239156

