1. Introduction
Stone mastic asphalt (SMA) is widely used in pavement engineering owing to its good road performance [
1,
2]; however, with an increase in traffic, vehicle load, and occurrence of extreme weather events has increased the number of cracks, ruts, oil flooding and water seepages onto SMA pavements [
3]. At present, SMA mixtures are widely designed by the Marshall method or superpave gyratory compaction (SGC) method. However, long-term engineering experience has found that the Marshall method achieves low compaction standards and is difficult to adapt to modern transportation [
4]. Many researchers have proposed increasing the number of blows, but the hammer compaction largely affects the aggregate grading, and the aggregates are easily crushed during compaction, thereby reducing the correlation between the mechanical properties of the test specimen and the pavement core. The problems caused by increasing the number of blows are especially prominent in skeleton structure mixtures such as SMA. Crushing the coarse aggregates of the SMA mixture not only changes the gradation, but also affects the skeleton structure of the mixture and reduces its structural strength and pavement performance [
5,
6]. The SGC method is popular because the samples formed by gyratory compaction are well correlated with the field core. Sarang et al. [
7] formed SMA mixtures with shredded waste plastics by the SGC method, and studied their road performance. Muniandy et al. [
8] introduced a new type of automatic rotary compactor and evaluated its ability to compact SMA. They also introduced a weighting factor that compensates the crushing effect of the aggregates during mixing and compaction. Cui et al. [
9] concluded that when designing SMA mixtures by SGC in China, the number of rotations must match the traffic volume and highway grade. Wang et al. [
10] compared the road performances of SMA mixtures designed by the Marshall and SGC methods. Their studies found that SGC is widely used worldwide [
11,
12].
To improve the consistency between the test specimen after molding and the pavement core sample after completing the compaction operation in the field, may researcher simulate the construction vibration compaction of the asphalt mixture in laboratory studies. The pavement performance of the asphalt mixture is improved by optimizing the mix ratio of the mixture specimen [
13]. The vertical-vibration testing method (VVTM) properly simulates the working condition of the vibrating rollers. Jiang [
14,
15] studied the applicability of the VVTM to AC-13 mixtures, proposed suitable vibration parameters and selection standards for asphalt-mixture molding, and compared the mechanical strengths of the vibration specimen and the design pavement core samples. The correlation in the VVTM specimens was as high as 92.1%. Road workers in France, Switzerland and other countries have studied the effect of vibration molding by subjecting test specimens to lateral vibrations under a vertical load [
16]. Thus far, VVTM has proven successful in designing road surface materials such as dense-graded asphalt mixtures and recycled emulsified asphalt mixtures [
17,
18,
19,
20,
21], and road base materials such as cement stabilized macadam [
22,
23,
24,
25]. All of these materials achieve high road performance. However, the VVTM method has not been applied to the design of high-performance SMA mixtures.
The present study compares the volume parameters, mechanical properties, road performances, and fatigue performances of SMA-13 mixtures designed by the Marshall, SGC, and VVTM approaches, and verifies the superiority of VVTM in the design of SMA mixtures. It then compares and chooses a design method that improves the road performance and durability of SMA pavements exposed to modern traffic conditions.
2. Materials and Methods
2.1. Materials
2.1.1. Asphalt
The test asphalt was South Korea Ssangyong styrene–butadiene–styrene (SBS)-modified asphalt. The technical properties of the asphalt (see
Table 1) were determined by Chinese standard test methods on bitumen and bituminous mixtures for highway engineering (JTG E20-2011) [
26]. All properties satisfied the requirements of the Chinese technical specifications for highway asphalt pavement recycling (JTG F41-2008) [
27].
2.1.2. Aggregates
Tests were performed on coarse aggregates (2.36–13.2 mm) of basalt crushed stone, fine aggregates (0–2.36 mm) and mineral powder of ground limestone. The crushed basalt and limestone were both from Shangluo City, Shaanxi Province, China. The technical properties of aggregates (see
Table 2,
Table 3 and
Table 4) were determined according to the Test Methods of Aggregate for Highway Engineering (JTG E42-2005) [
28]. All materials met the technical requirements of the Technical Specification for Highway Asphalt Pavement Construction (JTG F40-2004) [
29].
2.1.3. Fiber
The test fiber was lignin fiber procured from Jiangsu Province, China. The technical properties of the fiber are shown in
Table 5.
2.2. Gradation
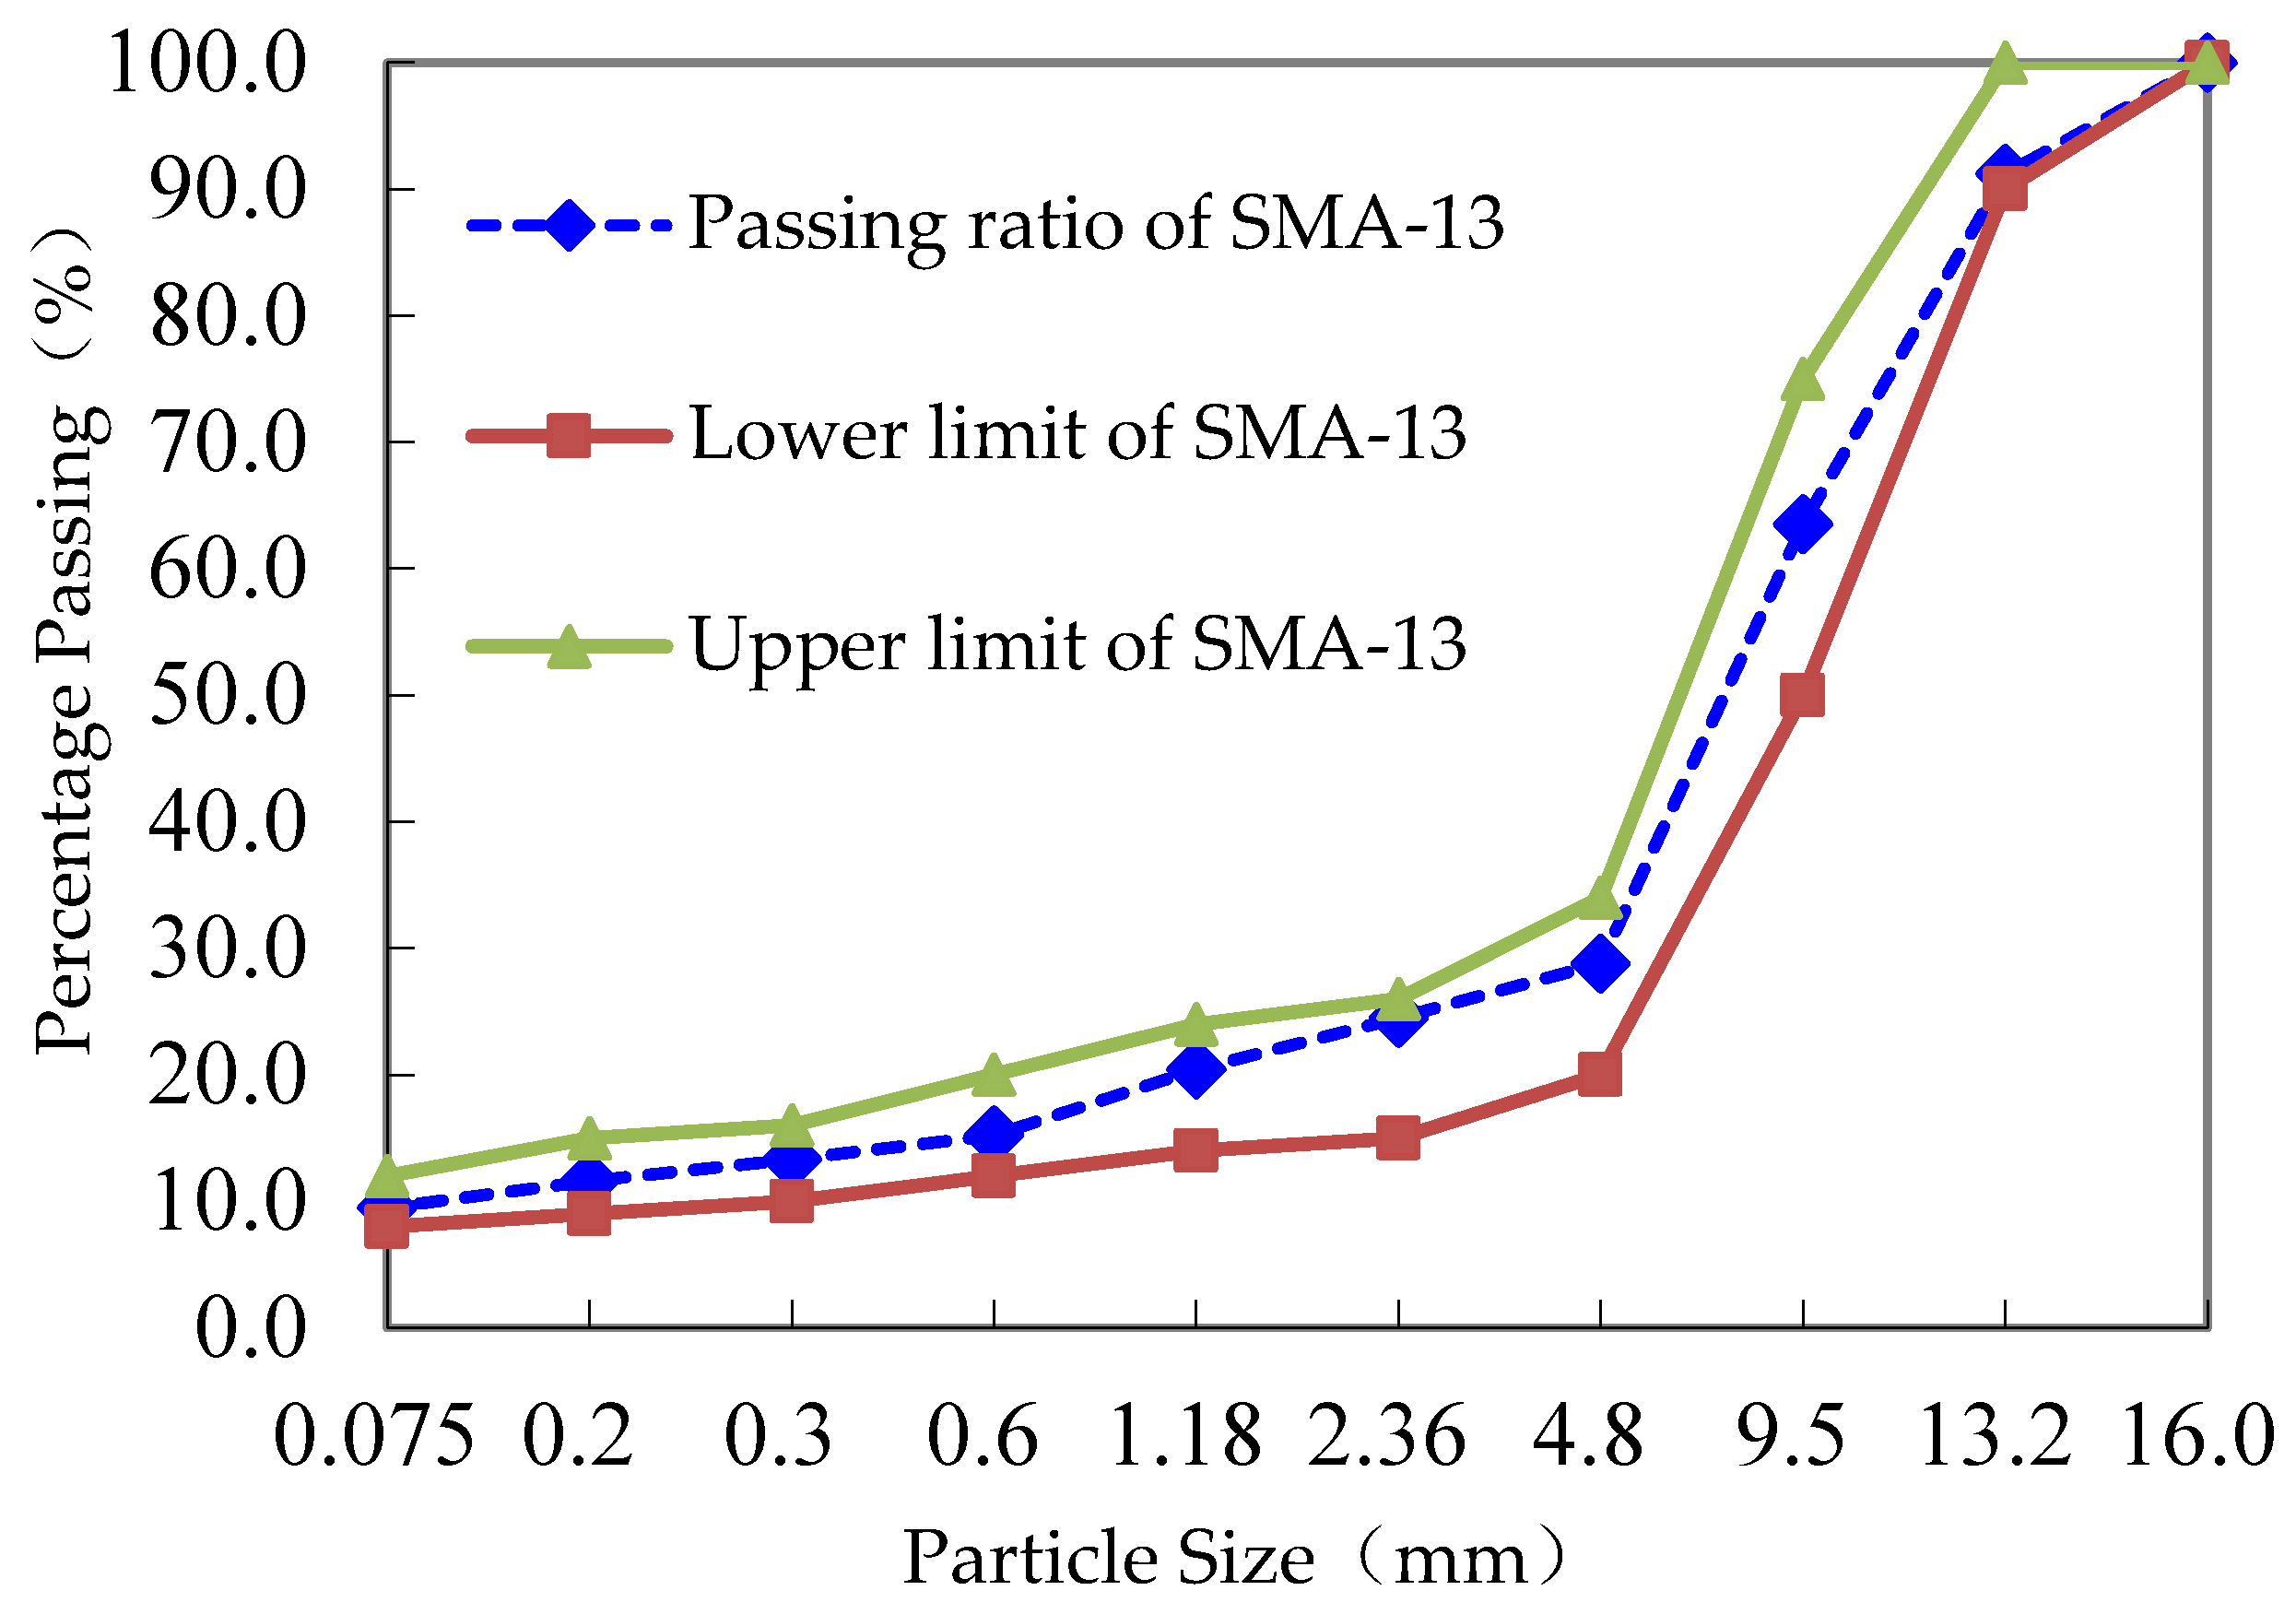
Table 6 shows the grading of the SMA-13 asphalt mixture in the present test. The gradation diagram (see
Figure 1) follows the requirements of the Technical Specifications for Construction of Highway Asphalt Pavements (JTG F40-2004) [
29].
2.3. Compaction Methods
2.3.1. Marshall Method
The Marshall method is a volume design method that optimizes the asphalt content by analyzing the void content (VV), voids filled with asphalt (VFA), voids in the mineral aggregates (VMA), Marshall stability (MS), and flow value (FL) of the asphalt mixture. When the sample is formed, the SMA-13 mixture is loaded into a test mold and compacted 75 times on both sides with a Marshall compactor. Marshall samples were formed according to JTG E20-2011 [
26]. The design parameters of the Marshall method are shown in
Table 7.
2.3.2. SGC Method
The SGC method properly simulates the compaction process of the road surface by the roller. The characteristics of the designed mixture are well correlated with those of the road-roller compaction mixture. The compaction degree of the SGC sample is a function of the number of gyrations. While compacting the mixture, the height of the sample was recorded at each compaction revolution, and the compaction curve of the mixture was drawn. The performance of the mixture was then analyzed [
26]. Similar to the Marshall design method, the optimal asphalt dosage was determined from the VV, VMA and VFA of the specimens. Specimen were formed according to JTG E20-2011. The test parameters are shown in
Table 8.
2.3.3. VVTM
The VVTM refers to the compaction mechanism and working parameters of the vibratory roller during the actual pavement construction. The working parameters of the vertical-vibration compactor (
Table 9) were chosen to obtain the best match between the indoor molding sample and the materials at the actual construction site, combined with the results of the research group [
28]. The formed SMA-13 asphalt mixture was loaded into a test mold, and compacted under vibration for 65 s with a vibrometer.
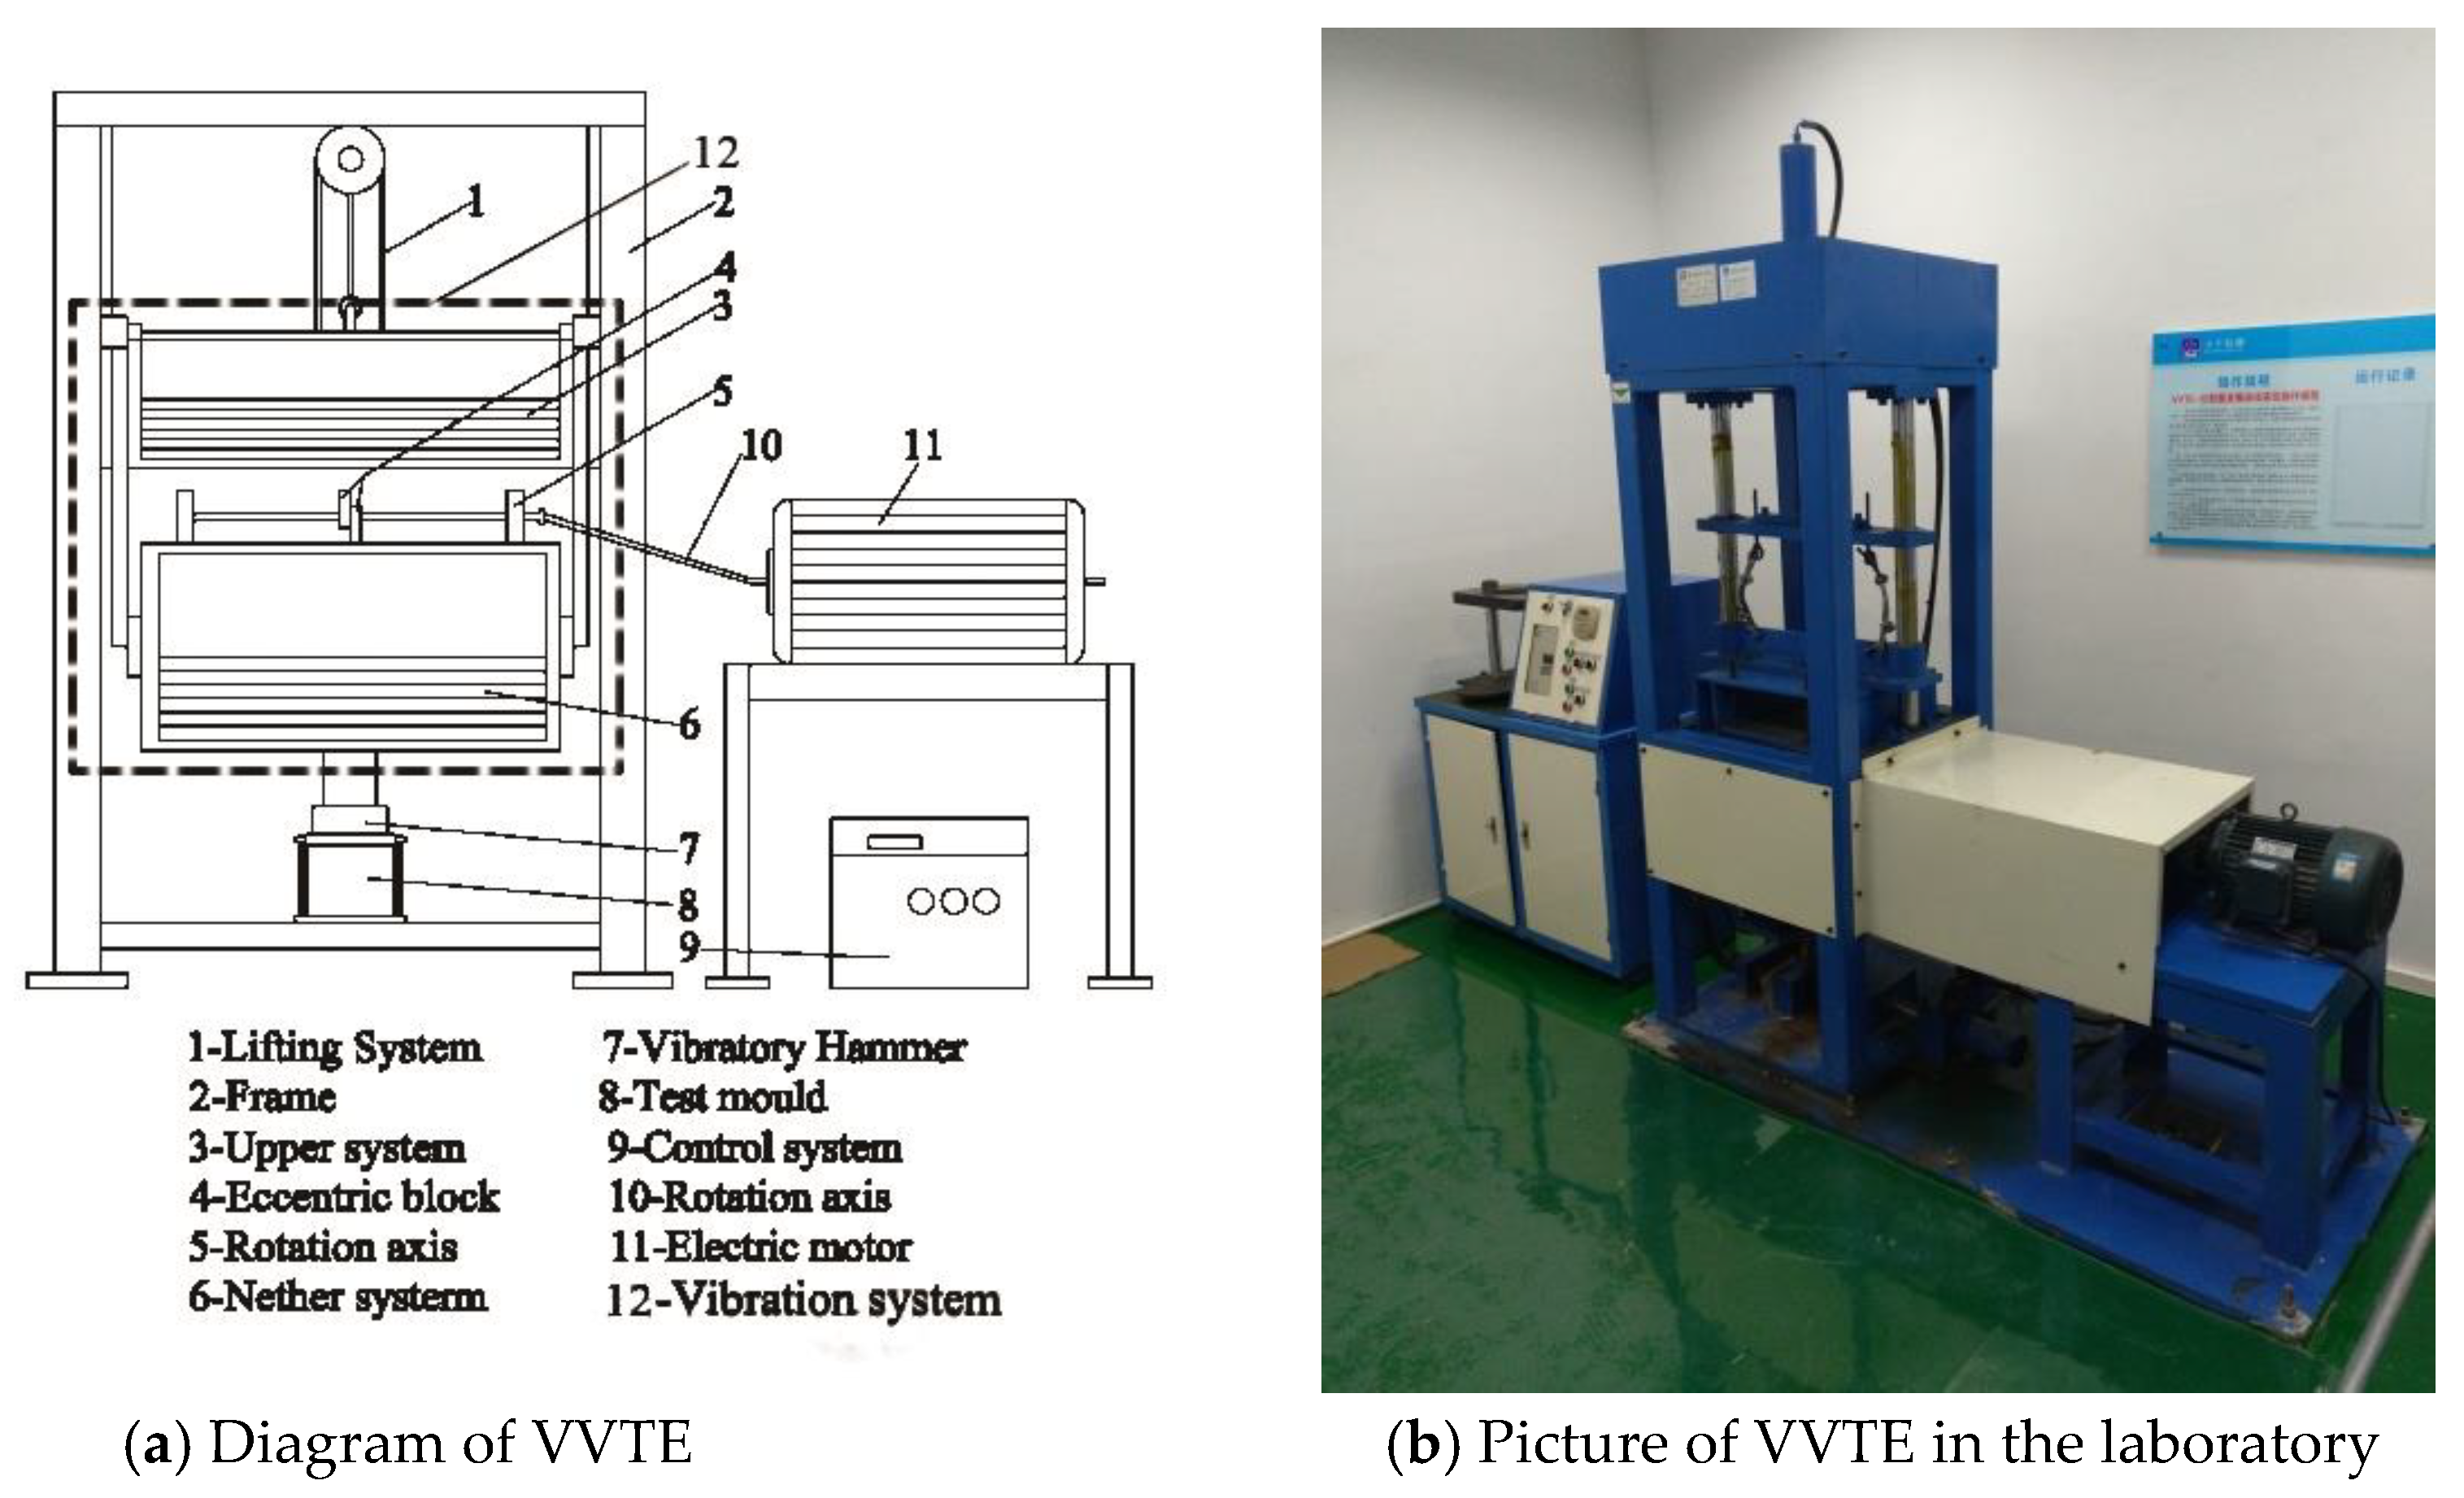
The vertical-vibration test sample was fabricated by VVT equipment (VVTE). Considering the operability of indoor instruments, the internal vibratory vibrator structure of the designed VVTE was that of the currently used vibratory roller, which imitates the unique working principles and structural characteristics of the directional vibratory roller. The structure and a schematic of the VVTE are shown in
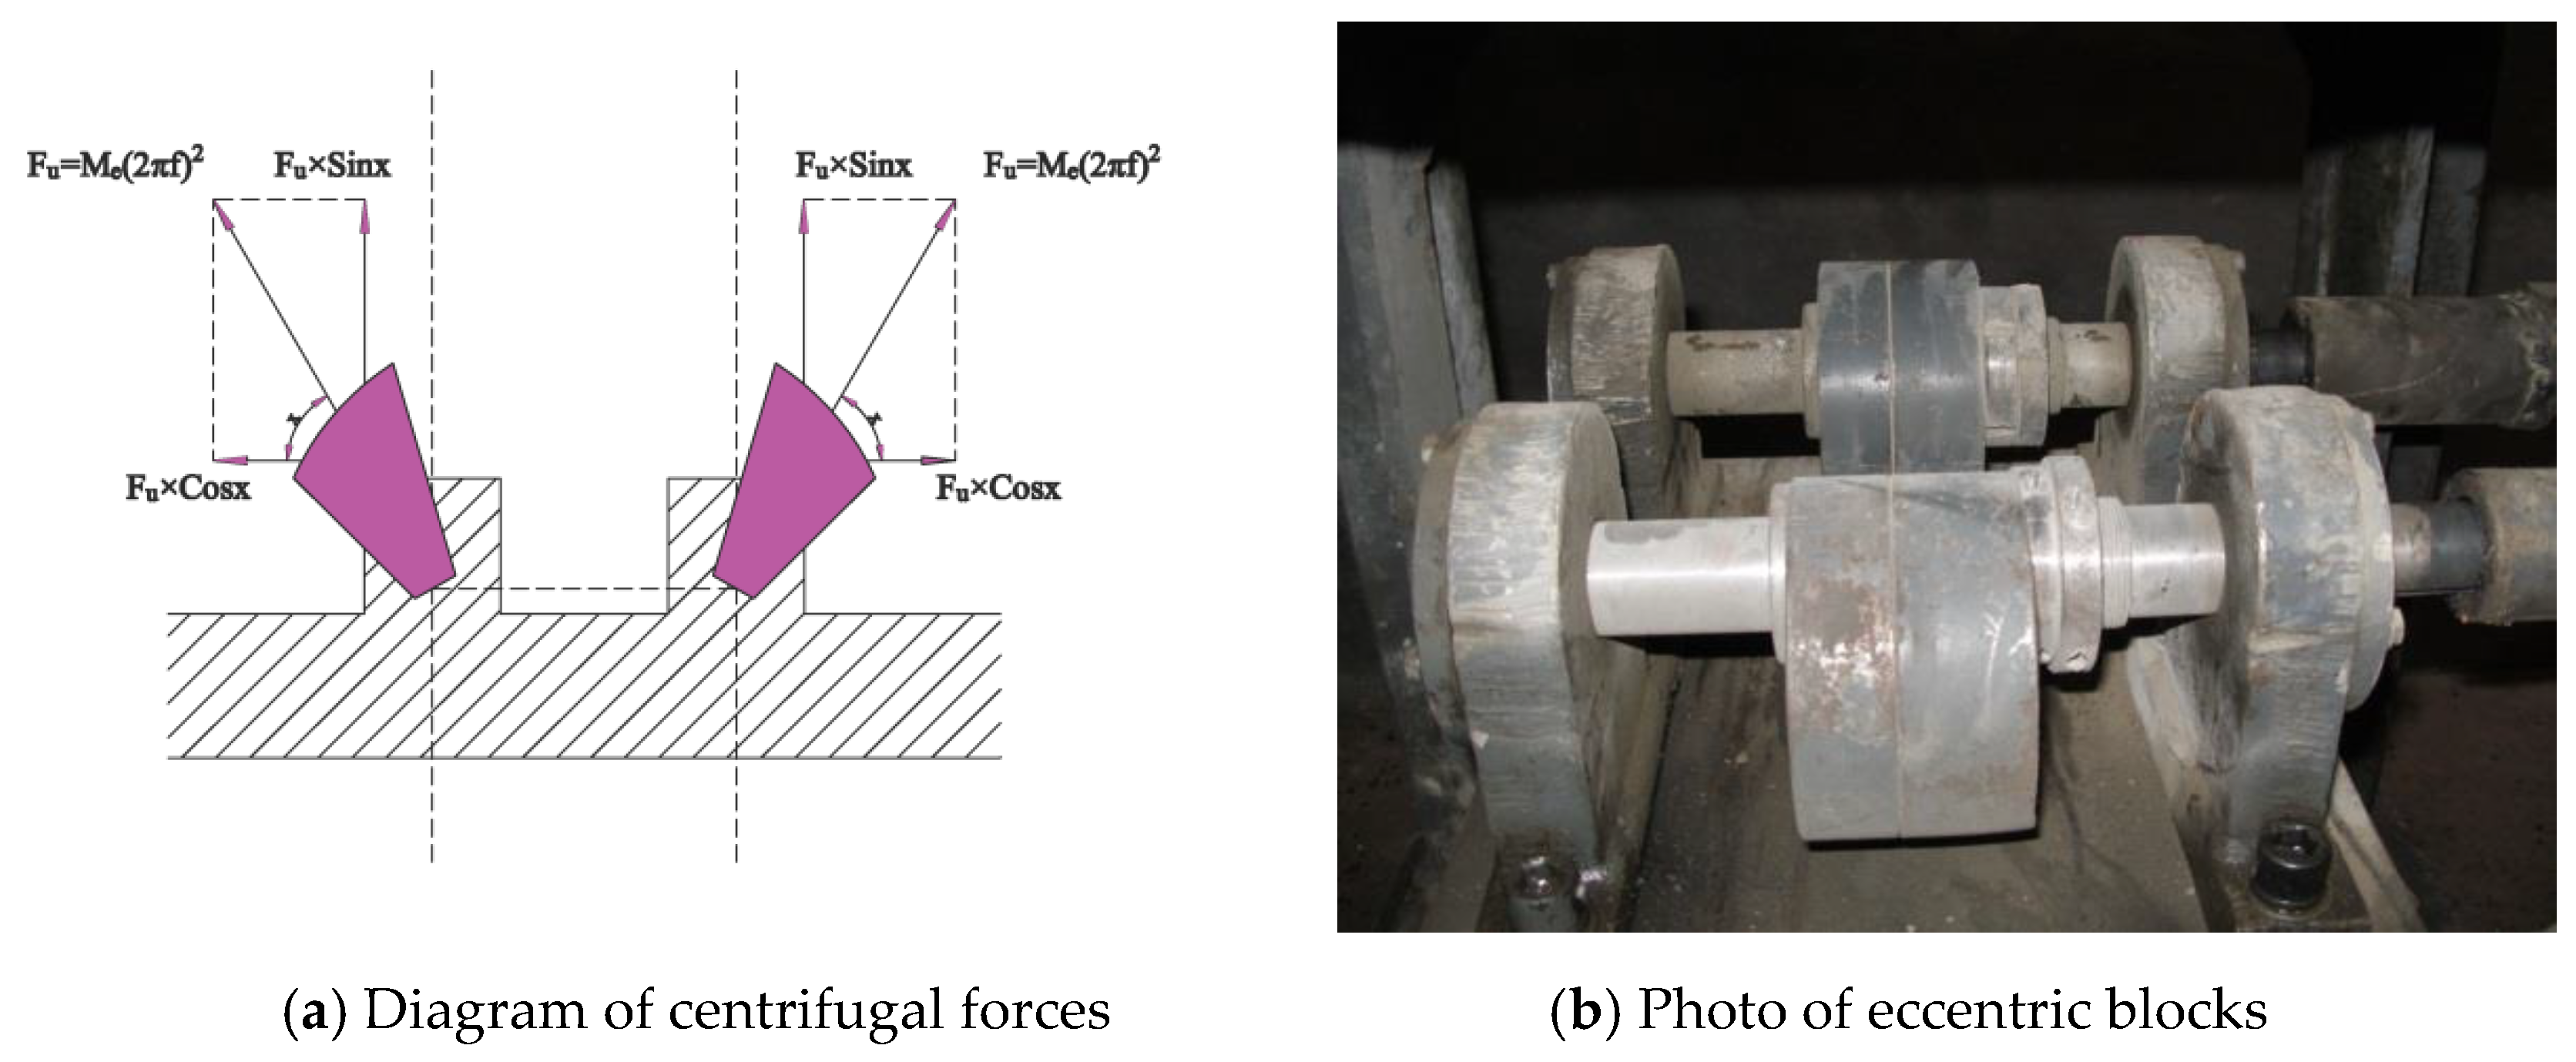
Figure 2. The core component of the exciter is the eccentric block shown in
Figure 3. The symmetric arrangement of the two eccentric blocks cancels the horizontal forces, so that only vertical forces are generated during work. The sinusoidal excitation forces generated by the rapid rotation ensure the stability of the VVTE and effective vertical-vibration compaction [
30].
2.4. Test Methods
This study tested the mechanical properties, road performance, aging performance, and fatigue performance of the SMA-13 samples. Mechanical properties refer to the ability of asphalt mixtures to resist compression, shear, and tensile strength, and include compressive strength, shear strength, and split strength. As indicators of the mechanical performance, we adopted the compressive strength (Rc) defining the damage resistance of the mixture under uniaxial compression, the shear strength (τd) defining the shear-failure resistance of the mixture at high temperatures, and the splitting strength (Ri), which evaluates the tensile strength of the mixture. As the road performance indicators, we included the dynamic stability (DS) for evaluating the high-temperature rutting resistance of the asphalt mixtures, the flexural tensile strength and strain (Rb and εi, respectively) for evaluating the low-temperature crack resistance of the mixtures, and the melt splitting strength ratio (TSR) and the residual Marshall stability (MS0) for evaluating the water stability of the mixtures. The MS, RC, RT, DS, Rb, εi, TSR and MS0 measurements accorded with the “Standard Test Method for Asphalt and Asphalt Mixtures in Highway Engineering” (JTG E20-2011). The τd, anti-aging performances, and fatigue performances were measured as described below.
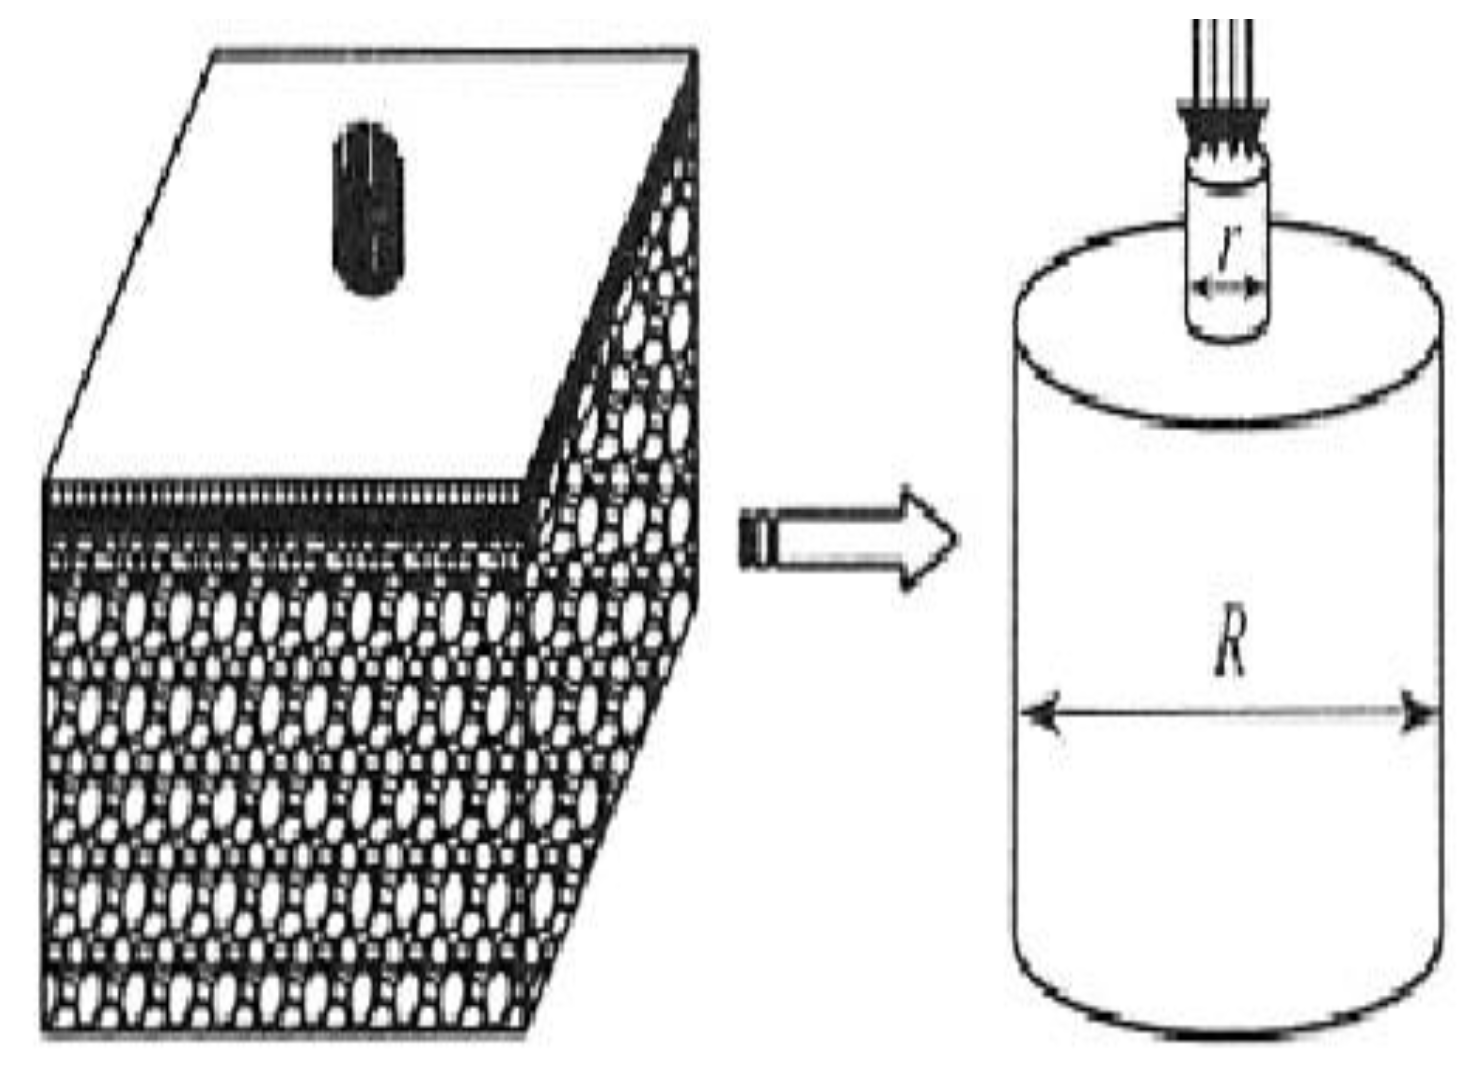
2.4.1. Uniaxial Penetration Test
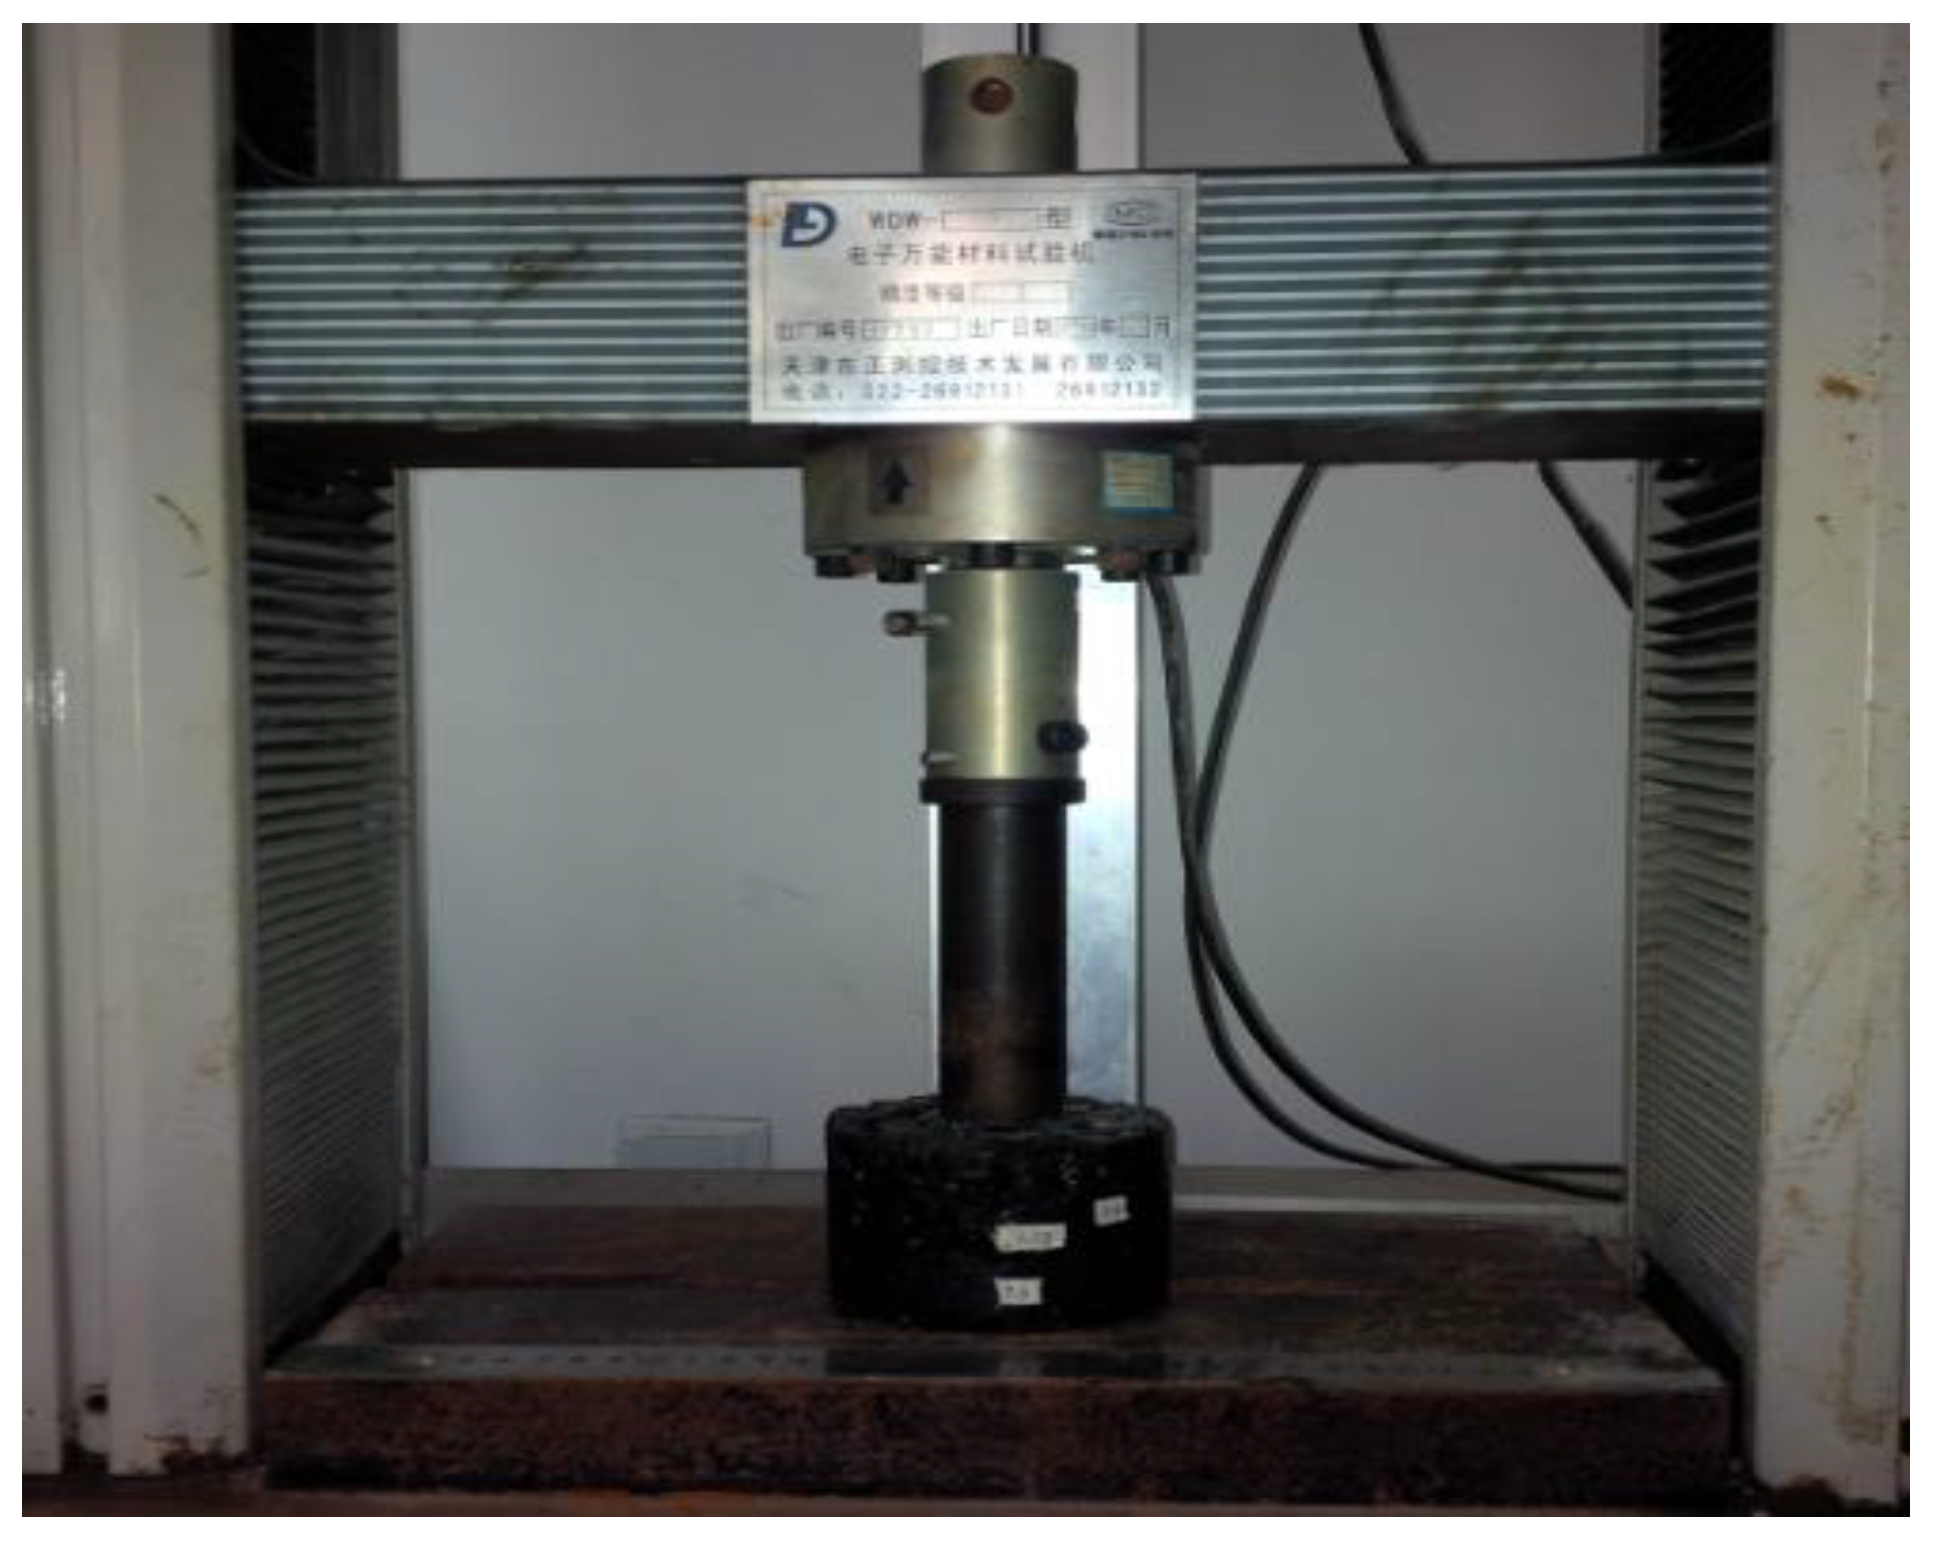
The shear strength (
τd, in MPa) was evaluated by the uniaxial penetration test, which determines the high-temperature stability of the asphalt mixture. The uniaxial penetration test generates a shear stress inside the mixture, simulating the force of vehicle tires during actual road use. Therefore, this text can effectively predict the actual use of pavement. In the present study, the uniaxial penetration test was performed in an electronic universal testing machine with an indenter diameter and loading rate of 38 mm and 1.0 mm/min, respectively. Prior to testing, the sample temperature was controlled at 60 °C for 4–6 h. The test model is shown in
Figure 4, and the electronic universal testing machine is shown in
Figure 5.
The shear strength was calculated as follows:
where
is the penetration strength of the sample (MPa), P is the maximum load that can be tolerated by the specimen without breaking (N), and ∅ is the sample diameter (mm).
2.4.2. Aging Test
The aging test includes short-term aging and long-term aging. The short-term aging refers to the aging process from mixing to the paving completion of the asphalt mixture. The long-term aging refers to the aging process of asphalt pavement opened to traffic for 3 to 5 years. Aging test was performed by the oven heating method [
26]. The SM30A mixture obtained by normal mixing was evenly spread on a tray and placed in an oven at 135 °C for 4 h to simulate short-term aging. The short-term aged mixture was placed in an 85 °C oven for 120 h to simulate the long-term (3–5 y) aging process of the asphalt pavement.
In the test, a centrifugal extractor was used to extract the asphalt solution from the mixture until the solution became transparent. The mineral powder in the extract was removed by high-speed centrifugation in a centrifuge tube. To ensure complete removal of the mineral powder, the centrifugal force was not less than 770× g, and the centrifugation time was not less than 30 min. The asphalt was then recovered from the extraction solution by the Absen method. The entire process time, from the beginning of the extraction to the end of the recovery, was completed within 8 hours. The performance parameters of the recovered aged asphalt—penetration at 25 °C, viscosity at 135 °C, ductility at 5 °C, and the softening point—were compared with those of the original asphalt to evaluate the effect of the aging process on the asphalt performance.
2.4.3. Fatigue Test
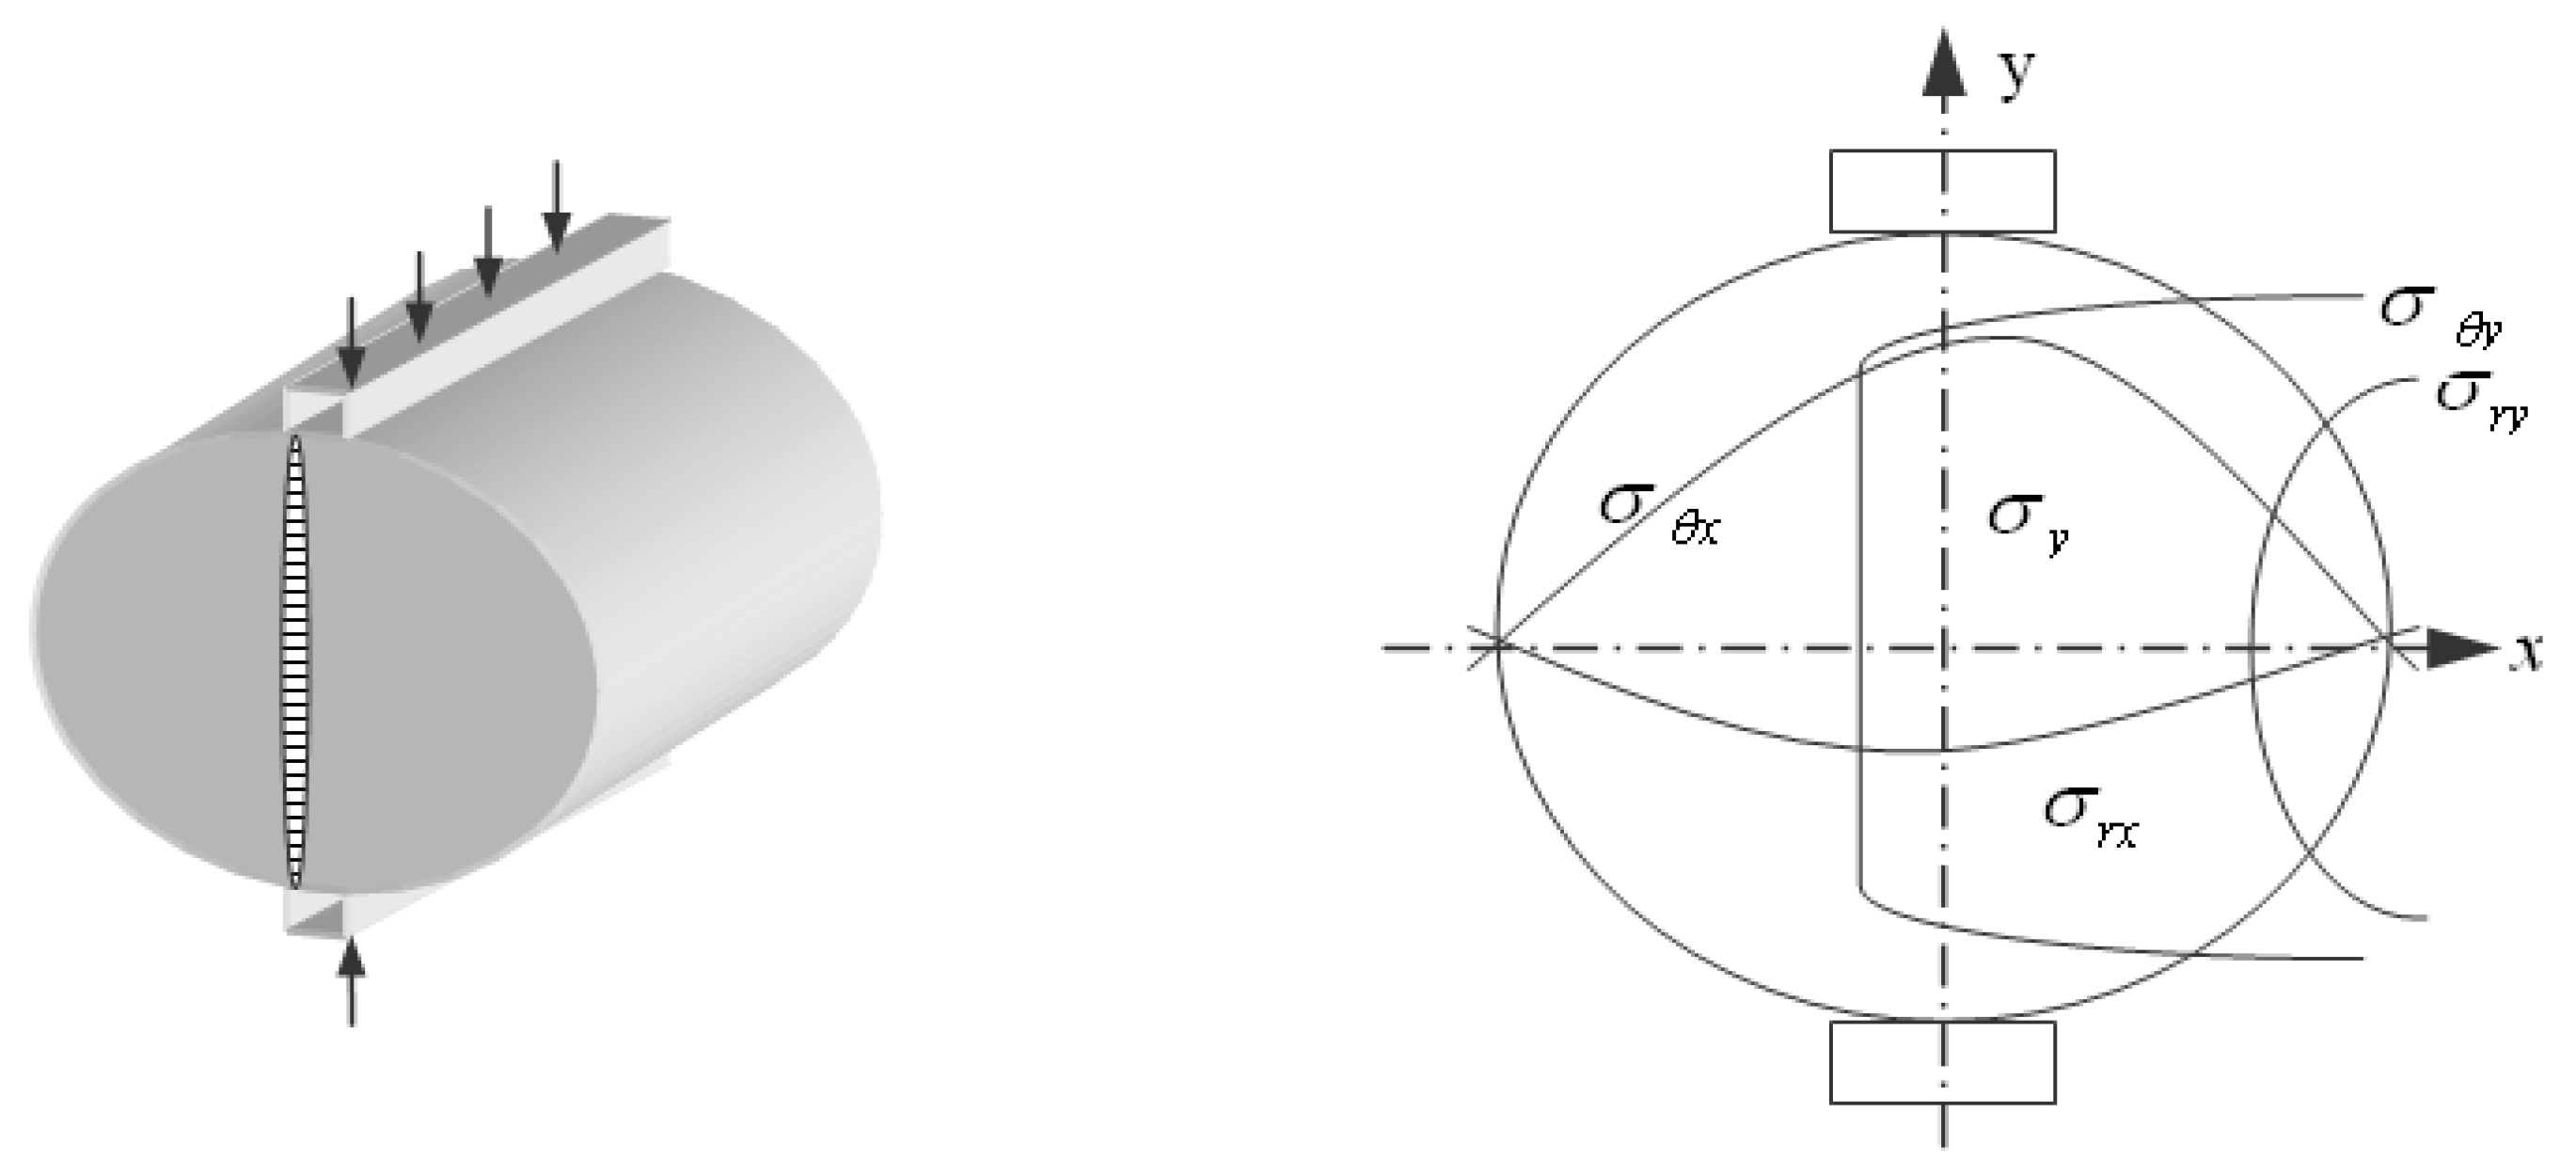
The fatigue performance of the SMA-13 mixture was evaluated in an indirect tensile fatigue test. The stress state of the sample during this test is shown in
Figure 6.
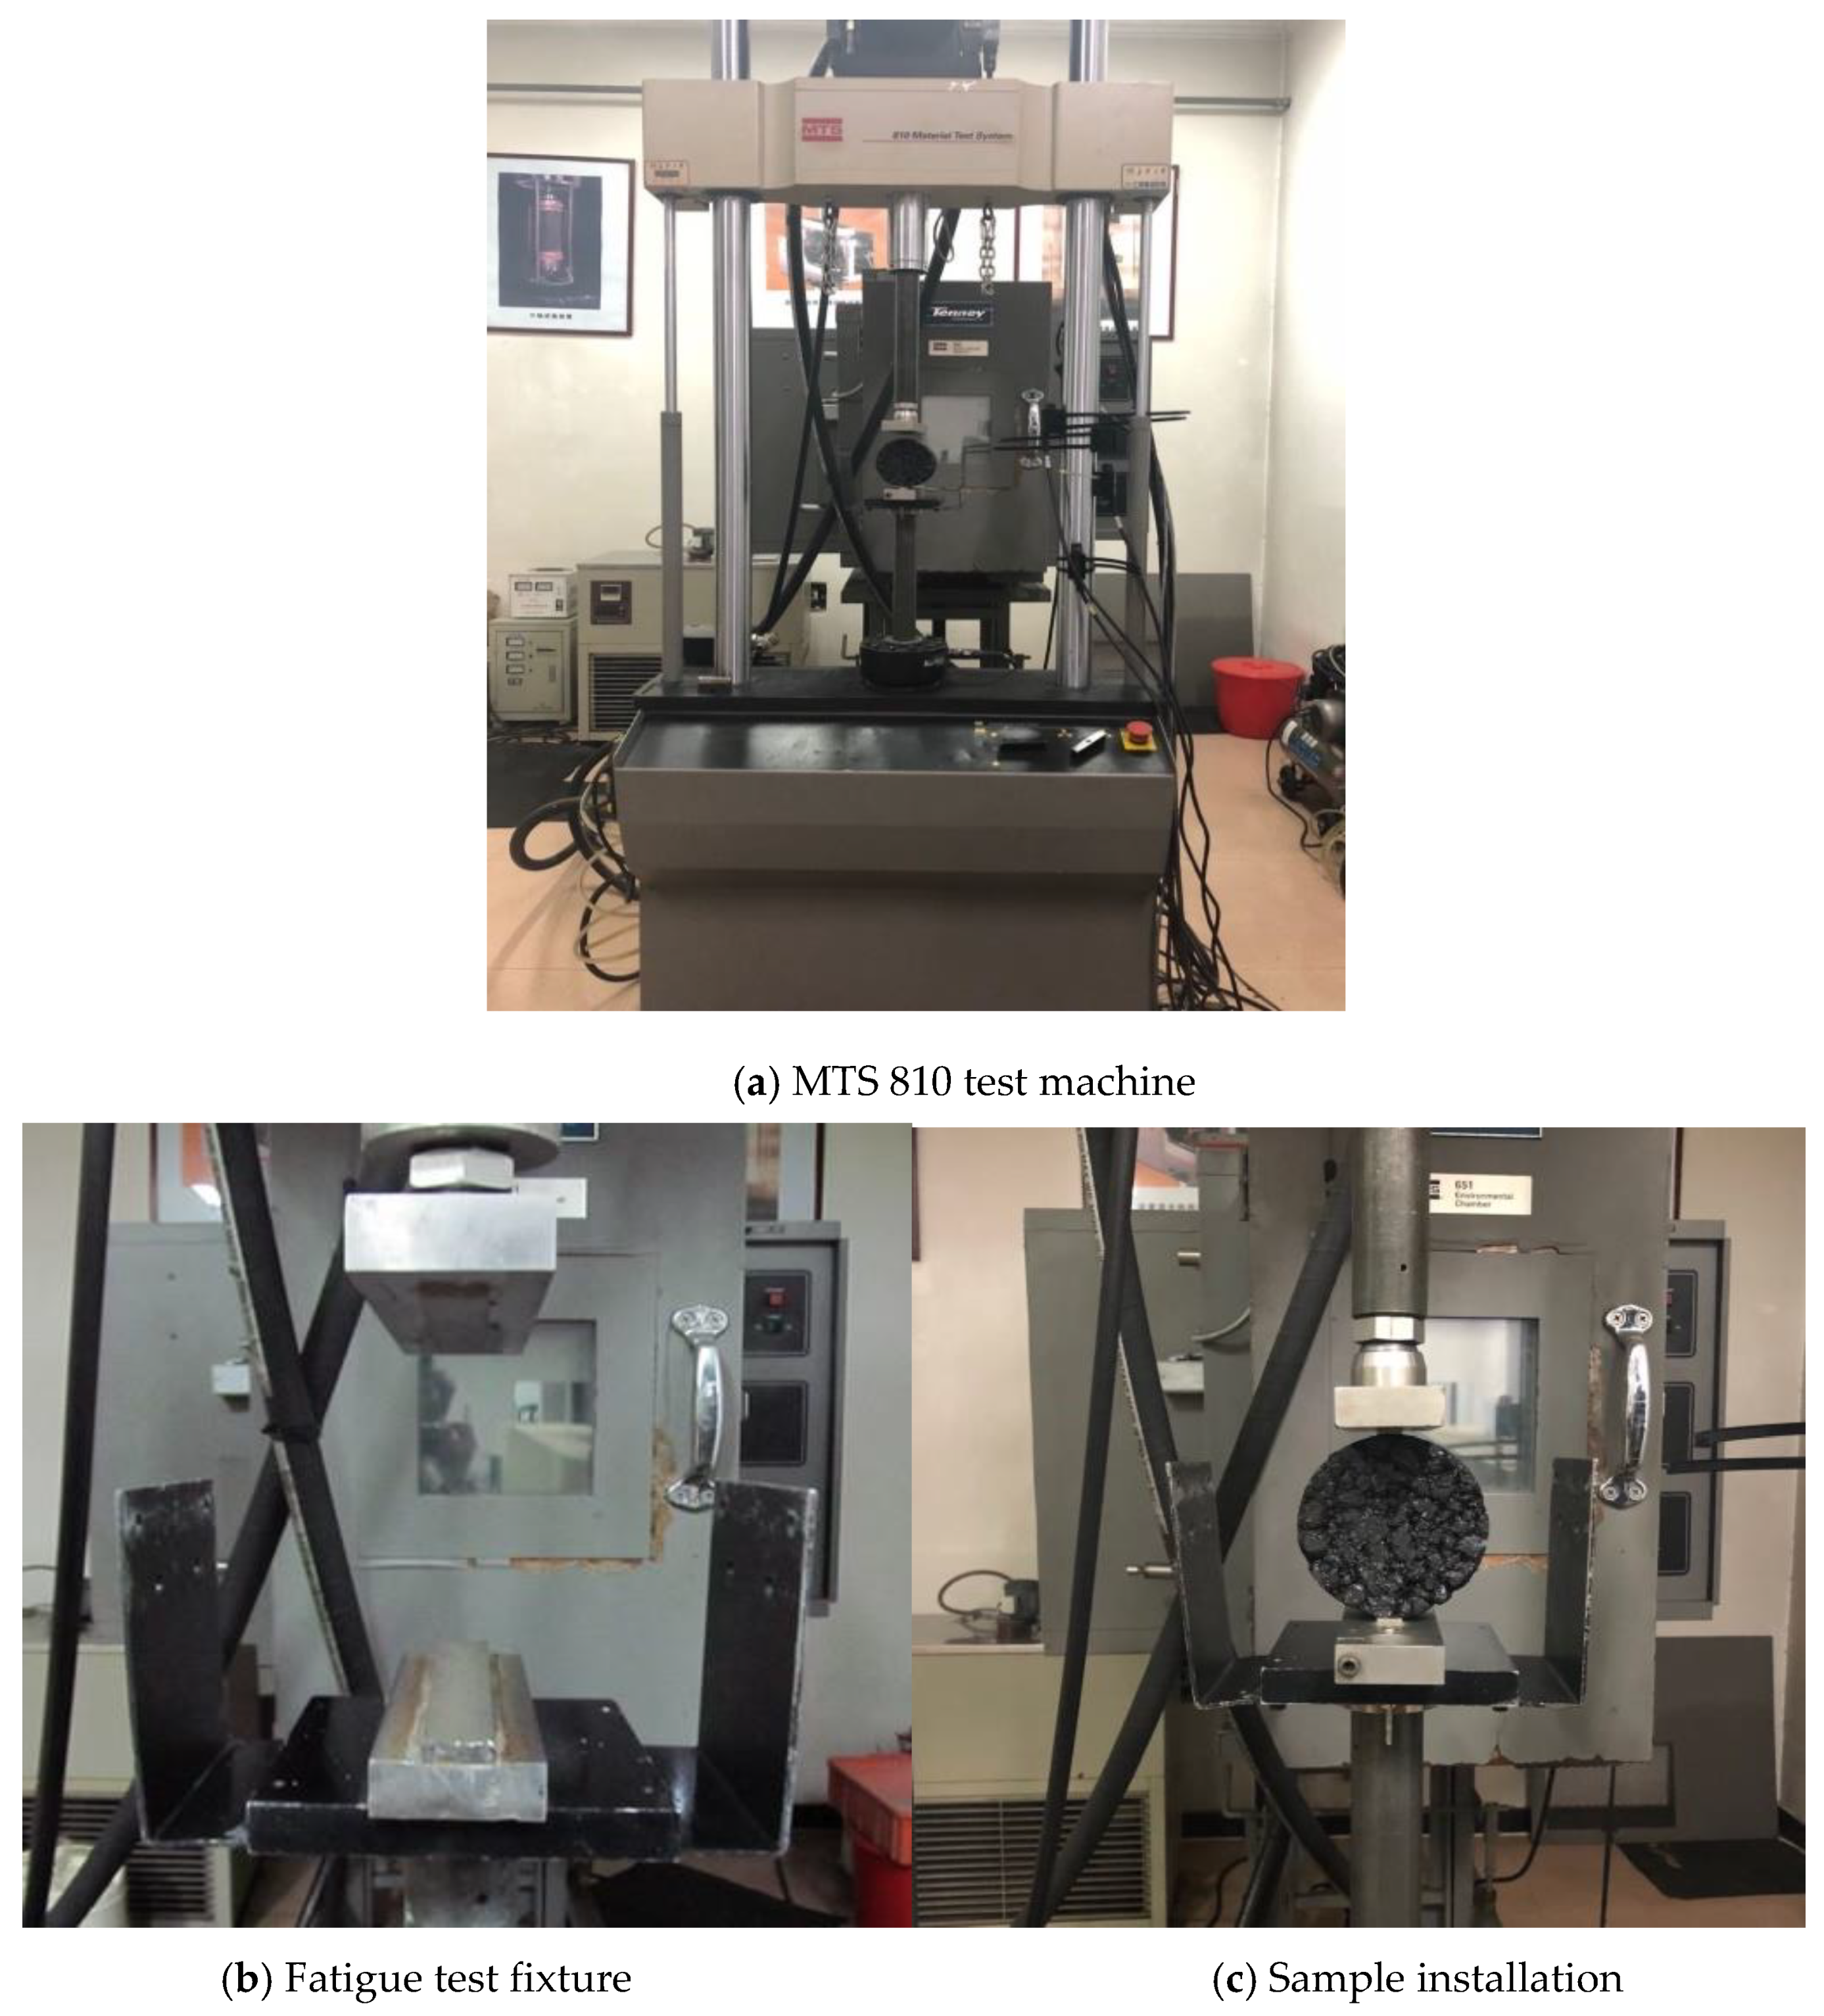
The test instrument was an MTS 810 test machine. The installations of the instrument, fatigue test fixture and sample are shown in
Figure 7.
The stress control was selected for consistency with the actual pavement usage, and the loading was applied in stress control mode. The MTS 810 achieves high reproducibility, a clear definition of fatigue failure, and reliable accuracy control. The load frequency was 10 Hz, the load waveform was a half-sinusoidal waveform, and the cyclic characteristic was 0.1. The stress ratios was varied as 0.3, 0.4, 0.5, 0.6, and 0.7 at constant temperature (15 °C), it is noteworthy that the stress ratio is defined as the ratio of the load force to the limit strength of the pavement materials. The fatigue resistances of the SMA mixtures designed by different methods were evaluated from the numbers of fatigue failures under the different stresses.
3. Results
3.1. Comparison of Volume Parameters
Table 10 relates the asphalt–aggregate ratios (
Pa) to the physical properties of the specimens. Asphalt-aggregate ratio refers to the percentage of the asphalt-mineral mass ratio in the asphalt mixture.
Table 11 lists the optimal asphalt–aggregate ratios of the SMA-13s designed by the three methods and their corresponding volume parameters, extracted from
Table 10.
In the VVTM-designed asphalt mixture, the asphalt–aggregate ratio and density were 5% lower and 2.4% higher than in the Marshall-designed asphalt, respectively, and 5% lower and 2.2% higher than in the SGC-designed asphalt, respectively. This result can be explained by the volume parameters of the VVTM design method, which are based on heavy-traffic compaction standards; namely, the compaction standards for heavy asphalt mixtures should be 1.02 times the laboratory standard Marshall density. Because the VVTM compaction standard is higher, the optimal amount of asphalt can be reduced, with the result that the density of the mixture increases it can be seen from
Table 11 of the manuscript that compared with the Marshall method, the density of the SMA-1 mixture designed by VVTM is increased by about 2%, which is also verified by the references [
31]. At this time, the density is high, the amount of asphalt is small, therefore, VV and VMA are appropriately reduced, and that is, the space between the aggregates is reduced, so the mixture is further compacted. Aggregates also migrate with the vibration compaction, further compacting the structure.
3.2. Comparison of Mechanical Properties
Table 12 shows the mechanical properties (including the compressive strength, shear strength, and split strength) of the SMA-13 mixtures designed by different methods. Here, R (M), R (S) and R (V) represent the mechanical properties of the asphalt mixture designed by the Marshall method, the SGC method and the VVTM, respectively.
The compressive strength, shear strength, and split strength of the SMA-13 asphalt mixture designed by the VVTM method were 22%, 44%, and 30% higher respectively than those of the Marshall-designed asphalt, the overall performance improvement was approximately 32%. Moreover, the above mechanical properties were about 20%, 16%, and 5% higher respectively than those of the SGC-designed asphalt. The overall performance improvement was approximately 13%. This result is attributable to the relatively high density of the SMA-13 asphalt mixture designed by the VVTM method, which reduced the mixture void ratio and the mineral clearance ratio, and improved the skeleton embedding effect of the mineral. Meanwhile, VVTM is more conducive to aggregate arrangement and less aggregate crushing rate. Therefore, the SMA-13 asphalt mixture designed by the VVTM method possessed higher mechanical properties than the other mixtures. The mechanical properties were less degraded in the SGC-designed asphalt mixture than in the Marshall-designed mixture, because the Marshall method imposes more severe conditions than gyratory compaction. High aggregate crushing, especially of coarse aggregates, will severely damage the coarse-aggregate extrusion structure of the specimen, thereby reducing the performance of the mixture.
3.3. Road Performance Comparison
Table 13 shows the road performances of the SMA-13 mixtures designed by different methods. Here, S (M), S (S), and S (V) represent the road performances of the asphalt mixtures designed by the Marshall method, the SGC method, and the VVTM, respectively.
In the VVTM-designed SMA-13 mixture, the high-temperature rutting resistance, low-temperature crack resistance and water stability were respectively 30%, 20%, and 4% higher than in the Marshall-designed mixture, and respectively 8%, 17% and 3% higher than in the SGC-designed mixture. This result is attributable to the different compaction mechanisms of the three methods. By virtue of its vibration-compaction mechanism, the VVTM better arranges the coarse aggregates in the mixture than the other methods, thereby forming a stronger framework. Under the squeezing force, the skeleton is more easily filled with horseshoe fat, and the mixture can more easily resist deformation; accordingly, the VVTM-designed mixture has strong high-temperature rutting resistance and low-temperature crack resistance. The reduced amount of asphalt also reduces the occurrence of high-temperature rutting. Meanwhile, because the VVTM-designed SMA-13 mixture is denser with a lower air void volume (VV) than the other mixtures, water cannot easily enter the road interior, so the SMA-13 mixture can be formed into pavements with improved water stability.
3.4. Comparison of Aging Resistance
As the compaction performs more work in the VVTM than in the Marshall method, the test specimen formed by the VVTM was denser than that formed by the Marshall method, and its optimal asphalt content was smaller. The superior mechanical properties and small asphalt contents of VVTM-designed mixtures have been demonstrated in previous studies, but whether the design method affects the anti-aging performance needs further research and demonstration. Therefore, this subsection simulates the short-term and long-term aging processes of the SMA mixtures in an indoor test, and analyzes the performance changes of the asphalt in the different mixtures.
The effect of aging degree on the asphalt performance in the mixtures, and the performance results of the recovered asphalts, are shown in
Table 14 and
Table 15, respectively. In these tables, R represents the asphalt performance, and R
S and R
L represent the short-term aging and long-term aging performances, respectively.
The aging degrees of the mixtures designed by different methods exerted similar influences on the asphalt performance; that is, increasing the aging degree gradually decreased the penetration and ductility of the mixture, and increased its softening point and viscosity. The asphalt performances of mixtures aged to the same degree depended on the design method. The VVTM-designed asphalt mixture exhibited a larger performance change after short-term aging than the other mixtures, indicating a deeper aging degree. However, after long-term aging, the range of the performance change was smaller in the VVTM-designed mixture than in the Marshall- and SGC-designed mixtures, indicating a smaller degree of long-term aging.
This result can again be explained by the smaller amount of asphalt in the VTTM than in the Marshall and SGC methods, meaning a thinner asphalt film in the mixture. Previous studies have shown that the thickness of an asphalt film determines its resistance. The larger the thickness of the asphalt film, the better is the anti-aging performance of the mixture; therefore, the asphalt mixture designed by the VVTM aged to a deeper degree than the other mixtures. In contrast, the long-term aging of asphalt mixtures is mainly affected by external factors such as oxygen, water, and light. Asphalt reacts under the action of hot oxygen and light to form aldehydes, ketones, acids, and alum. At the same time, the oxidative polymerization reaction results in an increase in molecular weight and an increase in polarity. The oxidative polymerization reaction results in changes in asphalt components, which are mainly manifested in reduced saturation, aromatics converted to gum, and gums further converted to asphaltene, which makes the asphalt’s colloidal structure stability worse [
32]. The high density and low void content of the VVTM-designed asphalt largely prevented these factors from entering the mixture interior, thereby reducing the long-term aging of this sample.
3.5. Fatigue Performance Comparison
3.5.1. Fatigue Test
Table 16 lists the fatigue test results of the SMA-13 mixtures designed by the three methods. The stress ratio (S) defines the ratio of the maximum load stress to the ultimate failure strength, and the fatigue life (N) is the total load time to failure of the mixture, and the C
v represents the coefficient of variation of each test.
As the stress ratio changed, the fatigue lifetimes of the mixtures designed by the three methods exhibited the same trend. Specifically, increasing the stress ratio gradually reduced the fatigue life of the mixture. In addition, the large dispersion between the number of fatigue times
N and the stress ratio
S is problematic for analyzing the fatigue data. In previous studies, the fatigue life of mixtures has been effectively analyzed by the Weibull distribution. Therefore, the two-parameter Weibull distribution was applied to the present relationship between the fatigue number
N and the stress ratio S. The failure probability (
P) is given by the following fatigue equation:
After a logarithmic transformation, Equation (2) becomes:
where
m0 = (1 −
R) ×
m is the shape parameter, and
t is the scale parameter.
The regression coefficients
m0, ln
t, and
R2 were obtained by incorporating the fatigue test data in
Table 16 into Equation (3). Their values are listed in
Table 17.
3.5.2. Fatigue Equation
Substituting the values of the regression coefficients in
Table 17 into Equation (3), we obtained the equivalent fatigue lives of the samples designed by different methods and corresponding to different stress ratios at different failure probabilities. The results are presented in
Table 18.
On a log–log scale, the fatigue life
N of the asphalt mixture and the stress ratio
S are linearly related as:
where
a and
b are the regression coefficients.
The coefficients
a and
b in the fatigue equation define the intercept and slope of the straight line, respectively. The fatigue life
N is an increasing function of
a, whereas
b reflects the sensitivity of the fatigue life to changes in the stress ratio. In other words, as
a increases or
b decreases, the fatigue performance improves. The parameters and correlation coefficients of the fatigue equation are shown in
Table 19.
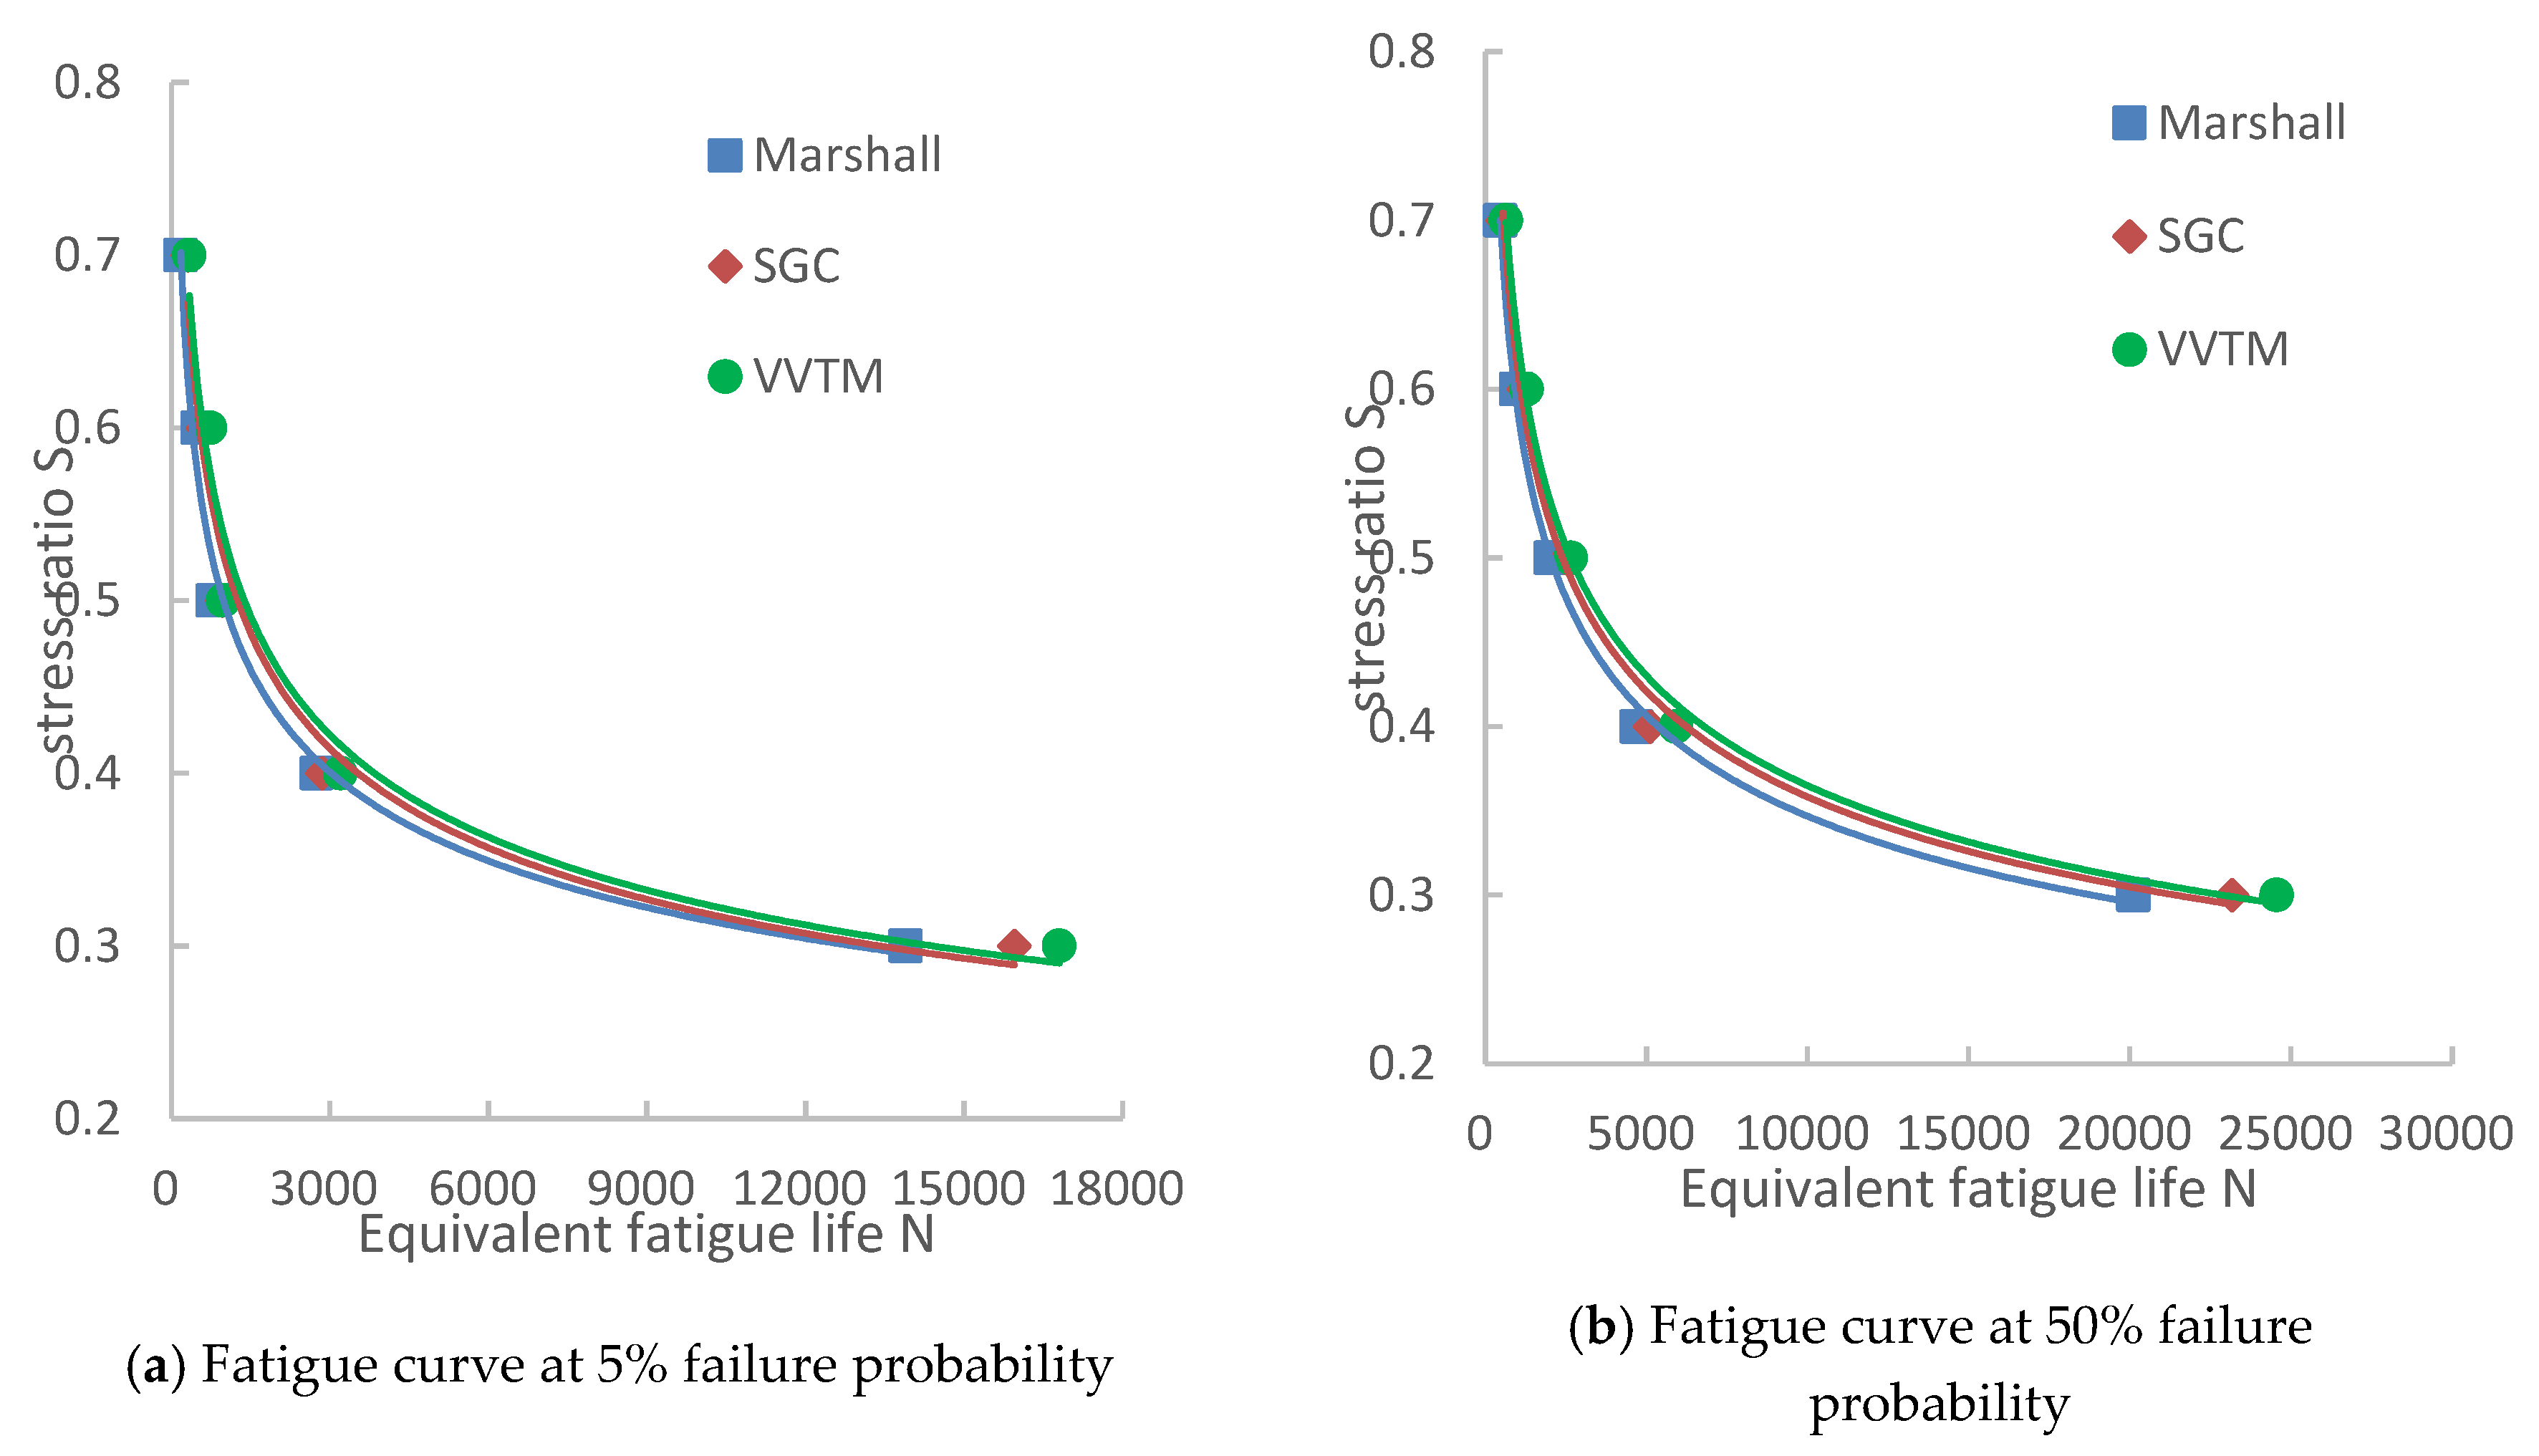
Considering that fatigue lines are sometimes expressed in the form
S= f(
N), the corresponding fatigue curves were constructed at failure probabilities of 5% and 50% (seeing
Figure 8).
At the same failure probability, the coefficients a and b were larger and smaller, respectively, in the VVTM-designed SMA-13 mixture than in the Marshall-designed and SGC-designed mixtures. This result demonstrates the higher fatigue performance of the VVTM-designed mixture than of the other mixtures.
3.5.3. Fatigue Life Analysis
Experience has shown that the tensile stress of a vehicle load on asphalt pavement cannot exceed 0.45 [
33]. Therefore, the fatigue lives of the mixtures designed by different methods (designated
NM,
NS and
NV for Marshall, SGC and VVTM, respectively) were analyzed at
S = 0.45. The results are presented in
Table 20.
Under the stress ratio S = 0.45, the fatigue life of the VVTM-designed SMA-13 was at least 33% and 9% longer than those of the Marshall-designed and SGC-designed SMA-13s, respectively. That is, the SMA-13 mixture designed by the VVTM method provided higher fatigue resistance than the mixtures designed by the Marshall and SGC methods.
The VVTM required less asphalt in the mixture than the other methods; consequently, the VV was reduced, the VFA and the compactness was increased, Studies have shown that within a certain reasonable range, fatigue performance gradually increases with the increase of VFA. At the same time, the impact of compaction and void content on fatigue life is also very significant. Lower void content is very beneficial to prevent moisture from entering the pavement structure, and can control water damage to the pavement to a minimum. Relevant research shows that when the void content of the pavement structure is sufficiently low, it can be ensured that no dynamic water pressure will appear inside the mixture even under the load, which can prevent water damage fatigue in the pavement structure to the greatest extent. Therefore, the higher the void content of the mixture, the lower the corresponding fatigue life [
34,
35,
36]. VVTM SMA mixtures have greater compactness and lower void content, so the fatigue performance is better. In addition, the vibration molding squeezed the coarse aggregates in the SMA-13 mixture into each other, improving the skeleton structure. The horseshoe fat was densely distributed, and the overall structure and strength were uniform. When cracks appeared, the mixture was quickly destroyed. In summary, the SMA-13 mixture designed by VVTM more easily withstood damage than the other mixtures, developed fewer cracks inside the mixture, supported higher loads, and thereby delivered a stronger fatigue performance.
4. Conclusions
The mechanical properties, road performances, anti-aging performances and fatigue performances of SMAs designed by the Marshall method, the SGC method, and VVTM were analyzed in a comparative study. The following conclusions can be drawn on the basis of the experimental results:
(1) The asphalt–aggregate ratio was 5% lower in the VVTM-designed SMA-13 than in the Marshall- and SGC-designed SMA-13s. Moreover, the VVTM-designed SMA-13 improved the density, mechanical properties, high-temperature rut resistance, low-temperature crack resistance, and water stability by 2.4%, 32%, 30%, 20% and 4% respectively, relative to the Marshall-designed SMA-13 sample, and by 2.2%, 13%, 8%, 17% and 3% respectively, relative to the SGC-designed sample.
(2) Relative to the Marshall-designed SMA-13 sample and SGC-designed sample, the short-term aging degree of the VVTM-designed SMA-13 was deep, but the long-term aging degree was smaller than in the other mixtures.
(3) The fatigue life of SMA-13 was subjected to two-parameter Weibull distribution, and the fatigue equation could accurately reflect the fatigue life of SMA13.The fatigue life was at least 33% and 9% higher in the VVTM-designed sample than in the Marshall- and SGC-designed samples, respectively.
This study provides new ideas for the design of SMA mixtures. The VVTM method offers many more advantages than the traditional method for the design of SMA mixtures, and can solve the early degradation problems of SMA pavements to a certain extent. Therefore, it improves the prospects and economic benefits of SMA roading.
Author Contributions
Conceptualization, Y.J. and J.X.; data curation, Y.Z. and J.X.; formal analysis, Y.Z., J.X. and C.D.; funding acquisition, Y.J.; C.D. and J.X.; experiment operation and writing—original draft preparation, Y.Z. and J.X.; writing—review and editing, Y.J., Y.Z.; C.D. and T.T. All authors have read and agreed to the published version of the manuscript.
Funding
This research was funded by the Doctoral Research Foundation of Hubei University of Arts and Science (grant number 2059084), Youth Science and technology new star project of Shaanxi innovation talents promotion plan (grant number 2019KJXX-035) and the Scientific Research of Central Colleges of China for the Chang’an University (grant number 300102218212). The author gratefully acknowledges its financial support.
Conflicts of Interest
The authors declare no conflicts of interest.
References
- Du, S.W.; Li, S.S. Laboratory evaluation of Warm Stone Matrix asphalt mixture. Adv. Mater. Res. 2011, 243–249, 4178–4181. [Google Scholar] [CrossRef]
- Bellin, P. Stone Mastic Asphalt in Germany. Asph. Yearb. 1998, 10, 72–80. [Google Scholar]
- Blazejowski, K. Stone Matrix Asphalt: Theory and Practice; CRC Press: Boca Raton, FL, USA, 2010. [Google Scholar]
- Memon, N.A. Comparison between Superpave Gyratory and Marshall Laboratory Compaction Methods. Ph.D. Dissertation, Universiti Teknologi Malaysia, Johor, Malaysia, 2006. [Google Scholar]
- Tapkın, S.; Keskin, M. Rutting analysis of 100 mm diameter polypropylene modified asphalt specimens using gyratory and Marshall compactors. Mater. Res. 2013, 16, 546–564. [Google Scholar] [CrossRef]
- Button, J.W.; Little, D.N.; Jagadam, V.; Pendleton, O.J. Correlation of selected laboratory compaction methods with field compaction. Transp. Res. Rec. 1994, 1454, 193–201. [Google Scholar]
- Sarang, G.; Lekha, B.M.; Krishna, G.; Shankar, A.U.R. Comparison of Stone Matrix Asphalt mixtures with polymer-modified bitumen and shredded waste plastics. Road Mater. Pavement Des. 2016, 17, 933–945. [Google Scholar] [CrossRef]
- Muniandy, R.; Haghighi, H.; bin Hassim, S.; Moazami, D. Ability of rotary compactor in compacting consistent slabs and effect of rotary compaction on engineering properties of stone mastic asphalt mixtures. J. Cent. South Univ. 2013, 20, 3754–3763. [Google Scholar] [CrossRef]
- Cui, W.P.; Chen, L.; Yu, Z.X.; Qin, L.J. Feasibility Research on Superpave Gyratory Compactor Method Design Mix of Stone Mastic Asphalt. World Build. Mater. 2014, 599, 159–163. (In Chinese) [Google Scholar] [CrossRef]
- Wang, W.S.; Cheng, Y.C.; Zhou, P.L.; Tan, G.J.; Wang, H.T.; Liu, H.B. Performance Evaluation of Styrene-Butadiene-Styrene-Modified Stone Mastic Asphalt with Basalt Fiber Using Different Compaction Methods. Polymers 2019, 11, 1006. [Google Scholar] [CrossRef]
- Georgiou, P.; Sideris, L.; Loizos, A. Evaluation of the effects of gyratory and field compaction on asphalt mix internal structure. Mater. Struct. 2016, 49, 665–676. [Google Scholar] [CrossRef]
- Jiang, Y.J.; Chen, Z.J.; Xu, X.H.; Liang, H. Evaluationon Vertical Vibration Compaction Method of ATB-30 Asphalt Mixture. J. Build. Constr. 2014, 17, 638–643. (In Chinese) [Google Scholar]
- Jiang, Y.J.; Deng, C.Q.; Xue, J.S.; Chen, Z.J. Investigation into the performance of asphalt mixture designed using different methods. Constr. Build. Mater. 2018, 177, 378–387. [Google Scholar] [CrossRef]
- Jiang, Y.J.; Deng, C.Q.; Xue, J.S.; Liu, H.P.; Chen, Z.J. Investigation of the fatigue properties of asphalt mixture designed using vertical vibration method. Road Mater. Pavement Des. 2018. [Google Scholar] [CrossRef]
- Jiang, Y.J.; Xue, J.S.; Chen, Z.J. Influence of volumetric property on mechanical properties of vertical vibration compacted asphalt mixture. Constr. Build. Mater. 2017, 135, 612–621. [Google Scholar] [CrossRef]
- Zhu, Q. Research on Vibration Forming Method of Asphalt Mixture Based on ATB-30; Chang’an University: Xi’an, China, 2011. [Google Scholar]
- Jiang, Y.; Fan, L. An experimental investigation of optimal asphalt–aggregate ratio for different compaction methods. Constr. Build. Mater. 2015, 91, 111–115. [Google Scholar] [CrossRef]
- Jiang, Y.J.; Deng, C.Q.; Li, Q.; Liu, H.P. Effect of Compaction Methods on Physical and Mechanical Properties of Asphalt Mixture. J. Mater. Civ. Eng. 2019, 31, 04019075. [Google Scholar] [CrossRef]
- Deng, C.Q.; Jiang, Y.J.; Lin, H.W.; Chen, Z.J.; Ji, X.P. Influence of gradations on performance of emulsified asphalt cold recycled mixture produced using vertical vibration compaction method. Road Mater. Pavement Des. 2019. [Google Scholar] [CrossRef]
- Liu, H.; Jiang, Y.; Hu, Y.; Ye, W.; Cao, Z.; Cai, Y. Influence of Gradation on Strength of Emulsified Asphalt Cold Recycled Mixture. J. Build. Constr. 2018, 21, 503–510. (In Chinese) [Google Scholar]
- Ji, X.; Jiang, Y.; Liu, Y. Evaluation of the mechanical behaviors of cement-stabilized cold recycled mixtures produced by vertical vibration compaction method. Mater. Struct. 2015, 49, 2257–2270. [Google Scholar] [CrossRef]
- Peterson, R.L.; Mahboub, K.C.; Anderson, R.M.; Masad, E.; Tashman, L. Comparing Superpave gyratory compactor data to field cores. J. Mater. Civ. Eng. 2004, 16, 78–83. [Google Scholar] [CrossRef]
- Deng, C.Q.; Jiang, Y.J.; Lin, H.W.; Ji, X.P. Mechanical-strength-growth law and predictive model for cement-stabilized macadam. Constr. Build. Mater. 2019, 215, 582–594. [Google Scholar] [CrossRef]
- Deng, C.Q.; Jiang, Y.J.; Tian, T.; Chen, Z.J. Resilient modulus and influencing factors of vertical vibration compacted cement-stabilized macadam. Int. J. Pavement Eng. 2019. [Google Scholar] [CrossRef]
- Jiang, Y.J.; Lin, H.W.; Han, Z.C.; Deng, C.Q. Fatigue Properties of Cold-Recycled Emulsified Asphalt Mixtures Fabricated by Different Compaction Methods. Sustainability 2019, 11, 3483. [Google Scholar] [CrossRef]
- Research Institute of Highway Ministry of Transport. Standard Test Methods of Bitumen and Bituminous Mixtures for Highway Engineering (JTG E20-2011); China Communications Press: Beijing, China, 2011. (In Chinese) [Google Scholar]
- Research Institute of Highway Ministry of Transport. Technical Specification for Highway Asphalt Pavement Recycling (JTG F41-2008); China Communications Press: Beijing, China, 2008. (In Chinese) [Google Scholar]
- Research Institute of Highway Ministry of Transport. Test Methods of Aggregate for Highway Engineering (JTG E42-2005); China Communications Press: Beijing, China, 2005. (In Chinese) [Google Scholar]
- Research Institute of Highway Ministry of Transport. Technical Standards of the Chinese Technical Specifications for Construction of Highway Asphalt Pavements (JTG F40-2004); China Communications Press: Beijing, China, 2004. (In Chinese) [Google Scholar]
- Xing, C.; Liu, L.; Sheng, J. A new progressed mastic aging method and effect of fillers on SBS modified bitumen aging. Constr. Build. Mater. 2020, 238, 117732. [Google Scholar] [CrossRef]
- Chen, Z.J.; Xu, X.H.; Jiang, Y.J. Compaction criterion and evaluation of asphalt mixture for heavy-traffic road. Transport Research. 2014, 42, 22–26+32. (In Chinese) [Google Scholar]
- Hao, G.R.; Wang, Y.H.; Zhao, K.C.; Huang, W.D. Property changes of SBS modified asphalt binders during short-term aging and implications on quality management. Constr. Build. Mater. 2020, 244, 118323. [Google Scholar] [CrossRef]
- Sun, J. Research on Fatigue Cracking Prediction Model of Asphalt Mixture Based on Stress Control Model. Master’s Thesis, South China University of Technology, Guangzhou, China, June 2010. (In Chinese). [Google Scholar]
- Fan, Z.P.; Xu, H.N.; Xiao, J.Z.; Tan, Y.Q. Effects of freeze-thaw cycles on fatigue performance of asphalt mixture and development of fatigue-freeze-thaw (FFT) uniform equation. Constr. Build. Mater. 2020, 242, 118043. [Google Scholar] [CrossRef]
- Arabzadeh, A.; Guler, M. Thermal fatigue behavior of asphalt concrete: A laboratory-based investigation approach. Int. J. Fatigue 2019, 121, 229–236. [Google Scholar] [CrossRef]
- Bai, Q.F.; Qian, Z.D.; Zhao, Y.G. Asphalt fatigue resistance evaluation method based on the rheology. J. Beijing Univ. Technol. 2012, 38, 1536–1542. [Google Scholar]
Figure 1.
Gradation diagram of SMA-13.
Figure 1.
Gradation diagram of SMA-13.
Figure 2.
Structure of VVTE.
Figure 2.
Structure of VVTE.
Figure 3.
Eccentric blocks.
Figure 3.
Eccentric blocks.
Figure 4.
Test model diagram.
Figure 4.
Test model diagram.
Figure 5.
The electronic universal testing machine.
Figure 5.
The electronic universal testing machine.
Figure 6.
Stress state of the specimen in the fatigue test.
Figure 6.
Stress state of the specimen in the fatigue test.
Figure 7.
Photographs of the fatigue test equipment.
Figure 7.
Photographs of the fatigue test equipment.
Figure 8.
Fatigue curves of the SMA-13 asphalt mixtures designed by the three methods.
Figure 8.
Fatigue curves of the SMA-13 asphalt mixtures designed by the three methods.
Table 1.
Technical properties of South Korea Ssangyong styrene–butadiene–styrene (SBS)-modified asphalt.
Table 1.
Technical properties of South Korea Ssangyong styrene–butadiene–styrene (SBS)-modified asphalt.
| Measured Item | Test Value | Standard |
|---|
| Penetration (25 °C) (0.1 mm) | 64.0 | 60–80 |
| Ductility (5 °C) (cm) | 41.2 | ≥30 |
| Softening point (ring and ball method) (°C) | 86.0 | ≥55 |
| Properties of residues | Mass loss (%) | −0.28 | ±1.0 |
| Penetration ratio (%) | 81.4 | ≥60 |
| Ductility (5 °C) (cm) | 26.1 | ≥20 |
Table 2.
Technical properties of coarse aggregate.
Table 2.
Technical properties of coarse aggregate.
| Measured Item | Test Value | Standard |
|---|
| Apparent relative density | 2.87 | ≥2.6 |
| Water absorption (%) | 0.95 | ≤2.0 |
| Needle flake particle content (%) | 7.0 | ≤12 |
| Crushing value (%) | 14 | ≤26 |
| Abrasion value (%) | 15 | ≤28 |
| Polishing value | 43 | ≥40 |
| Adhesion to asphalt (grade) | 5.0 | ≥5 |
| Ruggedness (%) | 5.2 | ≤12 |
| Soft rock content (%) | 0.8 | ≤3 |
Table 3.
Technical properties of fine aggregate.
Table 3.
Technical properties of fine aggregate.
| Measured Item | Test Value | Standard |
|---|
| Apparent density (g/cm3) | 2.78 | ≥2.5 |
| Ruggedness (%) | 4.7 | ≤12 |
| Sand equivalent (%) | 90 | ≥60 |
| Methylene blue value (g/kg) | 2.2 | ≤25 |
| Angularity (s) | 33 | ≥30 |
Table 4.
Technical properties of mineral powder of ground limestone.
Table 4.
Technical properties of mineral powder of ground limestone.
| Measured Item | Test Value | Standard |
|---|
| Apparent relative density | 2.78 | ≥2.5 |
| Hydrophilic coefficient | 0.60 | <1.0 |
| Plasticity index | 2.9 | <4 |
Table 5.
Technical properties of the test fiber.
Table 5.
Technical properties of the test fiber.
| Index | Average Length (mm) | Fiber Diameter (mm) | Specific Gravity (g/cm3) | Melting Point (°C) | Moisture Absorption (%) | Tensile Strength (MPa) | Elastic Modulus (GPa) | Elongation at Break (%) |
|---|
| Test value | 1 | 0.05 | 0.93 | 173 | 14 | <300 | 3.7 | 24 |
Table 6.
Mineral aggregate gradation of the SMA-13 mixture.
Table 6.
Mineral aggregate gradation of the SMA-13 mixture.
| Sieve size (mm) | 16 | 13.2 | 9.5 | 4.75 | 2.36 | 1.18 | 0.6 | 0.3 | 0.15 | 0.075 |
| Passing rate (%) | 100 | 91.2 | 63.5 | 28.8 | 24.5 | 20.4 | 15.2 | 13.3 | 11.6 | 9.5 |
Table 7.
Working parameters of a Marshall electric compactor.
Table 7.
Working parameters of a Marshall electric compactor.
| Specimen Size (mm) | Compaction Method | Drop Hammer Height (mm) | Hammer Weight (g) | Hammering Frequency (Times/min) |
|---|
| ϕ101.6 × 63.5 | 75 blows on each side | 475 ± 1.5 | 4536 ± 5 | 60 ± 5 |
Table 8.
Test parameters of the superpave gyratory compactor method (SGC) design method.
Table 8.
Test parameters of the superpave gyratory compactor method (SGC) design method.
| Specimen Size (mm) | Pressure (kPa) | Number of Rotations (Times) | Rotation Angle (Degrees) | Speed of Rotation (r/min) | Compaction Temperature (°C) |
|---|
| ϕ100 | 600 ± 18 | 65 | 1.25 ± 0.02 | 30 | 160 |
Table 9.
Working parameters of the vertical-vibration testing equipment.
Table 9.
Working parameters of the vertical-vibration testing equipment.
| Specimen Size (mm) | Working Frequency (Hz) | Amplitude (mm) | Upper System Weight (kg) | Lower System Weight (kg) | Gross Weight (kg) |
|---|
| ϕ100 × 63.5 | 37 | 1.2 | 108 | 167 | 275 |
Table 10.
Relationship between the asphalt–aggregate ratio and physical properties of the specimens.
Table 10.
Relationship between the asphalt–aggregate ratio and physical properties of the specimens.
| Design Methods | Pa (%) | Bulk Volume Relative Density | VV (%) | VMA (%) | VFA (%) |
|---|
| Marshall | 4.8 | 2.476 | 7.5 | 18.2 | 58.2 |
| 5.1 | 2.485 | 6.4 | 17.9 | 63.1 |
| 5.4 | 2.510 | 5.2 | 17.3 | 70.2 |
| 5.7 | 2.522 | 4.3 | 17.1 | 74.8 |
| 6.0 | 2.518 | 3.8 | 17.3 | 77.3 |
| SGC | 4.8 | 2.484 | 7.0 | 17.8 | 58.2 |
| 5.1 | 2.505 | 5.9 | 17.4 | 63.0 |
| 5.4 | 2.513 | 5.0 | 17.2 | 67.7 |
| 5.7 | 2.525 | 4.2 | 17.1 | 71.8 |
| 6.0 | 2.516 | 4.1 | 17.5 | 74.6 |
| VVTM | 4.8 | 2.570 | 3.9 | 15.7 | 74.2 |
| 5.1 | 2.578 | 3.1 | 15.3 | 79.6 |
| 5.4 | 2.582 | 2.8 | 15.2 | 81.2 |
| 5.7 | 2.576 | 2.5 | 15.5 | 85.3 |
| 6.0 | 2.570 | 2.0 | 16.1 | 87.0 |
Table 11.
Comparison of the physical properties of the stone mastic asphalt (SMA)-13 asphalt mixture.
Table 11.
Comparison of the physical properties of the stone mastic asphalt (SMA)-13 asphalt mixture.
| Design Methods | Pa (%) | Bulk Volume Relative Density | VV (%) | VMA (%) | VFA (%) |
|---|
| Marshall | 5.7 | 2.522 | 4.3 | 17.1 | 74.8 |
| SGC | 5.7 | 2.525 | 4.2 | 17.1 | 71.8 |
| VVTM | 5.4 | 2.582 | 2.8 | 15.2 | 81.2 |
Table 12.
Comparison of mechanical properties of the SMA-13 mixtures designed by different methods.
Table 12.
Comparison of mechanical properties of the SMA-13 mixtures designed by different methods.
| Mechanical Indices | Test Temperature (°C) | Design Methods | R(V)/R(M) | R(V)/R(S) |
|---|
| Marshall | SGC | VVTM |
|---|
| Rc | 25 | 6.5 | 6.6 | 7.9 | 1.22 | 1.20 |
| τd | 60 | 1.19 | 1.48 | 1.71 | 1.44 | 1.16 |
| Ri | −10 | 3.37 | 4.18 | 4.37 | 1.30 | 1.05 |
Table 13.
Comparison of Road performances of SMA-13 mixtures designed by different methods.
Table 13.
Comparison of Road performances of SMA-13 mixtures designed by different methods.
| Road Performance | Indices | Design Methods | S(V)/S(M) | S(V)/S(S) |
|---|
| Marshall | SGC | VVTM |
|---|
| Anti-rut ability | DS (times/mm) | 5756 | 6914 | 7450 | 1.30 | 1.08 |
| Anti-crack ability | Rb (MPa) | 11.8 | 12.1 | 14.2 | 1.20 | 1.17 |
| εi (μξ) | 3215 | 3287 | 3080 | 0.96 | 0.94 |
| Water stability | MS0 (%) | 90 | 91 | 94 | 1.04 | 1.03 |
| TSR (%) | 85 | 87 | 88 | 1.04 | 1.01 |
Table 14.
Influence of aging process on the performance of asphalts designed by different methods.
Table 14.
Influence of aging process on the performance of asphalts designed by different methods.
| Asphalt Performance | Original Asphalt | Marshall | SGC | VVTM |
|---|
| RS | RL | RS | RL | RS | RL |
|---|
| Penetration (0.1 mm) | 65.0 | 53.0 | 45.5 | 52.5 | 44.5 | 50.5 | 44.0 |
| Ductility (cm) | 41.4 | 32.6 | 23.8 | 30.8 | 23.5 | 31.2 | 24.7 |
| Softening point (°C) | 85.0 | 89.5 | 104.5 | 91.0 | 105.0 | 91.5 | 103.0 |
| Viscosity | 2.0 | 2.4 | 3.1 | 2.5 | 3.2 | 2.5 | 3.0 |
Table 15.
Comparison of aging performances of SMA-13 asphalt mixtures designed by different methods.
Table 15.
Comparison of aging performances of SMA-13 asphalt mixtures designed by different methods.
| Asphalt Performance | Marshall | SGC | VVTM |
|---|
| RS/R | RL/R | RS/R | RL/R | RS/R | RL/R |
|---|
| Penetration (0.1 mm) | 0.82 | 0.70 | 0.81 | 0.68 | 0.78 | 0.68 |
| Ductility (cm) | 0.79 | 0.57 | 0.74 | 0.57 | 0.75 | 0.60 |
| Softening point (°C) | 1.05 | 1.23 | 1.07 | 1.24 | 1.08 | 1.21 |
| Viscosity | 1.20 | 1.55 | 1.25 | 1.60 | 1.25 | 1.50 |
Table 16.
Fatigue test results of SMA-13s designed by different methods.
Table 16.
Fatigue test results of SMA-13s designed by different methods.
| Design Methods | Fatigue Life (N) Under the Following Stress Ratios S |
|---|
| 0.3 | 0.4 | 0.5 | 0.6 | 0.7 |
|---|
| Marshall | 17,119 | 3577 | 1217 | 716 | 306 |
| 18,130 | 4229 | 1770 | 818 | 357 |
| 19,831 | 4697 | 2074 | 940 | 445 |
| 21,697 | 5098 | 2346 | 1135 | 559 |
| 23,136 | 5766 | 2849 | 1216 | 675 |
| Cv | 11% | 16% | 26% | 19% | 28% |
| SGC | 19,339 | 3745 | 1527 | 834 | 427 |
| 21,218 | 4641 | 2013 | 1058 | 479 |
| 23,048 | 5089 | 2590 | 1225 | 534 |
| 24,831 | 5823 | 3004 | 1373 | 598 |
| 26,696 | 6138 | 3407 | 1528 | 684 |
| Cv | 11% | 17% | 27% | 20% | 17% |
| VVTM | 20,451 | 4258 | 1715 | 1004 | 485 |
| 22,454 | 5259 | 2025 | 1110 | 545 |
| 24,323 | 6110 | 2520 | 1259 | 622 |
| 26,463 | 6658 | 3376 | 1475 | 743 |
| 28,291 | 7190 | 3751 | 1588 | 802 |
| Cv | 11% | 18% | 29% | 17% | 18% |
Table 17.
Fatigue test results after fitting the data to the Weibull distribution.
Table 17.
Fatigue test results after fitting the data to the Weibull distribution.
| 4Design Methods | Coefficient Type | Coefficients of the Weibull Distribution Equation Under the Following Stress Ratios S |
|---|
| 0.3 | 0.4 | 0.5 | 0.6 | 0.7 |
|---|
| Marshall | | 7.0395 | 4.8676 | 2.743 | 3.9622 | 2.7147 |
| 70.125 | 41.525 | 21.27 | 27.611 | 17.04 |
| 0.9699 | 0.9978 | 0.9881 | 0.9741 | 0.9706 |
| SGC | | 6.9635 | 4.4745 | 2.7435 | 3.7427 | 4.7643 |
| 70.358 | 38.579 | 21.825 | 26.925 | 30.408 |
| 0.9953 | 0.9852 | 0.9921 | 0.9961 | 0.9806 |
| VVTM | | 6.8605 | 4.2347 | 2.6284 | 4.574 | 4.1766 |
| 69.72 | 37.154 | 21.09 | 33.143 | 27.369 |
| 0.9936 | 0.9873 | 0.9632 | 0.9704 | 0.9716 |
Table 18.
Equivalent fatigue lives of the specimens at different failure probabilities.
Table 18.
Equivalent fatigue lives of the specimens at different failure probabilities.
| Design Methods | P (%) | Equivalent Fatigue Life () under the Following Stress Ratio S |
|---|
| 0.3 | 0.4 | 0.5 | 0.6 | 0.7 |
|---|
| Marshall | 5 | 13,901 | 2754 | 790 | 502 | 178 |
| 10 | 15,398 | 3193 | 1026 | 602 | 232 |
| 20 | 17,130 | 3725 | 1349 | 728 | 306 |
| 30 | 18,310 | 4101 | 1601 | 819 | 364 |
| 40 | 19,268 | 4416 | 1825 | 897 | 416 |
| 50 | 20,122 | 4701 | 2040 | 969 | 465 |
| SGC | 5 | 15,951 | 2859 | 965 | 602 | 317 |
| 10 | 17,688 | 3358 | 1255 | 730 | 369 |
| 20 | 19,701 | 3971 | 1650 | 892 | 432 |
| 30 | 21,074 | 4410 | 1957 | 1011 | 476 |
| 40 | 22,189 | 4778 | 2231 | 1113 | 514 |
| 50 | 23,183 | 5116 | 2494 | 1207 | 548 |
| VVTM | 5 | 16,808 | 3204 | 986 | 733 | 344 |
| 10 | 18,667 | 3798 | 1297 | 857 | 409 |
| 20 | 20,825 | 4535 | 1725 | 1010 | 490 |
| 30 | 22,298 | 5066 | 2062 | 1119 | 548 |
| 40 | 23,497 | 5514 | 2365 | 1211 | 597 |
| 50 | 24,566 | 5926 | 2656 | 1294 | 642 |
Table 19.
Parameters and correlation coefficients of the fatigue equation.
Table 19.
Parameters and correlation coefficients of the fatigue equation.
| Design Methods | Correlation Coefficient | Coefficients of Fatigue Equation at the Following Failure Probabilities P (%) |
|---|
| 5 | 10 | 20 | 30 | 40 | 50 |
|---|
| Marshall | a | 1.4921 | 1.6314 | 1.7766 | 1.8673 | 1.9369 | 1.9959 |
| b | 4.9866 | 4.8116 | 4.6291 | 4.5151 | 4.4278 | 4.3536 |
| 0.9891 | 0.9925 | 0.9952 | 0.9964 | 0.9969 | 0.997 |
| SGC | a | 1.7313 | 1.8316 | 1.9361 | 2.0015 | 2.0515 | 2.094 |
| b | 4.5466 | 4.4692 | 4.3886 | 4.3382 | 4.2996 | 4.2668 |
| 0.9803 | 0.9866 | 0.9911 | 0.9926 | 0.9931 | 0.993 |
| VVTM | a | 1.7943 | 1.8941 | 1.9982 | 2.0632 | 2.1131 | 2.1554 |
| b | 4.4762 | 4.4026 | 4.3259 | 4.278 | 4.2413 | 4.2101 |
| 0.975 | 0.984 | 0.9912 | 0.9943 | 0.9959 | 0.9967 |
Table 20.
Comparison of the fatigue lives of specimens designed by different methods.
Table 20.
Comparison of the fatigue lives of specimens designed by different methods.
| Design Methods | P Value (%) in the List Corresponding to Fatigue Life at S = 0.45 |
|---|
| 5 | 50 |
|---|
| Marshall | 1665 | 2968 |
| SGC | 2032 | 3747 |
| VVTM | 2221 | 4125 |
| NV/NM | 1.33 | 1.39 |
| NV/NS | 1.09 | 1.10 |
© 2020 by the authors. Licensee MDPI, Basel, Switzerland. This article is an open access article distributed under the terms and conditions of the Creative Commons Attribution (CC BY) license (http://creativecommons.org/licenses/by/4.0/).


