Featured Application
This study investigates how the performance of the real-time monitoring system may affect the capability of a semi-active control strategy in mitigating the structural demand to wind turbines. It provides practical indications on how to select measuring devices and systems with given characteristics that help to improve, rather than reduce, the ability of the semi-active control system to reduce the stress and displacement demand to turbines against wind gusts. The results achieved may be of interest to professionals and companies engaged in the design of new wind farms or the repowering of existing plants with innovative systems.
Abstract
In the last decade, some researchers and professionals have been engaged in the study of methods and techniques that can build high wind turbines while containing construction costs within the limits of economic convenience. Among the most promising solutions is that of using innovative devices to mitigate the structural demand for the towers. The reduction in the stress demand in the foundation makes the strategy particularly interesting for the repowering of existing plants, where it is convenient not to demolish and rebuild the foundation, but rather to reuse the existing one for the new plant. A semi-active vibration control strategy, based on the adoption of controllable dissipative devices, is presented herein. The proposed technique requires the tower to be equipped with a measurement system suitable for the real time monitoring of structural response. Performing reliable high-frequency measurements of the horizontal displacement of points located at heights of tens of meters is not simple. With the purpose of assessing the efficiency and feasibility of Global Navigation Satellite System (GNSS)-based systems for the control of wind turbine structures, the proposed paper tries to investigate the characteristics and data processing techniques that are able to make the GNSS useful for such applications. Several numerical simulations were carried out with reference to a case-study wind turbine to quantitatively assess how the performance of the control system changes as the features of the monitoring system worsen, and finally to draw conclusions and suggestions for the minimum performance that monitoring devices must have for an effective reduction in structural demand.
1. Introduction
The market related to wind energy production is very dynamic, with a growing investment trend in the last 20 years mainly aimed at satisfying two needs. The first is to increase the level of productivity of newly installed turbines through the construction of wind towers of greater heights. The achievement of significant heights, however, often has a technological limit, due to the difficulty of the construction, transport and installation of large diameter wind towers, but also the need for adequate foundation systems. The other emerging need is to renew existing wind farms through solutions that make the most of previous investments. In fact, most of the wind turbines in use have an average age between 10 and 15 years. Considering that the life cycle of a wind turbine is estimated to last around 20 years, many installations are nearing their end. In addition, progressive aging causes a reduction in the production capacity of the plant, due to the deterioration of its mechanical and electronic components. Faced with the obsolescence of the plant, the possible solutions available to the wind farm manager consist of decommissioning (dismantling the wind farm), or extending its useful life with targeted interventions to improve the existing farm, or finally in the upgrading of the existing turbine system (repowering) through the adoption of innovative solutions. In this context, the present work intends to provide a novel contribution, with extended research compared to what the authors have shown in a previous conference article [1].
In this context, in recent years, researchers in the field have investigated the potential of many technical strategies in reducing the demand for stress at the base of the wind towers and, consequently, the stress to the foundation system. In fact, these techniques allow the building of high wind towers with relatively small transverse dimensions and less impressive foundation systems. The reduction in the stress demand in the foundation makes the strategy particularly interesting for the repowering of existing plants, where it is convenient not to demolish and rebuild the foundation, but rather to reuse the existing one for the new plant.
One of the first studies about the use of external devices for wind turbines to reduce structural demand was that of Enevoldsen Mørk in 1996 [2]. In that research, a Tuned Mass Damper (TMD) was applied at the top of a wind turbine in order to optimize the tower with regard to material yielding, buckling, and fatigue failure. A few years later, the first scientific work about the use of a semi-active device on wind turbines was published by Kierkegaard et al. [3]. The semi-active device was based on the use of magnetorheological (MR) fluid, later designed and tested by Caterino [4] with the same purpose of reducing tower vibrations and force demand. Martynowicz [5,6] also pursued his studies about MR for the semi-active control of wind turbines, while Som and Das in 2016 [7] studied the effects of the MR in controlling the response of an offshore jacket platform against earthquakes. Hybrid applications of the MR device combined once with a Tuned Vibration Absorber (TVA) and once with a Tuned Liquid Column Damper (TLCD) are proposed by Martynowicz, and Sarkar and Chakraborty [8], respectively. Another semi-active device for similar aims is the so-called STMD (Semi-active Tuned Mass Damper), proposed by Arrigan et al. [9], by Park et al. [10], by Sun [11,12], and by Hemmati and Oterkus [13], in order to reduce the overall structural vibrations. A semi-active TLCD was used by Yalla et al. [14], Karimi et al. [15], and by Luo et al. [16], with the goal of dynamic load mitigation.
The focus herein is on a particular semi-active (SA) vibration control strategy which is based on the adoption of controllable energy dissipators. An SA control configuration, presented by the authors in [4,17], is characterized by a cylindrical hinge installed at the base of the wind tower and magnetorheological (MR) devices mounted in parallel with linear elastic springs. The objective is to realize a time-variant base restraint (Figure 1). A properly written control algorithm is needed to reduce the bending moment at the tower’s base, by relaxing the base restraint in suitably selected time intervals. This produces a rocking of the tower’s base and energy dissipation in the MR dampers.
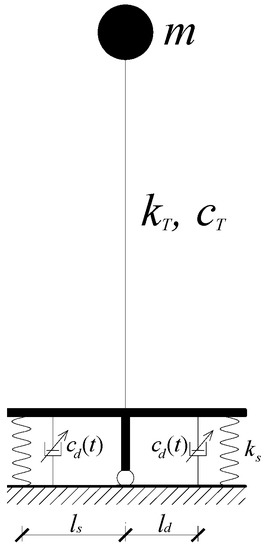
Figure 1.
Smart base restraint including semi-active (SA) magnetorheological (MR) dampers: scheme of the idea.
This proposed control configuration involves a specific instrumentation of the tower in order to monitor, in real time, the structural stresses and deformations, and to permit the control logic to decide the optimal calibration of the variable dampers at each instant. Specifically, the measurement of displacements can be carried out in the laboratory on scaled models, by using typical transducers and fixed external reference structures. On the other hand, in real applications of on- or off-shore wind turbines, it is not trivial to make reliable high-frequency measurements of the horizontal displacement of points placed at a height of tens of meters.
Very few geodetic technologies can fully satisfy the monitoring requirements for the above goal. Global Navigation Satellite Systems (GNSS) are very advanced for continuous and fully automated monitoring. An overview of GNSS-based dynamic monitoring technologies for SHM list can be found in [18]. Many GNSS-based applications of continuous dynamic monitoring of civil structures were recently developed, mainly for tall buildings and long-span bridges [19]. An advantage of GNSS is its ability to directly measure absolute 3-D position coordinates, thus providing displacement measurements in real-time and at full scale.
Usually, GNSS geodetic dual frequency receivers have been used as reliable tool for providing accurate and timely information on the actual status of the structure. The capability of measuring changes in position with a high level of accuracy is extensively achieved by adopting the real-time kinematic (RTK) positioning. In 2019, Xiong and Niu [20] applied the RTK GNSS technique to derive the horizontal displacement of a super high-rise structure under construction (the Tianjin 117 tower). In detail, they applied a Chebyshev high-pass digital filter to the results, in order to compensate the measurement accuracy of RTK-GNSS receivers. The same authors proposed in [21] a combined approach based on the complete ensemble empirical mode decomposition with adaptive noise (CEEDMAN) and wavelet threshold (WT) technique to weaken the influence of background noise of sensors, also applying this methodology to the Tianjin 117 tower.
With the aim of evaluating the efficiency and feasibility of GNSS-based systems for structural control of wind turbines, this paper tries to obtain insight into the characteristics (receiver type, type of observables, sampling data rate) and data processing techniques that can make the GNSS useful for such applications.
The authors have considered a case study structure consisting of a real 3MW, 102.4-m tall wind turbine. They have performed numerical investigations and evaluated how the specific characteristics of the measurement system may influence the ability of the SA control technique to reduce the structural demand with respect to the fixed base configuration of the same wind turbine. The roles of sampling rate and latency are mainly investigated, with extended research compared to the conference paper [1], highlighting that they may significantly reduce the effectiveness of the SA system. Therefore, after a description of the smart base restraint, designed for high wind turbines, and of a Global Navigation Satellite system for structural monitoring, the authors have performed a sensitivity analysis for the GNSS system by analyzing the role of frequency, latency and accuracy in measurements.
2. A Smart Base Restraint for High Wind Turbines to Mitigate Structural Demand
Caterino et al. [4] proposed their new idea of base restraint, able to reduce the structural demand on high-rise wind turbine towers induced by wind. It is an SA rocking system including devices based on controllable fluid, as reported in the scheme of Figure 1: the uncontrolled wind turbine is fully restrained at the base and a single degree of freedom dynamic system with top mass m, stiffness kT and inherent damping cT, can be used to simulate it. Figure 1 evidences the proposed smart restraint at the base: its stiffness can be instantaneously varied during the motion by installing a smooth hinge at the base of the tower, two vertical linear springs (ks) mounted at a distance ls from the hinge, and two vertical SA MR devices (cd) at a distance ld from the central hinge. The aforementioned control system can produce a real-time modification in the system’s stiffness by modifying the MR devices’ mechanical properties according to a properly formulated control logic. A simple physical approach was developed by the authors with the aim of reducing base stress and simultaneously restraining the increase in top displacements within certain limits to control second-order effects: the purpose was to produce a trade-off between the contradictory objectives to limit the base stress σlim and the top displacement xlim.
A “bang-bang” control logic makes the base restraint “stiffer” (i.e., switching ON the MR devices by setting the intensity of current intensity to the maximum value, imax) as long as the limit value for base stress, σlim, is not exceeded. Conversely, it “relaxes” the base restraint (i.e., switching OFF the dampers feeding the minimum level of current, imin, generally suitable to be 0) when such a limit for stress is overpassed and if the top displacement does not exceeds the acceptable value xlim. Actually, in this way, the structure converts its potential energy into kinetic energy. The following equation describes how the control logic works in all the possible state combinations for the two indices for the instantaneous structural demand
where σ(t), x(t) and ẋ(t) are, respectively, the value of stress at the base, top displacement and top velocity at the instant of time t. When both stress and displacement are beyond their threshold values, the controller switches the dampers to an ON state if the displacement is moving towards a larger value (i.e., positive velocity), thus trying to damp or invert the displacement’s trend; otherwise, it switches the MR devices to an OFF state to an OFF state so as to allow base rotation and energy dissipation, finally reducing demand for stress. The springs have also the role of inducing the recentering of the tower to the initial position at the end of a severe wind-induced excitation.
3. Structural Monitoring via Global Navigation Satellite System: The Case of High Wind Turbines
The use of GNSS receivers has long attracted attention in the monitoring of structures subjected to dynamic loads [22], even though they had been developed for use in positioning applications such as geodetic surveying and navigation.
In the area of structural health monitoring (SHM), particular research efforts have concerned the real-time measurement of the dynamic response of engineering structures such as skyscrapers, towers, and large span bridges. Typically, an SHM system uses several sensors for the real-time evaluation of the state of health of the structure to which they are applied. Relative displacements can be used to monitor the system performance and to carry out early damage detection.
Orthodox monitoring approaches, including accelerometers and robotic total stations, have been used to evaluate structural vibrations and dynamic displacements. GNSS systems have also been employed in the dynamic measurements of flexible structures for SHM [23,24,25]. In 1993, the NAVigation Satellite Timing And Ranging Global Positioning System (NAVSTAR GPS) system was for the first time used in order to measure the dynamic displacements of the Calgary tower in Canada. Results achieved, collecting data at 10 Hz, reached a millimeter-level accuracy, showing a vibration frequency, under wind loading, of about 300 mHz in both north–south and east–west directions and the horizontal movement of ±15 mm was measured at 160 m above ground level in the north–south direction [26]. Satellite positioning techniques have been largely used for bridge monitoring. In 1996, the Humber Bridge located near Kingston upon Hull, East Riding, of Yorkshire, England was one of the earliest long span bridges to be monitored with real-time trough kinematic GPS methods. The achieved results showed a ±1 mm horizontally and ±3 mm in height resolution, respectively [27,28]. More recently, Yu et al. [29] carried out a series of experiments on a medium span suspension bridge, the Wilford bridge located in Nottingham (UK), by using GNSS technology for its dynamic monitoring. Three different GNSS data-processing strategies, real-time kinematic (RTK), network RTK and post-processing kinematic (PPK), were considered. The RTK strategy was developed in the mid-1990s. It involves a reference receiver transmitting its raw measurements or observation corrections to a rover receiver via a data communication link. This strategy can guarantee up to sub-millimetre-level accuracy. The data-processing at the rover site includes an ambiguity resolution of the differenced carrier phase data [30,31,32].
Using the multimode GNSS data and a multimode adaptive filtering algorithm, the dynamic displacements of the bridge were identified with sub-millimetre-level accuracy by Yu et al. [29], showing the capability of monitoring the vibration response of medium span bridges. The real-time monitoring of structures like tall buildings and long-span bridges characterized by a long period has become progressively popular due to improvements in the sampling rates of GNSS receivers and developments in integrated systems (see, for example, [25]). Both the quasi-static and dynamic responses are measured either as displacement or acceleration resulting from wind or seismic actions. Compared to orthodox conventional monitoring that used accelerometers, this technology can reliably measure the relative displacements real-time with a sufficient accuracy.
Attention to the SHM technology has increased in recent years, including in the wind turbine sector. Although some research has applied GNSS to wind turbines for the SHM application [33], the GNSS use for SA control of wind turbine structures is still rare and there is a lack of knowledge regarding measuring displacements for the SA control purpose using GNSS.
RTK(Real-Time kinematic)-GNSS(Global Navigation Satellite System) in Wind Turbine SA Control
GNSS receivers can be categorized by their characteristics. Some receivers (called single frequency) can use only the coarse acquisition code and carrier phase tracking on the L1 frequency. Other receivers track both code and carrier phase signals on two different frequencies (dual-frequency). Finally, the most advanced receivers can track all in-view constellations (GPS, GLONASS, Galileo, BeiDou, QZSS and SBAS) on more than one frequency [31,32,34]. The more aspects of the GNSS signal a receiver can employ, the greater its flexibility, but, also, the greater its cost. It is important to understand receiver characteristics and limitations to ensure that the capability of a receiver is matched to the required outcome of the SA control purpose [35].
Global navigation satellite systems provide various types of positioning state solutions, depending on the types of observables used in the positioning and navigation algorithms, the number of observation epochs required to obtain a solution, and the number of receivers needed for the position estimation. In GNSS, there are two types of observables: the code pseudorange and the carrier phase, that is, the basis of the techniques used for high-precision positioning [32].
Real-time kinematic (RTK) positioning makes use of carrier phase measurements in the relative positioning mode. In addition to the rover receiver, used for the local positioning, one reference station receiver, or a network with a priori known coordinates, are employed, along with a data link to continuously transmit measurements from the base station to the rover, sometimes over the Internet using cellular or wireless service, or radio signal. The RTK solutions are derived from the current epoch instantaneously. The basis of RTK is the implementation of the on-the-fly (OTF) ambiguity resolution AR algorithms. It is possible to perform the AR process in less than 10 s under the best circumstances, where the distance between the base and rover receiver is 10–15 km, which can be increased if a network-based RTK service (with a 50–70 km inter-receiver spacing) is available, the receivers are tracking a large constellation of satellites with low GDOP, the receivers are multi-frequency, or the multipath and receiver noise are low [34]. RTK is the most attractive technique for high-accuracy instantaneous positioning, as the coordinate solutions are obtained in the field with a centimeter-level accuracy and can be used immediately for both kinematic and time-critical static applications such as precise navigation, machine guidance and control. As an emerging trend, RTK-based guidance systems are employed, in particular, in all phases of the agricultural operations to perform every activity on the crop, from soil preparation to harvesting, and they help farmers to choose consistent driving strategies, enabling an increase in accuracy and productivity and a decrease in time and operating costs. GNSS-based mechanic guidance systems can be used to provide real-time positioning information to support the precise maneuvering of tractors, avoiding diversions from the desired trajectory [36,37].
RTK-GNSS measurements have the potential to be considered as a suitable candidate for wind turbine SA control. However, some real-world challenges arise to supply information on the absolute and relative displacements for the SA control implementation. RTK positioning is a much more complicated and vulnerable process, even in favorable conditions. Achieving reliable centimetre-level accuracy with as few as possible data epochs in real-time is not easy in the harsh environment encountered in wind turbines.
In RTK mode, as any kind of carrier phase solution, in order to obtain centimeter-level positioning accuracy, an ambiguity-fixed solution is necessary, which indicates that the number of full-phase cycles between the receiver and the satellite at the first instant of the receiver’s lock-on are fixed at integer values. Otherwise, a float solution is obtained, which means that only real-valued ambiguity parameters are obtained, and the positioning accuracy degrades to the decimetre level. Therefore, for real-time instantaneous (or quasi-instantaneous) applications, the “time-to-fix-ambiguities” (TTFA) is crucial. The AR process becomes more reliable, and the robustness of the RTK increases, the closer the rover is to the base receiver, due to the spatial correlation of the GNSS errors with the exceptions of multipath and receiver noise. Any two receivers that are relatively close together, simultaneously track a particular satellite and they will experience similar errors. The shorter the distance between the two receivers, the more similar the errors, and therefore the common errors will be removed or reduced by the difference between the measurements of the two receivers.
Using a single reference base station that is not too far away and provides all rovers on-site continuously with RTK differential corrections, high-end GNSS rover receivers can calculate position using carrier phase measurements in fixed integer carrier phase ambiguity mode with a precision of less than 1 cm (Figure 2).
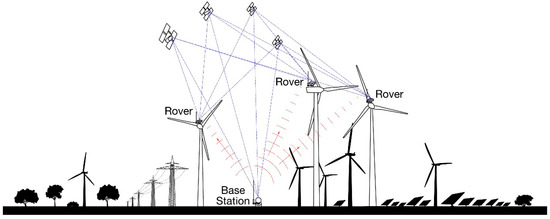
Figure 2.
Schematic of real-time kinetic (RTK)-global navigation satellite system (GNSS) method.
Furthermore, when lock is lost, a cycle slip occurs; this can be a power loss, an obstruction or low SNR. The integer lock is lost and the AR process must be re-initialized. Obstructions hindering satellite visibility (e.g., rotor blades) such as unexpected errors (e.g., multipath) related to observation conditions that are difficult for GNSS could result in incorrect ambiguity fixes, degrading the accuracy of the position even up to tens of centimetres. Therefore, to obtain an accurate and reliable RTK fix and to detect real displacements from the measurements, greater care has to be taken to characterize the RTK performance and to address each individual error present in GNSS data.
The multipath is still one of the main error sources in GNSS positioning. It degrades the accuracy of position solutions. The multipath is difficult to eliminate by standard differencing techniques, since it is highly correlated with observation environments [38]. The straightforward multipath mitigation method is to select a favorable environment to reduce the reflections surrounding the antenna, however this possibility is not feasible for wind turbine applications, since the reflection is inevitable due to the presence of blades placed near the tower. Therefore, the demand for high accuracy positioning, along with the improvement in the performance of ambiguity resolution, requires us to address the multipath: wavelet analysis can be used to extract the time-varying frequency and magnitude contents of the multipath [39].
GNSS receivers that are able to track multiple GNSS constellations can lead to improvements in the performance of RTK positioning, since the increased number of satellites makes accurate position measurements more likely and at the same time enables the receiver to exclude satellites with a poor signal, which improves the accuracy and reliability of positioning. The GPS from the USA has led the satellite positioning in recent decades, although lately a number of devices that use the Russian GNSS system named GLONASS have rapidly expanded, since the constellation expanded to 24 operational satellites. Moreover, many devices lately are compatible with the European GNSS system, Galileo, which is currently (March 2020) in its full operational capability (FOC) phase: 22 FOC satellites were launched up to the end of 2019, in addition to the four IOVs launched between 2011 and 2012. However, of these 26 satellites only 19 FOCs and three IOVs are declared usable, as the other four had problems during their life in orbit [40,41,42,43,44,45,46]. The Galileo navigation signals are transmitted in the four frequency bands, depicted in Figure 3 below. These four frequency bands are the E5a, E5b, E6 and E1 bands. They provide a wide bandwidth for the transmission of the five Galileo Signals, whose names are E1, E6, E5, E5a, E5b. The names of the Galileo signals are the same as the center frequencies on which they are carried [47]. The numerical values are reported in the Table 1.
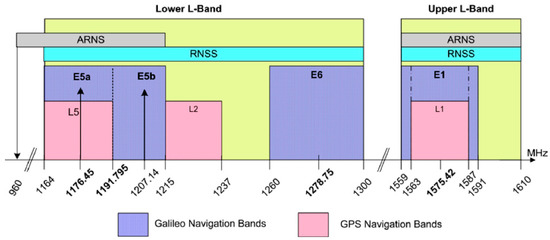
Figure 3.
Galileo frequency plan [47].

Table 1.
Galileo carrier frequency per signal [47].
This gives more possibilities for the implementation of real-time GNSS solutions to provide continuous monitoring. In order to assist the SA control system in making better decisions by providing precise on-time information, the ability to detect and characterize displacements quickly and to update the position can make a crucial difference in the wind turbine SA control. The availability of low-latency data has a fundamental impact on how we perform the SA control, since the size of latency in practice cam result in wrong real time information. Latency is the time taken for the receiver to calculate and output a position. Lower latencies and higher position update rates mean that the SA control system is more responsive and can be operated without loss of performance. GNSS monitoring receivers are used, typically gathering high-rate data at 10–20 Hz. Acquiring data at the maximum sampling rate, up to 50–100 Hz (ultra-high-rate), the highest performing receivers could identify high structural vibration frequencies of up to 10 Hz [48,49], with latencies of less than 20 ms. Table 2 exhibits up-to-date GNSS receivers, their accuracies for RTK positioning and the maximum sampling rate, based on the brochures provided by manufacturers. The achievable accuracies reported in table are expressed by two terms. The first term is a fixed part while the second varies according to the distance between the rover and the base station, expressed in parts per million (ppm). So, in the case of a baseline of 1 km, 1 ppm means that one millionth of 1 km (1 mm) must be added to the fixed part to get the final accuracy.
Table 2.
GNSS Receivers for RTK positioning based on brochures in 2020.
4. Monitoring and SA Control of a Case-Study Wind Turbine: Sensitivity Analysis for the GNSS System Features
This section refers to a case study to investigate whether and how the characteristics of the monitoring system of the under-wind loads of a turbine can affect the effectiveness of the SA control strategy described above. In particular, the role that accuracy, latency and frequency of measurement can play in this context is discussed.
The case study structure is a prototype real wind turbine (Figure 4a). It is a 3 MW wind turbine with a horizontal power transmission axle, 102.4 m tall, with a variable hollow circular cross-section whose external diameter is variable from 2.30 (top) to 4.15 m (bottom), and whose thickness is variable from 14 (top) to 40 mm (bottom). A lumped mass of 111 t is placed at the top of the tower. The base of the prototype structure is highly stiff and is supported in the middle by a cylindrical steel hinge. On both sides of the base, one cylindrical spring (1417 kN/m stiff) and one SA MR damper are installed (Figure 4b, where ls = 13.04 m and ld = 9 m) in parallel. Each damper may have two operating modes, ON and OFF, that correspond to an equivalent damping constant equal to cd,ON = 6’173 MNs/m and cd,OFF = 1.235 MNs/m, respectively. A finite element model [17] has been implemented in a MATLAB enviroment in order to simulate the dynamic behavior of the case study structure. It consists of 37 elements; 36 elements simulating the tower, while the last element (37th) is more rigid and represents the connection of the top of the tower to the barycenter of the nacelle. The nacelle and its internal components are represented by a concentrated mass at the top of the structure, with no dynamic interaction considered. The base support has been modeled by a rotational spring and a Maxwell element (representing the MR dampers) working in parallel. The Maxwell element, as is known, consists of a spring and a linear viscous damper: the controllable part of this device is represented by the damping constant, while the stiffness of the spring has been simply assumed to be high enough so as to behave like a rigid link.
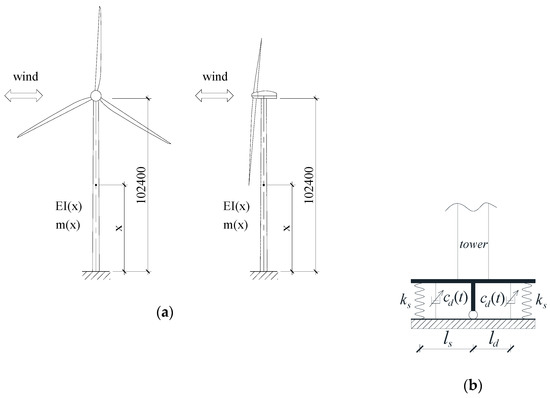
Figure 4.
(a) “Fixed base” configuration of the case-study wind turbine (dimensions in mm). (b) Base restraint for the SA controlled configuration.
An extreme operating gust (EOG) loading has been considered in the following as reference wind action: a sharp increase, then a decrease, in wind speed within a short period of time. Chen and Georgakis [58] defined an equivalent base acceleration time history (Figure 5), that is, the base input that would provide the same top mass response of the real fixed base structure subjected to the wind action. The values adopted to calibrate the SA control algorithm are xlim= 900 mm and σlim=10 MPa.
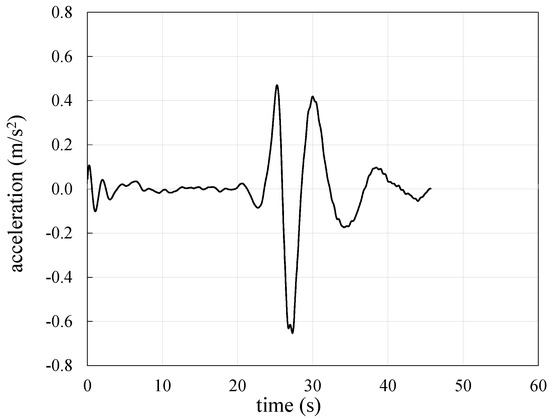
Figure 5.
Equivalent base acceleration time history for the extreme operating gust (EOG) wind load case.
The control algorithm establishes in which instants it is more appropriate to command the OFF state for the MR dampers (i.e., i = 0) and in which it is more convenient that they are set to ON (i = imax) according to Equation (1). To do this, it is necessary to know the demand for bending stress at the base of the tower, as well as the displacement and the horizontal velocity at the top of the tower, in the same instant of time. The stress monitoring at the base is carried out indirectly, starting from the measurement of the deformation, through the use of traditional strain gauges and knowing the modulus of elasticity of the material. Here, a focus is made on how to measure the other two quantities, namely top displacement (direct measurement with GNNS) and top velocity (indirect evaluation, as an online derivative of displacement). The following sections carry out a sensitivity analysis for the GNSS system by analyzing the role of frequency, latency and accuracy in measurements influencing the effectiveness of the proposed “smart” strategy for structural control.
4.1. The Role of Frequency in Measurement
In some structural control applications, the MR dampers are calibrated only once in the triggering phase of an extraordinary load (e.g., earthquake [59]), and then they behave passively during the remaining part of the dynamic excitation. In these cases, the role of the structural monitoring is of secondary importance, if not null. Nevertheless, the effectiveness of such systems generally is reduced compared to those cases where the continuous optimal calibration of the devices is done, adapting them to the instantaneous stress state. In the latter case (i.e., that of this research), the frequency of calibration over time can play a decisive role in the effectiveness of the structural control, and depends on the frequency of measurement of the dynamic response parameters involved in the control algorithm.
In order to evaluate this incidence with reference to the case study, nine cases of SA control have been considered, each assuming a different frequency of acquisition (from 10 to 1000 Hz) of the structural response data needed to make the controller decide the optimal calibration of MR dampers. A value of latency equal to zero has been assumed, as well as 1 mm for measurement accuracy (best case). In short, in each test, measurements are made with different monitoring systems, and a different sampling rate, fixed around the typical values for commercial devices (Figure 3). The 1000 Hz case has been considered as an ideal case, being hard to implement in real applications.
Table 3 compares the structural responses of the wind turbine under the same EOG wind load, in both the fixed base and SA control configurations. When the acquisition is slower, the efficacy of the SA control strategy is lower in terms of reduction in base stress demand (reduction of 84% for command at 1000 Hz, of 50% at 10 Hz); even if in the worst case (10 Hz), the peak value is still half than that recorded in the fixed base configuration. This is explained by the fact that the controller can calibrate the MR devices much less frequently when low sampling rate devices are used for measurements, as confirmed by the number of switches ON→OFF and OFF→ON in Table 3. This means that the configuration of MR dampers during the motion is far from optimal most of the time (note the number of operations commanded by the control logic: 62 at 10 Hz, 1648 at 1000 Hz). From the last column of the table, one can observe that the base rotation is not significantly different in all the cases. This is an important result: even in cases where the measuring system is not performing and does not allow frequent control of the system, the latter’s behaviour has no dangerous deviations for the safety of the devices placed at the base of the tower, i.e., for the overall system. The top displacement demand results are not so dependent on the sampling time of the monitoring system.
Table 3.
Peak response of the wind turbine by varying the frequencies of measurements.
Figure 6 shows the trend of the response parameters over time for the most representative of the above cases (a selection has been made to ensure the readability of the figures). It is worth highlighting that the base stress demand over time is much more variable in the case of a lower sampling rate of measurements. This fact may determine a higher risk of failure due to cyclic damaging and fatigue. The effect of the sampling rate on the displacement demand is less evident.
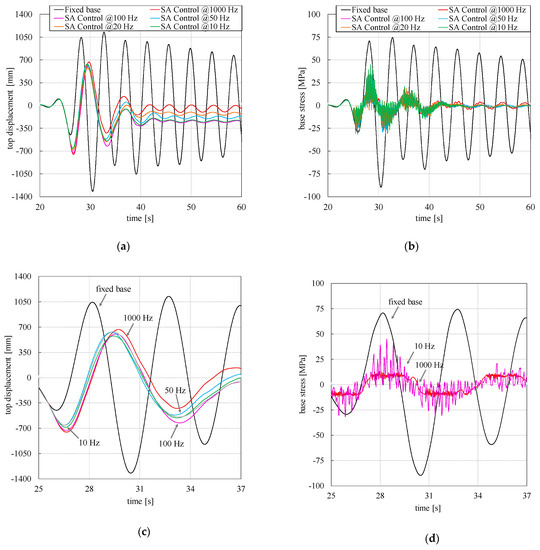
Figure 6.
(a) Displacement and (b) stress response for different frequencies of measures for control, (c) zoom of panel (a), (d) zoom of panel (b).
To understand how much the load case intensity can count in the current investigation, the sensitivity analyses for variable frequency were repeated for a wind action equal to 75% and then 50% of the reference’s extreme load case. Figure 7 shows the results obtained for each of the nine acquisition frequencies. The horizontal lines in parts (a) and (b) of the figure show the peak values of the structural response of the fixed base configuration for each of the three load cases. It can be observed that the performance trend of the control system with varying frequency is not very different for the different load cases, but the curves become gradually “flatter” as the intensity of the wind decreases. This aspect is highlighted even more in Table 4, where the range of variability in the structural response against the three load cases is reported for the frequency range 10–1000 Hz that was investigated. This outcome can be explained by the less intense wind gust which causes the control system to intervene less. For this reason, the acquisition frequency plays a less significant role in influencing the effectiveness of the mitigation system. Conversely, when the wind intensity is high, the more severe structural response requires a much more frequent intervention by the control system, which therefore requires high-frequency monitoring to work.
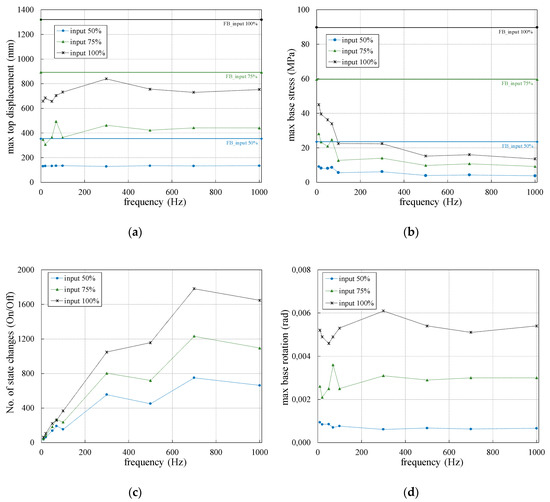
Figure 7.
Response of the wind turbine for different frequencies of measurements: peak top displacement (a), peak base stress (b), No. of state changes (c), peak base rotation (d).
Table 4.
Range of demand reduction against the three load cases for the range 10-1000 Hz of SA control frequency.
4.2. The Role of Latency in Measurement
Nine cases of SA control have been considered, each time assuming a different latency of the measures from the monitoring system (from 0 to 100 ms). A value of frequency equal to 1000 Hz has been assumed, as well as 1 mm for measurement accuracy (best case). In other words, for each test it has been assumed that measurements are made with different monitoring systems, with different delays in the control chain due to the limited performance of the measurement platform. The 0 ms (no latency) case has been included as an ideal case, which is hard to achieve in real applications.
It can be observed from Table 5 that latency plays a fundamental role and can greatly influence the response of the controlled system. When the delay in the transmission of the data (time that elapses between the instant in which the measured phenomenon occurs and that in which said information is transmitted to the control system that calibrates the devices) is very low (0–10 ms), the reduction in the demand for bending moment at the base of the tower compared to the case of “fixed base” is very relevant (about 80%). This reduction gradually becomes less significant for systems characterized by higher signal latency, reaching values of 50%–60%, then 20% in the worst case (latency 60 ms). The latter case highlights that, in some cases, latency can lead to questioning even the economic convenience in adopting the proposed control strategy, and that it is a figure to be held in great consideration when designing the monitoring system for such applications.
Table 5.
Peak response of the wind turbine by varying the latencies of measurements.
From the last column of Table 5, one can observe that the base rotation is not significantly different in all the cases, as was already observed in the previous section for variable measurement frequency. The peak values of the top displacement demand result change with latency in the range 25%–50%, which is acceptable considering that the goal of the control technique is mitigating stress demand while preventing the displacement demand from getting worse than in the fixed base case.
Figure 8 shows the trend of the response parameters over time for some of the above cases (a selection has been made in this case to ensure the readability of the figures). It is worth observing that the demand of base stress over time is much more variable in cases of higher latency of measurement. As discussed in the previous section, this may cause fatigue and may lead to the premature structural collapse of the tower.
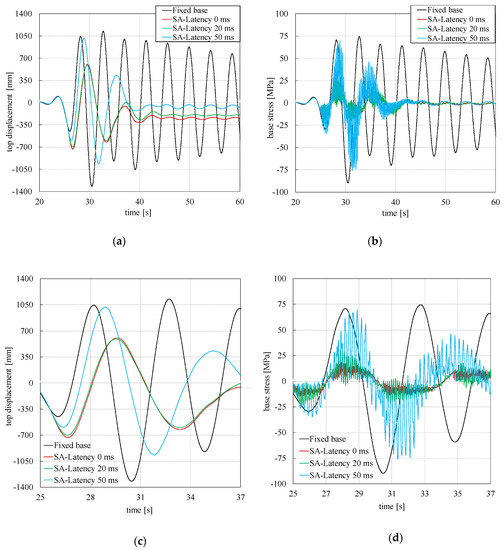
Figure 8.
(a) Displacement and (b) stress response for different latencies of measures for control, (c) zoom of panel (a), (d) zoom of panel (b).
For latency, the above sensitivity analyses were repeated for a wind action equal to 75% and then 50% of the reference EOG case. Figure 9 shows the results obtained for each of the eight latencies. The horizontal lines in parts (a) and (b) of the figure show the peaks in the response for the fixed base configuration and each of the three load cases. It can be deduced that the performance of the control system is more variable with the latency when the intensity of the wind increases, even if the curves are “flatter” for lower load cases. This consideration is pointed out in Table 6, where the range of variability of the structural response against the three load cases is shown for the investigated latency range 10–100 ms. This outcome is expected, since a more intense wind gust calls the control system to intervene more frequently, and the latency plays a significant role in influencing the effectiveness of the control system.
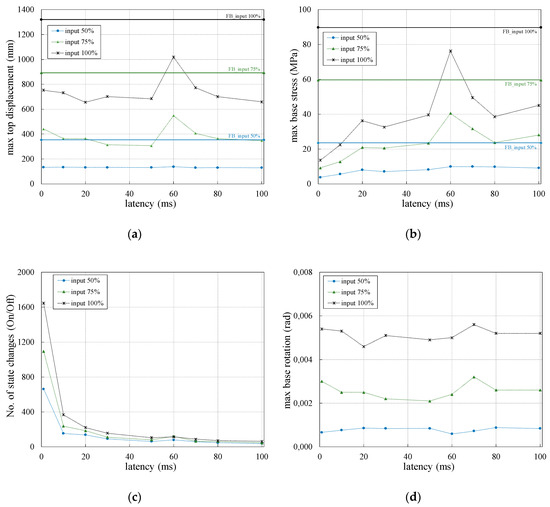
Figure 9.
Response of the wind turbine for different latencies of measurements: peak top displacement (a), peak base stress (b), No. of state changes (c), peak base rotation (d).
Table 6.
Range of demand reduction against the three load cases for the range 10–100 ms of latency in measurements for control.
4.3. The Role of Accuracy of Measurement
As regards the accuracy of the data provided by the GNNS system, sensitivity analyses were also performed for values from 1 to 20 mm (the maximum value among those for devices in Table 2) of accuracy (that is a = 1, 5, 10, 15, 20 mm). This analysis was carried out by simulating the various measurement accuracies in MATLAB. This was done by requiring that the input displacement values for the control algorithm were rounded to the nearest multiple of a. With the same approach as was used for the two previous sensitivity analyses, a value of frequency equal to 1000 Hz and a null latency (best case) have been assumed for the above simulations. It has been found that the structural response is not strongly influenced by the accuracy of the data provided by the GNNS system for all wind cases considered (no percentage change exceeds 1%). However, such a result may depend on the specific control logic, case-study turbine and type of wind load. Therefore, this aspect could deserve further study with different boundary conditions.
5. Conclusions
This work focuses on alternative structural monitoring systems for the semi-active control of wind turbines. Indeed, a strategy for mitigating the structural demand to high turbines proposed in the past by the authors requires continuous monitoring of the demand for base stress and top displacement of the tower. The role that the monitoring system performance can play in limiting or favoring the performance of the “smart” structural protection technique has been investigated herein. To this end, a comparative analysis of the products and monitoring solutions suitable for the purpose (GNNS) and available on the market was first conducted, with particular reference to the characteristics of greatest interest for the specific application (frequency of acquisition, latency, accuracy of measurements). Based on this investigation, an analysis of the sensitivity of the effectiveness of the structural control system to changes in the properties of the monitoring system was then carried out. This was made with reference to a realistic case study of a wind tower about 100 m high, and was solicited by an extreme gust. The performance of the measurement system in terms of acquisition frequency, latency, and accuracy were assessed separately, one at a time. With regard to the last aspect, the numerical simulations have shown that the performance of the control system is not tangibly affected by the accuracy of the measurements, even when these are the standard for entry level devices (20 mm). The sampling rate and latency can play, however, a crucial role, since they may lead to an ineffective calibration of the variable devices, because they are not timely. It must be said that, even in the worst cases (10 Hz frequency and 100 s latency), the response of the “controlled” wind tower is no worse than it would have in the standard “fixed base” configuration. However, the advantages of adopting the proposed special structural protection system are reduced. It has been observed that when a high-performance monitoring system is adopted, the structural response in terms of stresses at the base and displacements at the top turns out to be consistent with the limit values that the control logic is calibrated and based on. As the performance of the measuring system worsens, the stresses also exceed the threshold values by two or three times, while remaining lower than those of the “fixed base” system. The response in terms of top movement is also affected, but to a lesser extent.
By comparing the structural response against different wind load intensities, it has also been shown that the worsening of this response to the worsening of the monitoring system’s performance is gradually more accentuated as the intensity of the external action increases.
In summary, the adoption of measurement devices and technologies able to guarantee an accuracy of no more than 20 mm, a frequency no less than 100 Hz, and a latency in data transmission no more than 10 ms, is suggested at the end. Conversely, the structural response risks assuming peak values of double this, with respect to the target established in the calibration of the control algorithm. It is worth underlying that the simulations were conducted with reference to a limited number of load cases, and a single type of wind turbine and control algorithm, therefore the outcomes cannot be generalized without reservations. Nevertheless, they provide useful information for making preliminary decisions when designing a semi-active control system to be integrated with the necessary monitoring system.
The authors intend to carry out future field trials to validate the results of this numerical research as well as comparative evaluations of the various technologies, considering the costs involved. Once the activities, with reference to the single turbine, are completed, the authors believe it is important to extend this research work to a wind farm made up of dozens of towers. This also combining the monitoring of absolute displacements of individual towers with that of relative displacements between adjacent towers.
Author Contributions
N.C. and G.P. contributed for conceptualization, methodology, writing original draft, supervision, project administration and funding acquisition. M.S. and U.R. contributed for data curation, software, visualization, writing original draft, review and editing. All authors have read and agreed to the published version of the manuscript.
Funding
The research activity has been supported by the University of Naples ‘Parthenope’ with a 2017 grant within the call ‘Support for Individual Research for the 2015–17 Period’ issued by Rectoral Decree No. 289/2017. The abovementioned support is acknowledged.
Conflicts of Interest
The authors declare no conflict of interest.
References
- Caterino, N.; Pugliano, G.; Spizzuoco, M.; Robustelli, U. Feasibility and assessment of real time monitoring systems for smart structural control of wind turbines. In Proceedings of the XV Conference of the Italian Association for Wind Engineering (IN-VENTO 2018), Napoli, Italy, 9–12 September 2018. [Google Scholar]
- Enevoldsen, I.; Mørk, K.J. Effects of a Vibration Mass Damper in a Wind Turbine Tower. Mech. Struct. Mach. 1996, 24, 155–187. [Google Scholar] [CrossRef]
- Kirkegaard, P.H.; Nielsen, S.R.K.; Poulsen, B.R.; Andersen, J.; Pedersen, L.H.; Pedersen, B.J. Semiactive Vibration Control of a Wind Turbine Tower using an MR Damper. In Proceedings of the Fifth European Conference on Structural Dynamics, Munich, Germany, 2–5 September 2002; pp. 1575–1580. [Google Scholar]
- Caterino, N. Semi-active control of a wind turbine via magnetorheological dampers. J. Sound Vib. 2015, 345, 1–17. [Google Scholar] [CrossRef]
- Martynowicz, P. Study of vibration control using laboratory test rig of wind turbine tower-nacelle system with MR damper based tuned vibration absorber. Bull. Pol. Acad. Sci. Tech. Sci. 2017, 64, 347–359. [Google Scholar] [CrossRef]
- Martynowicz, P. Vibration control of wind turbine tower-nacelle model with magnetorheological tuned vibration absorber. JVC 2017, 23, 3468–3489. [Google Scholar] [CrossRef]
- Som, A.; Das, D. Seismic vibration control of offshore jacket platforms using decentralized sliding mode algorithm. Ocean Eng. 2018, 152, 377–390. [Google Scholar] [CrossRef]
- Sarkar, S.; Chakraborty, A. Optimal design of semiactive MR-TLCD for along-wind vibration control of horizontal axis wind turbine tower. Struct. Control Health Monit. 2018, 25, 1–18. [Google Scholar] [CrossRef]
- Arrigan, J.; Pakrashi, V.; Basu, B.; Nagarajaiah, S. Control of flapwise vibrations in wind turbine blades using semi-active tuned mass dampers. J. Struct. Control Health Monit. 2011, 18, 840–851. [Google Scholar] [CrossRef]
- Park, S.; Lackner, M.A.; Cross-Whiter, J.; Tsouroukdissian, A.R.; La Cava, W. An investigation of passive and semi-active tuned mass dampers for a tension leg platform floating offshore wind turbine in ULS conditions. In Proceedings of the International Conference on Offshore Mechanics and Arctic Engineering—OMAE, OMAE2016-54332 AN, Busan, Korea, 19–24 June 2016; Volume 3, pp. 1–10. [Google Scholar]
- Sun, C. Mitigation of offshore wind turbine responses under wind and wave loading: Considering soil effects and damage. Struct. Control Health Monit. 2018, 25, 1–22. [Google Scholar] [CrossRef]
- Sun, C. Semi-active control of monopile offshore wind turbines under. Mech. Syst. Signal Process. 2018, 99, 285–305. [Google Scholar] [CrossRef]
- Hemmati, A.; Oterkus, E. Semi-Active Structural Control of Offshore Wind Turbines Considering Damage Development. J. Mar. Sci. Eng. 2018, 6, 102. [Google Scholar] [CrossRef]
- Yalla, S.K.; Kareem, A.; Kantor, J.C. Semi-active tuned liquid column dampers for vibration control of structures. J. Eng. Struct. 2001, 23, 1449–1479. [Google Scholar] [CrossRef]
- Karimi, H.R.; Zapateiro, M.; Luo, N. Semiactive vibration control of offshore wind turbine towers with tuned liquid column dampers using H∞ output feedback control. In Proceedings of the IEEE International Conference on Control Applications, Yokohama, Japan, 8–10 September 2010; pp. 2245–2249. [Google Scholar]
- Luo, N.; Bottasso, C.L.; Karimi, H.; Zapateiro, M. Semiactive Control for Floating Offshore Wind Turbines Subject to Aero-hydro Dynamic Loads. In Proceedings of the International Conference on Renewable Energies and Power Quality, Las Palmas de Gran Canaria, Spain, 13–15 April 2011. [Google Scholar]
- Caterino, N.; Georgakis, C.T.; Spizzuoco, M.; Occhiuzzi, A. Design and calibration of a semi-active control logic to mitigate structural vibrations in wind turbines. Smart Struct. Syst. 2016, 18, 75–92. [Google Scholar] [CrossRef]
- Shen, N.; Chen, L.; Liu, J.; Wang, L.; Tao, T.; Wu, D.; Chen, R. A Review of Global Navigation Satellite System (GNSS)-Based Dynamic Monitoring Technologies for Structural Health Monitoring. Remote Sens. 2019, 11, 1001. [Google Scholar] [CrossRef]
- Chmielewski, T.; Górski, P. Full-scale investigations of civil engineering structures using GPS. In Advances in Civil Engineering and Building Materials, 4th ed.; CRC Press: London, UK, 2015; pp. 171–175. [Google Scholar]
- Xiong, C.; Niu, Y. Investigation of the dynamic behavior of a super high-rise structure using RTK-GNSS technique. KSCE J. Civ. Eng. 2019, 23, 654–665. [Google Scholar] [CrossRef]
- Xiong, C.; Niu, Y.; Wang, Z.; Yuan, L. Dynamic monitoring of a super high-rise structure based on GNSS-RTK technique combining CEEMDAN and wavelet threshold analysis. Eur. J. Environ. Civ. Eng. 2019, 23, 1–21. [Google Scholar] [CrossRef]
- Celebi, M. GPS in dynamic monitoring of long-period structures. Soil Dyn. Earthq. Eng. 2000, 20, 477–483. [Google Scholar] [CrossRef]
- Fuggini, C. Using Satellites Systems for Structural Monitoring: Accuracy, Uncertainty and Reliability, Civil Engineering VIII Nuova Serie (XXII Ciclo). Ph.D. Thesis, Università di Pavia, Pavia, Italy, 2009. [Google Scholar]
- Im, S.B.; Hurlebaus, S.; Kang, Y.J. Summary Review of GPS Technology for Structural Health Monitoring. J. Struct. Eng. 2013, 139, 1653–1664. [Google Scholar] [CrossRef]
- Kaloop, M.; Elbeltagi, E.; Hu, J.; Elrefai, A. Recent Advances of Structures Monitoring and Evaluation Using GPS-Time Series Monitoring Systems: A Review. ISPRS Int. J. Geo-Inf. 2017, 6, 382. [Google Scholar] [CrossRef]
- Lovse, J.W.; Teskey, W.F.; Lachapelle, G.; Cannon, M.E. Dynamic deformation monitoring of tall structure using GPS technology. J. Surv. Eng. 1995, 121, 35–40. [Google Scholar] [CrossRef]
- Ashkenazi, V.; Dodson, A.H.; Moore, T.; Roberts, G.W. Real time OTF GPS monitoring of the Humber Bridge. Surv. World 1996, 4, 26–28. [Google Scholar]
- Ashkenazi, V.; Roberts, G.W. Experimental monitoring of the Humber bridge using GPS. In Proceedings of the Institution of Civil Engineers-civil Engineering; Thomas Telford-ICE Virtual Library: London, UK, 1997; Volume 120, pp. 177–182. [Google Scholar]
- Yu, J.; Meng, X.; Shao, X.; Yan, B.; Yang, L. Identification of dynamic displacements and modal frequencies of a medium-span suspension bridge using multimode GNSS processing. Eng. Struct. 2014, 81, 432–443. [Google Scholar] [CrossRef]
- Wanninger, L. Introduction to network RTK. In International Association to Geodesy Meeting; Working Group; 2004; Volume 4. [Google Scholar]
- Kaplan, E.D.; Hegarty, C.J. Understanding GPS/GNSS: Principles and applications. In GNSS Technology Applications Series; Artech House Publisher: London, UK, 2017. [Google Scholar]
- Leick, A.; Rapoport, L.; Tatarnikov, D. GPS Satellite Surveying; John Wiley & Sons: Hoboken, NJ, USA, 2015. [Google Scholar]
- Mostböck, A.; Petryna, Y. Structural vibration monitoring of wind turbines. In Proceedings of the 9th International Conference on Structural Dynamics EURODYN 2014, Porto, Portugal, 30 June–2 July 2014. [Google Scholar]
- Borre, K.; Akos, D.M.; Bertelsen, N.; Rinder, P.; Jensen, S.H. A Software-Defined GPS and Galileo Receiver: A Single-Frequency Approach; Springer Science & Business Media: Berlin, Germany, 2007. [Google Scholar]
- Strang, G.; Borre, K. Linear Algebra, Geodesy, and GPS; Wellesley-Cambrdige Press: Wellesley, MA, USA, 1997. [Google Scholar]
- Marucci, A.; Colantoni, A.; Zambon, I.; Egidi, G. Precision farming in hilly areas: The use of network RTK in GNSS technology. Agriculture 2017, 7, 60. [Google Scholar] [CrossRef]
- Wang, J.; Feng, Y. Integrity determination of RTK solutions in precision farming applications. In Proceedings of the Surveying and Spatial Sciences Institute Biennial International Conference 2009; Surveying and Spatial Sciences Institute: Adelaide Convention Centre, Adelaide, Australia, 2009. [Google Scholar]
- Wang, D.; Meng, X.; Gao, C.; Pan, S.; Chen, Q. Multipath extraction and mitigation for bridge deformation monitoring using a single-difference model. Adv. Space Res. 2017, 60, 2882–2895. [Google Scholar] [CrossRef]
- Pugliano, G.; Robustelli, U.; Rossi, F.; Santamaria, R. A new method for specular and diffuse pseudorange multipath error extraction using wavelet analysis. GPS Solut. 2016, 20, 499–508. [Google Scholar] [CrossRef]
- Cutugno, M.; Robustelli, U.; Pugliano, G. Low-cost GNSS software receiver performance assessment. Geosciences (Switzerland) 2020, 10, 79. [Google Scholar] [CrossRef]
- Robustelli, U.; Pugliano, G. Assessment of pseudorange measurements of Galileo FOC satellites with incorrect highly eccentric orbits. AIP Conf. Proc. 2019, 2116, 280005. [Google Scholar]
- Robustelli, U.; Pugliano, G. Galileo single point positioning assessment including FOC satellites in eccentric orbits. Remote Sens. 2019, 11, 1555. [Google Scholar] [CrossRef]
- Robustelli, U.; Benassai, G.; Pugliano, G. Signal in space error and ephemeris validity time evaluation of milena and doresa galileo satellites. Sensors (Switzerland) 2019, 19, 1786. [Google Scholar] [CrossRef]
- Robustelli, U.; Pugliano, G. Code multipath analysis of Galileo FOC satellites by time-frequency representation. Appl. Geomat. 2019, 11, 69–80. [Google Scholar] [CrossRef]
- Robustelli, U.; Benassai, G.; Pugliano, G. Accuracy evaluation of doresa and milena galileo satellites broadcast ephemerides. In Proceedings of the 2018 IEEE International Workshop on Metrology for the Sea; Learning to Measure Sea Health Parameters (MetroSea 2018), Bari, Italy, 8–10 October 2019; pp. 217–221. [Google Scholar]
- Angrisano, A.; Gaglione, S.; Gioia, C.; Robustelli, U.; Vultaggio, M. Giove satellites pseudorange error assessment. J. Navig. 2012, 65, 29–40. [Google Scholar] [CrossRef]
- Galileo, I.C.D. Galileo Open Service, Signal in Space Interface Control Document (OS SIS ICD). Available online: https://www.gsc-europa.eu/sites/default/files/sites/all/files/Galileo-OS-SIS-ICD.pdf (accessed on 14 February 2020).
- Psimoulis, P.; Pytharouli, S.; Karambalis, D.; Stiros, S. Potential of Global Positioning System (GPS) to measure frequencies of oscillations of engineering structures. J. Sound Vib. 2008, 318, 606–623. [Google Scholar] [CrossRef]
- Yi, T.-H.; Li, H.-N.; Gu, M. Experimental assessment of high-rate GPS receivers for deformation monitoring of bridge. Measurement 2013, 46, 420–432. [Google Scholar] [CrossRef]
- Leica Geosystems. Available online: https://leica-geosystems.com/-/media/files/leicageosystems/products/datasheets/leica_gm30_ds_en.ashx (accessed on 20 March 2020).
- JAVAD GNSS. Available online: http://download.javad.com/sheets/Delta-3_Datasheet.pdf (accessed on 20 March 2020).
- NavCom Technology, Inc. Available online: https://www.navcomtech.com/navcom_en_US/docs/download_center/data_sheets/current/datasheet_SF3050_20140609a_lowres.pdf (accessed on 20 March 2020).
- GPS & GNSS Equipment, Products and Solutions. Available online: https://www.novatel.com/assets/Documents/Papers/PwrPak7D-PS.pdf (accessed on 20 March 2020).
- Septentrio | Satellite Positioning for Industrial Applications. Available online: https://www.septentrio.com/en/products/gnss-receivers/rover-base-receivers/integrated-gnss-receivers/asterxsb (accessed on 20 March 2020).
- Sokkia Americas/Oceania. Available online: https://us.sokkia.com/sites/default/files/product/downloads/sokkia_gnr5_brochure_sok_1029_revd_sm.pdf (accessed on 20 March 2020).
- Topcon. Available online: https://www.topconpositioning.com/sites/default/files/product_files/mr-2_broch_7010_2211_reva_sm.pdf (accessed on 20 March 2020).
- Trimble - Transforming the Way the World Works. Available online: https://geospatial.trimble.com/products-and-solutions/r9s# (accessed on 20 March 2020).
- Chen, J.; Georgakis, C.T. Tuned rolling-ball dampers for vibration control in wind turbines. J. Sound Vib. 2013, 332, 5271–5282. [Google Scholar] [CrossRef]
- Nuzzo, I.; Caterino, N.; Maddaloni, G.; Occhiuzzi, A. Smart hybrid isolation of a case study highway bridge exploiting seismic early warning information. Eng. Struct. 2017, 147, 134–147. [Google Scholar] [CrossRef]
© 2020 by the authors. Licensee MDPI, Basel, Switzerland. This article is an open access article distributed under the terms and conditions of the Creative Commons Attribution (CC BY) license (http://creativecommons.org/licenses/by/4.0/).