Article

Seismic Retrofitting of Traditional Masonry with Pultruded FRP Profiles

by
Francesca Sciarretta
Department of Architecture, Design and Art, Università IUAV di Venezia, Venice 30123, Italy
Appl. Sci. 2020, 10(7), 2489; https://doi.org/10.3390/app10072489
Submission received: 5 February 2020 / Revised: 27 March 2020 / Accepted: 28 March 2020 / Published: 4 April 2020

Abstract

:

Featured Application

Sustainable and reversible seismic reinforcement of low-rise masonry buildings.

Abstract

This paper presents a study on the potentiality of seismic retrofitting solutions with pultruded Fiber Reinforced Polymer (FRP) profiles. This material can be used in connected frames providing lightweight, corrosion-free and reversible retrofitting of masonry buildings with the moderate requirements of surface preservation. In a hypothetical case study, an experimental program was designed; monotonic shear tests on a half-size physical model of the sample wall were performed to assess the structural performance before and after retrofitting with a basic frame of pultruded Glass Fiber Reinforced Polymer (GFRP) C-shaped profiles, connected to the masonry by steel threaded bar connections. During the tests, the drift, the diagonal displacements in the masonry and the micro-strain in the profiles were measured. The retrofitted system has proven very effective in delaying crack appearance, increasing the maximum load (+85% to +93%) and ultimate displacement (up to +303%). The failure mode switches from rocking to a combination of diagonal cracking and bed joint sliding. The gauge recordings show a very limited mechanical exploitation of the GFRP material, despite the noticeable effectiveness of the retrofit. The application seems thus promising and worth a deeper research focus. Finally, a finite element modelling approach has been developed and validated, and it will be useful to envisage the effects of the proposed solution in future research.

1. Introduction

The aim of retrofitting work is to improve the mechanical performance of a structure or single members of insufficient seismic adequacy. Especially in the case of traditional masonry buildings, the retrofit system must be able to undertake the tensile stresses due to horizontal forces and/or bending/overturning moments. In terms of cultural heritage buildings, the choice of intervention techniques must account for different categories of values and aspects [1].
Moment or braced frames, generally metallic or wooden, are common types of retrofit solutions for low- and medium-rise buildings [2,3]. Their technical and structural advantages are their high extent of reversibility (mostly depending on the wall–frame connections), good compatibility with masonry, high effectiveness in improving the seismic performance of the building and adaptability to changes in actions or resistances [4,5]. Moreover, such solutions have a good potential for sustainability because of their efficient use of material and low cost due to their simple design and quick installation. Frame retrofits allow the relief of the masonry from horizontal in-plane actions. Whenever they can be a viable solution (e.g., in cases portrayed by [6,7,8]), their performance in increasing strength and ultimate drift could be excellent, provided that the load transfer is effective [9].
From the technical, structural and economic/sustainability point of view, pultruded FRP technology has interesting potential to suit moment or braced frame retrofit applications [10,11]. However, no significant applications are known so far. In particular, its light weight and immunity to electro-chemical corrosion and organic attack are indeed advantageous with respect to metallic and wooden frames. Pultruded Fiber Reinforced Polymer (FRP) profiles of the first generation—i.e., thin-walled cross sections with T, double T, C, rectangular, square and circular shapes—are nowadays in common use and promptly available from producers. The use of such building elements is increasing, especially in “all-FRP” structures like footbridges and pavilions [12,13], and in hybrid structures matching FRP to, e.g., concrete or glass [14,15]. However, the availability of seismic design prescriptions is still limited, even if case studies have shown good potential [16,17].
The reversibility and the structural effectiveness of retrofitting are strictly related to the anchoring system. A wide variety of technical studies exist in the literature, from a general point of view, on anchors and fastenings in concrete and masonry structures, which are of interest for connecting retrofitting frames to heritage buildings [18,19,20]. Generally, metallic bolts or bars installed by drilling across the wall’s cross-section, with appropriate bearing plates, nuts and washers, can be used for connecting retrofits to existing masonry structures [21]. European technical documents for the design of steel anchors in masonry recommend minimum spacing values, but do not provide specific capacity requirements [22]; the USA’s recommendations are oriented towards capacity calculation accounting for tensile, shear or combined loading and different failure modes [23]. Generally, the available literature is useful for the peculiar topic of frame connections to historic masonry walls. Moreover, adhesive connections between masonry and pultruded FRPs are recently receiving attention [24,25].
Aesthetic preservation is often the most restrictive value in the choice of a retrofit system. Frame-based solutions, which cannot be hidden inside or beneath the structural members they strengthen, are suitable for buildings of low to moderate surface preservation requirements.
This study aims to explore the feasibility of frame retrofitting of masonry piers with pultruded FRP profiles. It focuses on the in-plane shear behavior, investigated by destructive testing in the laboratory, of traditional clay masonry made of molded solid bricks and lime mortar; FE modelling provides an insight into the effectiveness of the FRP frame retrofit. A half-size approach was deemed necessary for the physical modelling of the case, for reasons of testing equipment availability. In detail, the three dimensions of the wall were reduced by a factor of 0.5, but the size of the bricks and mortar joints could not be scaled accordingly. This would indeed impair the physical model’s accuracy in reproducing a real wall made of the selected materials, however the test’s focus was rather on the assessment of performance improvement, which can be done even if the full-size wall texture is not scaled. The research shows that the investigated retrofit solution is indeed promising, because it grants a significant increase in load and displacement capacity.

2. Materials and Methods

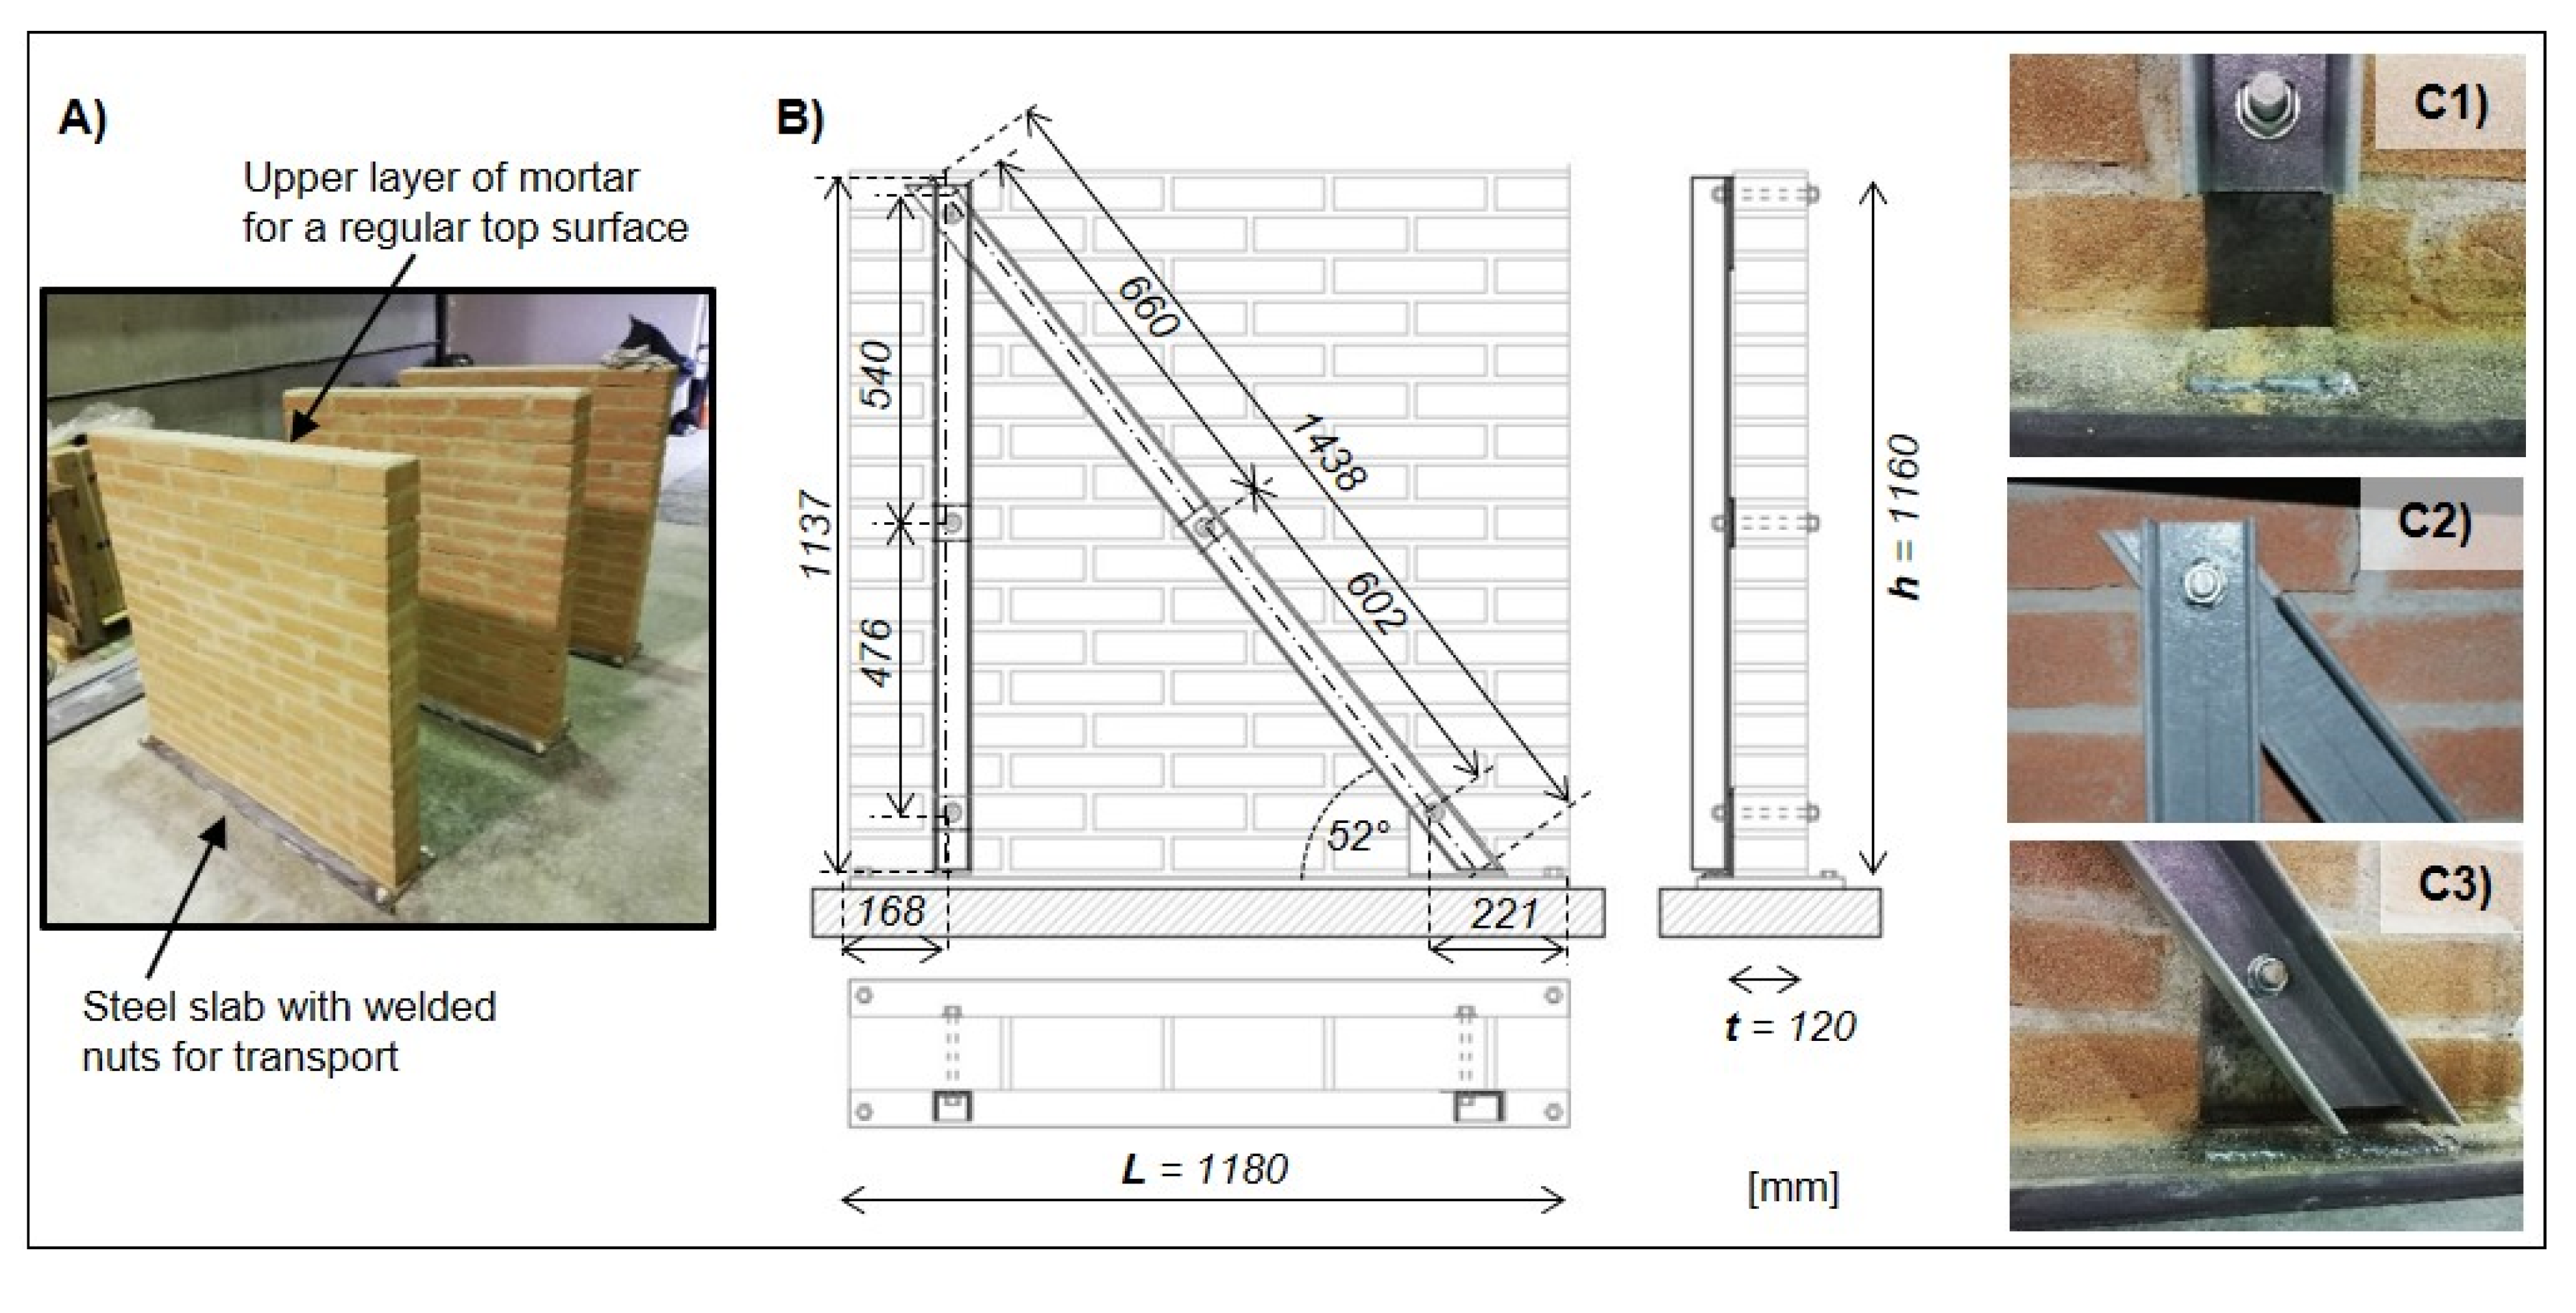
The preliminary design had the purpose of sizing up the frame profiles’ cross sections (assumed to be the same for all the frame’s profiles) and to evaluate the fastening bars’ diameters and positions. The concept of the object of study is described in detail in a published paper [26] and depicted in Figure 1A; the essential information for the scope of the paper is reported in this section. The basic requirements were the following: 1) in-plane retrofitting of the transversal walls of traditional solid brick masonry had to be carried out, 2) the retrofit frames had to be placed on one side of each wall, and 3) a diagonal braced frame pattern, with wall–frame fastenings consisting of threaded steel bars passing through the whole thickness of the masonry, had to be used. A wall thickness of 25 cm was accounted for, as well as a wooden floor deck and truss roof covered with tiles, and typical loads for housing (Table 1). The measures indicated in Figure 1 and in the third column of Table 1 are divided by two to obtain the mass of the half-scale structure.
According to EC8 §3.2.2.5 [27], the base shear load Fb given by the building’s mass was calculated, taking the structure’s period T1 = 0.17 s, behavior coefficient q = 1, soil type C (TB = 0.2 s) and design acceleration ag = 0.2 g into account. Finally, Fb, equal to 50.325 kN, was assumed to be the load on the retrofit frames, equally shared by the transverse walls and distributed linearly along the height. Assuming that the earthquake direction was parallel to the X axis, the middle internal wall subjected to in-plane shear force is the detailed object of study (Figure 1A). A linear FE analysis of the frame under the calculated loading put out a maximum compressive load of 11.5 kN (Figure 1B); this was the design load assumed in the choice of the pultruded profiles for the retrofit. As for the type of material, Glass Fiber Reinforced Polymer (GFRP) was selected due to its wide diffusion as a structural material for pultruded profiles; the main properties of the GFRP, provided by the producer, are listed in Table 2. To make frame–wall connections as simple as possible, C-shaped profiles were chosen and the same cross-section was kept for both the vertical and the diagonal element. The convenient size of the cross-section was determined after the assumption of frame collapse by the buckling of the compressed diagonal. Accounting for a free deflection length of 700 mm, it was found that a 60 × 60 × 5 mm C-shaped profile had a much higher critical load than the design value of 11.5 kN. Nonetheless, the profile had to be large enough to be perforated and cut to the purpose.
The basic concept of the physical model—before its practical realization—was established as depicted in Figure 1C, similar to the frame proposed by Taghdi et al. in [28]. The model of the masonry wall is a 118 × 118 × 12 cm wallette made of 25 × 12 × 5.5 cm bricks of traditional type and hydraulic lime mortar joints 1.5 cm-thick (Figure 1C and Figure 2).
As for the wall–frame connection, each element of the frame is supposed to be anchored to the wall at the ends and at mid-span, with single through bars. A greater number of connection points, or multiple bars, would certainly improve the load transfer from the wall to the frame, but it is reasonable to assume a simple scheme to appreciate the results while coping with the reduced scale of the test. The fastened wall–frame connections were sized up following standard ACI 530/ASCE 5/TMS 402 [15] protocol, assuming only shear stress in the through bars. Accounting for an allowable load VA equal to 12.3 kN (i.e., the maximum absolute axial load in the frame, Figure 1B), Equations (1) and (2) were applied to calculate the minimum diameter of the through bar, assuming as unknown quantity the gross cross-sectional area of the bar AB (mm):
V A = 1072 f c A B 4 ,
V A = 0.12 A B f y ,
being fc the compressive strength of support (= 20 N/mm² i.e., the strength of bricks, see Table 1) and fy the yielding strength of the bar (400 N/mm²). The design value of AB is thus the largest from Equations (1) and (2). Such equations are valid if the distance between the anchor and the next free edge of masonry wall equals or exceeds 12 anchor diameters; thus, a 14 mm bar at a distance of 168 mm from the closest free edge is selected. The frame must also be directly connected to the ground. In this way, the concept of Figure 1C was adapted into the designed system of Figure 2B, where the inclination of the diagonal truss is modified by the need to account for the minimum distance of bolts from the masonry edges.
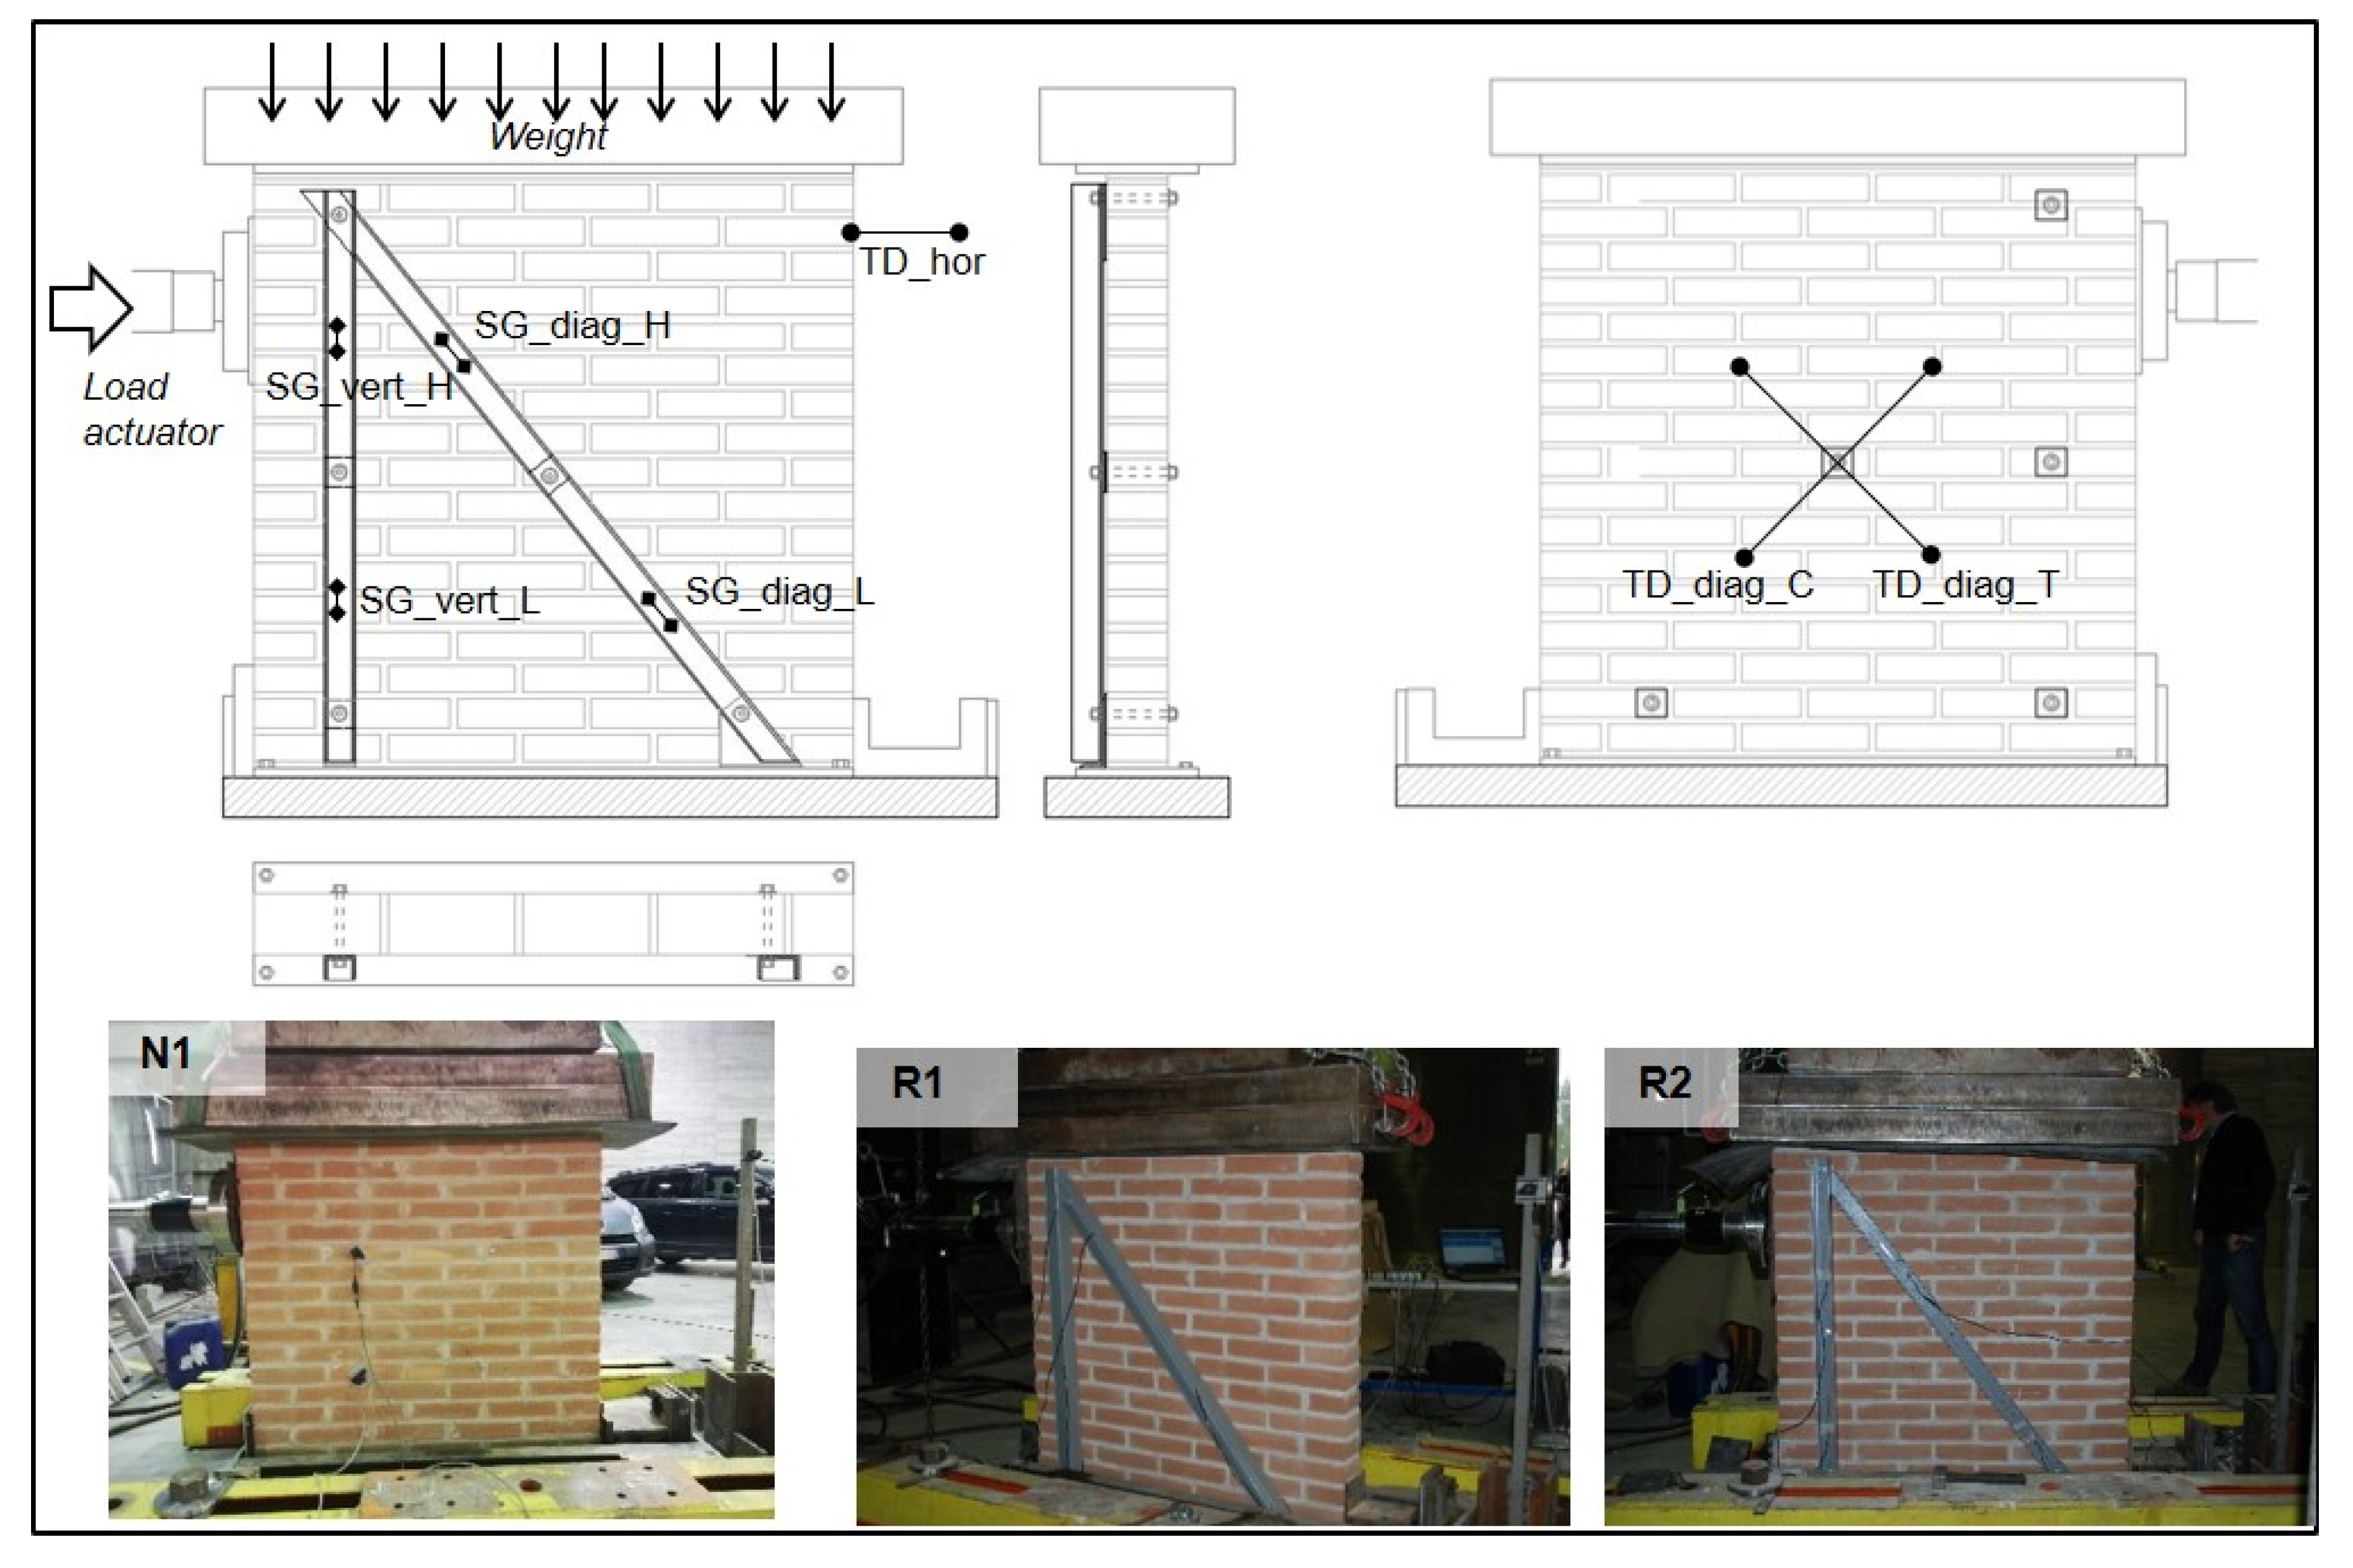
The testing program was carried on at the Laboratory of Strength of Materials (LabSCo) at the IUAV University of Venice. Three wallettes were built with solid clay bricks of traditional type (size 25 × 12 × 5.5 cm) and hydraulic lime mortar; one of these was tested unreinforced (N1), and the other two with the designed retrofit (R1 and R2, Figure 3). The wallettes were built on 20 mm thick steel plates, connected by a thin layer of mortar. Four bolts were welded at the corners of the plate, to fix four steel threaded bars holding another steel plate on the top of the wallette. Enclosed in this safety case, the slender wallettes could be moved to the testing site without damage. By welding the L-plates to the bottom steel plate, the frame connection to the ground was ensured (Figure 2C3).
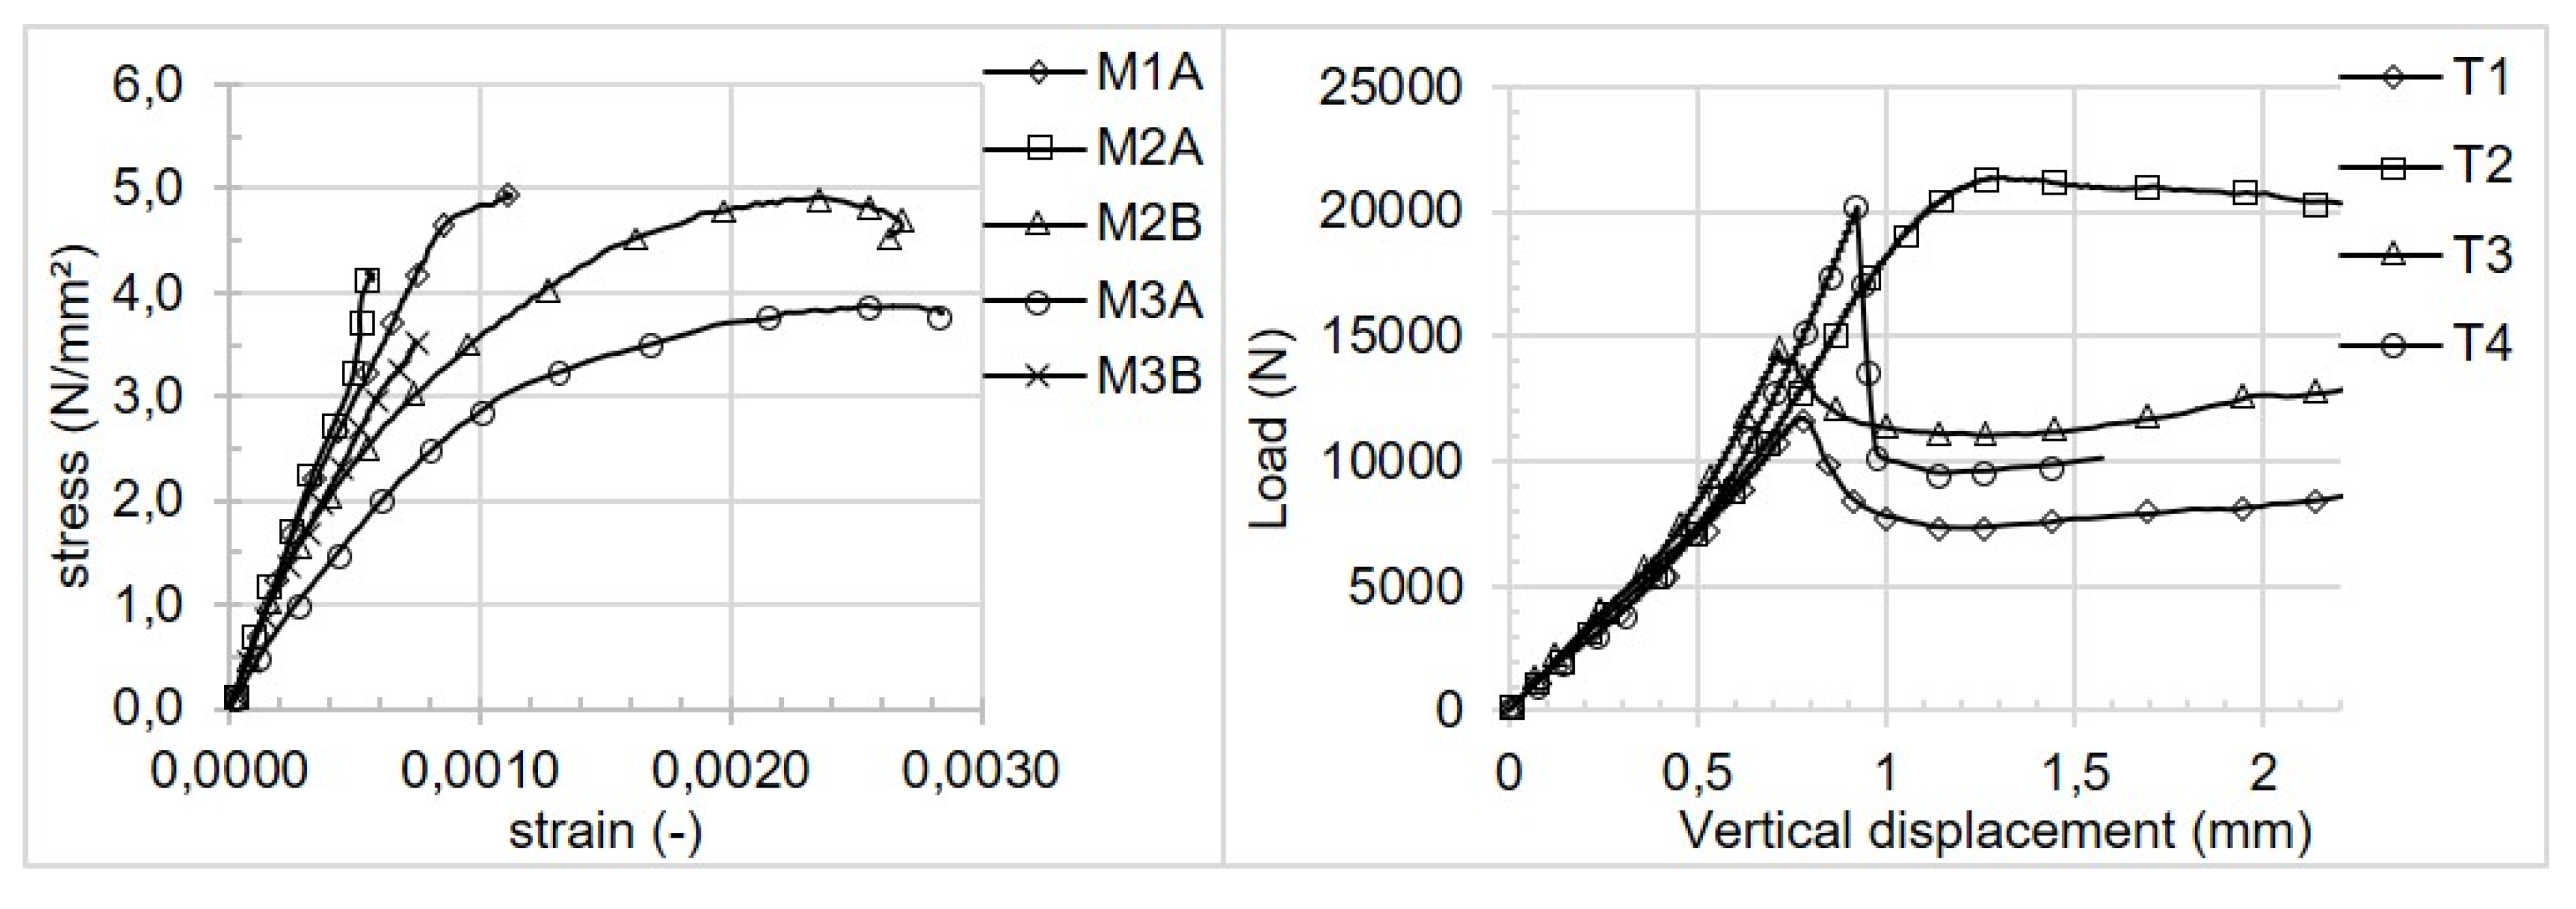
Preliminary testing of the brick and mortar’s compressive strength and stiffness as well as initial shear strength, according to EN protocols [29,30,31], gave out the data reported in Table 3, which were used for pre-evaluations of the physical model’s strength. Figure 4 shows the graphs of compressive tests on mortar and initial shear tests on brick–mortar triplets. More details of the destructive tests are reported in [26].
In Table 3, the masonry compressive strength fwc was evaluated according to Hendry’s theory [32]:
f w c = f b c 1 + a ( ν b b ν m ) k ( 1 + a b ν m a b ν b ) ,
where fbc is the compressive strength of the brick, a is the ratio between the thickness of bed joint and brick (tm/tb), b the ratio of the mortar’s elastic modulus to the brick’s elastic modulus (Em/Eb), and k is the ratio between the brick’s tensile and compressive strength (fbc/fbt assumed equal to 0.1). It turns out to be fwc = 14.96 N/mm² as reported in Table 2.
The elastic modulus of masonry Ew along the direction of axial compression is calculated with the expression reported by Brencich et al. [33]
1 E w = η b E b + η m E m ,
where ηb and ηm are the per cent fraction of total unit plus the joint thickness of each component. The collected data show a masonry of average to good quality in compression, while the shear behavior may be poorer because of the low tensile properties of the mortar.
Before the beginning of the tests, a prediction of the maximum shear load had been made. Considering the square shape of the panel, the following expressions for rocking failure load (Vr) and toe crushing (Vtc), proposed by Tassios [34], were applied:
V r = l 2 t 2 h ( σ 0 σ 0 f w c ) ,
V t c = f w c σ 0 6 h l 2 t ,
where l, t and h are the wallette’s dimensions as in Figure 2B, and σ0 is the vertical compressive stress due to gravity and superimposed load. The minimum of the calculated values, i.e., Vr = 9.056 kN, indicates a rocking failure.
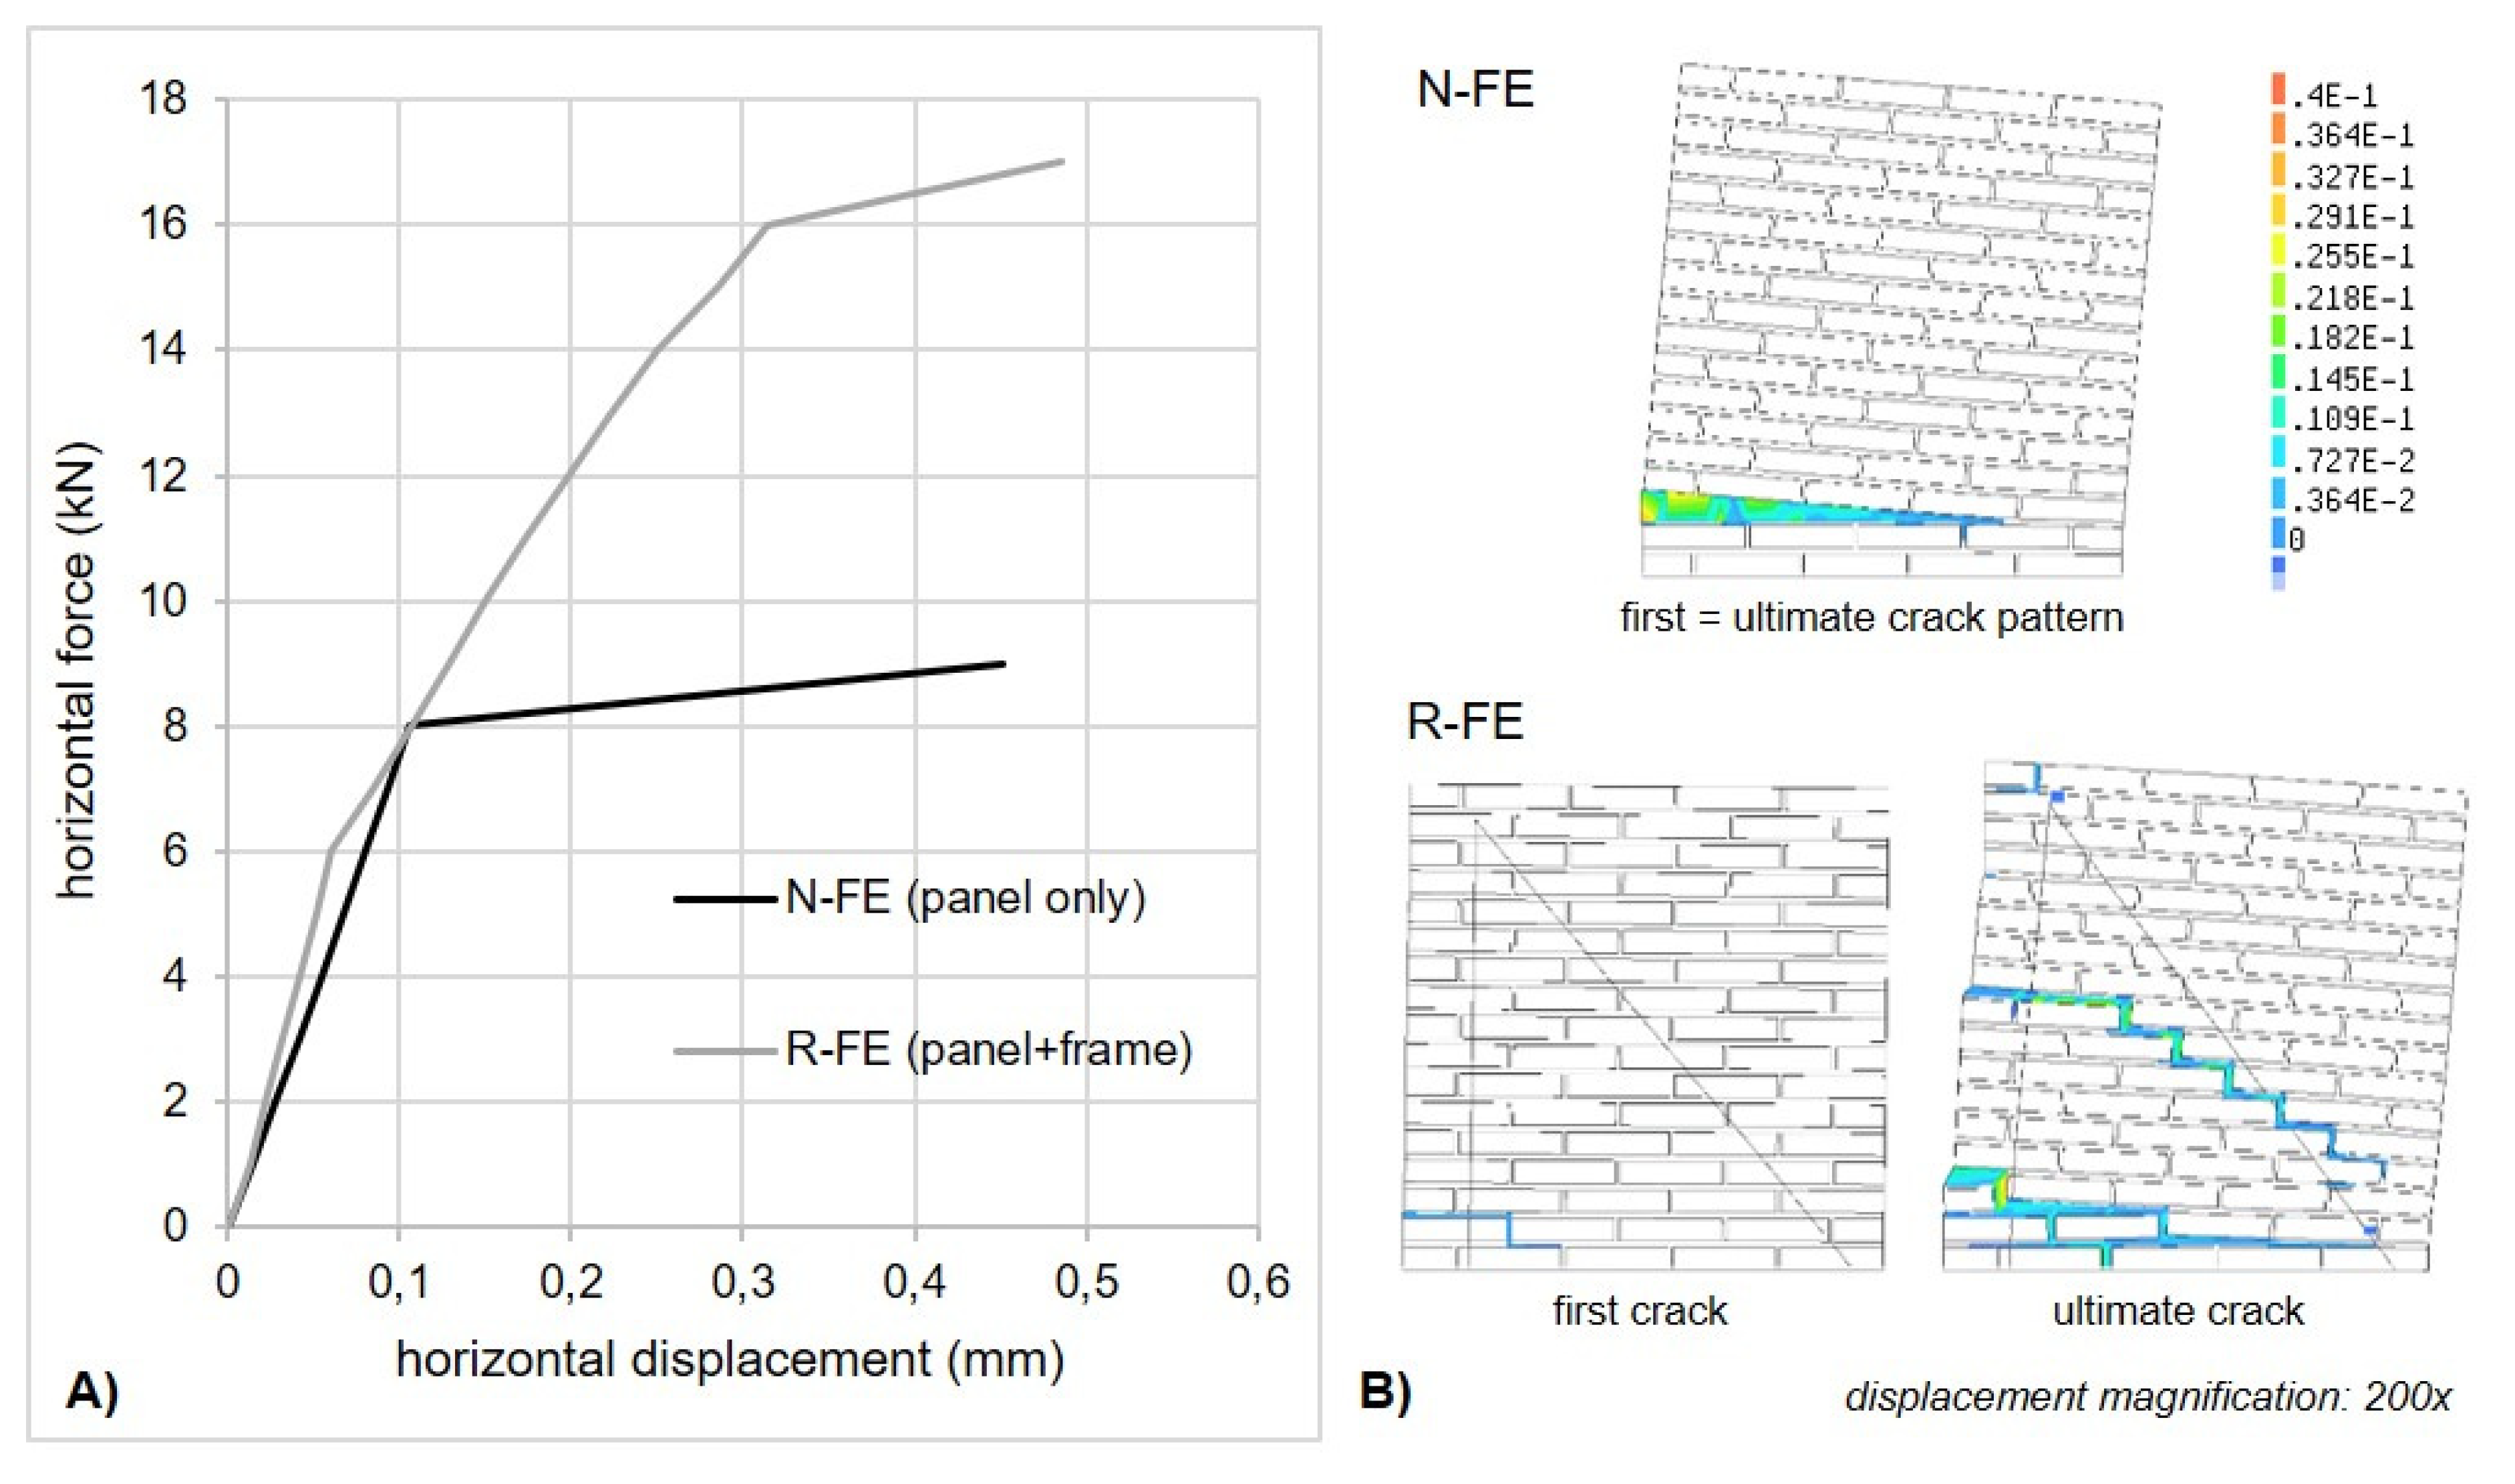
Furthermore, an FE model was set up to get a picture of the expected structural behavior of the physical model, and to evaluate the potential performance improvement attainable with the retrofit. The structural analysis was performed with DIANA FEA Finite Element code, version 9.6. According to the small size of the physical model, the bricks and joints are reproduced in detail, to account for the orthotropy of the masonry and to catch the details of the crack pattern. Quadrilateral eight-node shells simulated the masonry components, being suitable for nonlinear analysis; two-node beam elements simulated the FRP profiles and connection bars. At the bottom of the model, the baseline was constrained in vertical direction and the presence of the steel encasement was simulated by translational springs in horizontal direction (k = 10,000 N/mm). The increasing horizontal force acted under a constant vertical pressure of 0.1 N/mm² along the upper edge. For the retrofit frame, the GFRP material was given the longitudinal compressive elastic modulus Ez,c and Poisson’s coefficient νxz listed in Table 2; the bars were given the usual properties for steel E = 210,000 N/mm² and ν = 0.2. As for the material properties, a very simple approach was chosen in the preliminary phase of the research, relying on isotropic total strain-fixed cracking models for the bricks and mortar. The material properties listed in Table 3 were implemented in uniaxial stress–strain graph inputs, considering brittle cracking in tension and plastic behavior in compression; the tensile strengths were assumed to be 1/10 of the compressive strength. The FE analysis results are reported in Figure 5. The failure mode of the masonry panel confirms the rocking mechanism via the cracking of the horizontal joint; rocking is incipient also in the retrofitted panel, but it is immediately followed by horizontal joint cracking initiation at mid-height, which propagates diagonally towards the bottom (Figure 5B). The shear strength of the masonry panel is 9 kN, which is quite close to the predicted value Vr; the retrofit increases the strength up to 17 kN (+89%). Finally, drifts appear very little in both cases (Figure 5A). In fact, as the next section outlines, the experimental results demonstrated that the preliminary FE model overrated the experimental shear stiffness. It was thus necessary to update the model by explicitly modelling the shear behavior on the grounds of the preliminary tests (Figure 4B), as is shown at the end of Section 3.
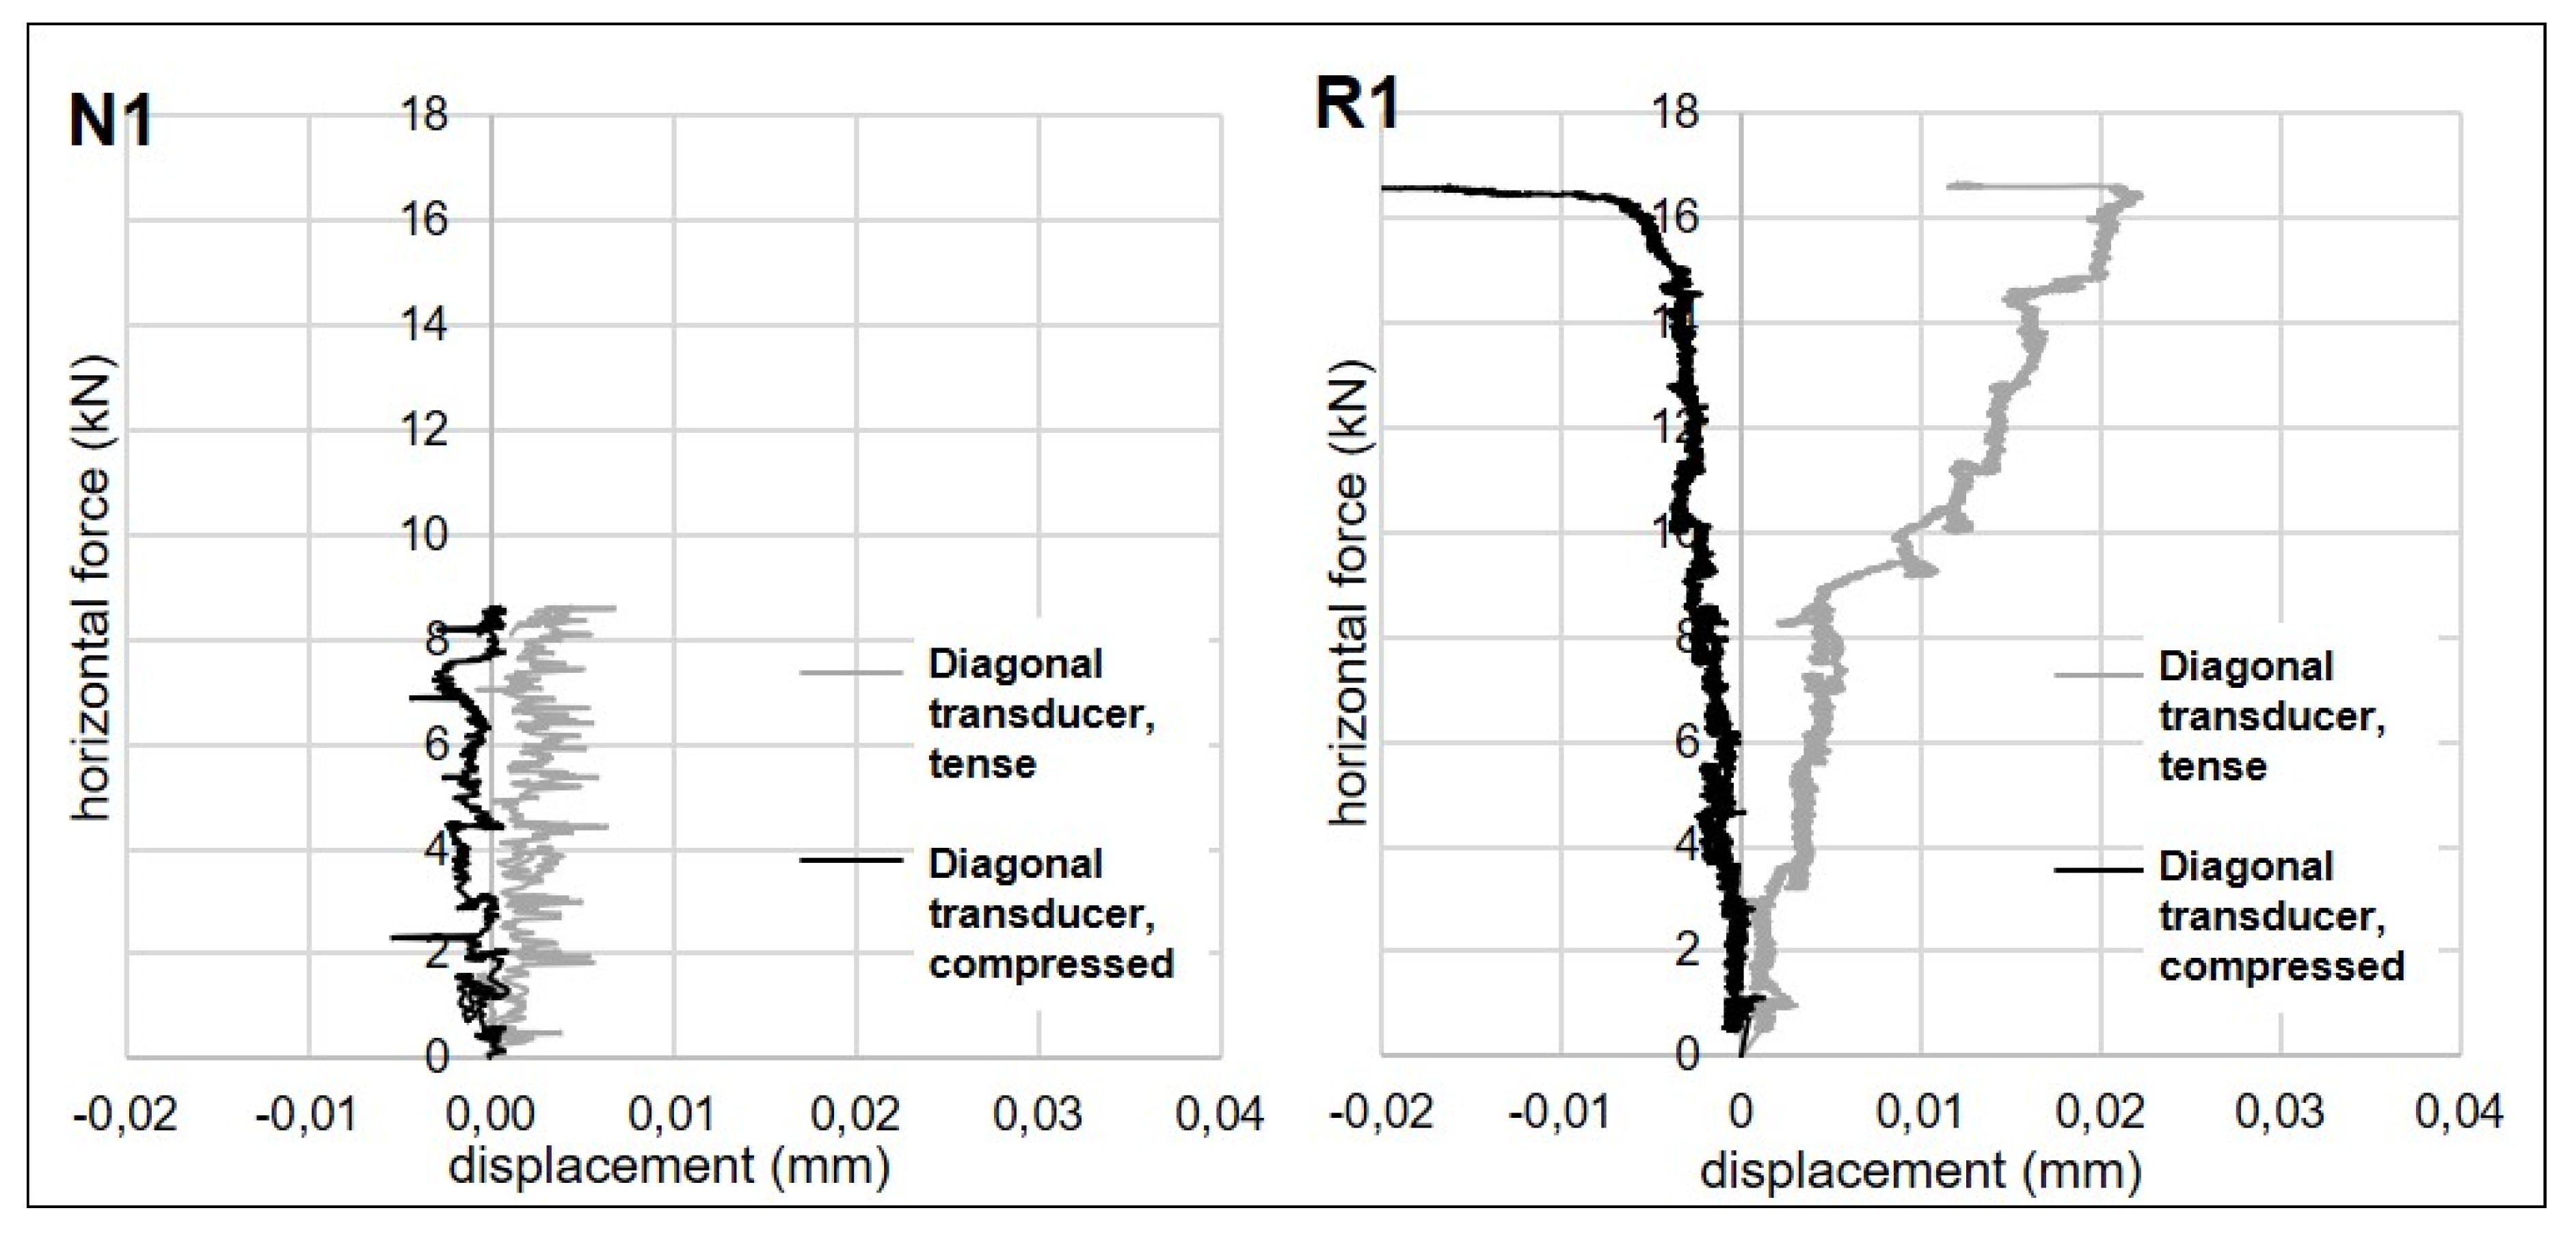
The testing setup, which employed the available system for static and dynamic structural testing at the IUAV Laboratory of Strength of Materials (LabSCo), is shown in Figure 3. The sample wallette’s bottom is blocked in a steel encasement; steel slabs, with an interposed layer of stiff rubber, are placed on the top to obtain the desired compressive stress of 0.1 N/mm². An actuator applies the static horizontal force, at a velocity of 1 kN/min for all the tests. During the tests, wire transducers measured the horizontal drift and the possible movements along the wallette’s diagonals (N1 and R1 samples), while electric strain gauges measured the axial strain (R1 and R2 samples).

3. Results

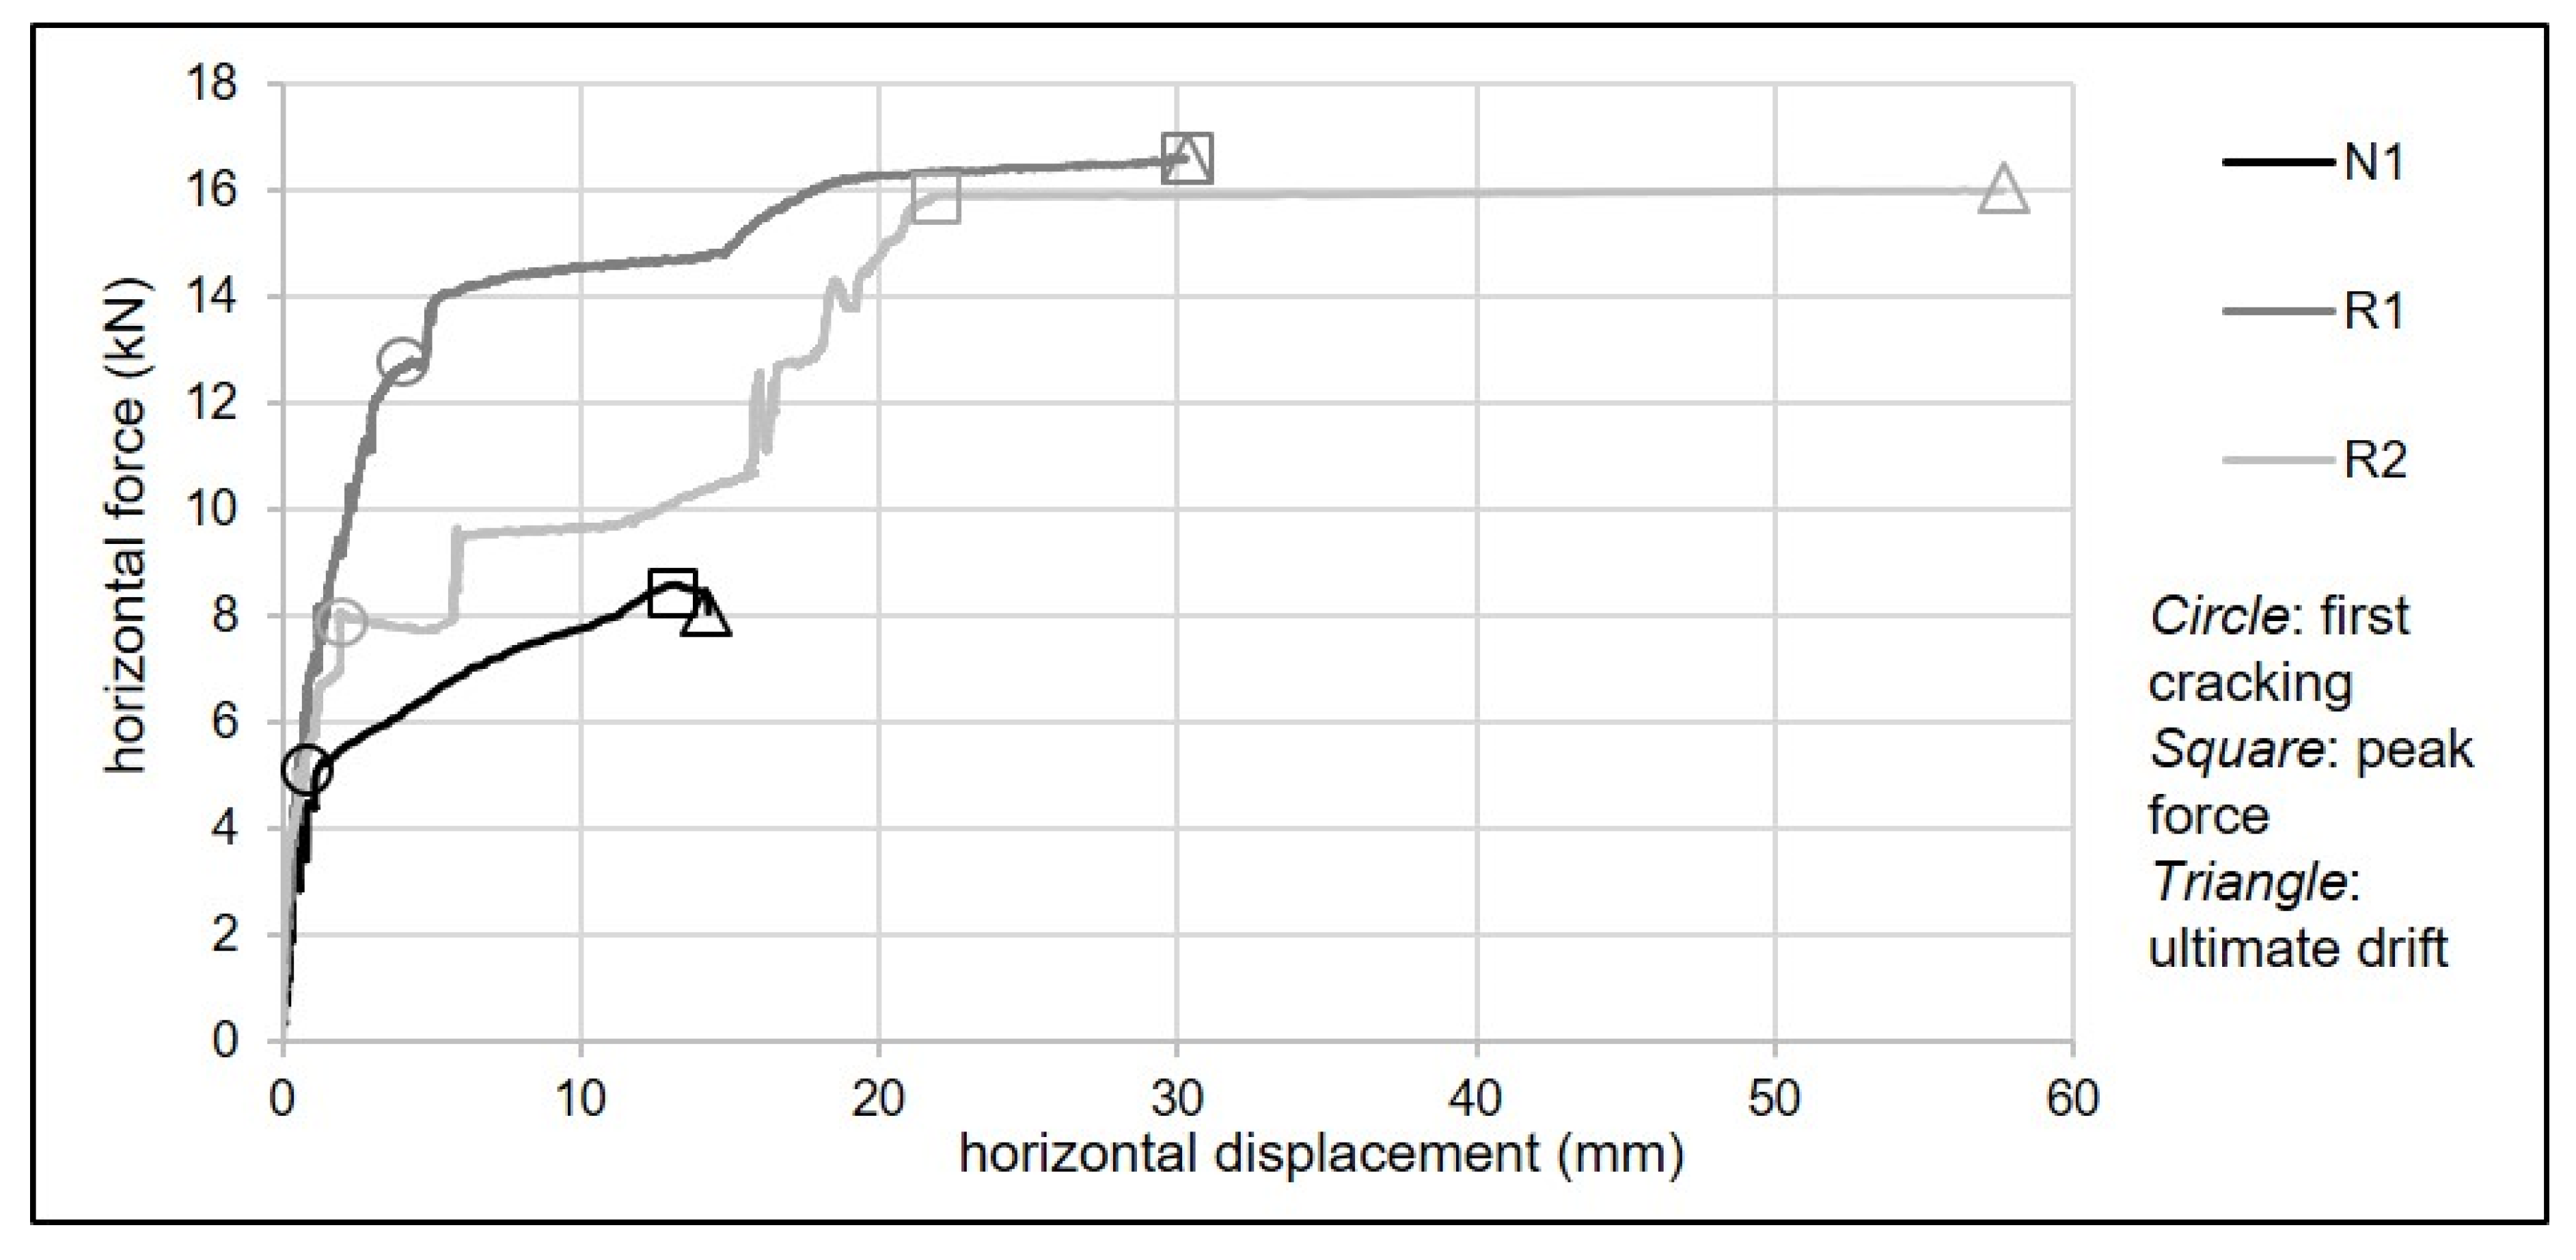
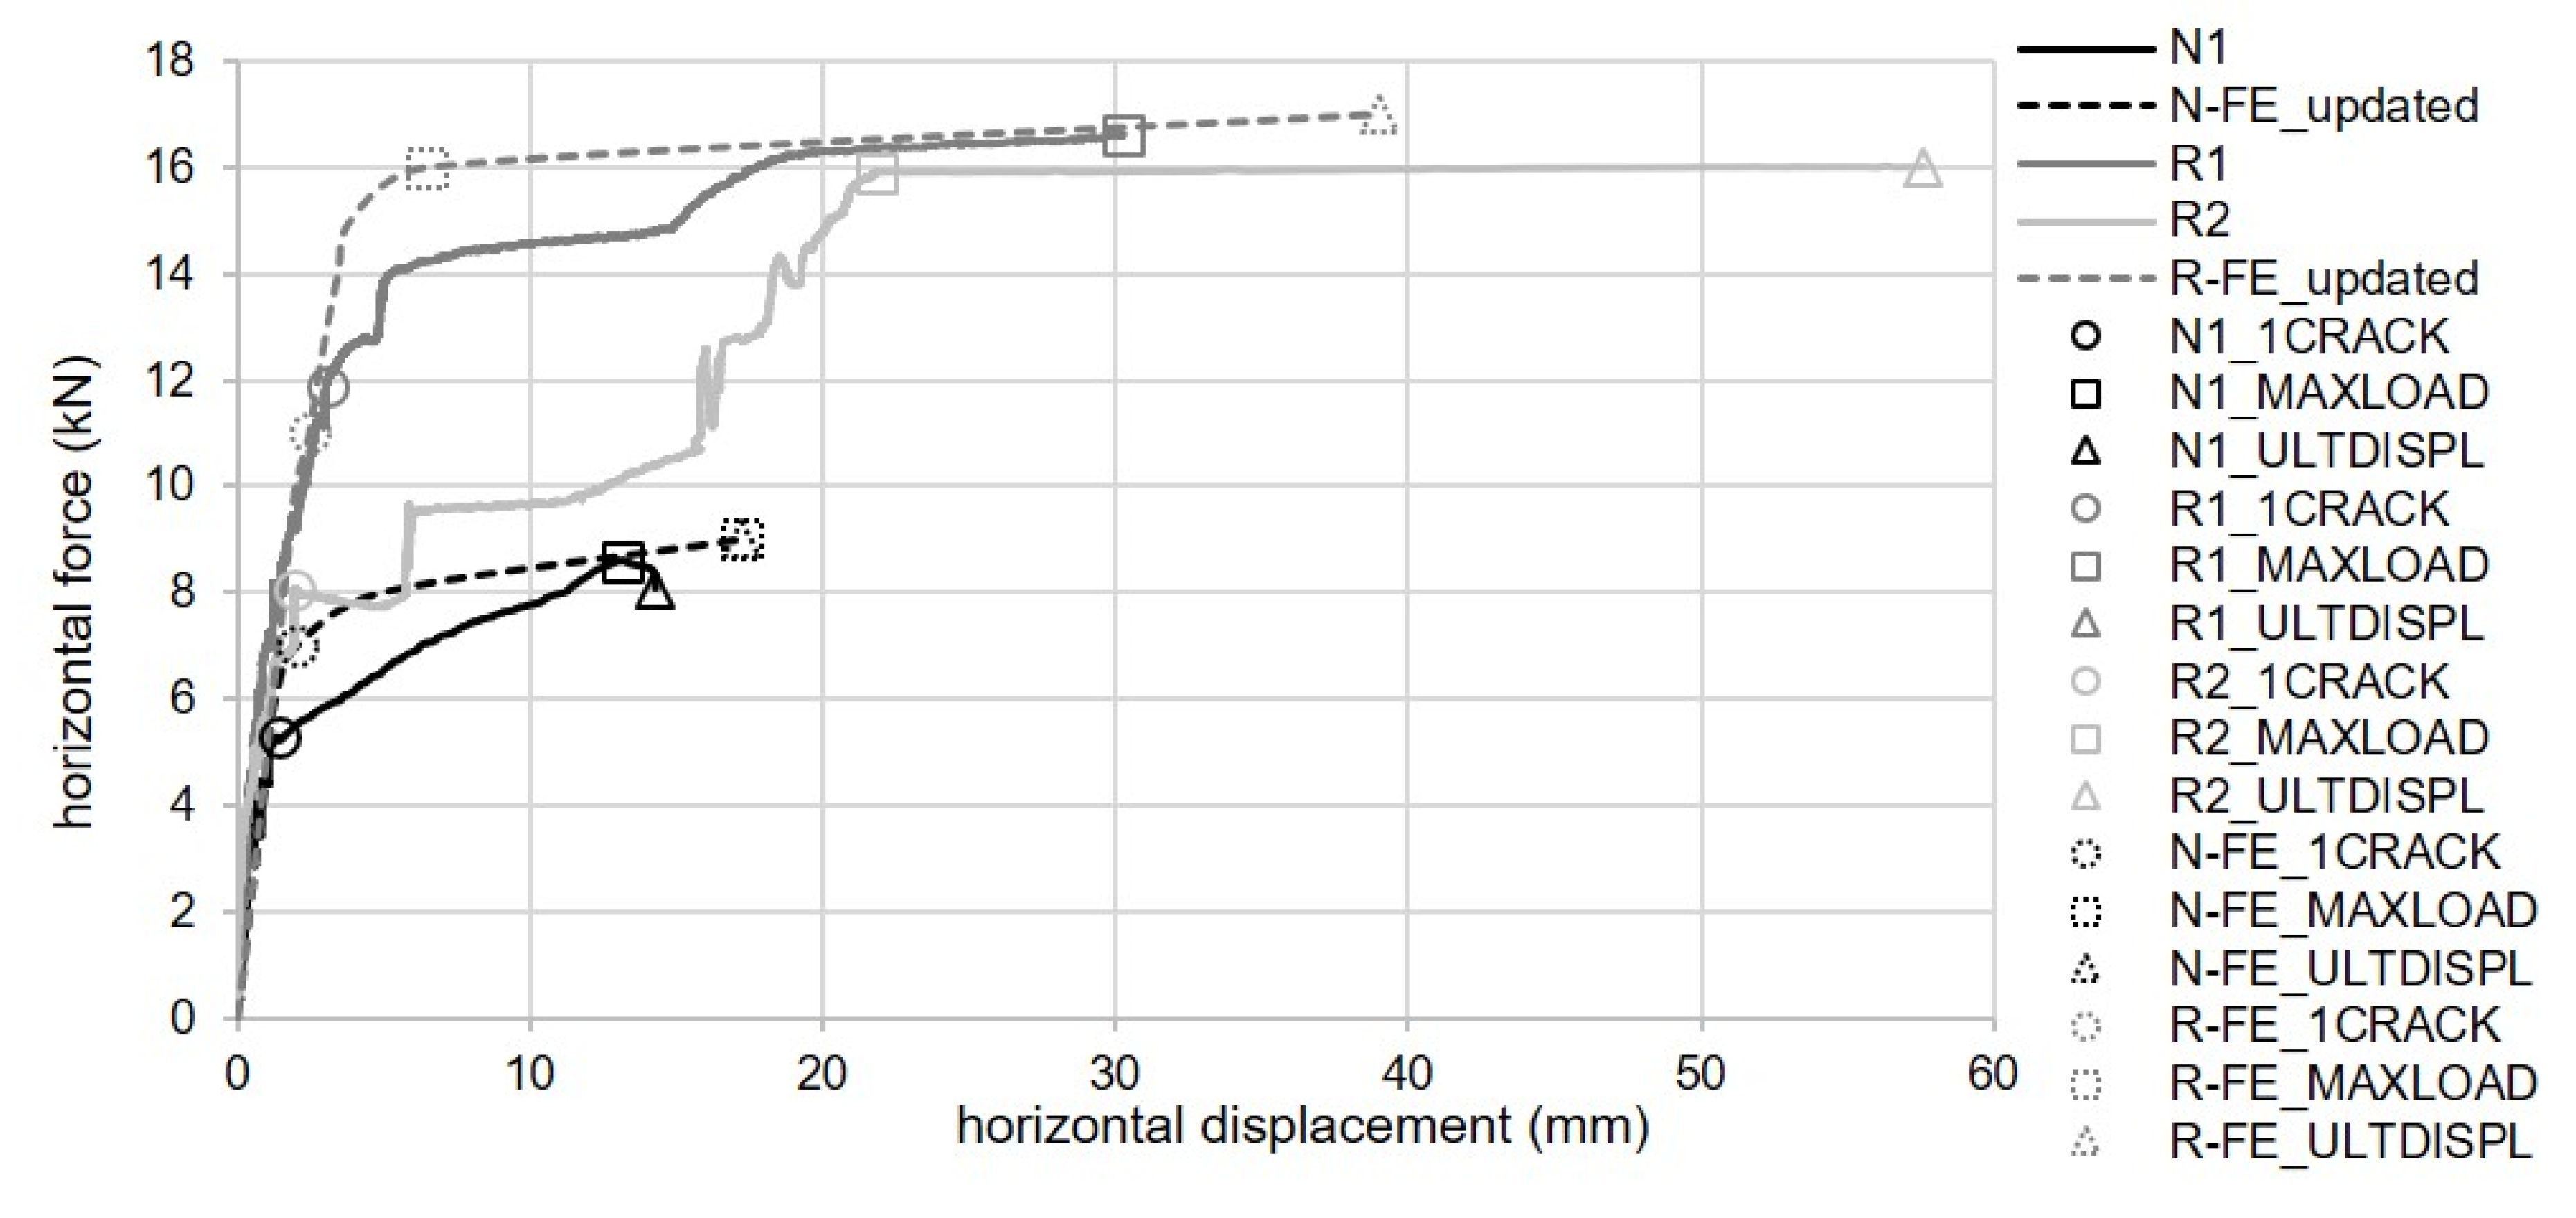
The force–drift graphs of the three tests N1 (unretrofitted), R1 and R2 (retrofitted) are plotted in Figure 6. The force and displacement values at the end of the first crack, peak and test are detailed in Table 4.
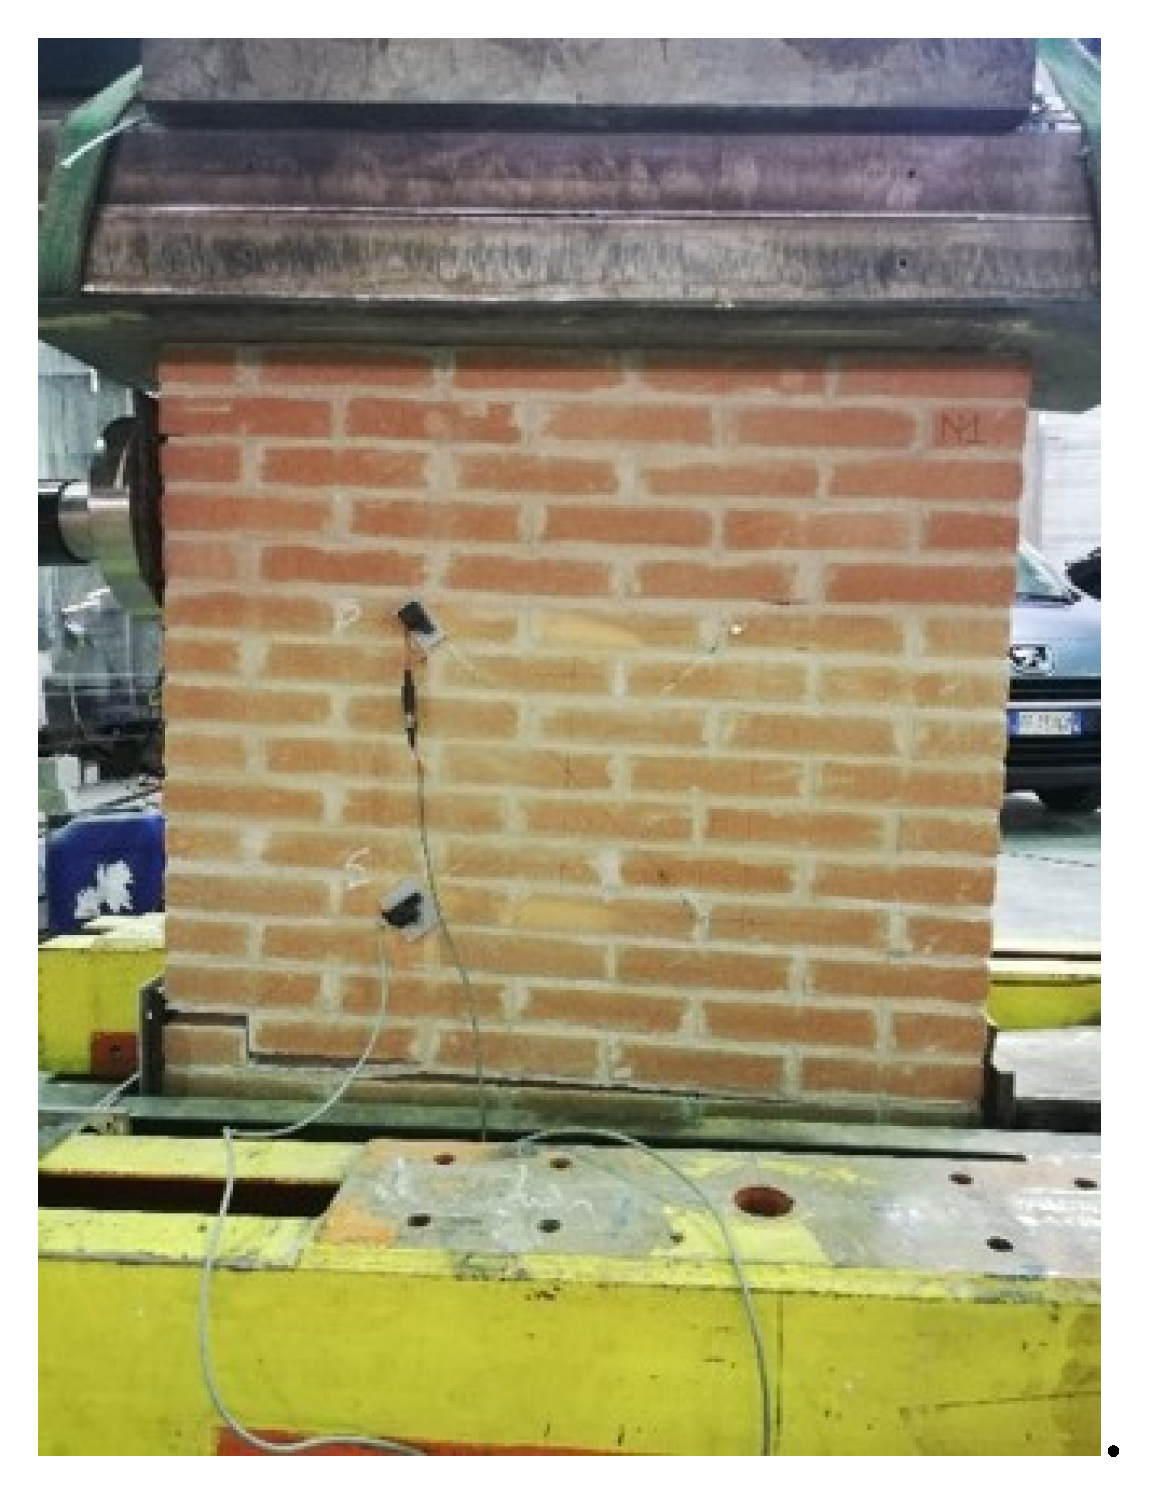
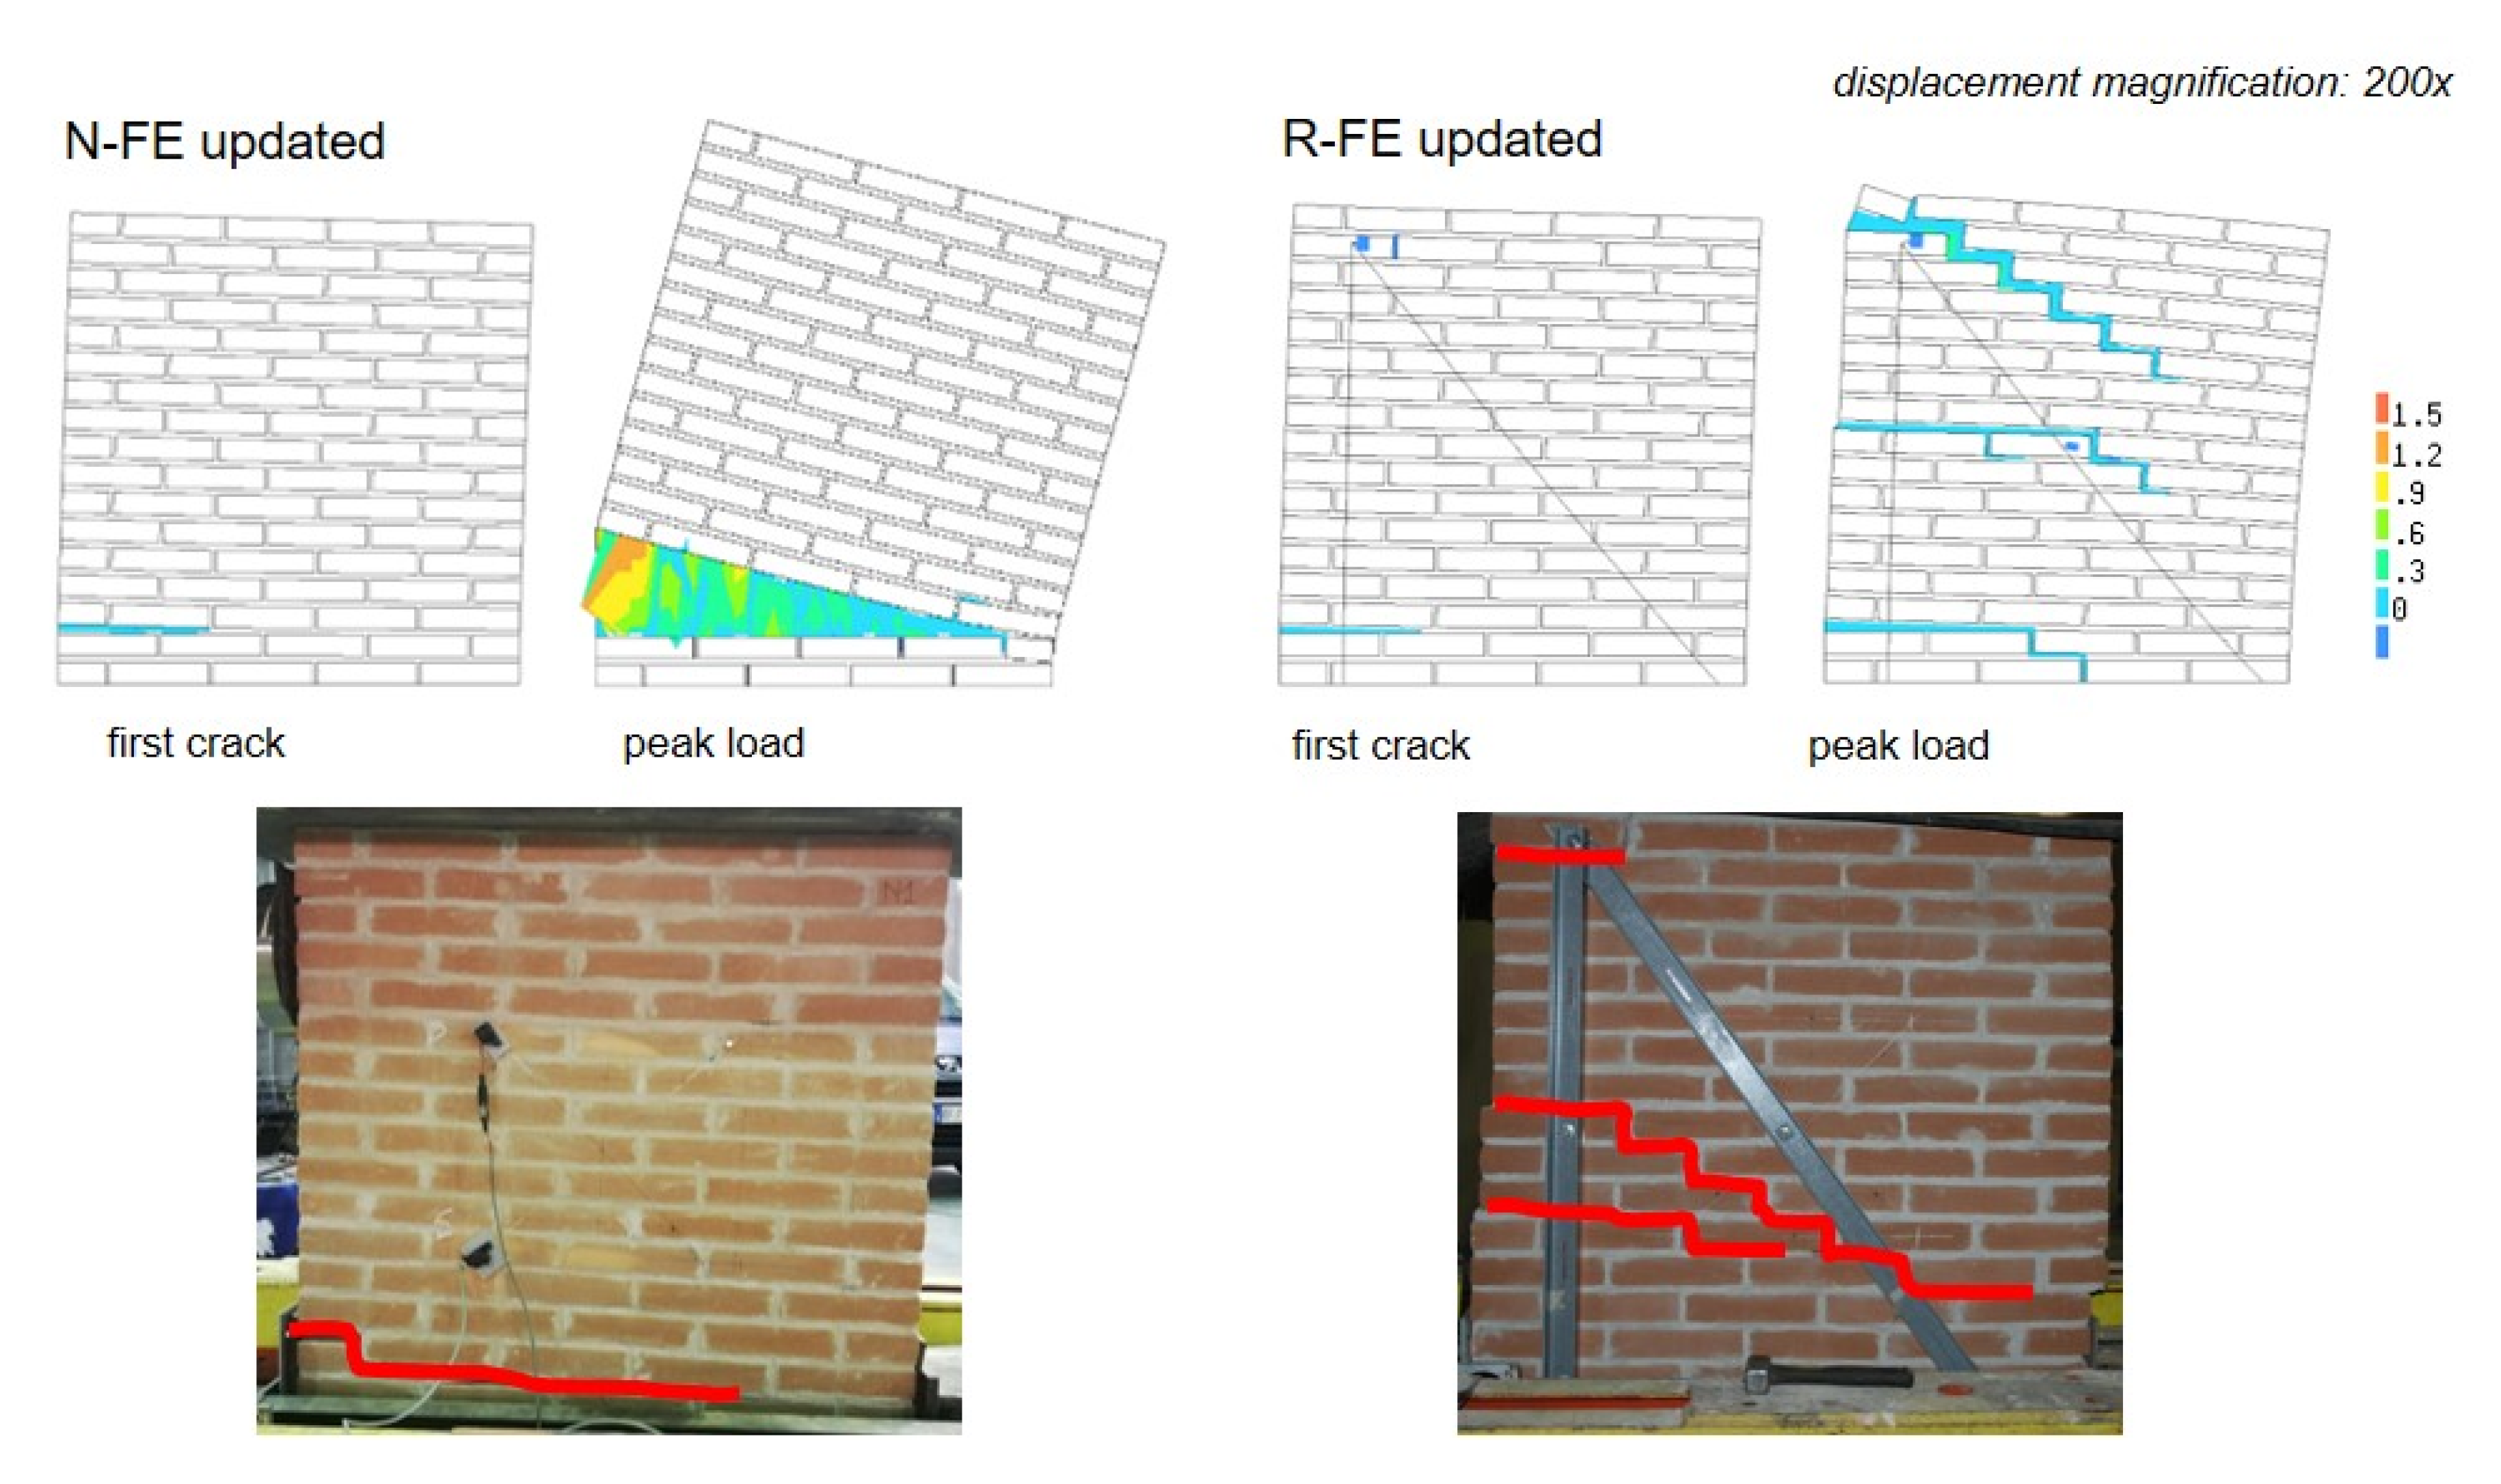
In Table 4, the predictions of the FE models are reported under the respective cases of the masonry and the masonry–frame system. It can be seen that Test N1 gave a pretty good confirmation of the analytical and FE predictions, as far as they concerned the maximum load. Because of the constraints of the physical model, the corner uplifting at the second bed joint from the bottom, at 8.59 kN, defined the shear strength Vr (Figure 7). The wallette, being very slender, collapsed shortly after.
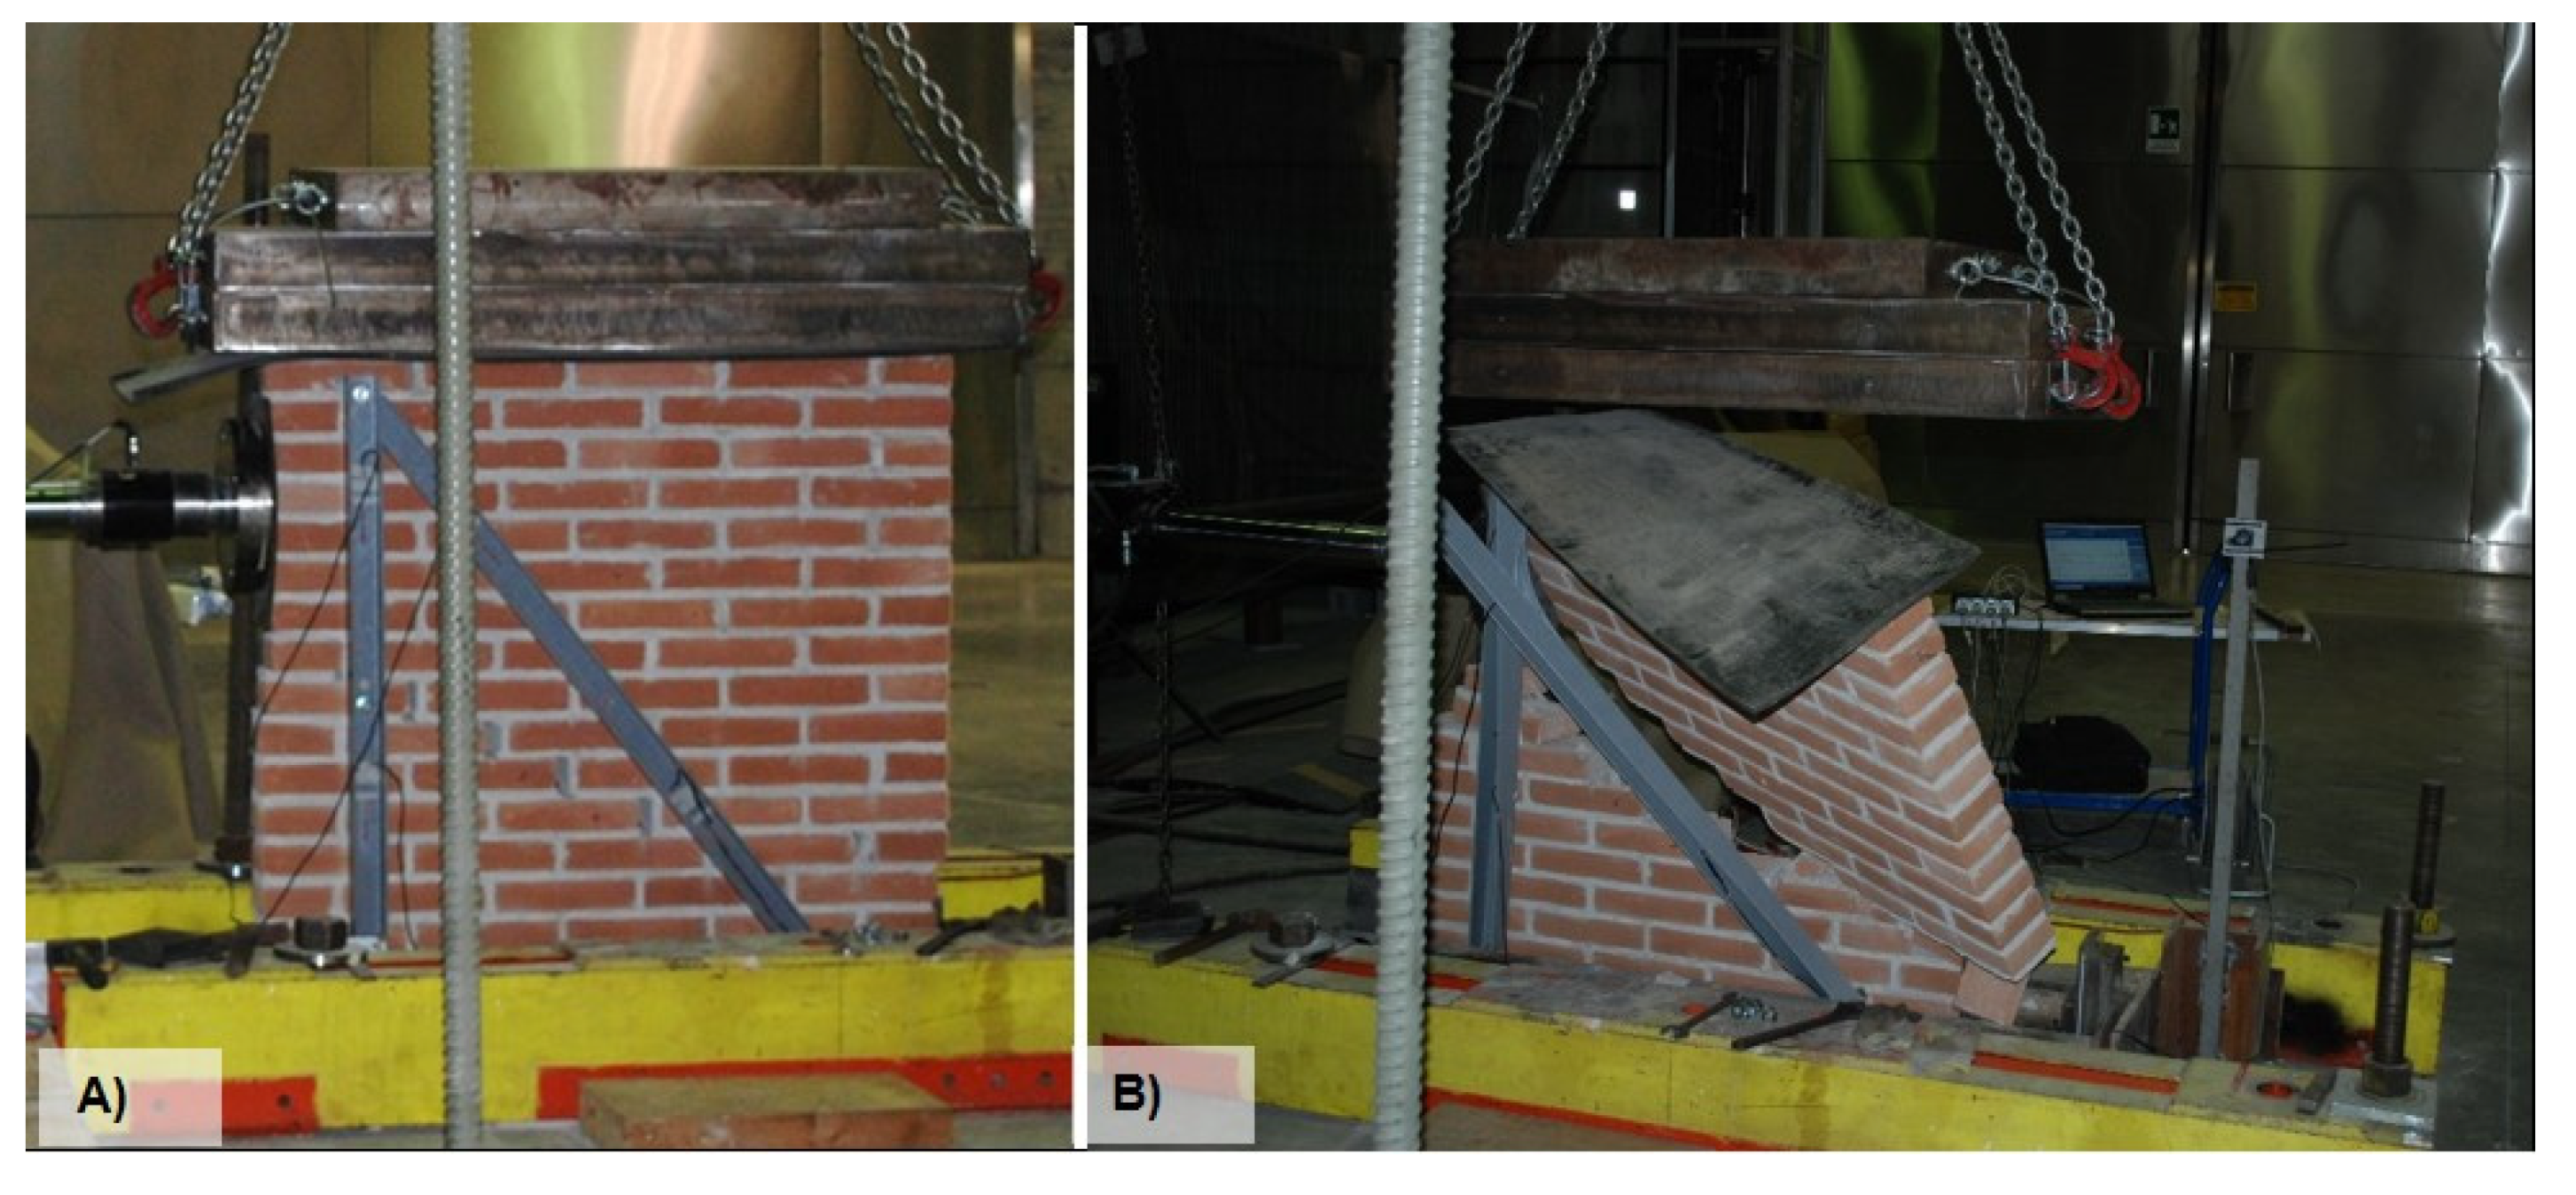
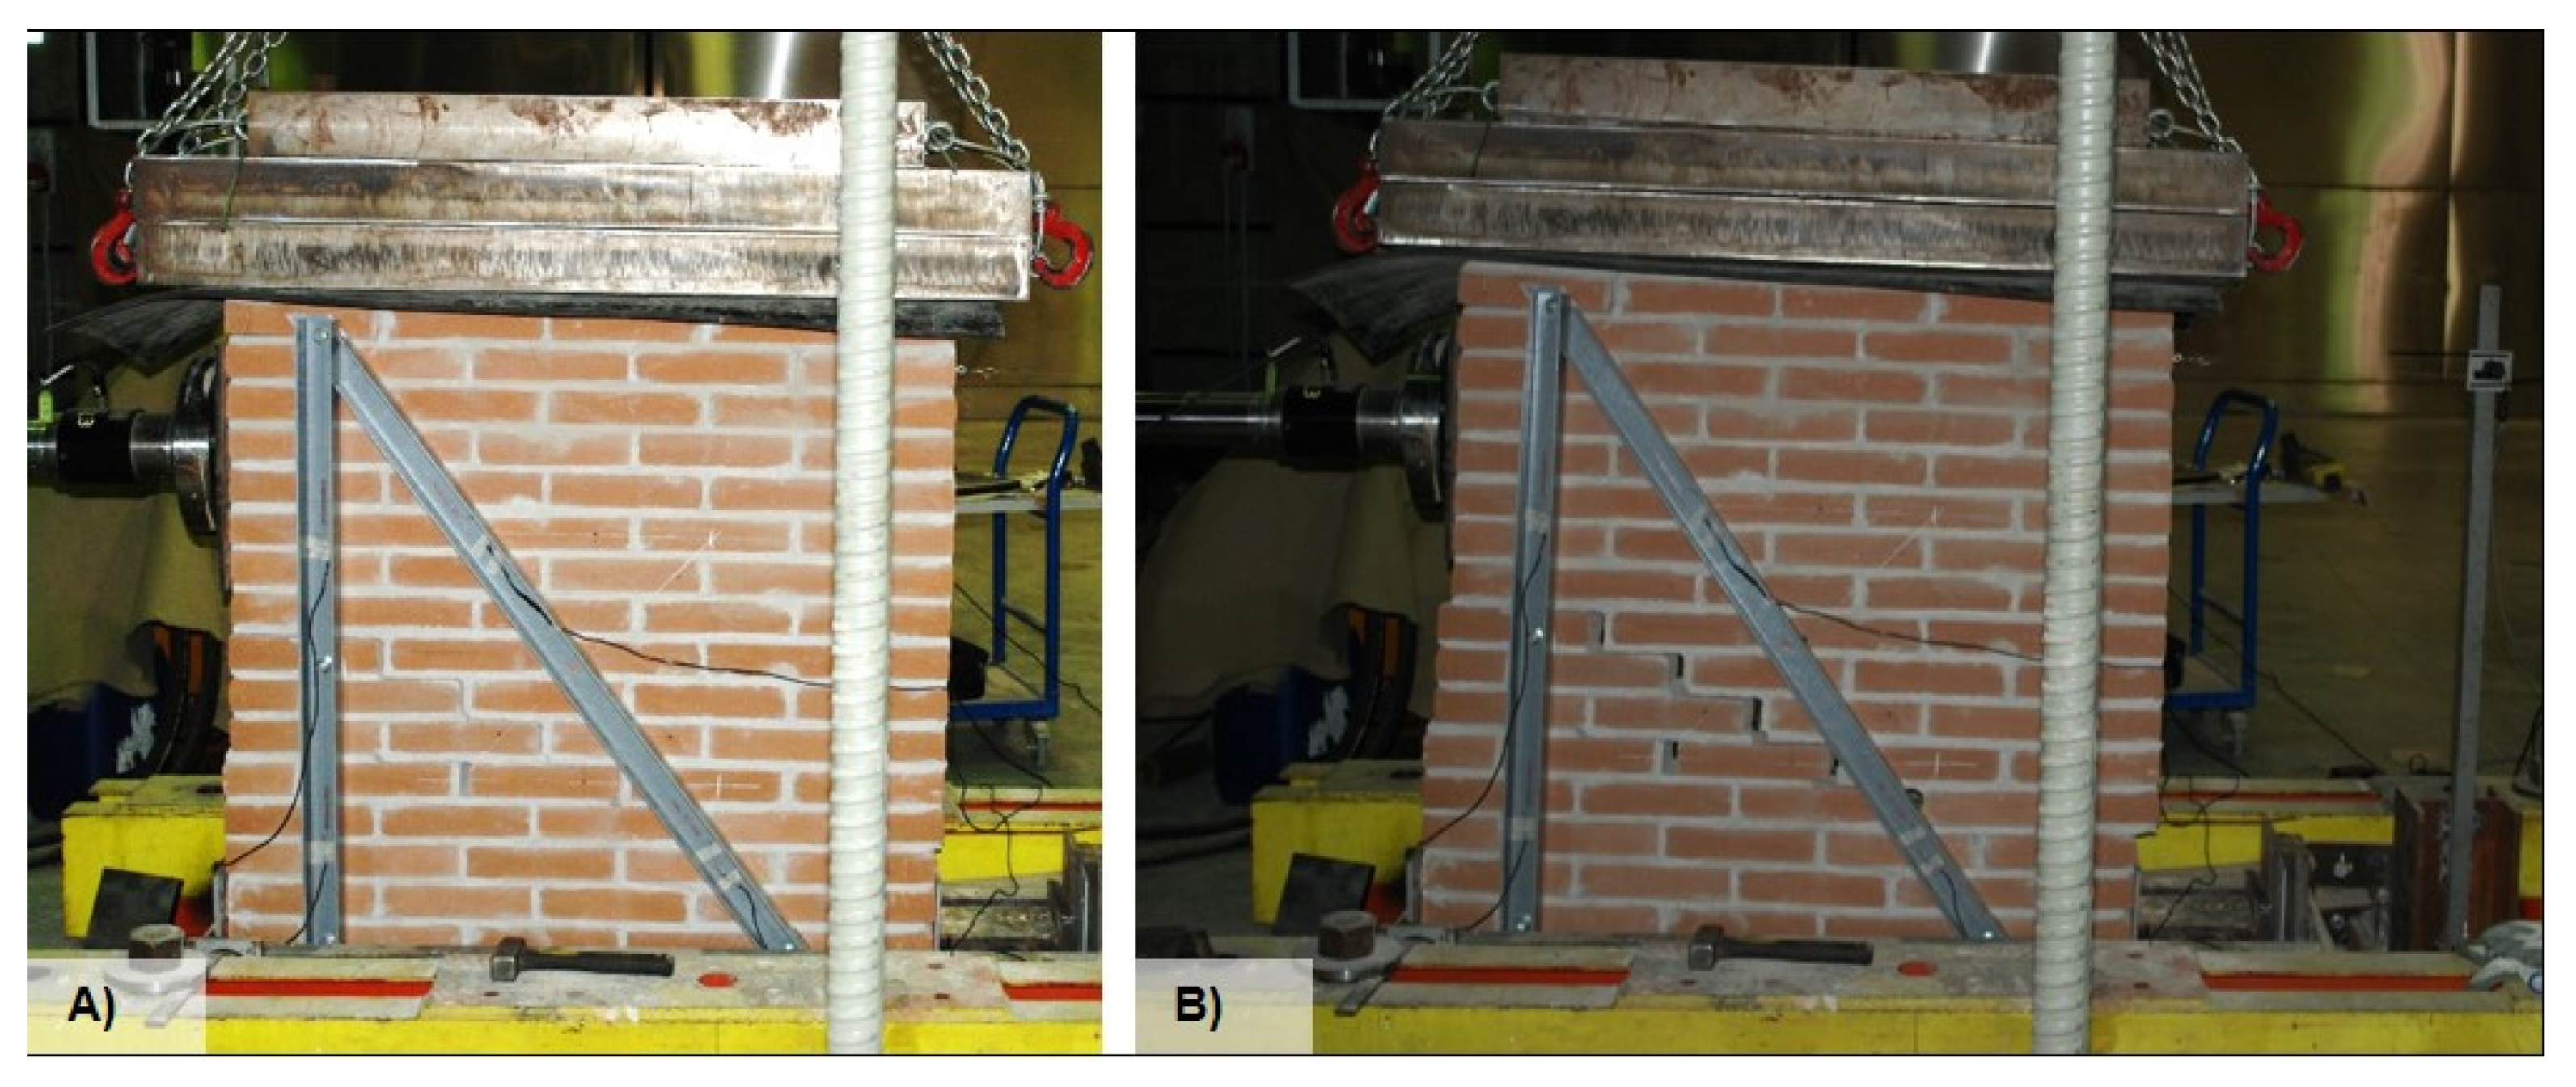
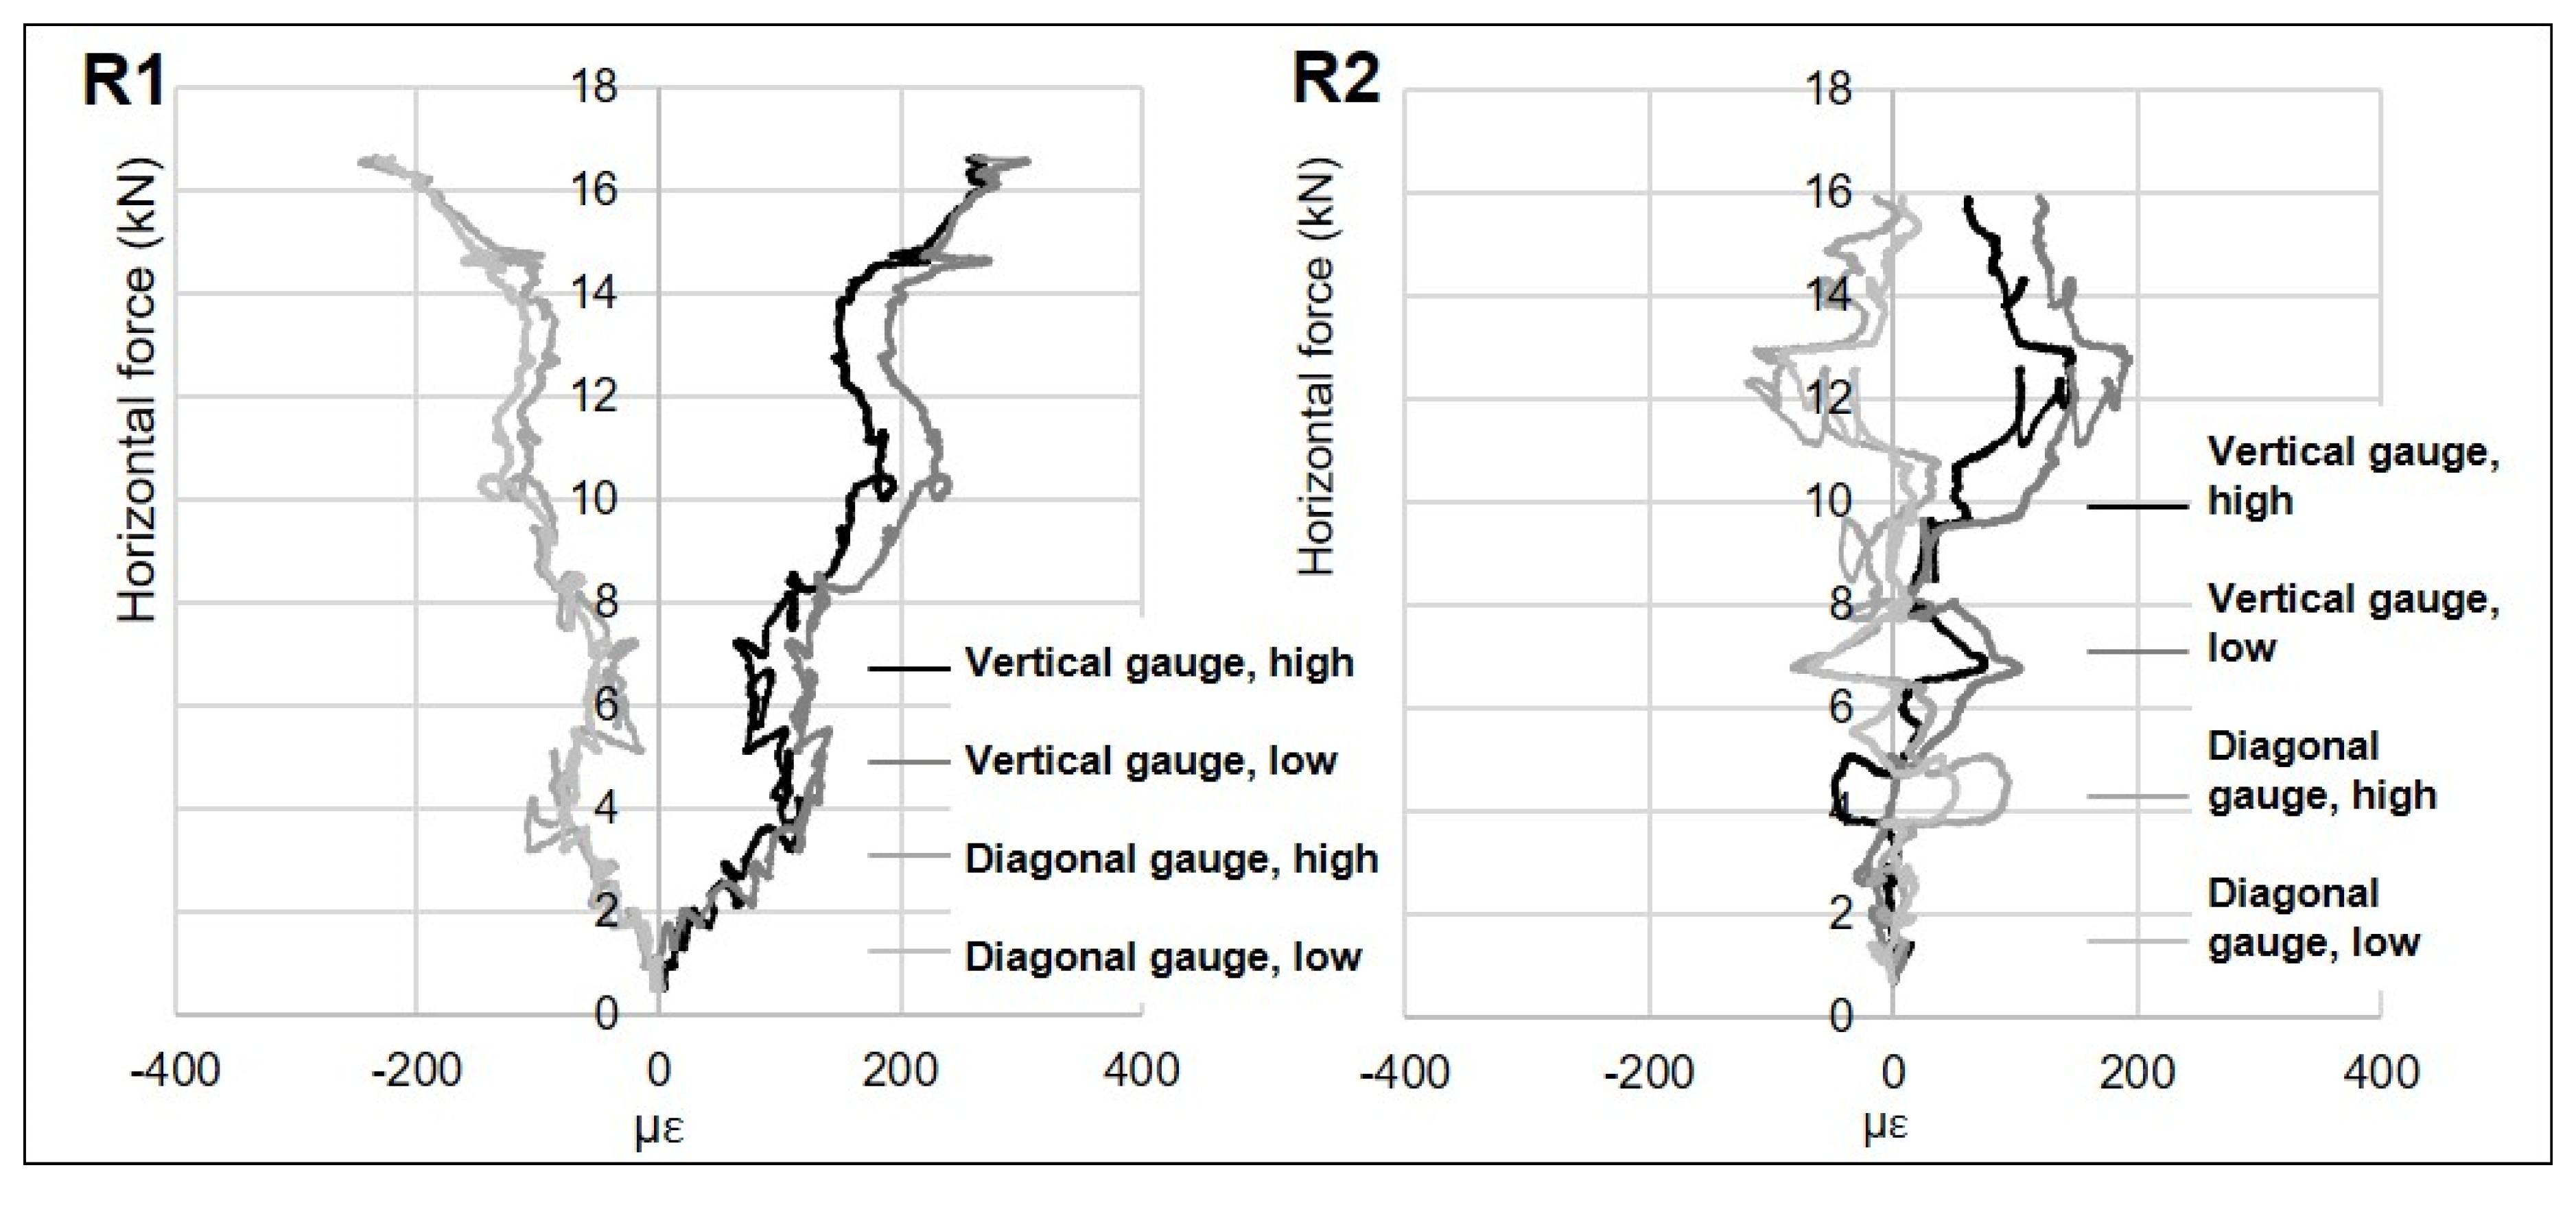
Tests R1 and R2 were performed on equal physical models of the retrofitted wallette. The longitudinal strain of the FRP profiles was monitored with PL-60-11 strain gauges. Tests R1 and R2 gave very similar results in term of failure mode and Pmax (respectively, 16.62 and 15.9 kN); with respect to test N1, the retrofitted wallettes revealed a remarkably different behavior and dramatic increase in the ultimate horizontal load. In detail, for both R1 and R2, the cracking initiation was at the half-height of the wallette; the sawtooth crack propagated towards the bottom along an inclined direction and stopped at one third of the wallette’s width. Although this does not fully match any of the usual modes, it is clear that the retrofitted wallettes do not encounter a rocking mechanism. As for the initial stiffness, the retrofitted condition shows a small but appreciable increase with respect to the unretrofitted wallette. On the other hand, the load–drift paths of R1 and R2 show some differences between each other. In fact, R1 collapsed under testing (Figure 8), while R2 reached a dramatically higher ultimate displacement and finally survived the test (Figure 9). The lesser drift performance of R1 is likely due to the geometric imperfections of the wallette, which was found to be visibly out of plumb after seasoning. As with the unretrofitted case, the experimental results are in a rather good agreement with the predictions of the FE analysis as far as they concern the maximum shear force of both the masonry and the masonry–frame system; in particular, the strength increase due to the retrofit (calculated on the basis of the average of Pmax of R1 and R2) is +89%, which equals the FE prediction. On the other hand, the FE models could not catch the experimental shear stiffness and displacements magnitude. This is due to the model input, consisting of tensile and compressive behavior parameters, which did not allow accounting for the shear stress-drift relation explicitly.
The recordings of transducers along the wallette’s diagonals revealed the effectiveness of the FRP frame retrofit in retaining the displacements along the tense diagonal (Figure 10). By taking, as a reference, the first crack load level of the unretrofitted sample (i.e., 8.0 kN), the number of displacements of sample R1 is about twice as high (while the first crack in the masonry is yet to occur). On the other hand, the displacement evolution along the compressed diagonal of the R1 panel shows only a slight difference from the unretrofitted configuration. The path of the masonry diagonal displacements of R1 shows correspondence with those of the FRP profiles’ strain, plotted following the strain gauge recordings (Figure 10 right and Figure 11 left). The average axial strain undergone by the profiles is around −200 με in compression and +275 με in tension, showing a discrete balance of stress levels between the two profiles, with the prevalence of the vertical element subjected to tension. Finally, the couple of gauges on each profile show remarkably similar paths, revealing a uniform state of stress along the profiles’ longitudinal axes (Figure 11). Graph R2 in Figure 9 appears similar to R1, but more disturbed, likely by contact between the frame and the masonry. After the R1 test, none of the steel threaded bars showed any plastic strain, nor did the holes in the masonry show any sign of disruption. Indeed, the wall–frame connections did not represent the weakest rings of the chain, indicating that the connection’s design was largely on the safe side.
The FE model used for the prediction of the physical model’s behavior was updated after the testing results. In particular, the preliminary analyses could not attain the magnitude of experimental displacement, due to the need to implement the shear behavior of masonry explicitly in the model. To do this, the experimental results of the initial shear strength tests, i.e., both the shear strength τ0.1 of the joint under a pressure of 0.1 N/mm² and the corresponding displacement dpeak (Figure 4B and the last two rows of Table 3), were used to calculate the shear elastic modulus of the mortar joint.
In detail, the distortion γ was computed as follows, with tb and tm being the thickness of the brick and mortar joints, respectively.
γ = d p e a k t b + t m
Then, the joint’s shear stiffness Gj was calculated as τ0.1/γ. Finally, a fictitious Young’s modulus Ej = 2Gj … (1 + νm) was calculated and implemented in the FE model. The results of the updated models are shown in Figure 12 and Figure 13. As before the update, the crack pattern of the retrofitted model shows some difference with respect to the case study; in fact, the crack initiation stays in the lowest part of the wall as in the absence of retrofitting, and minor cracking appears at the anchors. However, after updating, the model approximates the experimental behavior in a much better way. Table 5 presents a comparison of the results of the FE analyses (before and after updating) to the experimental results, by showing the respective per cent differences. The value of the elastic stiffness is given by the values of load and displacement at the first crack.

4. Discussion

The experimental information presented in Figure 10 and Figure 11 is here discussed, to understand the stress sharing of the masonry–frame system, so as to highlight the main concerns regarding the design procedure of such retrofit solutions. To this purpose, the test on R1 in the retrofitted system (which got the clearest graphs of the two tests) is compared to the test on its unretrofitted behavior. Figure 14 reports in blue the values of tense diagonal displacement (Figure 10) and, in magenta, the drift (Figure 6) normalized to the respective maximum values of unretrofitted masonry (N1). The plot of displacements of N1 along the compressive diagonal was too disturbed (Figure 10) to provide clear values and thus the plot of the compressed diagonal was not selected for this comparison. The histogram clarifies the gain of overall stiffness and displacement capacity that this kind of retrofit could bring on. The solid blue columns show that R1 allows for higher displacements along the tense diagonal of the wallette without cracking; in fact, R1 shows a +71% higher displacement at 5.28 kN (i.e., the load of first crack for N1), and a +27% higher displacement at 8.59 kN (peak of N1) without cracking in the masonry. After cracking, at 11 kN, the diagonal displacement increases by up to 4.8 times the reference value. The magenta columns allow us to appreciate the great difference in drift up to 8.59 kN (−88% for the retrofitted wallette), and beyond, up to the abrupt failure at 16.69 kN.
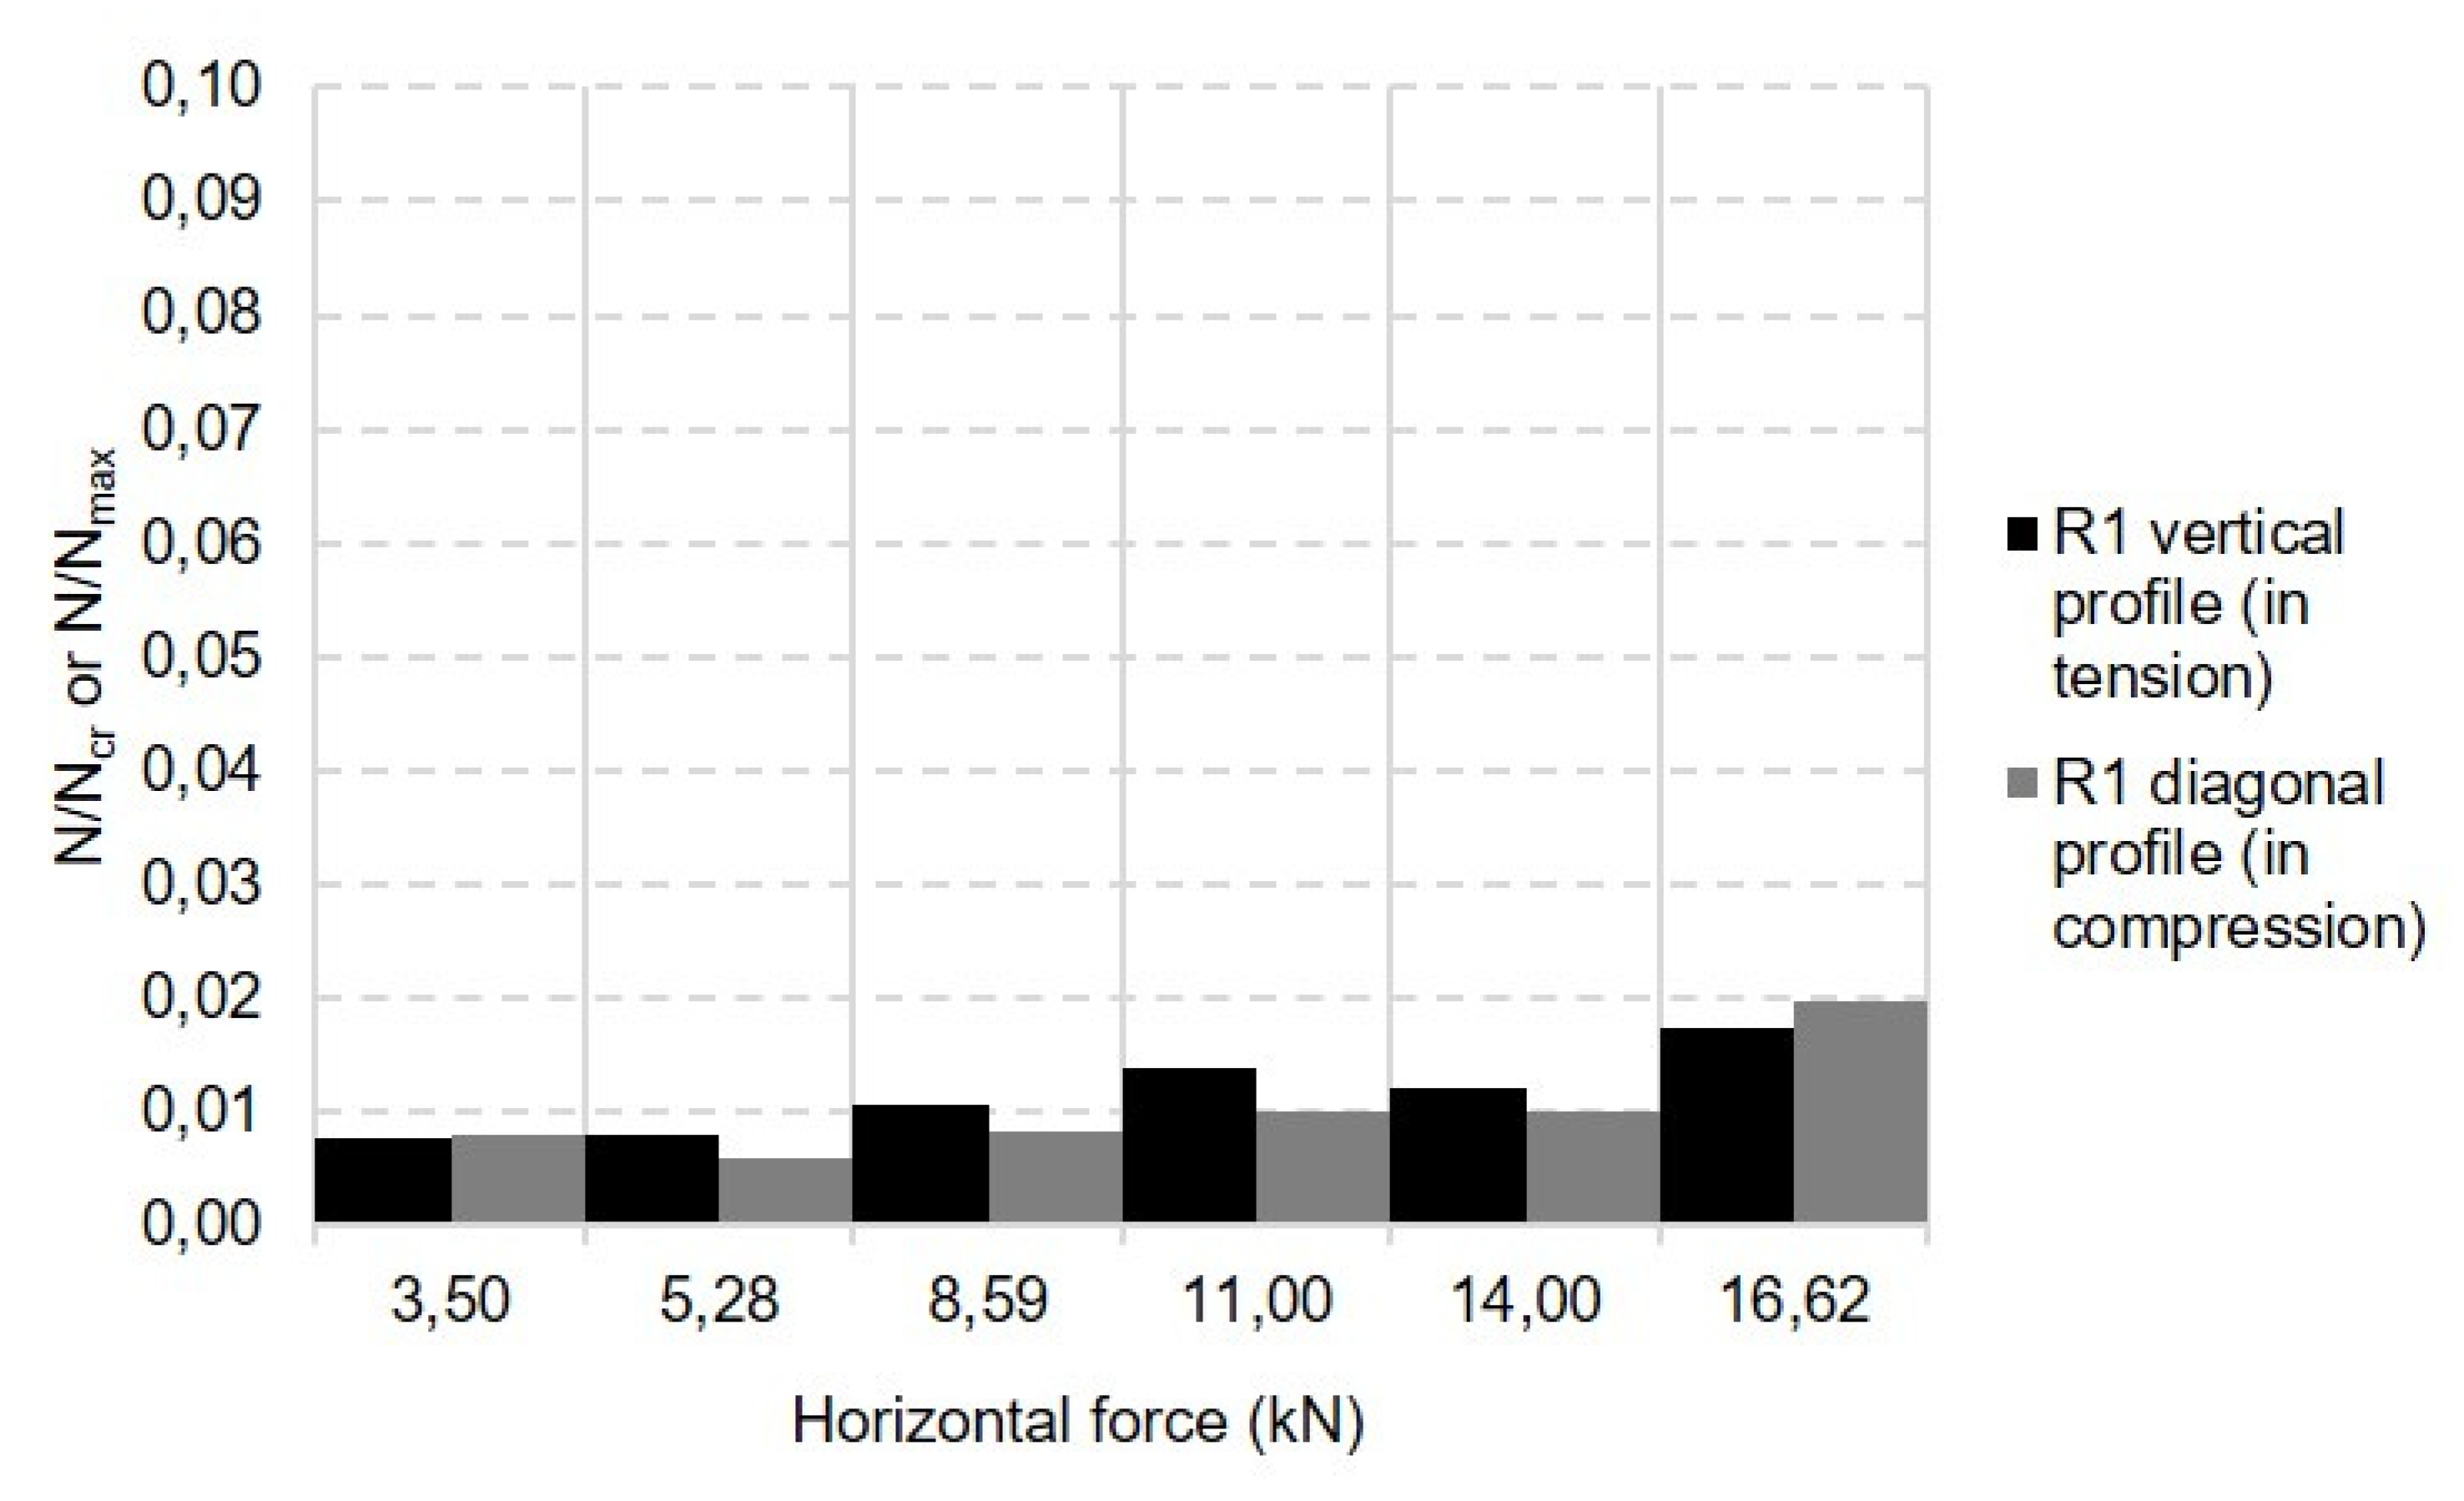
The histogram in Figure 15 is construed after calculating the axial load from the strain gauge plots of the GFRP profiles, assuming the elastic modulus value in Table 2. The tensile load (vertical profile) is normalized by the maximum load Nmax (Equation (8)), and the compressive load (diagonal profile) by the critical load Ncr (Equation (9)) for the specific length of the profile segment:
N m a x = f c , l o n g · A γ m , f ,
N c r = N m a x 1 + N m a x N E u l ,
where fc,long is the profile’s longitudinal compressive strength, γm,f the safety factor (assumed to be equal to 1.3), A the cross-sectional area and NEul the Eulerian load [35].
Despite the noticeable increase in strength provided by the frame retrofit, Figure 13 points out the very low stress rates of the GFRP profiles, slowly increasing up to failure and not exceeding 2% of the profile’s maximum capacity. The low exploitation of the GFRP’s strength was expected, since the masonry remains the weakest ring even in the retrofitted system; however, the stress rate on the retrofit frame surely deserves further investigation, possibly by numerical means, to understand the facts of stress transfer from the masonry to the frame through the anchors (which it was not possible to monitor during the tests). The frame is thus very effective in impairing the weakest mechanism of failure, mainly due to the vertical profile; the diagonal member of the frame shows a weaker relief of the stress, as one can also see from Figure 11 (left). Indeed, the choice of a cross-section of much higher capacity than the design buckling load—mainly due to the practical feasibility of the connections—has led to a very stiff frame and a low rate of work in the pultruded profiles.

5. Conclusions

  • The retrofit solution brings on a substantial increase in strength (minimum +53% at first crack, +85% at the peak and +98% at the ultimate load) of the investigated masonry sample. The failure mode turns to a mixed mechanism, between central diagonal cracking and central bed joint sliding. The proposed solution brings on a significant improvement in the mechanical performance of traditional brick masonry with hydraulic lime mortar joints;
  • The improvement in drift capacity of R1 and R2 is clear, but the increase in the ultimate drift after retrofit is not fully clarified by the described testing program. The two tests have produced large differences (i.e., +112% and +303%). The geometric imperfection of sample R1 (out-of-plumb) is deemed responsible for the sudden collapse under testing, and has prevented the sample from reaching an ultimate drift as high as R2 did. Further tests are surely required to explore the proposed retrofit solution in more detail and with increased reliability;
  • The design of the fastenings, according to the American Concrete Institute’s (ACI) recommendations, is definitely on the safe side, since no sign of masonry rupture, bar plasticization or hole bearing was detected after the tests. However, this aspect deserves more attention in the future steps of the research, because it is crucial in improving the exploitation of the high stiffness and strength of FRP profiles;
  • The assumption of the partial half-scale has allowed us to obtain promising results regarding the effectiveness of the proposed retrofit solution, at a limited cost and with relatively manageable laboratory samples; however, a comparison with full-scale behavior would allow for the more detailed design of frame profiles and connections;
  • As for the FE model of the case study, an update—consisting of the implementation of experimental data to describe the joint’s shear stiffness—was essential to improve the model’s capability to catch the experimental load–drift behavior with enough accuracy. In this way, the model has shown rather good agreement with the experimental values of elastic stiffness, maximum load and magnitude of displacements, and most of all the crack pattern and strength gain of the masonry wallette after retrofit (89%, both from the tests and the FE model). This is to be considered the initial state of a predictive model for the next phases of the research, which will be useful to evaluate the pre- and post-retrofit behavior of other case studies. In fact, the residual discrepancy between the FE model and the experimental cases, especially between the first crack and the peak, should be reduced. This could be done by increasing the number of tests on one side, and by accounting for different types of nonlinearities on the other—e.g., plasticity-based models instead of cracking. This task will be duly undertaken in the next steps of the research.

Funding

This research received no external funding.

Acknowledgments

The author warmly thanks Topglass s.r.l. (especially Eng. Yari Zampieri), who kindly provided the pultruded FRP profiles; prof. Salvatore Russo for his support; prof. Antonella Cecchi, Director of IUAV Laboratory of Strength of Materials (LabSco), and the technical personnel Dr Giosuè Boscato, Mr Ivano Aldreghetti, Mr Lorenzo Massaria and Mr Italo Tofani, who all gave crucial support to the experimental research; Mr Papa Amadou Diallo at Palooza s.n.c. metallic carpentry, Mestre (VE).

Conflicts of Interest

The author declares no conflict of interest.

References

  1. Dubină, D. (Ed.) Seismic retrofitting of existing structures using steel-based solutions. In Minutes of International Workshop Organised within the Framework of FRS2-CT-2014-00022 STEELEARTH, Timişoara, Romȃnia, 23th November 2015; Politehnica University of Timisoara: Timişoara, Romȃnia, 2015. [Google Scholar]
  2. Sugano, S. State-of-the-art in techniques for rehabilitation of buildings. In Proceedings of the 11th WCEE—World Conference on Earthquake Engineering, Acapulco, Mexico, 23–28 June 1996. Paper No. 2175. [Google Scholar]
  3. Buonocore, G.; Gesualdo, A.; Monaco, M.; Savino, M.T. Improvement of Seismic Performance of Unreinforced Masonry Buildings using Steel Frames. In Proceedings of the 12th International Conference on Computational Structures Technology, Naples, Italy, 2–5 September 2014; p. 117. [Google Scholar]
  4. Rai, D.C.; Goel, S.C. Seismic strengthening of unreinforced masonry piers with steel elements. Earthq. Spectra 1996, 4, 845–862. [Google Scholar] [CrossRef]
  5. Papalou, A. Strengthening of masonry structures using steel frames. Int. J. Eng. Tech. 2013, 2, 50–56. [Google Scholar] [CrossRef] [Green Version]
  6. Lorenzo Jurina—Torre San Dalmazio a Pavia. Available online: http://jurina.it/1992/01/01/torre-san-dalmazio-a-pavia (accessed on 3 February 2020).
  7. Consolidamento Chiesa di San Giacomo Apostolo a S. Croce di Magliano. Available online: https://www.santacroceonline.com/2012/news/lug/1_15/sangiacomo/chiesasangiacomo.pdf (accessed on 3 February 2020).
  8. TekPe Engineers—Seismic Retrofit Projects by TPE. Available online: http://www.tekpeengineers.com/seismic-retrofit.html (accessed on 3 February 2020).
  9. Dmytro, D.; Jason, I.; Lisa, M.; Mike, G.; Arturo, S.; Ilaria, S.; Guido, M.; Jocelyn, D.; Shelley, L.; Jose, C.; et al. Performance of masonry buildings and churches in the 22 February 2011 Christchurch earthquake. Bull. New Zeal Soc. Earthq. Eng. 2011, 44, 279–296. [Google Scholar]
  10. Casalegno, C.; Russo, S.; Sciarretta, F. Numerical analysis of a masonry panel reinforced with pultruded FRP frames. Mech. Compos. Mat. 2018, 2, 207–220. [Google Scholar] [CrossRef]
  11. Boscato, G.; Costantini, G.; Scafuri, V. Seismic Design of Pultruded FRP Structures as Ancillary and/or Independent Solution. Key Eng. Mater. 2017, 747, 586–593. [Google Scholar] [CrossRef]
  12. Top Glass Sponsor Della “Glass House” all’Università di Venezia. Available online: https://www.topglass.it/notizia-padiglione-iuav/ (accessed on 3 February 2020).
  13. Kiora Footbridge. Available online: https://compositesuk.co.uk/system/files/documents/Case%20Study%20-%20Kiora%20Sluice%20Footbridge.pdf (accessed on 3 February 2020).
  14. Nehdi, M.; El Damatty, A.; Rahimi, R. Investigation on lap-joint behavior of GFRP plates bonded to silica fume and rice husk ash concrete. Int. J. Adh. Adhes 2003, 23, 323–333. [Google Scholar] [CrossRef]
  15. Bedon, C.; Louter, C. Numerical investigation on structural glass beams with GFRP-embedded rods, including effects of pre-stress. Compos. Struct. 2018, 184, 650–661. [Google Scholar] [CrossRef]
  16. Boscato, G. Comparative study on dynamic parameters and seismic demand of pultruded FRP members and structures. Compos. Struct. 2017, 174, 399–419. [Google Scholar] [CrossRef]
  17. Russo, S. Performance of a PFRP structure covering a historic building struck by an earthquake. In Proceedings of the ACIC 2011, Coventry, UK, 6–8 September 2011. [Google Scholar]
  18. BIA. Anchor Bolts for Brick Masonry; Technical Note No. 44; Brick Industry Association: Reston, Virginia, USA, 1986. [Google Scholar]
  19. McGinley, W. Design of anchor bolts in masonry. Prog. Struct. Eng. Mater. 2006, 8, 155–164. [Google Scholar] [CrossRef]
  20. Muñoz, R.; Lourenço, P.B.; Moreira, S. Experimental results on mechanical behavior of metal anchors in historic stone masonry. Constr. Buil. Mater. 2018, 163, 643–655. [Google Scholar] [CrossRef]
  21. Sciarretta, F.; Russo, S.; Casalegno, C. Experimental analysis of failure mechanisms in masonry-PFRP profiles connections. Adv. Civil. Eng. 2018, 2018, 5475347. [Google Scholar] [CrossRef] [Green Version]
  22. Specification for Ancillary Components for Masonry Part 1: Wall Ties, Tension Straps, Hangers and Brackets; EN 845-1:2013+A1:2016; Comité Européen de Normalisation: Brussels, Belgium, 2016.
  23. Masonry Standards Joint Committee (MSJC). Building Code Requirements for Masonry Structures (ACI 530-02/ASCE 5-02/TMS 402-02; The Masonry Society: Longmont, CO, USA, 2005. [Google Scholar]
  24. Cecchi, A.; Russo, S.; Sciarretta, F. Preliminary investigation on FRP profiles for the structural retrofit of masonry structures. Key Eng. Mater. 2017, 747, 77–84. [Google Scholar] [CrossRef]
  25. Sciarretta, F.; Russo, S. FE modelling and experimental investigation on adhesive joints between clay brick and pultruded FRP profiles. Constr. Build. Mater. 2019, 226, 601–615. [Google Scholar] [CrossRef]
  26. Sciarretta, F.; Russo, S. Half-scale tests on masonry panels strengthened with Pultruded FRP frames. Key Eng. Mater. 2019, 817, 95–102. [Google Scholar] [CrossRef]
  27. Eurocode 8—Design of Structures for Earthquake Resistance. Part 1: General Rules, Seismic Actions and Rules for Building; EN 1998-1:2005; Comité Européen de Normalisation: Brussels, Belgium, 2005.
  28. Taghdi, M.; Bruneau, M.; Saatcioglu, M. Analysis and design of low-rise masonry and concrete walls retrofitted using steel strips. ASCE J. Struct. Eng. 2000, 126, 1026–1032. [Google Scholar] [CrossRef]
  29. Methods of Test for Masonry Units—Part 1: Determination of Compressive Strength; EN 772-1:2015; Comité Européen de Normalisation: Brussels, Belgium, 2015.
  30. Methods of Test for Mortar for Masonry—Part 11: Determination of Flexural and Compressive Strength of Hardened Mortar; EN 1015-11:2006; Comité Européen de Normalisation: Brussels, Belgium, 2006.
  31. Methods of Test for Masonry—Part 3: Determination of Initial shear Strength; EN 1052-3:2007; Comité Européen de Normalisation: Brussels, Belgium, 2007.
  32. Hendry, A.W. Structural Brickwork; Macmillan: London, UK; Basingstoke, UK, 1981. [Google Scholar]
  33. Brencich, A.; Corradi, M.; Gambarotta, L.; Mantegazza, G.; Sterpi, E. Compressive strength of solid caly brick masonry under eccentric loading. Proc. Br. Mason Soc. 2002, 9, 37–46. [Google Scholar]
  34. Tassios, T.P. Meccanica Delle Murature; Liguori: Naples, Italy, 1988. [Google Scholar]
  35. Thorning, H. (Ed.) Fiberline Design Manual, 2nd ed.; Fiberline Composites A/S: Kolding, Denmark, 2003. [Google Scholar]
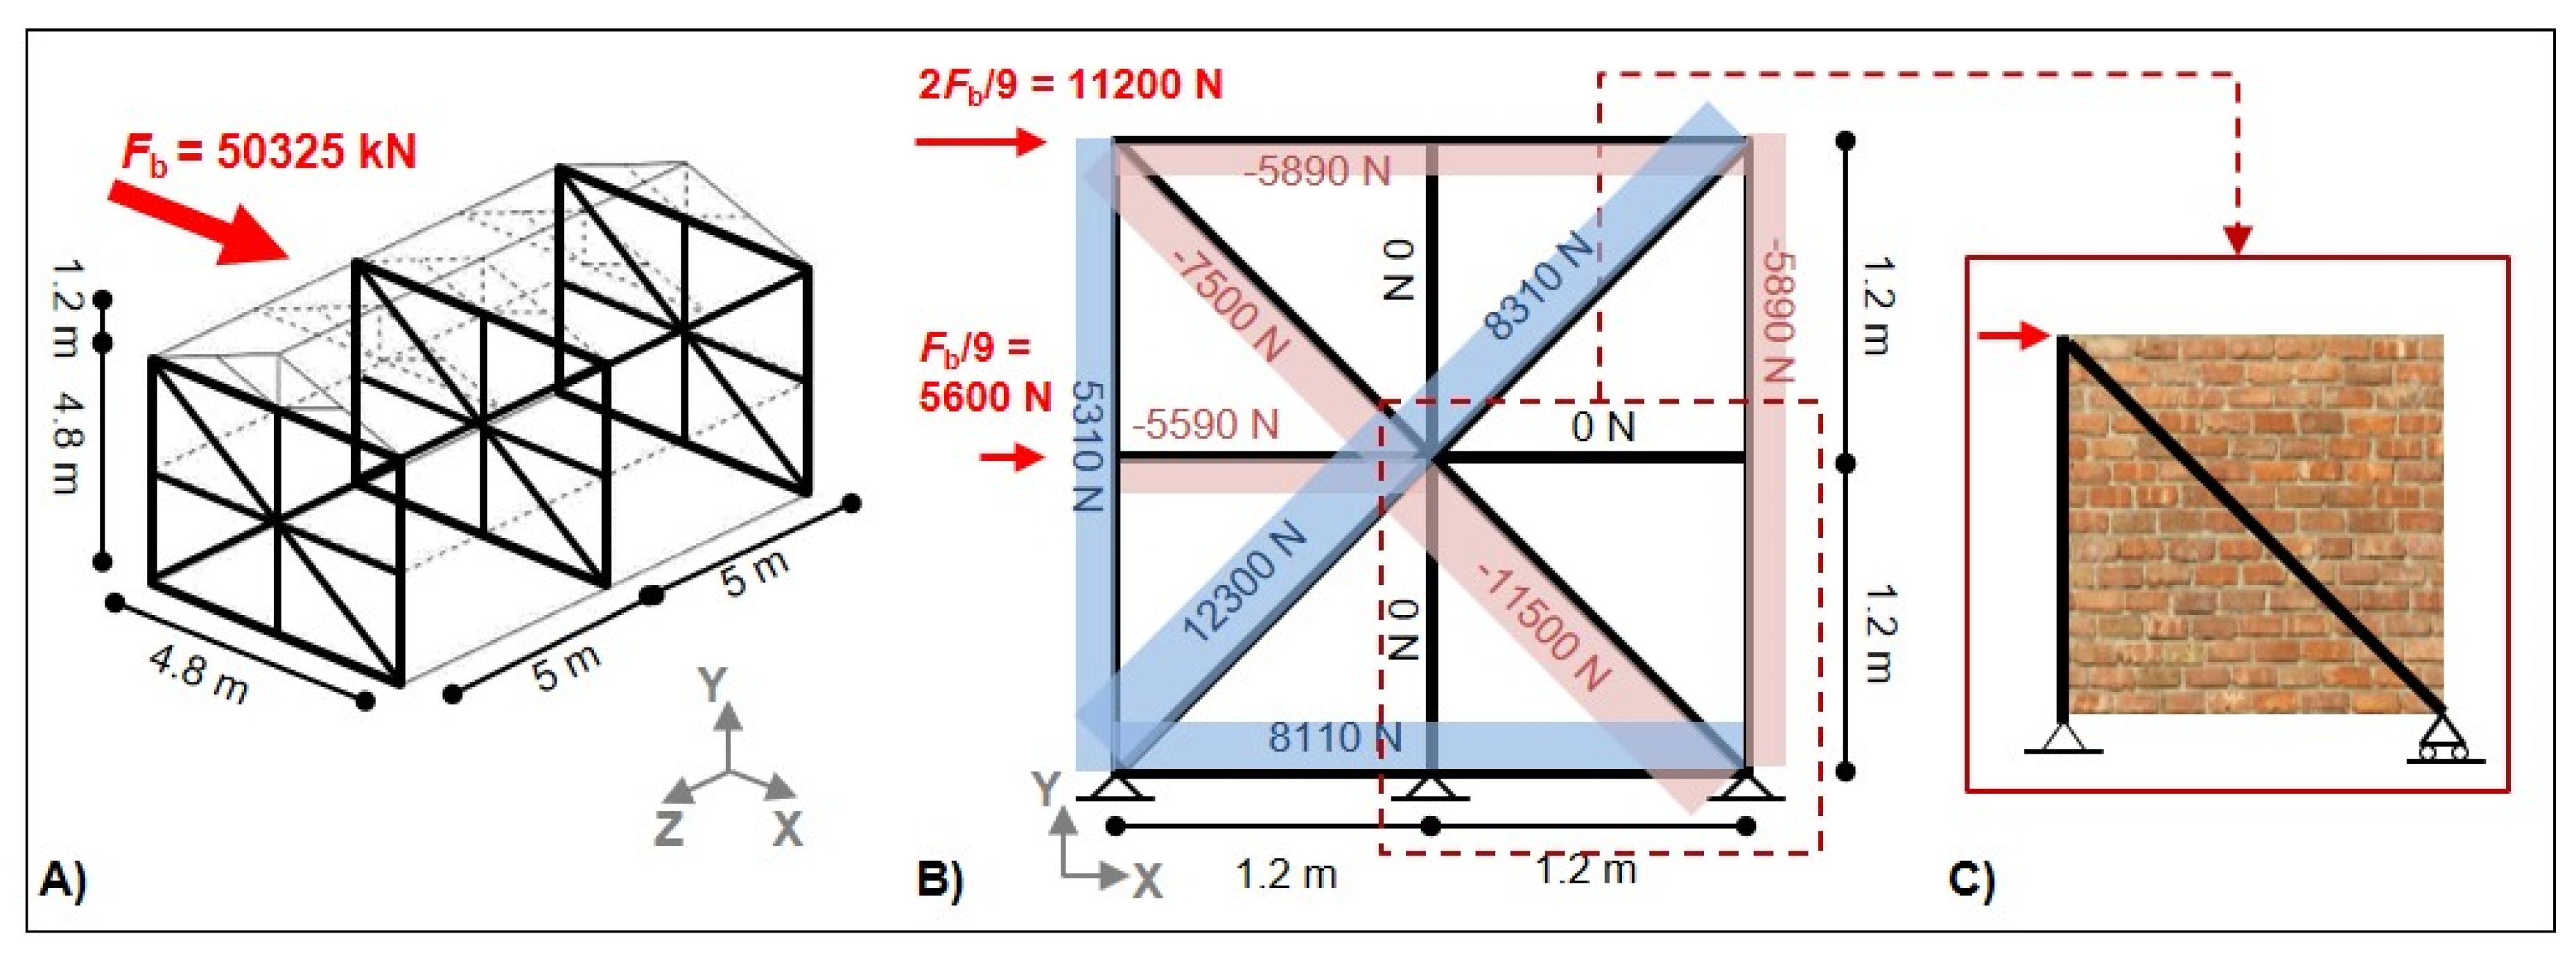
Figure 1. (A) Typical low-rise traditional building and retrofit system with Pultruded Fiber Reinforced Polymer frames; (B) half-scale retrofit frame: static scheme and axial force diagram; (C) physical model of the research.
Applsci 10 02489 g001
Figure 2. (A) Built wallettes; (B) drawing of the retrofitted wallette; (C1-2-3) details of the frame–wallette connections.
Applsci 10 02489 g002
Figure 3. Transducers and gauges locations and physical models N1, R1, and R2 under testing setup.
Applsci 10 02489 g003
Figure 4. (A) Results of compressive tests on mortar samples, (B) results of initial shear strength tests.
Applsci 10 02489 g004
Figure 5. Predictive FE model of the tested samples: (A) load–drift graphs, (B) crack pattern.
Applsci 10 02489 g005
Figure 6. Horizontal force–drift graph of the three tests.
Applsci 10 02489 g006
Figure 7. N1 test: crack pattern at peak load.
Applsci 10 02489 g007
Figure 8. R1 test: (A) crack pattern at peak load, (B) at the instant of collapse.
Applsci 10 02489 g008
Figure 9. R2 test: (A) shortly after first cracking, (B) at the ultimate displacement.
Applsci 10 02489 g009
Figure 10. Load-displacement graphs of the masonry along the diagonals, N1 and R1 tests.
Applsci 10 02489 g010
Figure 11. Load–strain graphs of FRP profiles, R1 and R2 tests.
Applsci 10 02489 g011
Figure 12. Updated FE model: force–drift graphs (dotted lines), compared to the test results.
Applsci 10 02489 g012
Figure 13. Updated FE model of the case study; crack pattern compared to the test results.
Applsci 10 02489 g013
Figure 14. Comparison between the displacements of unretrofitted and retrofitted masonry across tests N1 and R1.
Applsci 10 02489 g014
Figure 15. Ratio of axial load to maximum load (vertical profile) and critical load (diagonal profile) in the GFRP frame at different load levels.
Applsci 10 02489 g015
Table 1. Calculation of the building mass.
ElementsQuantityDimensions 1:1 (m)Unit massTotal Mass 1:2 (kg)
Wooden trusses50.15 × 0.15, total length 14.04650 kg/m³148
Wooden lintels90.1 × 0.1, total length 10.00650 kg/m³73
Clay tiles and tablets1roof surface 2.68 × 10 × 2 pitches70 kg/m²469
Floor (dead and live load)110 × 5660 kg/m²3960
External walls2(10 + 4.8) × 4.8 × 0.25, 30% holes1550 kg/m³4530
Internal wall14.8 × 4.8 × 0.25, 15% holes1550 kg/m³897
Total mass of the whole building10077
Table 2. Glass Fiber Reinforced Polymer (GFRP) characteristics.
PropertyValue
Longitudinal compressive elastic modulus Ez,c (N/mm²)20,000
Poisson’s coefficient νxz0.25
Longitudinal tensile elastic modulus (N/mm²)30,000
Longitudinal flexural elastic modulus (N/mm²)30,000
Longitudinal compressive strength (N/mm²)300
Longitudinal tensile strength (N/mm²)400
Longitudinal flexural strength (N/mm²)400
Shear strength (N/mm²)30
Table 3. Material properties.
MaterialPropertyValueSource
BrickCompressive strength fbc (N/mm²)20.00Destructive testing
Elastic modulus Eb (N/mm²)5700Destructive testing
Poisson’s ratio νb (-)0.18producer’s data
MortarCompressive strength fmc (N/mm²)4.40Destructive testing
Flexural strength fmf (N/mm²)0.92Destructive testing
Elastic modulus Em (N/mm²)5690Destructive testing
Poisson’s ratio νm (-)0.25producer’s data
MasonryCompressive strength fwc (N/mm²)14.96Equation (3)
Elastic modulus Ew (N/mm²)4878Equation (4)
Joint shear strength at σ0 = 0.1 N/mm² τ0.1 (N/mm²)0.56Destructive testing
Joint peak shear displacement dpeak (mm)1.6Destructive testing
Table 4. Results of the tests and per cent variation of retrofitted versus unretrofitted case.
CaseFirst CrackMaximum ForceUltimate Displacement
P1 (kN)d1 (mm)Pmax (kN)d2 (mm)Pu (kN)du (mm)
N15.2751.4018.59413.1658.08114.287
N-FE8.0000.1068.0000.1069.0000.452
R111.899 (+125%)3.034 (+117%)16.621 (+93%)30.277 (+130%)16.621 (+106%)30.277 (+112%)
R28.068 (+53%)1.951 (+39%)15.904 (+85%)21.818 (+66%)16.010 (+98%)57.603 (+303%)
R-FE6.0000.06016.0000.31517.0000.485
Table 5. Comparison of tests to FE simulation.
CaseElastic StiffnessMaximum LoadUltimate DisplacementMaximum Load Increase with Retrofit
UnretrofittedFE preliminary/EXP+2003%+5%−97%
FE updated/EXP−9%+5%+21%
RetrofittedFE preliminary/EXP *+2483%+5%−99%±0%
FE updated/EXP *+10%+5%−12%±0%
* Here, EXP is the average experimental value of R1 and R2.