Article

Mesoporous Carbon as Galvanic-Corrosion Activator Accelerates Fe Degradation

1
Institute of Bioadditive Manufacturing, Jiangxi University of Science and Technology, Nanchang 330013, China
2
State Key Laboratory of High Performance Complex Manufacturing, Central South University, Changsha 410083, China
3
School of Intelligent Manufacturing and Equipment, Shenzhen Institute of Information Technology, Shenzhen 518172, China
4
College of Mechanical and Electrical Engineering, Nanjing University of Aeronautics and Astronautics, Nanjing 210016, China
*
Authors to whom correspondence should be addressed.
Appl. Sci. 2020, 10(7), 2487; https://doi.org/10.3390/app10072487
Submission received: 27 February 2020 / Revised: 25 March 2020 / Accepted: 2 April 2020 / Published: 4 April 2020
(This article belongs to the Special Issue Obtaining, Characterization and Applications of Advanced Materials)

Abstract

:
Iron (Fe) has attracted intensive attention as a bone implant material because of its inherent biodegradability, favorable biocompatibility and mechanical properties. Nevertheless, it degrades too slowly in a physiological environment, which limits its further clinical application. In this work, mesoporous carbon (MC) was introduced into Fe bone implant manufactured via a laser-additive manufacturing process. Particularly, MC possesses a noble standard corrosion potential and excellent electrical conductivity, thus acting as an effective cathode and activating micro-galvanic corrosion in the Fe matrix. More importantly, its high specific surface area enhanced the area ratio between cathode and anode, which further enhanced the galvanic corrosion effect. As a consequence, the corrosion rate was enhanced from 0.09 to 0.24 mm/year based on immersion tests. Besides, Fe/MC composite exhibited good cytocompatibility, as well as excellent mechanical properties. The positive results proved that the Fe/MC composite shows great potential as a bone implant.

1. Introduction

Biodegradable metal materials, including iron (Fe), magnesium and zinc, have currently drawn much attention for their potential bone repair application [1,2,3,4]. Among them, Fe is recognized as the preferable choice to provide structure support for the defect bone in load-bearing area due to its excellent mechanical properties [5,6]. Meanwhile, Fe is one of the essential nutritional elements, and involves a variety of oxidases and metabolic enzymes [7,8]. Its favorable biocompatibility has also been confirmed by in vitro and in vivo research [9,10]. Unfortunately, Fe degrades too slowly in the physiological environment, which significantly restricts its further clinical orthopedic application [11,12].
To improve the corrosion behavior, previous researchers incorporated the noble phase into Fe matrix as a cathode to enhance micro-galvanic corrosion [13,14,15]. For instance, Čapek et al. [16] added Pd into Fe, which improved the degradation rate from 0.04 to 0.12 mm/year. Zhao et al. [17] incorporated graphene oxide into Fe as a galvanic corrosion couple, which enhanced the degradation rate from 0.09 to 0.41 mm/year. Mesoporous carbon (MC) possesses a nobler electrode potential (0.207 V) than Fe (−0.440 V) [18]. More significantly, it possesses a high specific surface area, which can increase area ratio between the cathode and anode [19]. Previous studies confirmed that an increased area ratio of cathode and anode could enhance the galvanic corrosion effect [20,21,22]. Moreover, MC has excellent electrical conductivity, which can decrease the electron transfer resistance and increase corrosion current density [23,24]. Thus, MC is expected to act as an effective galvanic corrosion activator in the Fe matrix. Besides, MC was reported to be of favorable biocompatibility, and has been used as drug delivery for biomedical application [25].
Based on the above considerations, herein, MC was introduced into Fe matrix aiming to obtain Fe-based composite with tailored degradation rate. Fe/MC composite was manufactured using laser additive manufacturing. Compared with other technologies, laser additive manufacturing can produce bone implants with a complex structure and personalized shape [26,27,28,29]. The microstructure characteristic, mechanical properties, as well as the corrosion behavior were studied systematically. Meanwhile, the corresponding corrosion mechanism was elaborated. Moreover, the cytocompatibility of Fe/MC composite was also evaluated.

2. Materials and Methods

2.1. Material

Fe powder (99.9%, ~35 µm) was supplied from Shanghai Naiou Nano technology Co., Ltd, as shown in Figure 1a. MC powder (99.9%, average pore diameter of 3.9 nm, length of about 20 µm) was purchased from Aladdin biochemical Technology Co., Ltd. (Shanghai, China), as shown in Figure 1b, which showed a well-ordered mesoporous structure. The physicochemical parameters of MC were listed in Table 1.

2.2. Fabrication Process

The MCs with mass fractions of 0, 0.5, 1.0 and 1.5 wt.%, respectively, were mixed with Fe powder in alcoholic solution, and then mechanically stirred at a rotation rate of 300 rpm for 2 h. Subsequently, the Fe/MC powders were dried at 60 °C for 10 h. The Fe/MC composites were prepared on a home-made selective laser melting (SLM) machine, which consisted of a powder delivery system, a galvanometer scanner, intelligent purification cycle system and dust removal system. High-purity argon (99.999%) was provided during experiments. Based on a series of preliminary experiments, the optimal process parameters were set at laser power 110 W, scanning speed 170 mm/s, layer thickness 80 μm, scanning distance 50 μm. The SLM-fabricated samples with a size of 6 × 6 × 6 mm3 were exhibited in Figure 1c. These samples contained MC with a nominal content of 0, 0.5, 1.0 and 1.5 wt.%, and were described as Fe, Fe/0.5MC, Fe/1.0MC and Fe/1.5MC, respectively.

2.3. Microstructure Characterization

The as-built parts were mechanically polished using metallographic sandpaper up to 1500 grits and ultrasonically cleaned in anhydrous ethanol. The microstructure was analyzed using a scanning electron microscopy (SEM, ZEISS, Germany) combined with an energy dispersive spectrometer (EDS). The phase composition was studied by using an x-ray diffractometer (XRD, Karlsruhe, Germany) at 8°/min from 10 to 90°. The mechanical tests were performed using a universal test machine. The tensile samples were prepared basing on GBT228-2002, as shown in Figure 1d. The tensile tests were conducted at a crosshead rate of 1 mm/min. In addition, the fracture surfaces obtained by tensile tests were investigated using SEM.

2.4. Electrochemical Experiments

The electrochemical tests were performed on a three-electrode electrochemical workstation (CHI660E, CH Instruments Inc.). In these tests, the specimen was set as the working electrode. A platinum mesh and a saturated Ag/AgCl (Sat. KCl) electrode were selected as the counter electrode and reference electrode, respectively. The whole experimental process was performed at 37 °C in a electrolytic cell using simulated body fluid (SBF) as the electrolyte, which was composed of NaCl (8.035 g/L), NaHCO3 (0.355 g/L), KCl (0.225 g/L), K2HPO4·3H2O (0.231 g/L), MgCl2·6H2O (0.311 g/L), CaCl2 (0.292 g/L), Na2SO4 (0.072 g/L). The open circuit potential (OCP) was monitored for 3600 s. The electrochemical impedance spectroscopy (EIS) was conducted ranging from 0.01 to 100,000 Hz using a peak-to-peak 10 mV sinusoidal perturbation. Potentiodynamic polarization test was performed at a sweep rate of 0.2 mV/s. The corrosion rates (CR, mm/year) basing on electrochemical tests were determined by
CR = 3.27 × 10³ × icorr × W/ρ
where icorr (μA/cm2) represented the corrosion current density, ρ (g/cm-3) was the density, and W was the equivalent weight. Herein, the W was 27.92 g/eq. Meanwhile, the electrochemical corrosion surface was observed using SEM.

2.5. Immersion Tests

Immersion tests were performed in SBF at 37 ℃ with an exposed surface area to a solution volume ratio of 0.1 cm2/mL. After immersion for 7, 14, 21 and 28 d, the corrosion products on specimens were removed based on ASTM G1-03. Subsequently, specimens were ultrasonically cleaned for 15 min, washed with distilled water and then dried for 12 h before weighing. The degradation rate (DR, mm/year) basing on immersion tests was calculated by the following formula
DR = 8.76 × 10⁴ × M/(A × T × D)
where M (g), T (h), A (cm2) and D (g·cm-3) were the weight loss, immersion time, exposed surface area, and the density, respectively. The Fe ion concentration in soaked solution was measured using an inductively coupled plasma-atomic emission spectroscopy (ICP-AES). The corrosion surface was characterized by SEM.

2.6. In Vitro Cell Experiments

MG-63 cells (American Type Culture Collection, Rockville, USA) were selected to assess the cytocompatibility of Fe/MC composite. Dulbecco’s modified Eagle’s medium (DMEM) containing 10% fetal bovine serum, 100 U/mL penicillin and 100 mg/mL streptomycin was applied as culture medium. Prior to the experiments, samples were sterilized using ultraviolet light for 30 min, and then immersed in culture medium for 3 d to obtain the extracts with a solution volume to sample weight ratio of 5 mL/g. Before the tests, MG-63 cells were cultured in a 96-well plate containing culture medium for 1 d. Then, the culture medium was replaced by extracts. After culture for 1, 4 and 7 d, 10 µL of cell counting kit-8 (CCK-8) reagent was dropped into each well and further incubated for 3 h. Finally, the absorbance was measured using a microplate reader. Moreover, LIVE cells fluorescence staining was used to quantitatively assess the cell viability. After culture for 1, 4, and 7 days, the Calcein-AM reagent were used to stain the cells for 15 min. Then, the stained cells were observed utilizing a fluorescence microscopy (BX60, Olympus, Japan).

2.7. Statistical Analysis

Data in the present work were expressed as mean ± deviations. The one-way ANOVA analysis model was performed to study the statistical significance. When the p-value was below 0.05, difference was considered to be significant.

3. Results and Discussion

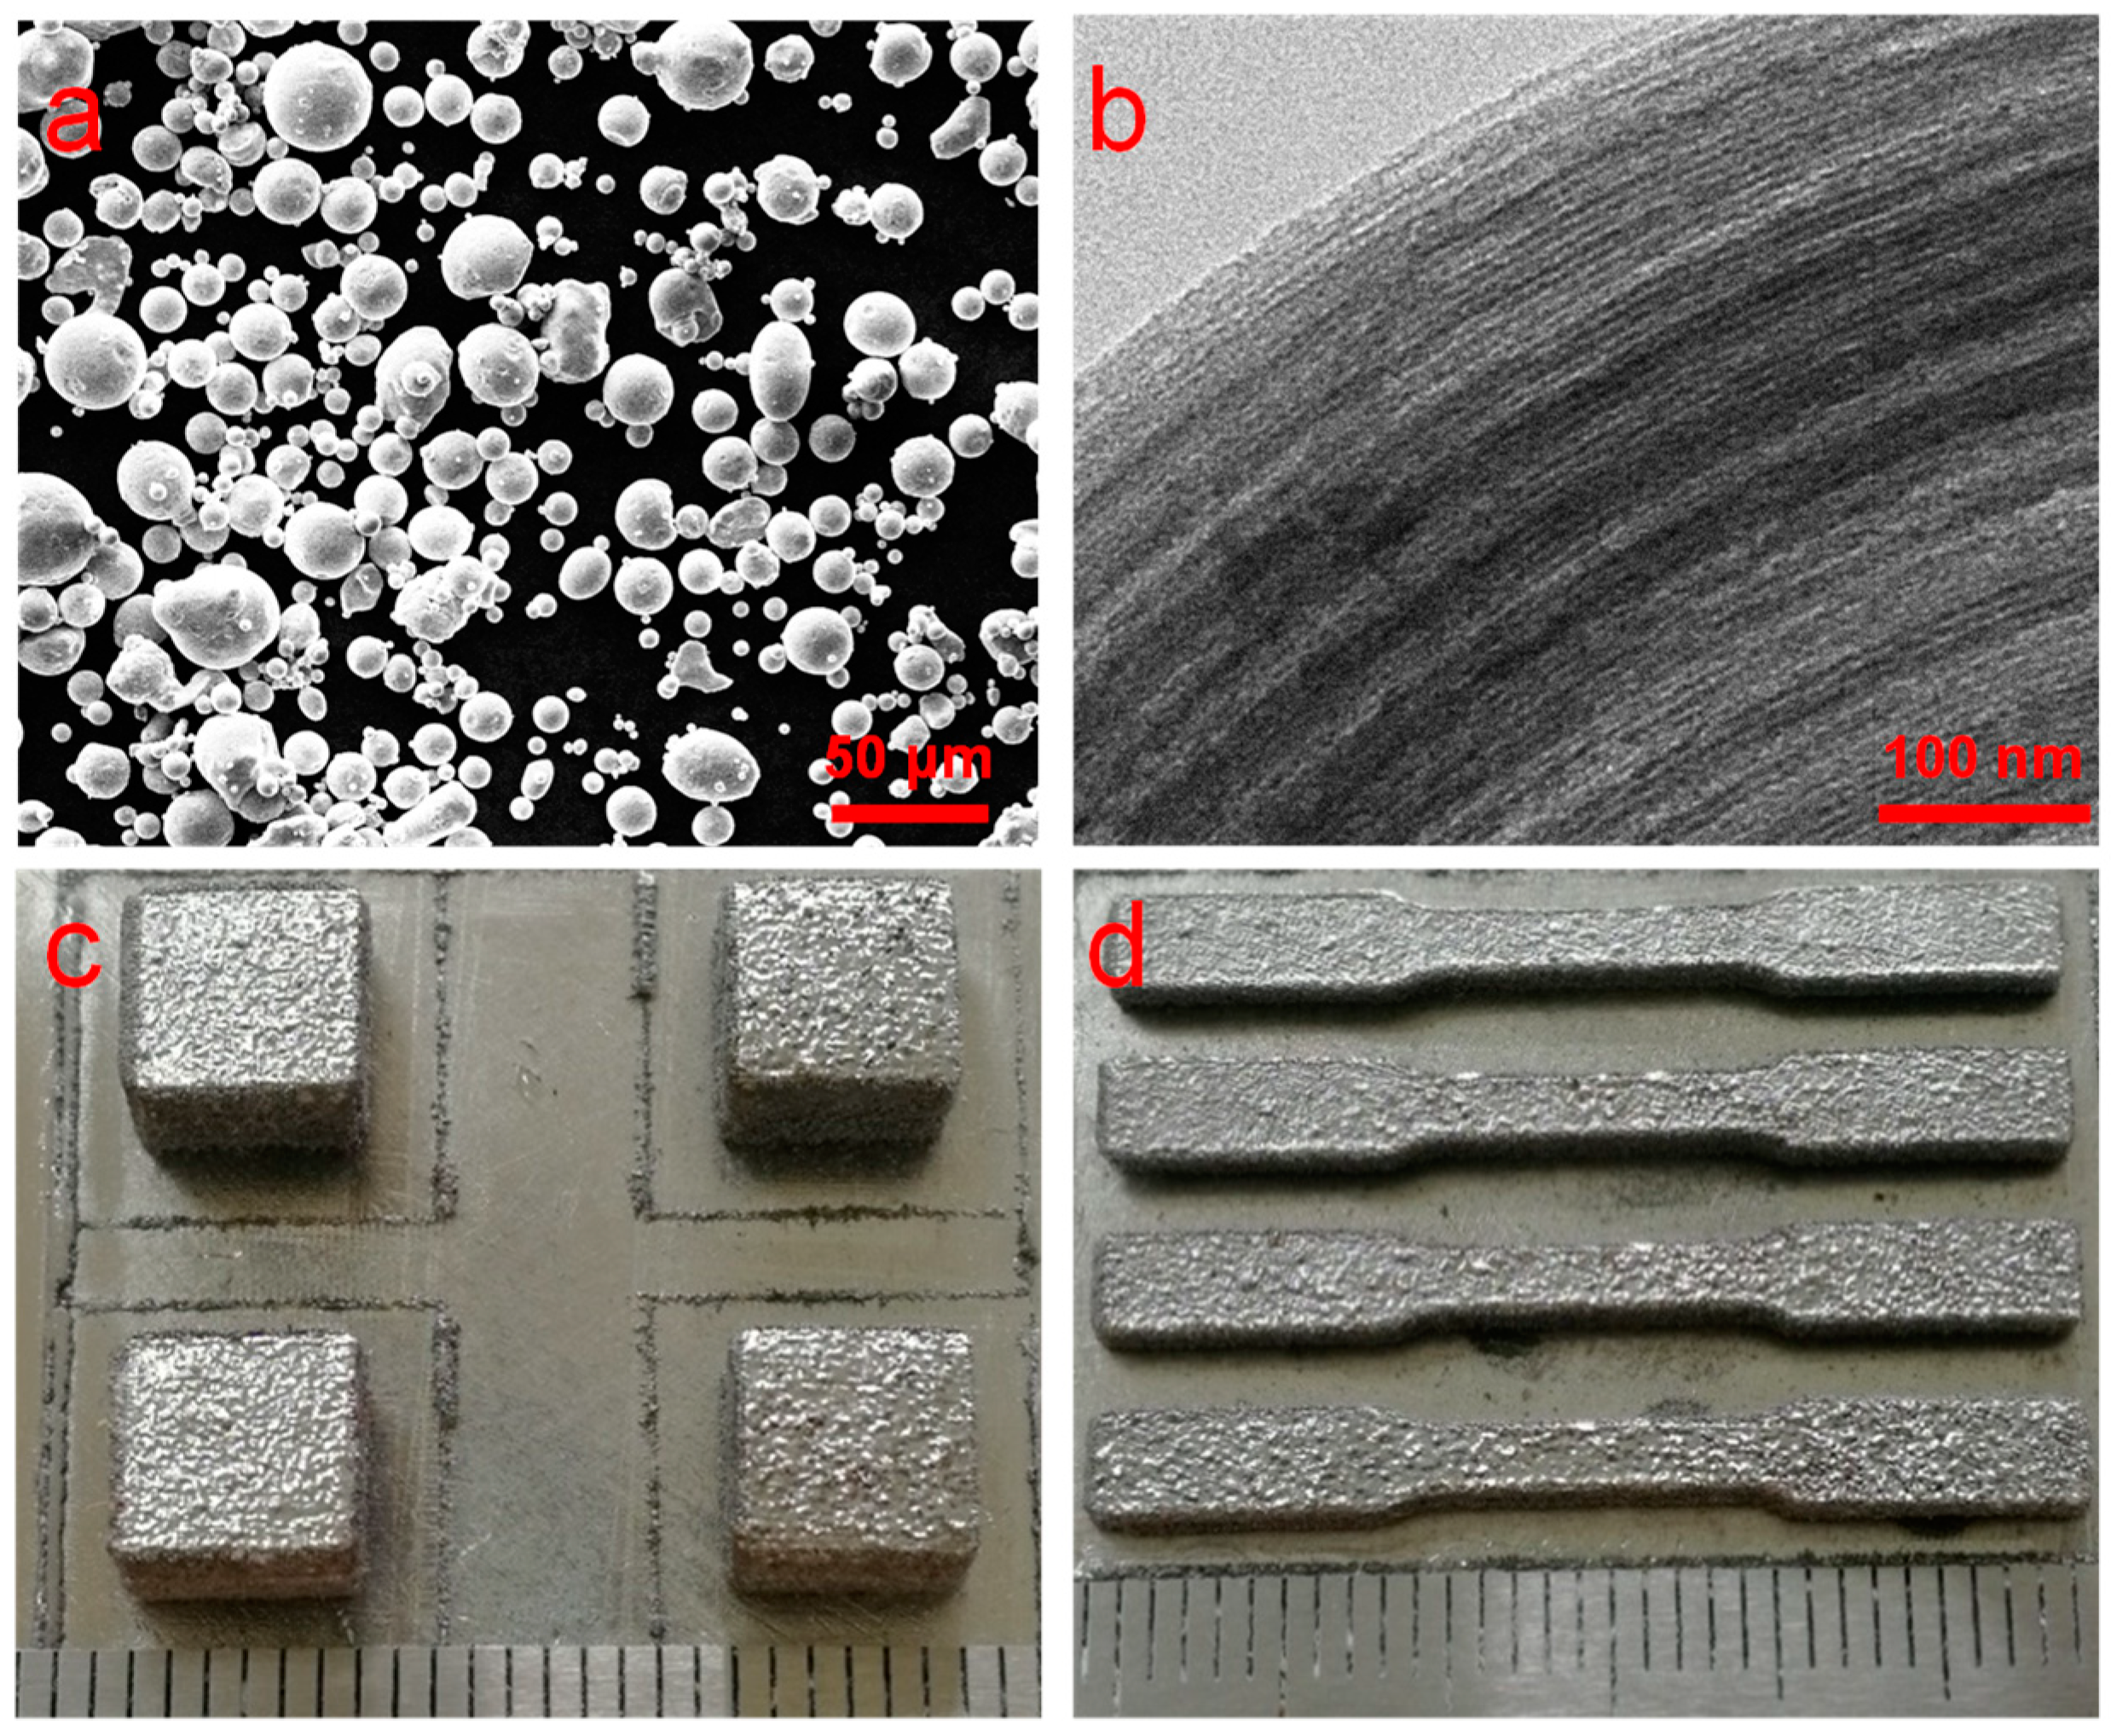
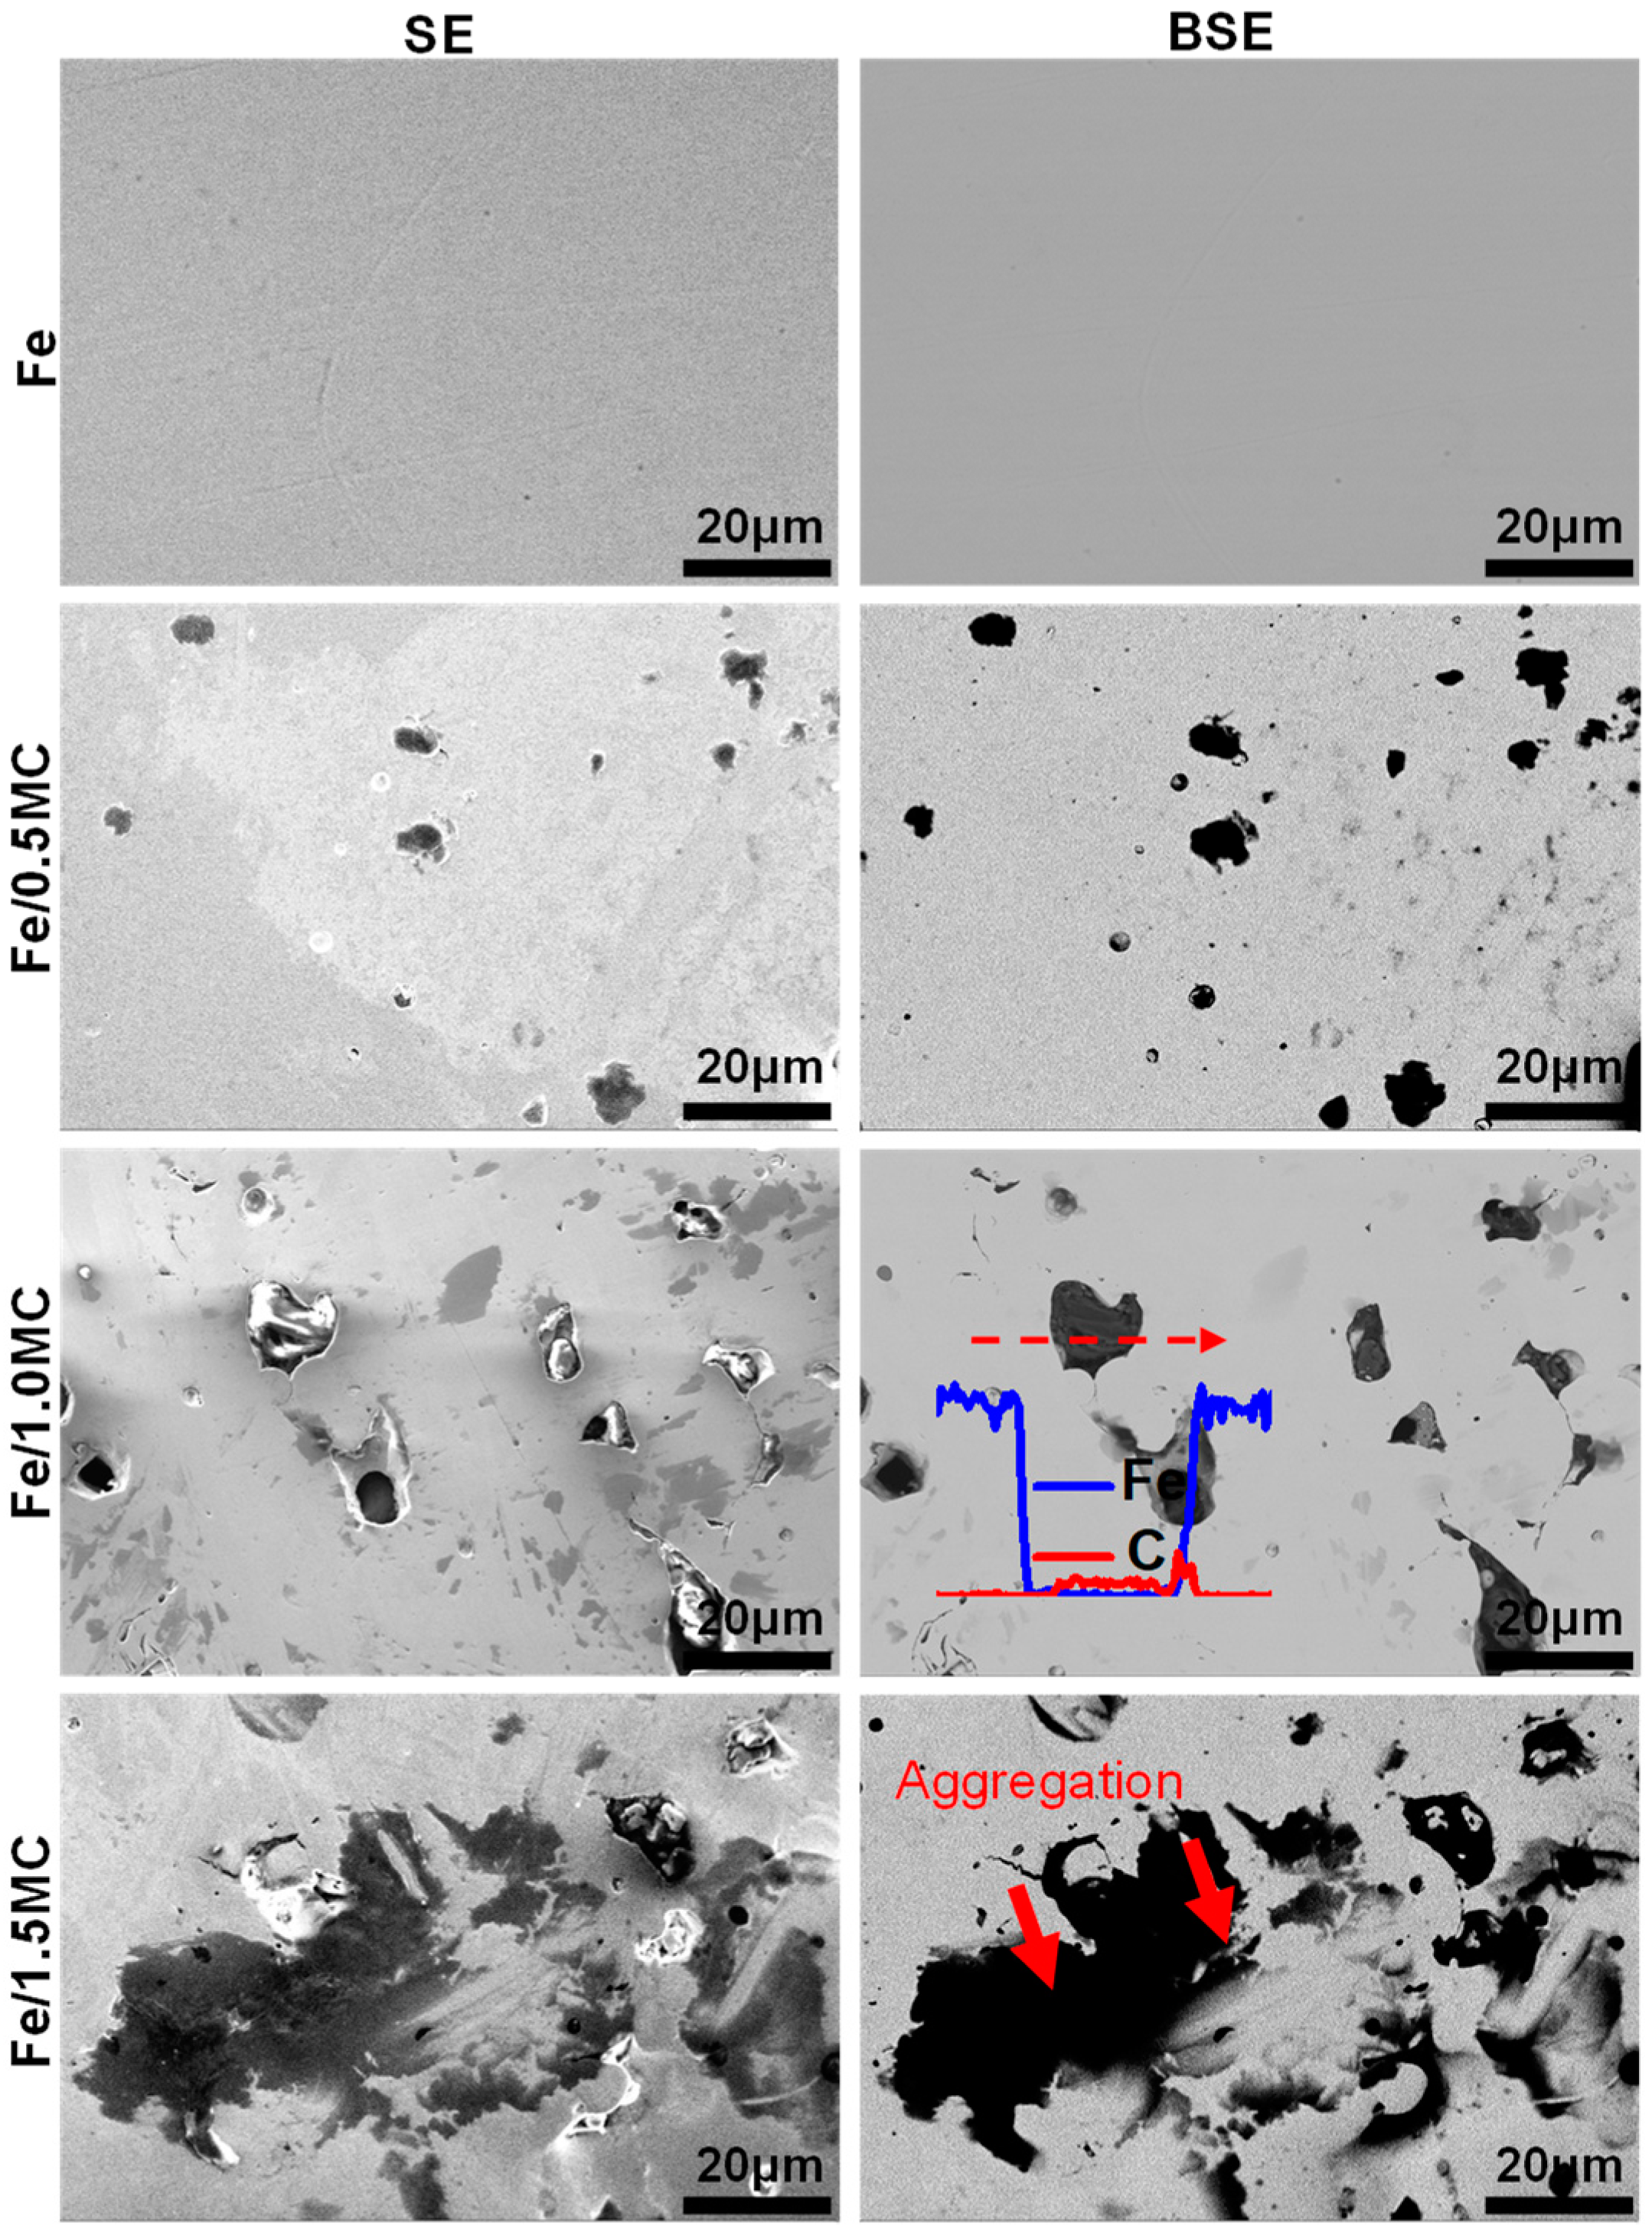
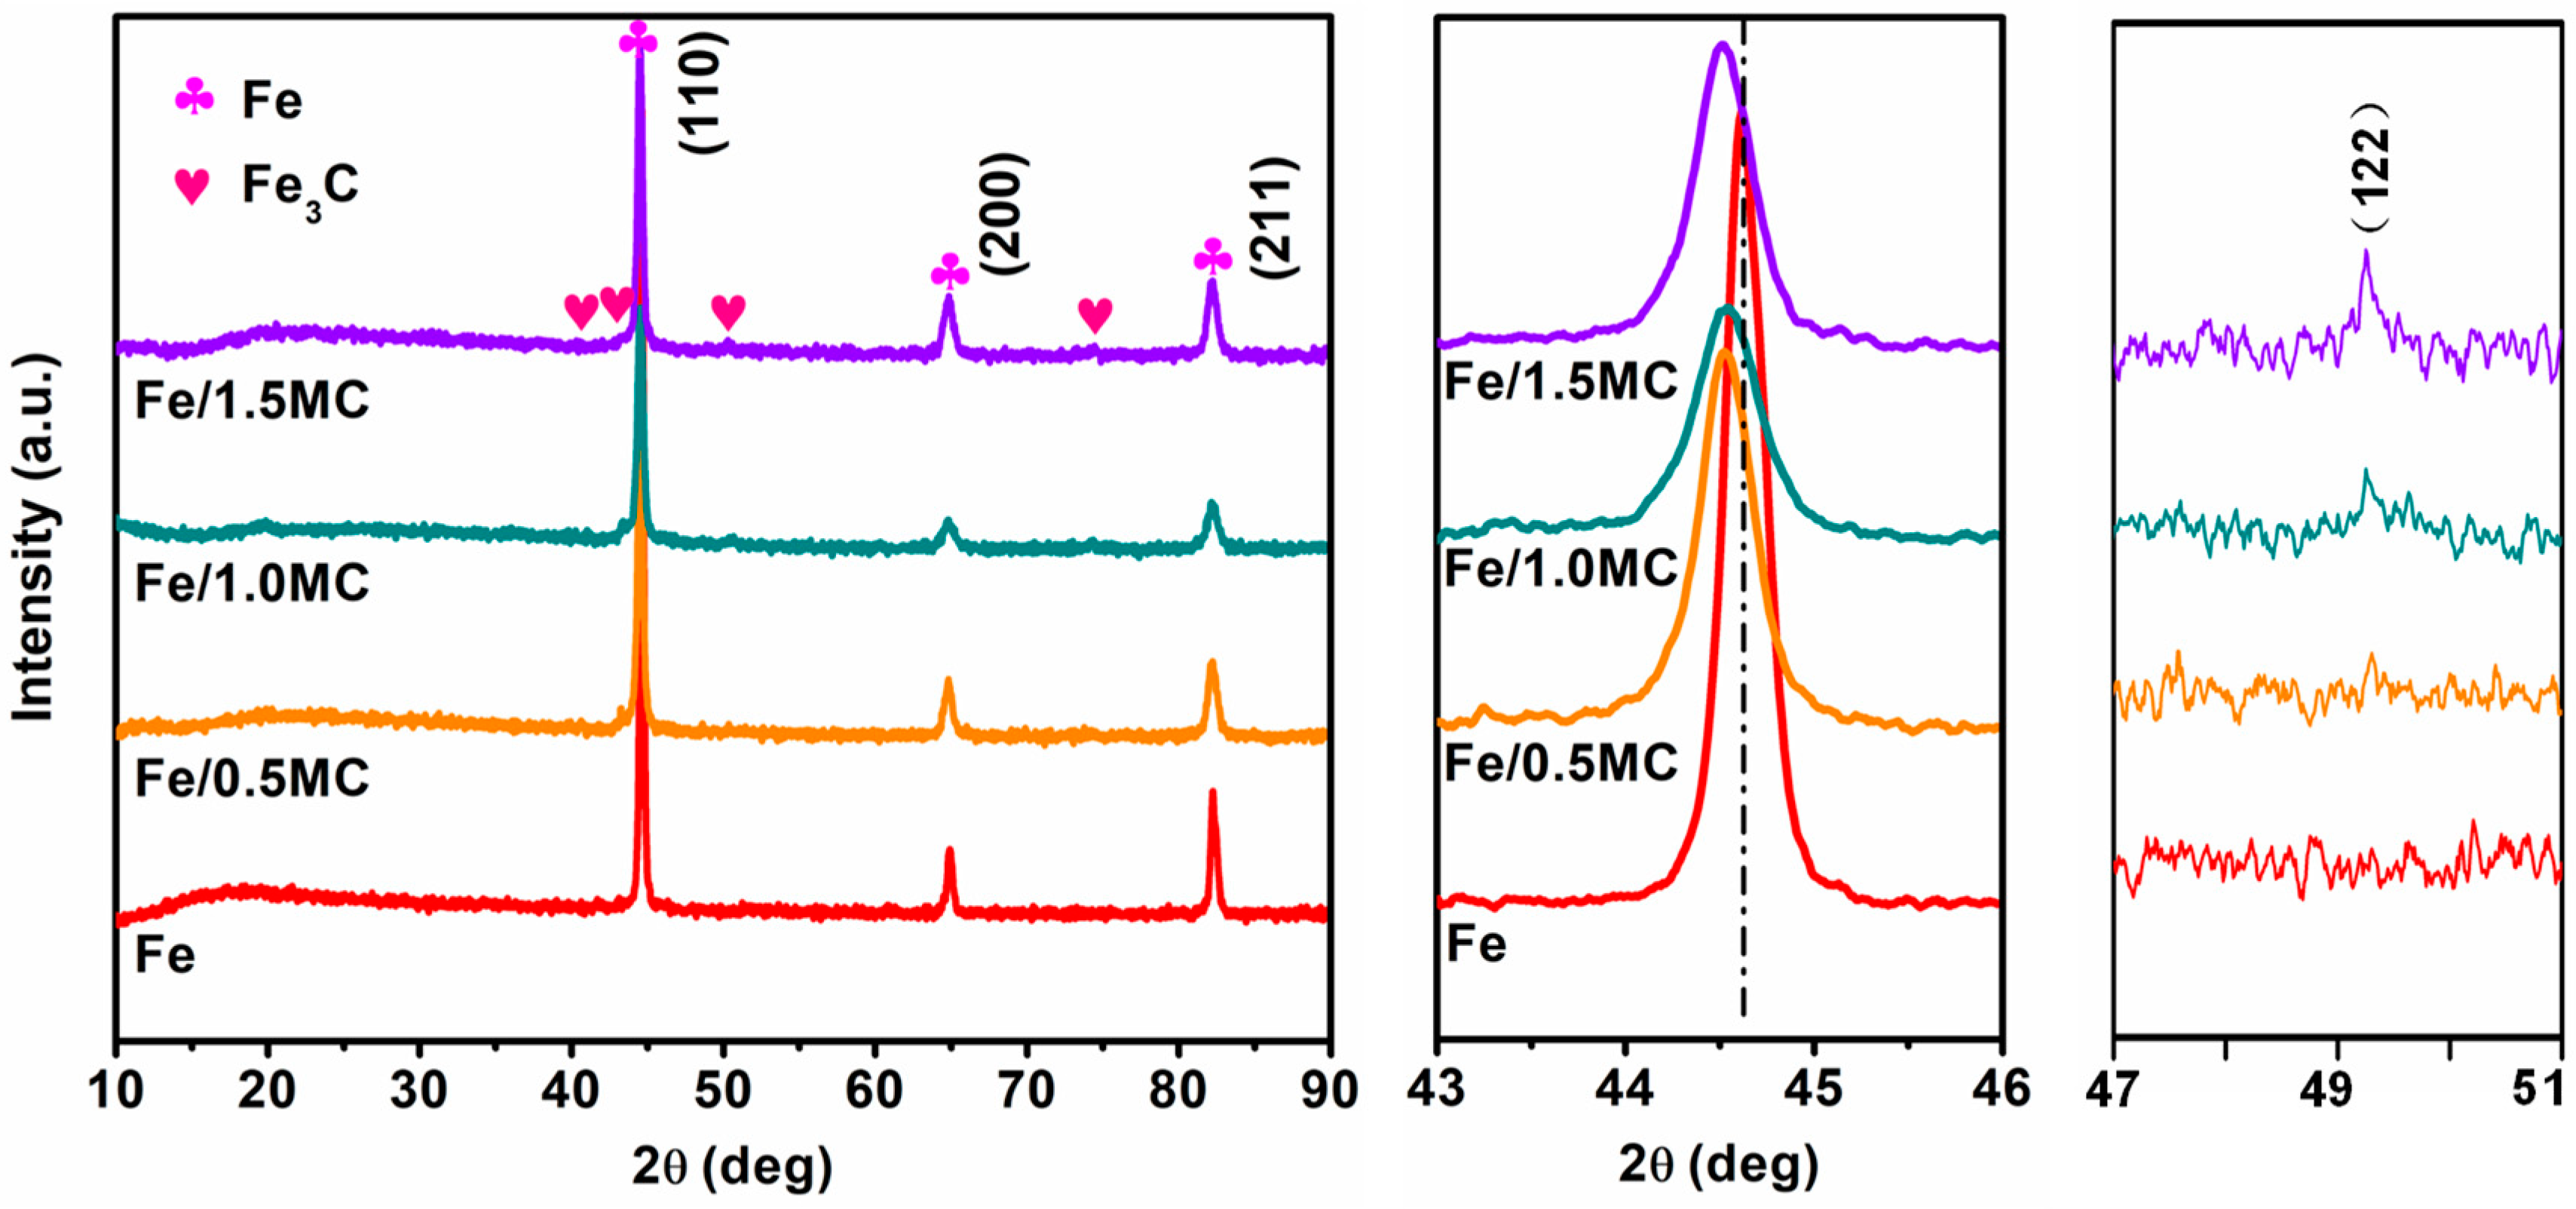
3.1. Microstructure and Phase Composition

The microstructure of Fe and Fe/MC composites were studied using SEM in secondary electron (SE) and back-scattered (BSE) mode, as presented in Figure 2. The SE model was usually adopted to study the topographic contrast, while the BSE model was favorable to observe the distribution of different phases. It could be seen that the as-built Fe part achieved an extremely high densification rate, without obvious cracks or pores. For Fe/0.5MC and Fe/1.0MC composites, BSE images showed that a small number of black particles were homogeneously located in the matrix. The EDS line-scan results confirmed that these particles belonged to MC. Meanwhile, the SE images also revealed that some pores appeared around the incorporated MC particles, indicating that the incorporation of MC reduced the densification rate of as-built parts. With MC further increasing to 1.5 wt.%, they aggregated into large-scale clusters, as marked by the arrows.
The phase compositions of Fe and Fe/MC composites were investigated by XRD, with collected spectrum presented in Figure 3. The body-centered cubic α-Fe phase (JCPDS No. 06-0696) with (110), (200) and (211) planes was determined in all parts. For Fe/MC composites, an extremely weak peak corresponding to Fe3C phase (JCPDS No. 761877) was determined, whereas no obvious peaks corresponding to C phase were collected. It was speculated that partial C dissolved in α-Fe, thus forming the Fe3C phase [30]. Besides, a close observation revealed that the primary peak in α-Fe in Fe/MC composites slightly shifted to a low location, which could be ascribed to the lattice distortion caused by the solid solution of the C atom [31,32].

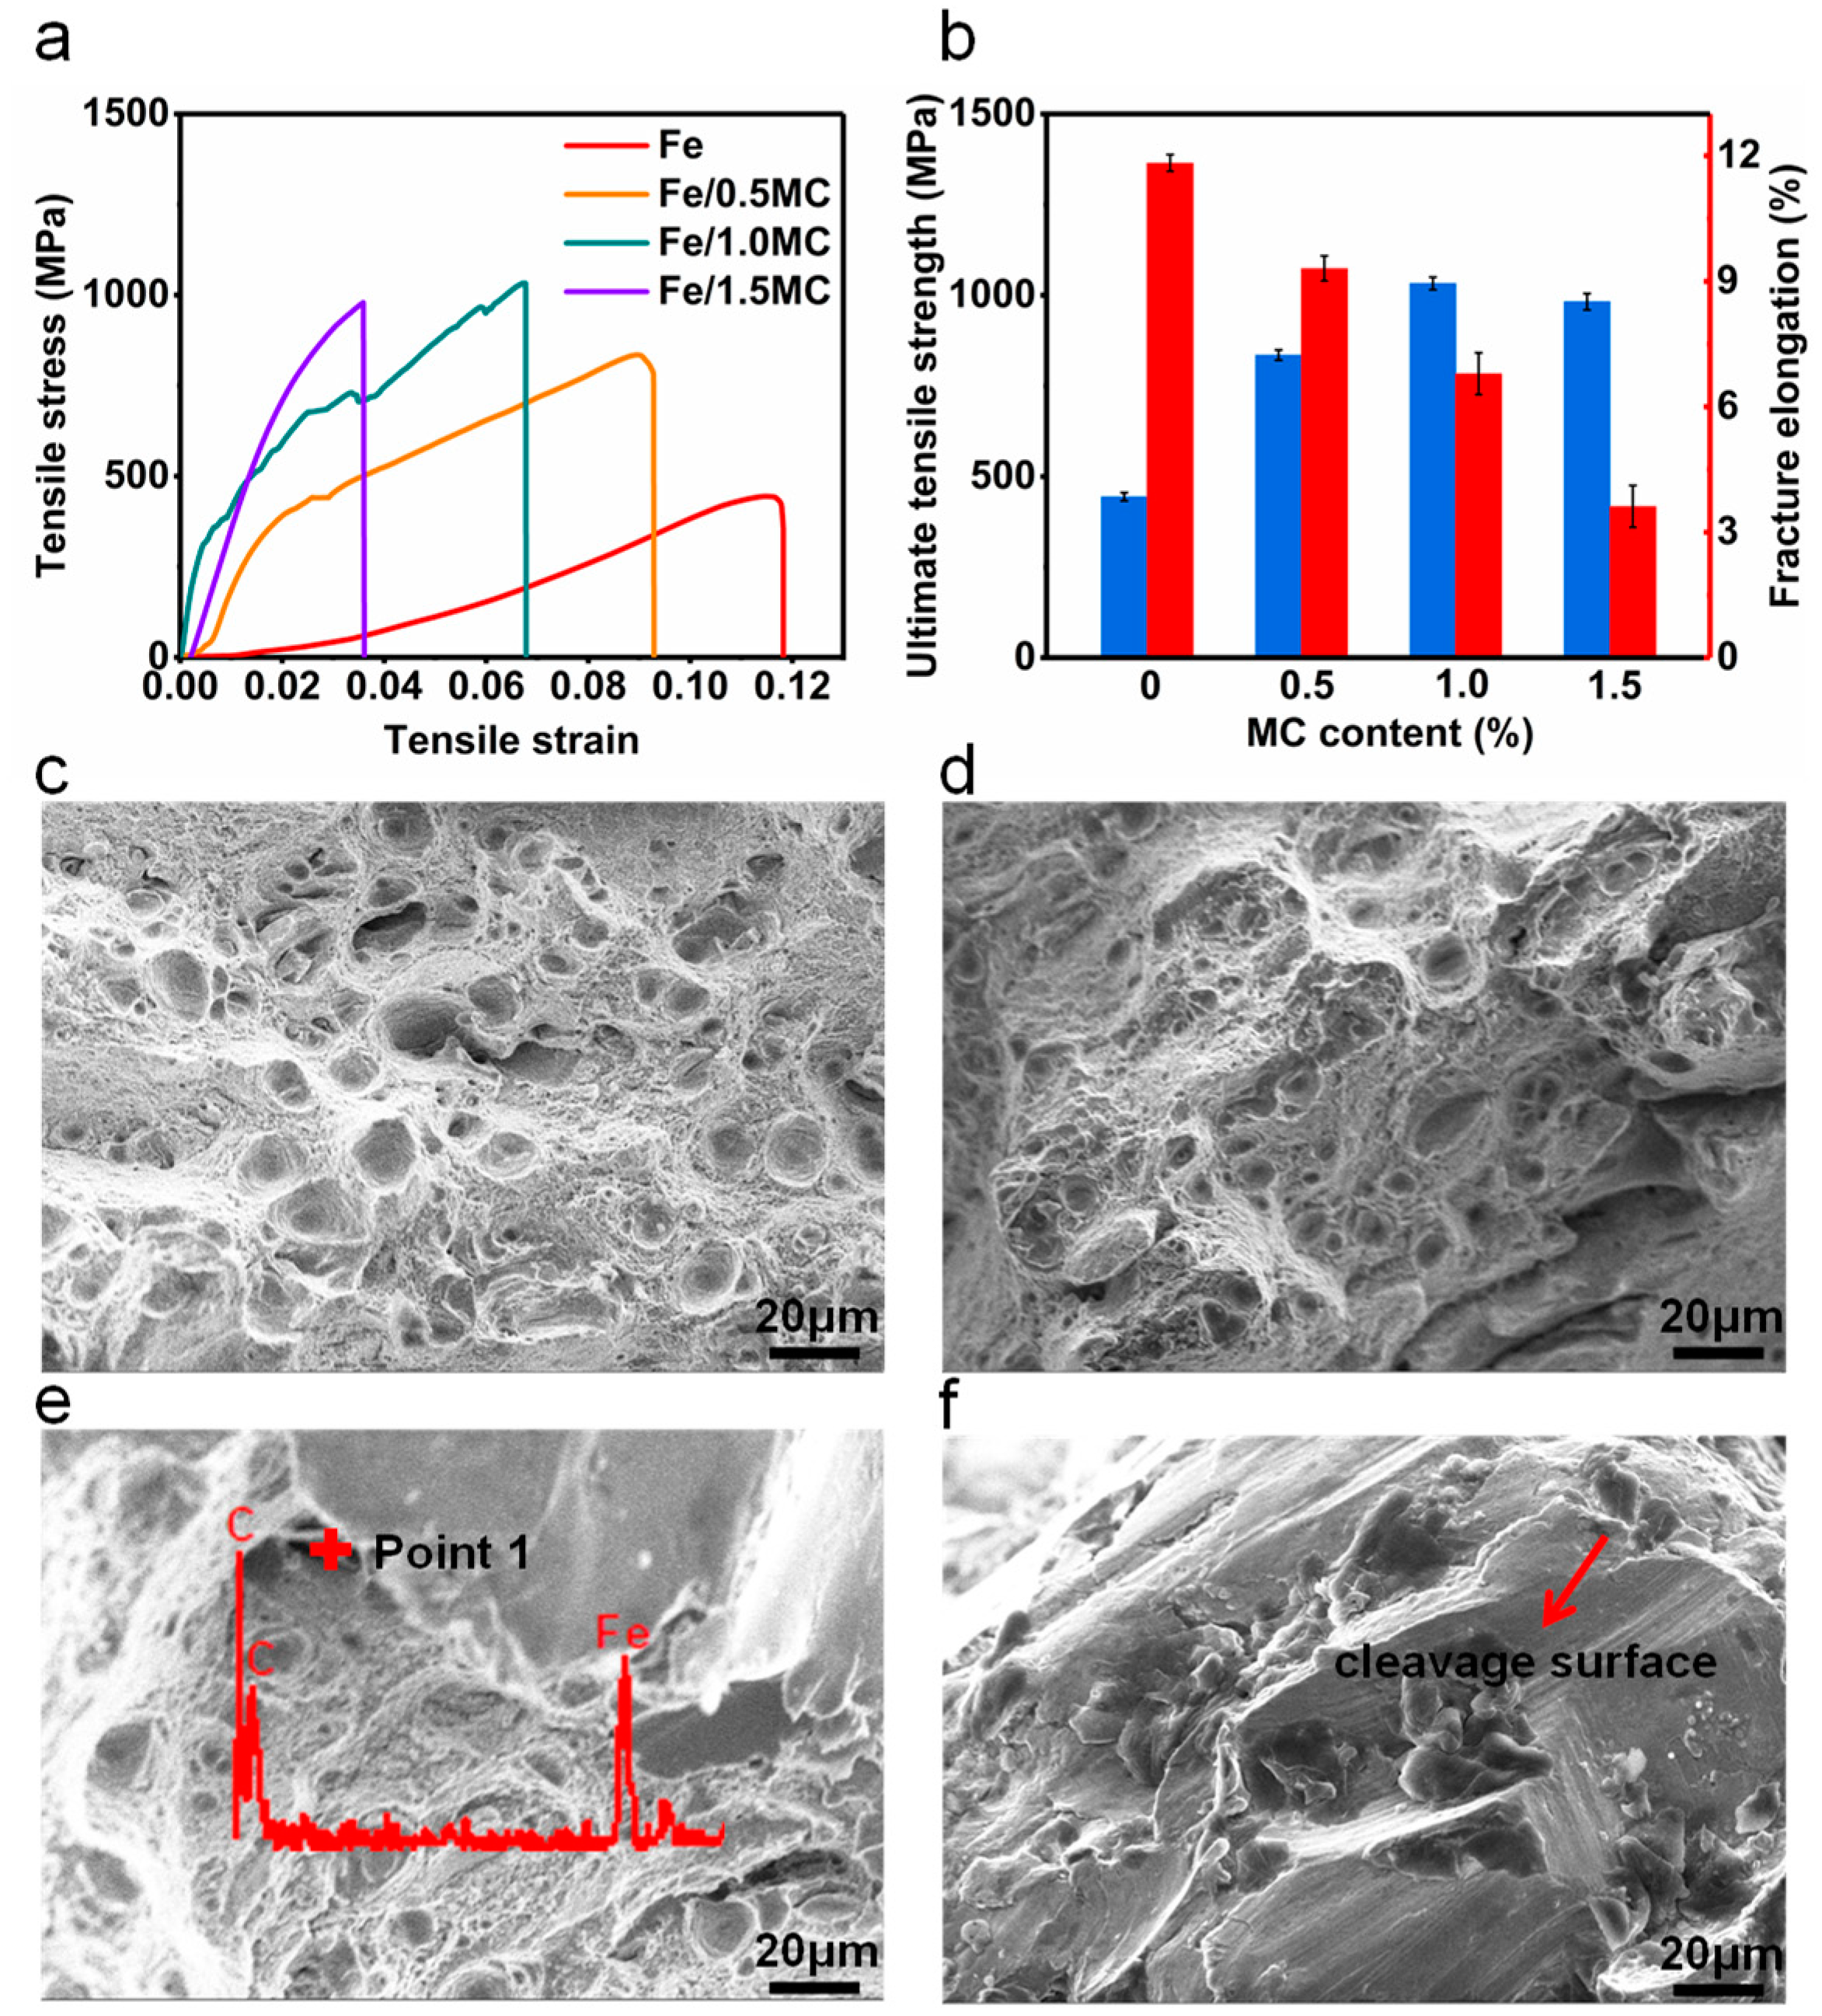
3.2. Mechanical Properties

The typical tensile stress–strain curves of Fe and Fe/MC composites were presented in Figure 4a. As seen from the curves, the peak stresses of Fe/MC composites were obviously larger than that of Fe. The tensile strength and elongation derived from the stress–strain curves were displayed in Figure 4b. For Fe, the tensile strength was 442.3 ± 11.1 MPa and elongation was 11.8% ± 0.2%. With MC upper reaching 1.0 wt.%, the tensile strength was gradually enhanced to 1032.9 ± 17.3 MPa, while the elongation was reduced to 6.8% ± 0.5%. However, after further increasing MC to 1.5 wt.%, the mechanical properties were decreased slightly, with tensile strength and elongation reducing to 982.4 ± 22.6 and 3.6% ± 0.5%, respectively. In fact, micro defects appeared in the matrix of Fe/1.5MC due to the agglomerates of MC, resulting in a weak interface and poor stress transfer. Thus, the tensile strength was decreased. The fracture surface morphologies of Fe and Fe/MC composites were presented in Figure 4c–f. It could be seen that Fe presented a typical ductile fracture covered with numerous dimples. With the addition of MC, the number of dimples gradually decreased, which represented a decrease in ductility. The fracture morphologies of Fe/0.5MC and Fe/1.0MC showed a small amount of cleavage planes, indicating a mixed ductile–brittle fracture. Besides, a few MC particles were observed on the tensile fracture surfaces of Fe/1.0MC composites (as marked by red arrows in Figure 4f). As for Fe/1.5MC, the fracture surface was covered by cleavage planes, indicating a typical brittle fracture. It was deduced that a high MC content prevented the large-scale plastic deformation of the matrix, thus reducing the ductility [33].

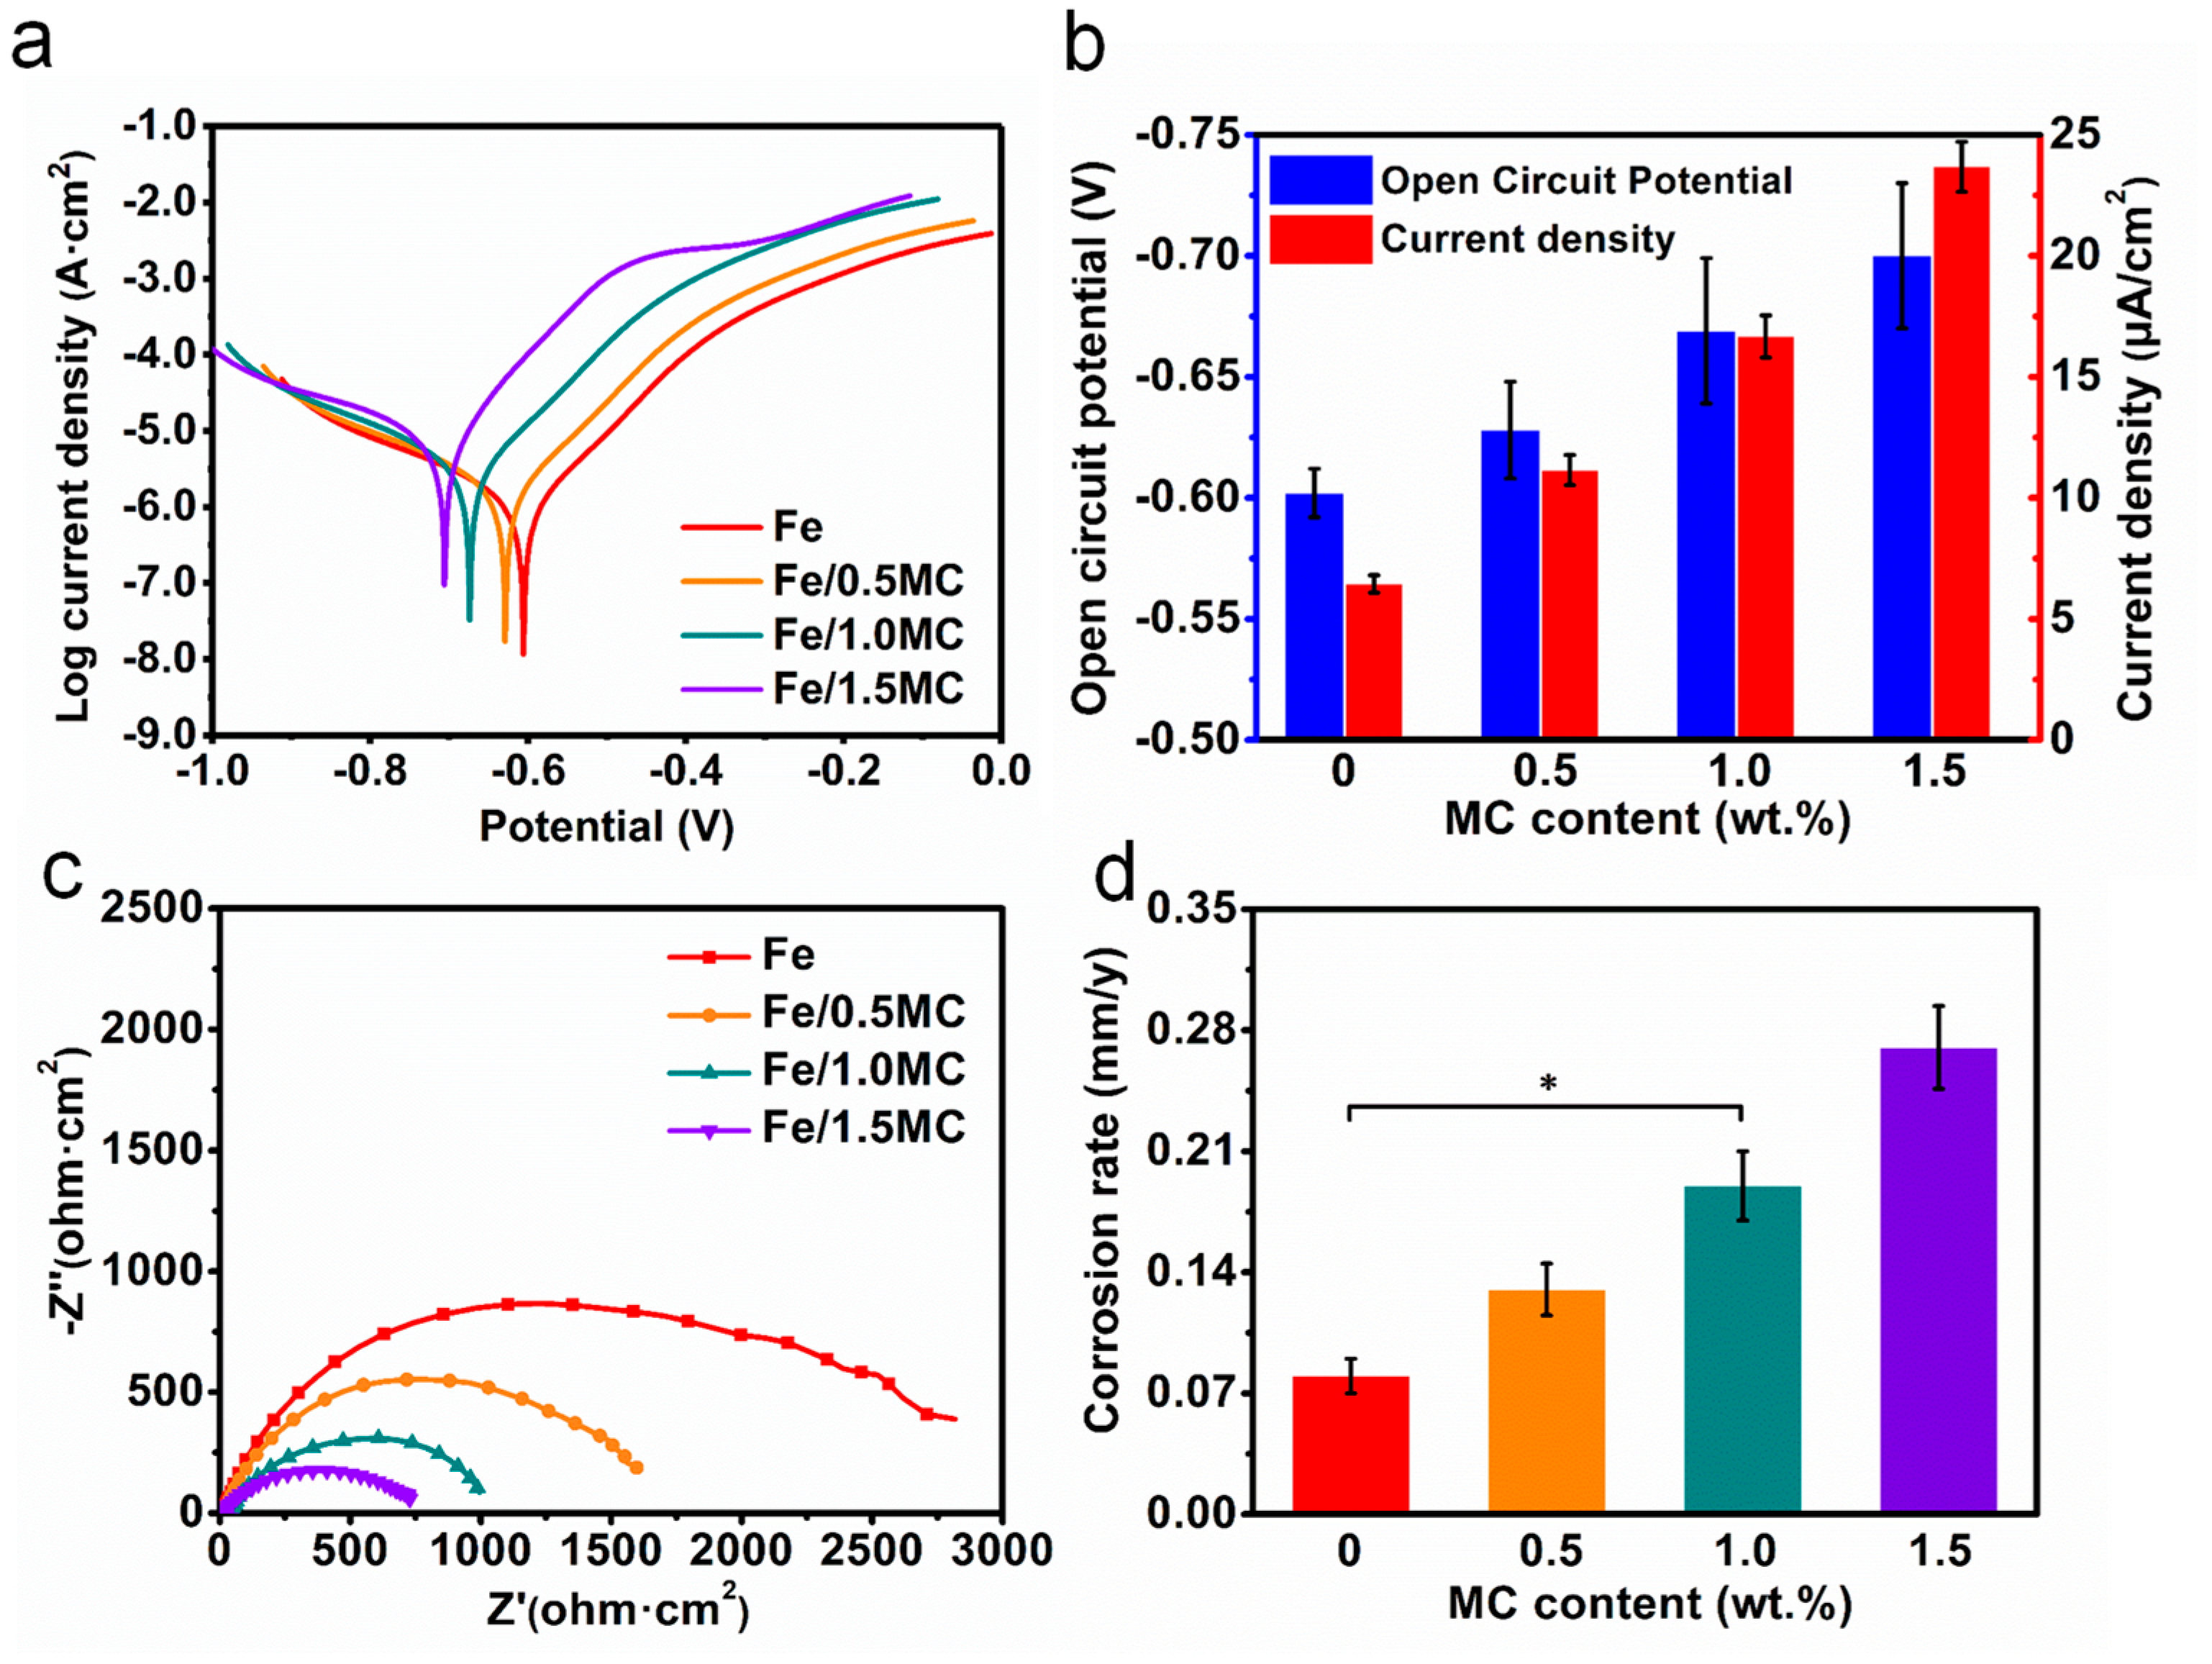
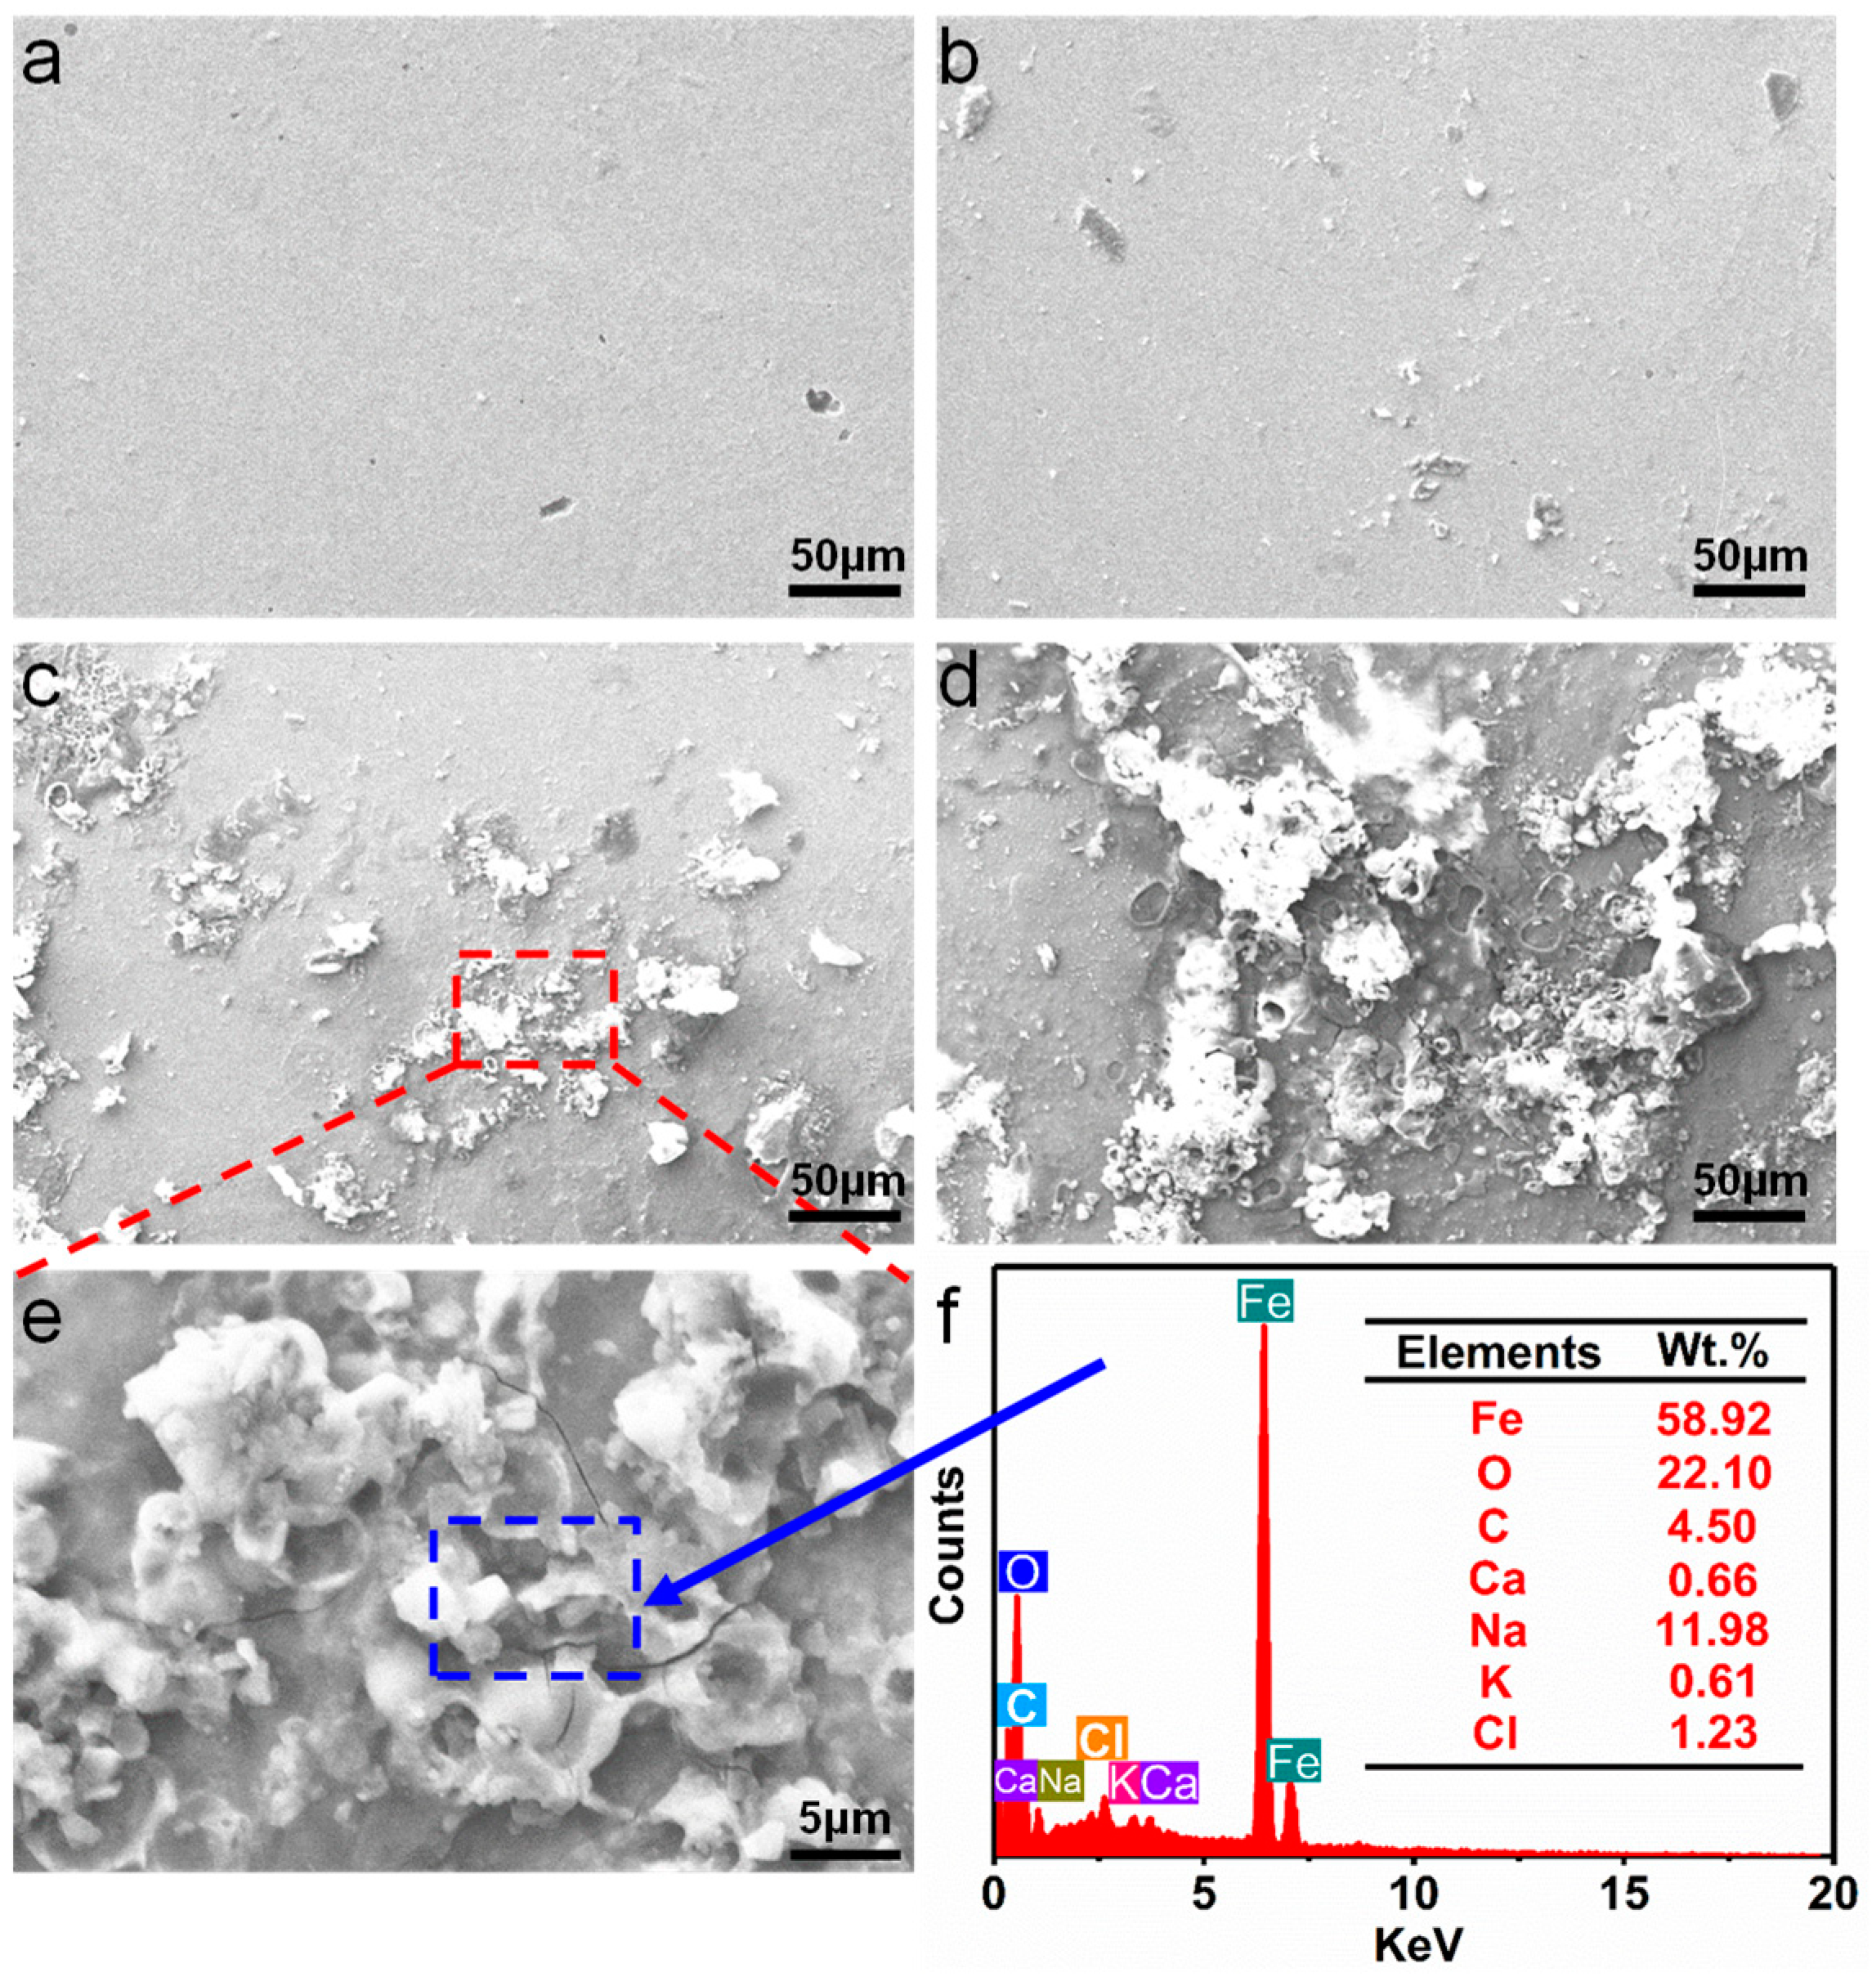
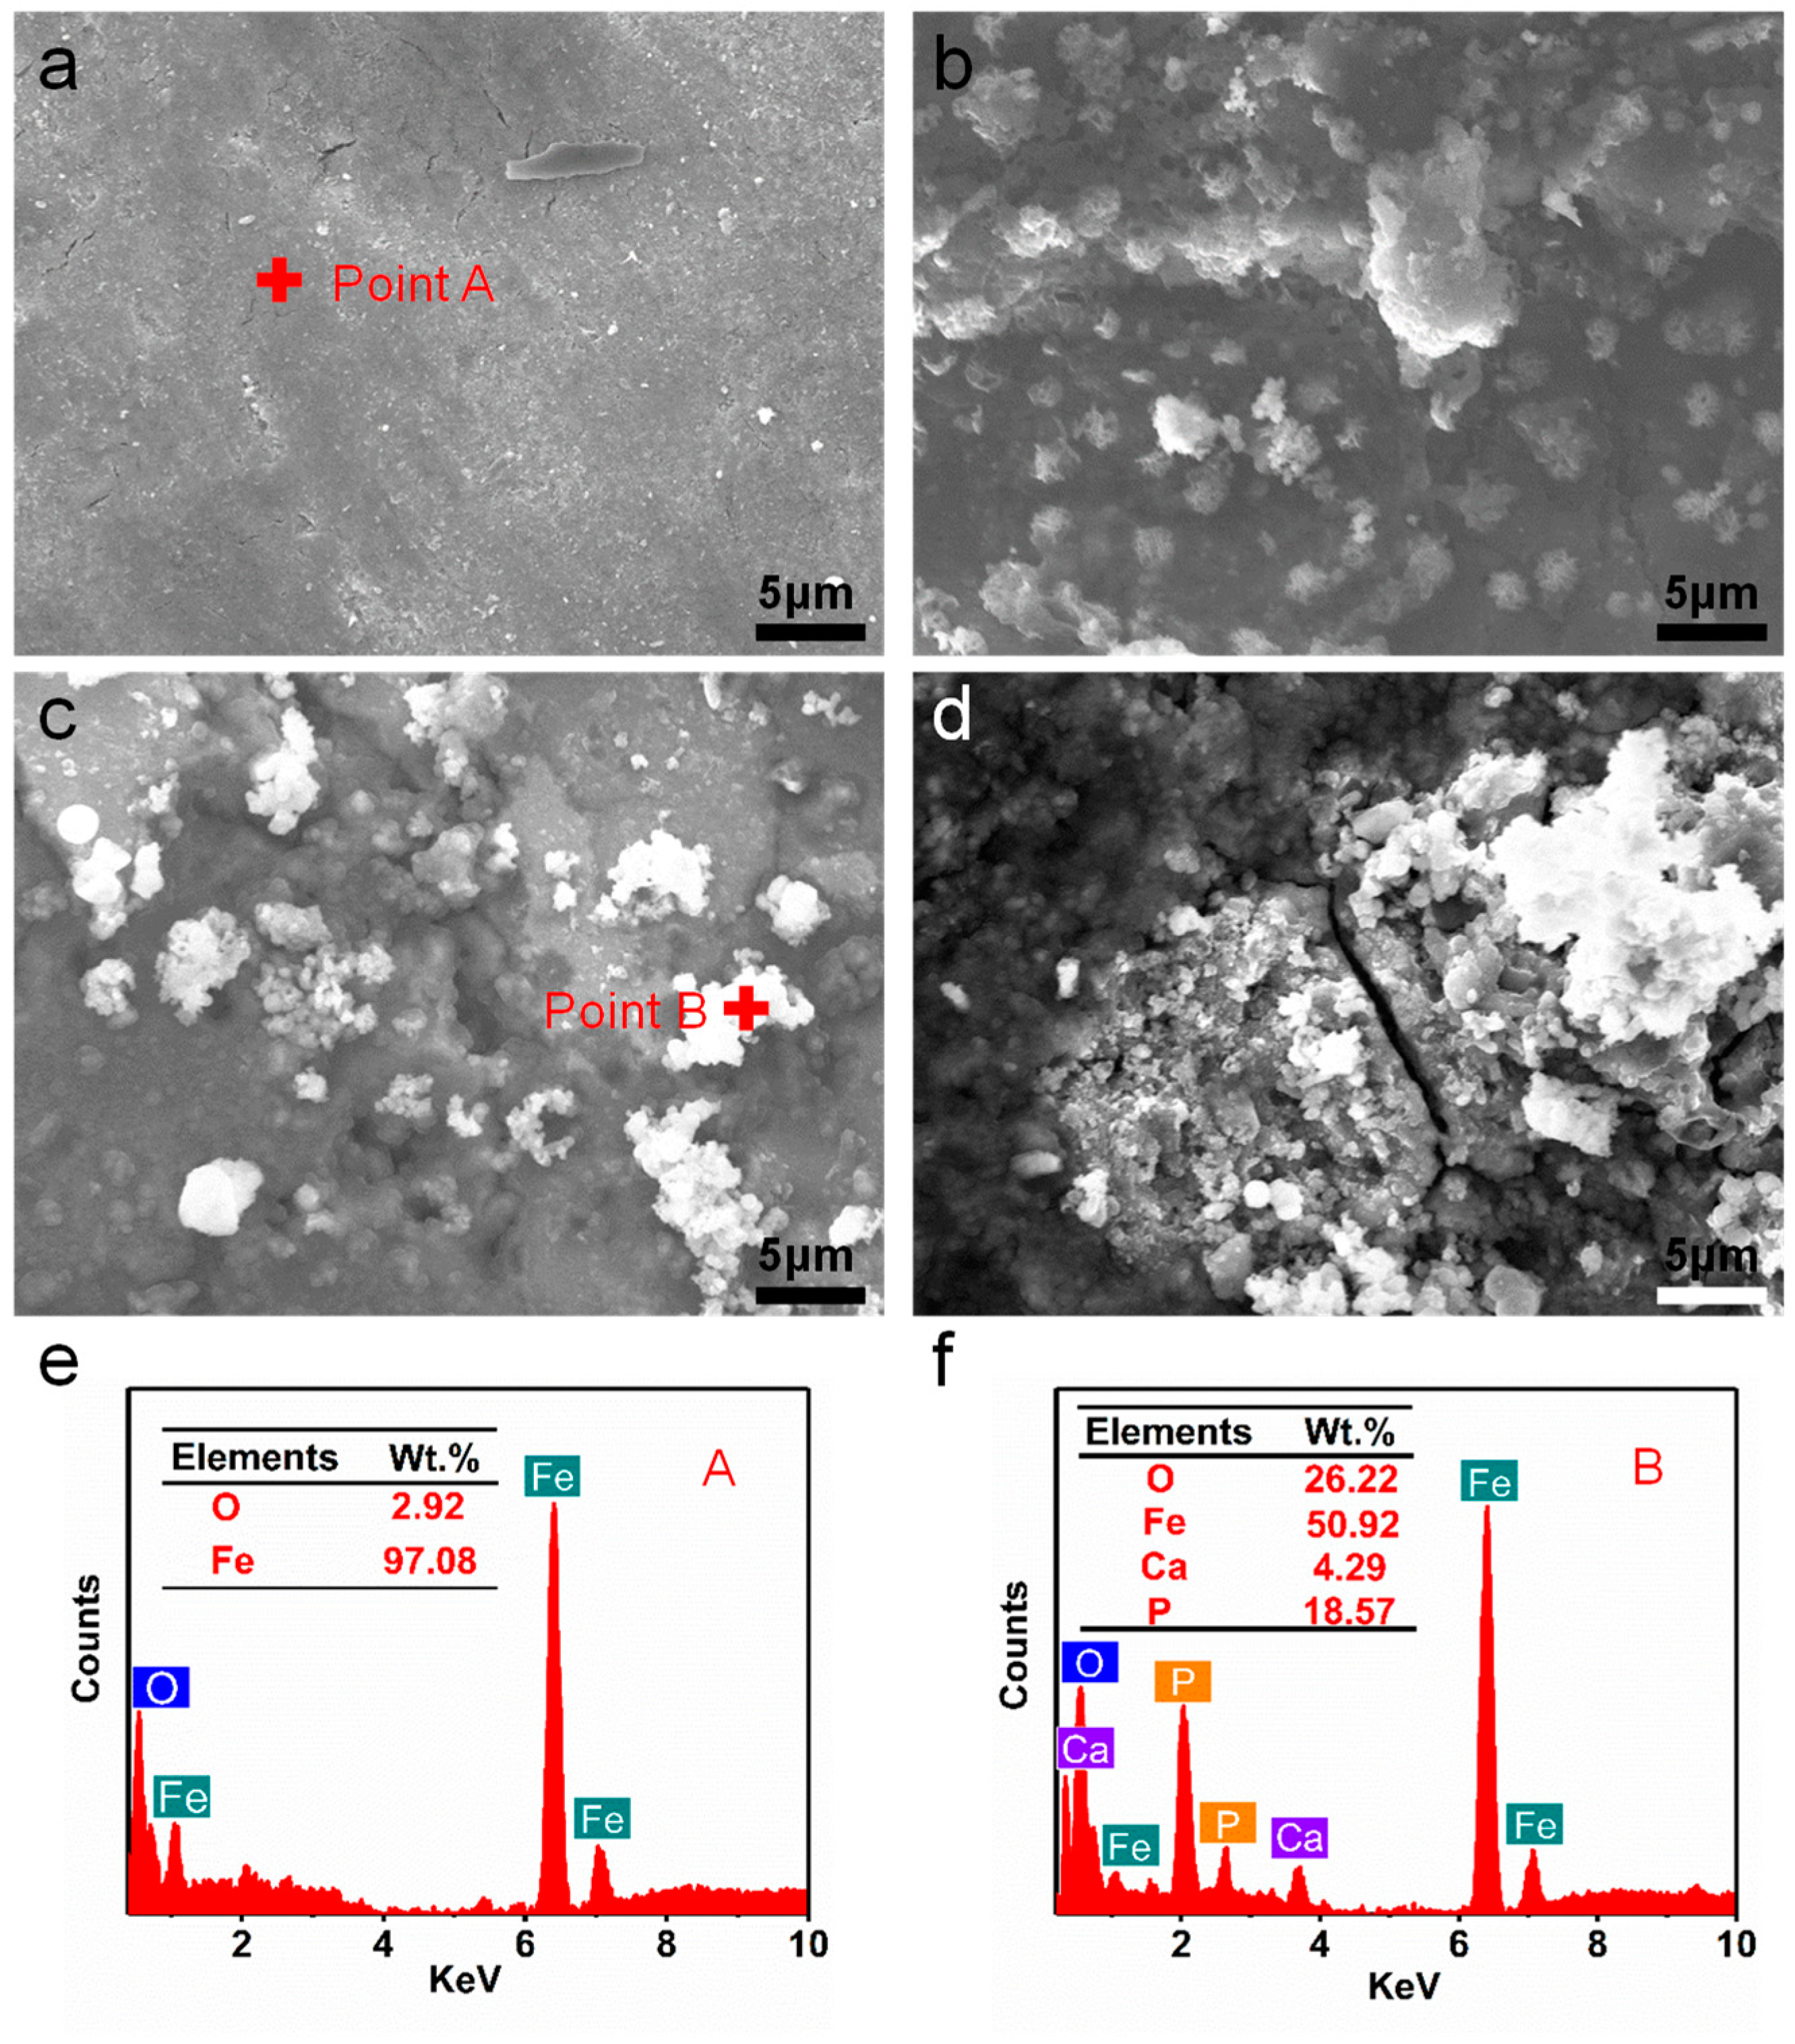
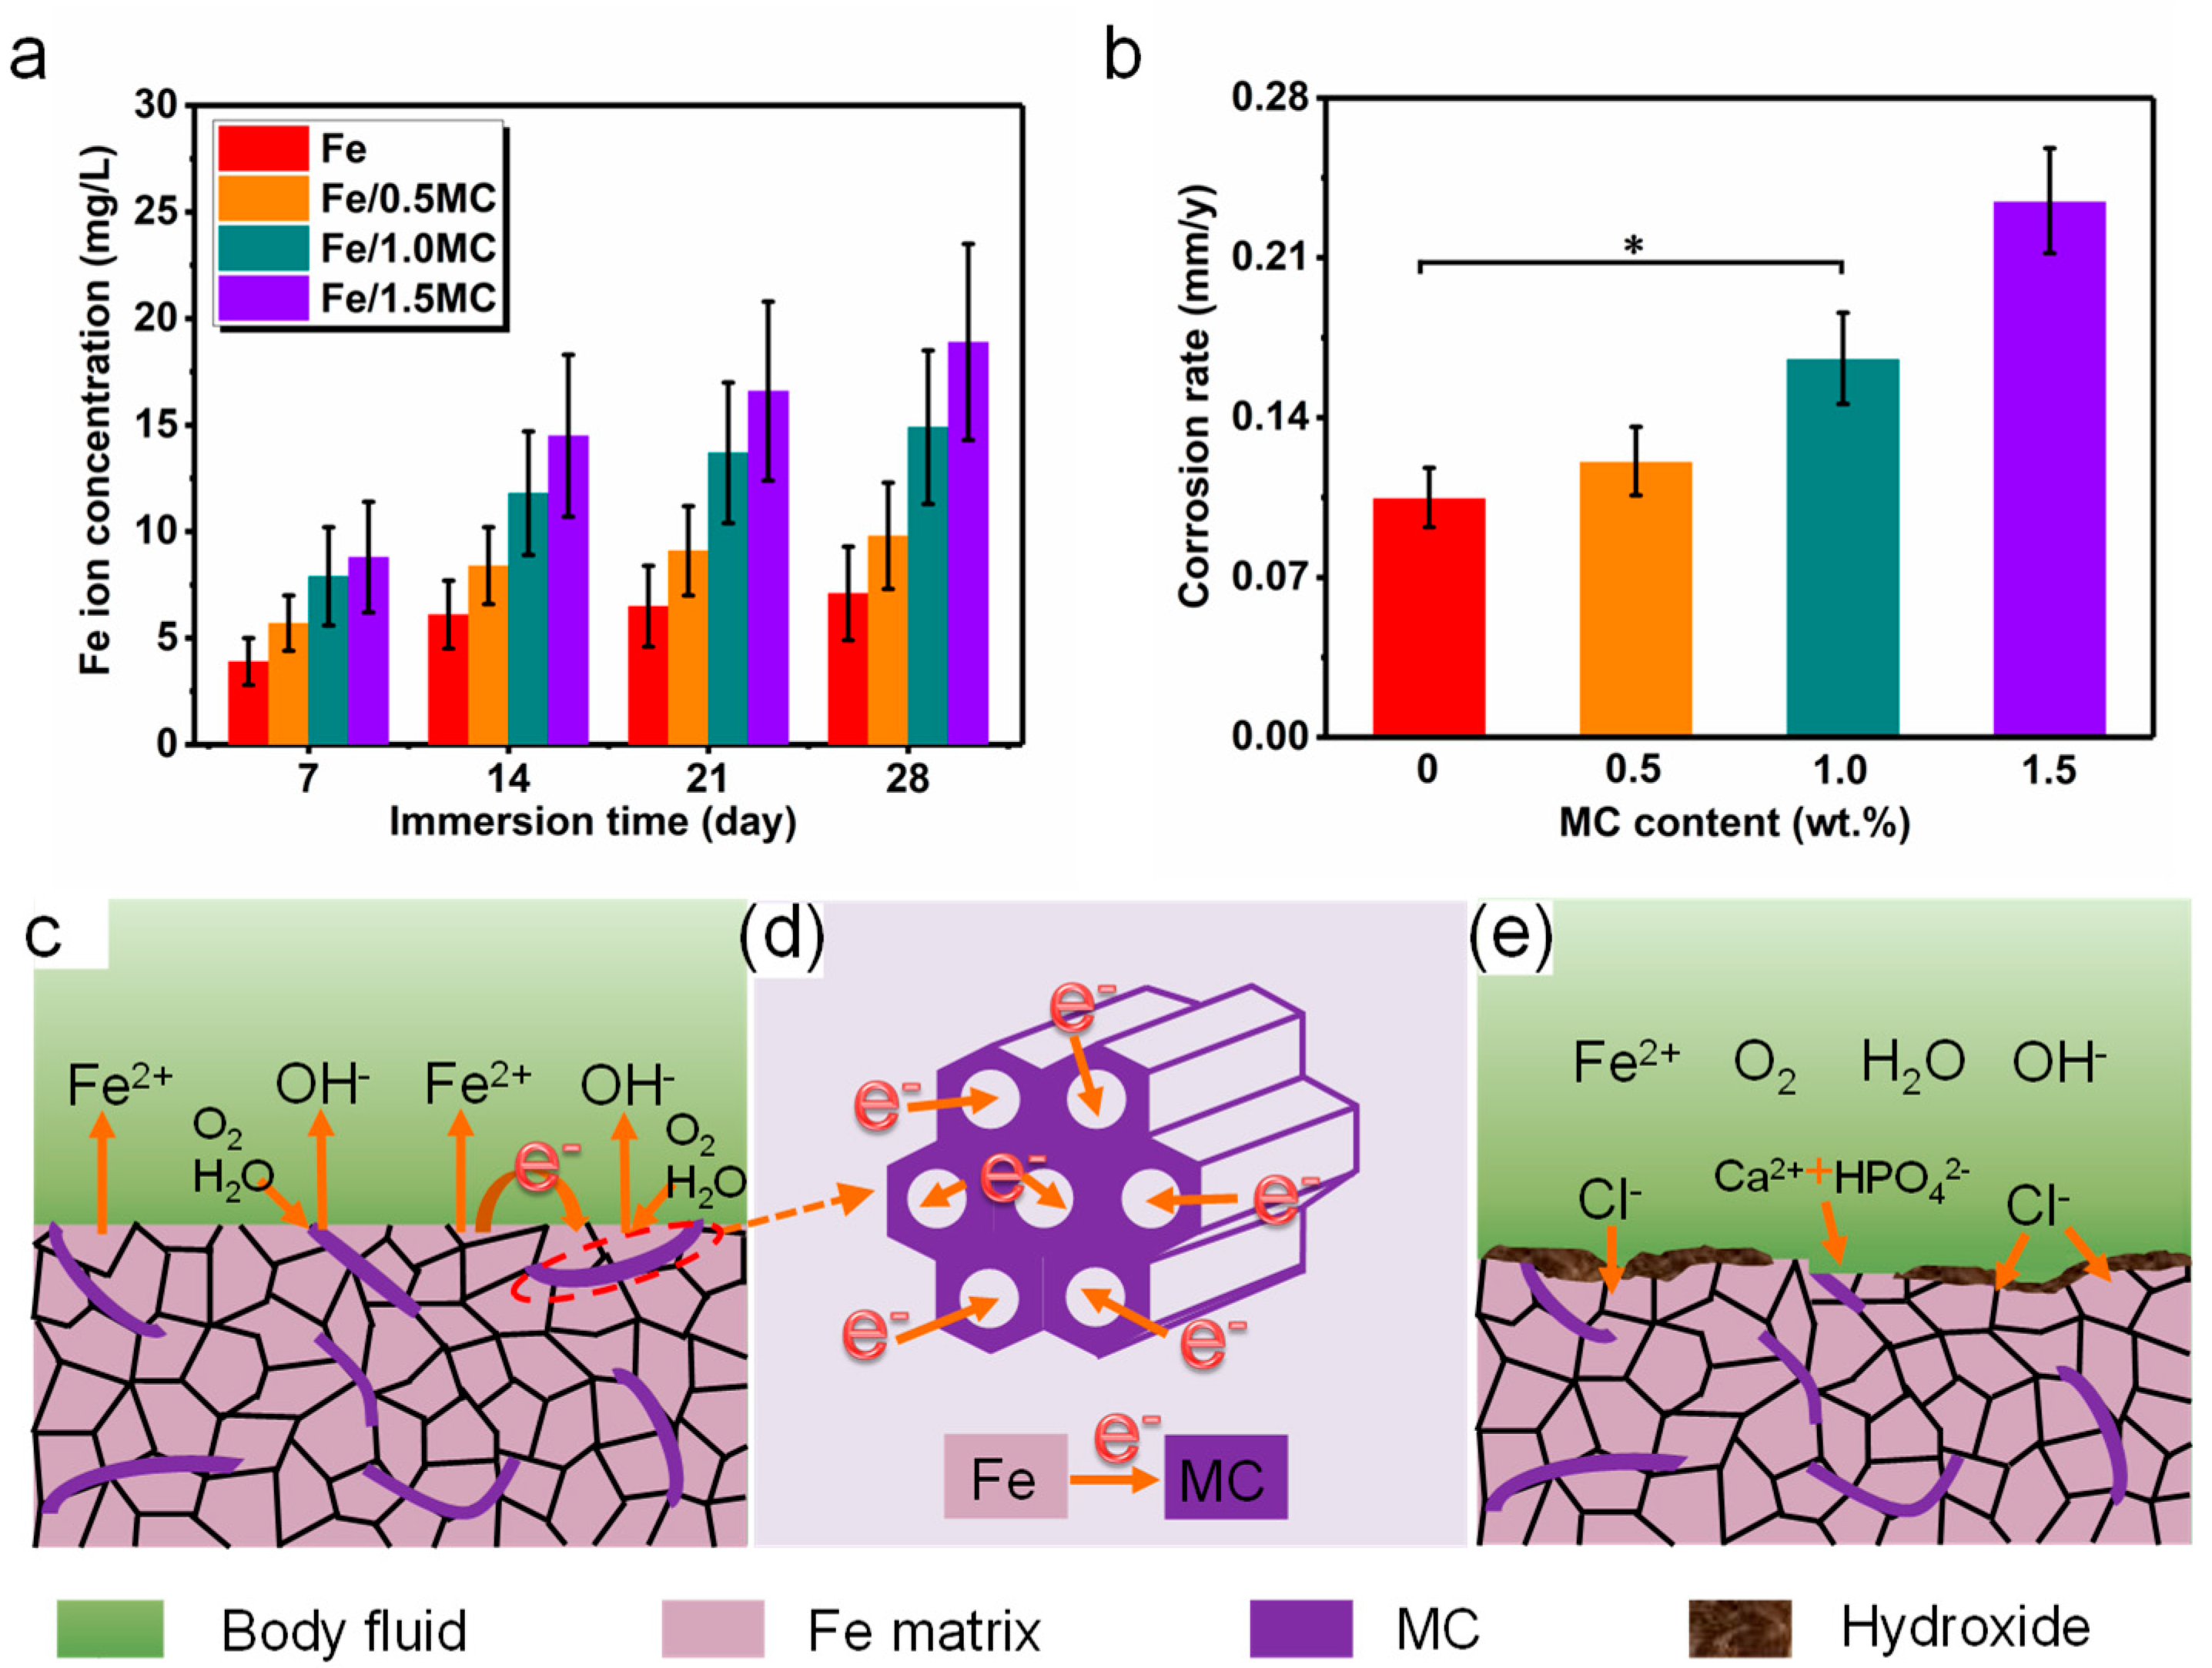
3.3. Degradation Behavior

The typical polarization curves of Fe and Fe/MC composites were depicted in Figure 5a. The derived Ecorr and Icorr using Tafel extrapolation were shown in Figure 5b. It was obvious that the Ecorr was greatly decreased with MC increasing. Specifically, the Ecorr was −0.60 ± 0.01 V for Fe, and −0.67 ± 0.03 V for Fe/1.0MC. Meanwhile, the Icorr increased from 6.45 ± 0.36 μA/cm2 for Fe to 23.6 ± 0.9 μA/cm2 for Fe/1.5MC. In the Nyquist plots (Figure 5c), the change in the impedance imaginary part (z") was expressed as a function of the impedance real part (z′), which exhibited series semicircles. It was well known that the diameter of the high-frequency capacitive loop represented the polarization resistance [34,35]. Obviously, the diameters of semicircles gradually decreased with MC increasing, indicating that their corrosion resistance turned weak. The corrosion rate was also calculated from electrochemical parameters, as shown in Figure 5d. The Fe/1.0MC composite showed a significantly accelerated corrosion rate of 0.19 ± 0.02 mm/year as compared to Fe.
The SEM images of the corroded surface after polarization test were presented in Figure 6. Clearly, Fe exhibited an intact surface with few corrosion products (Figure 6a). For the Fe/0.5MC composite, a few corrosion products appeared. As a comparison, Fe/1.0MC and Fe/1.5MC showed a large amount of corrosion product, which should be Fe oxides, as confirmed by EDS analysis (Figure 6f). This indicated that enhanced corrosion occurred for Fe/1.0MC and Fe/1.5MC. During potentiodynamic polarization, the external driving force was applied to dissolve the Fe matrix. In this condition, the galvanic interactions between the Fe matrix and MC could be ignored. In fact, the introduction of MC created defects in the Fe matrix, as presented in Figure 2, which might be the major reason for the enhancement of electrochemical corrosion. [36,37].
Immersion tests have also been carried out to assess degradation performance from a long-term perspective. The degradation morphologies of Fe and Fe/MC samples after immersion for 21 d were displayed in Figure 7. Distinctly, a flat corrosion surface with a few local etch pits were observed on Fe, suggesting its slight local corrosion. The corrosion products were composed of Fe and O elements, suggesting that they were Fe oxide and hydroxide. The Fe/0.5MC composite exhibited different corrosion morphology with a small amount of precipitates appearing on the surface (Figure 7b). For the Fe/1.0MC composite, more corrosion product was observed. EDS analysis exhibited that the corrosion products were mainly composed of Fe, O, Ca and P, demonstrating the deposition of Ca-P compounds. For the Fe/1.5MC composite, however, the surface was covered with a heavy corrosion product with some obvious cracks, which demonstrated that the corrosion was significantly aggravated.
The Fe concentration in SBF at different soaking time was measured by ICP-AES, as presented in Figure 8a. It could be seen that Fe ion concentration increased, with the immersion time extending. For pure Fe, the released Fe ion concentration increased slowly from 3.9 ± 1.1 to 7.1 ± 2.3 mg/L during four different soaking cycles. After incorporating MC, the released Fe ion concentration increased significantly, indicating an increased degradation rate. In particular, the Fe ion concentration rose rapidly from 7.9 ± 2.2 mg/L at day 7 to 14.8 ± 3.6 mg/L at day 28 for the Fe/1.0MC composite. The degradation rate of Fe/MC composites basing on immersion tests were shown in Figure 8b. Specifically, Fe exhibited a relatively slow degradation rate of 0.09 ± 0.01 mm/year. In contrast, Fe/1.0MC showed a significantly accelerated degradation rate of 0.24 ± 0.03 mm/year. A previous research reported that Zn-based bone implants exhibited a corrosion rate of 0.18 mm/year, while Mg-based bone implants exhibited a corrosion rate of 1.7 mm/year. In fact, the bone healing period is usually 3–6 months, which requires a degradation rate of 0.2–0.5 for bone implants. Thus, it seems that the Fe/1.5MC presented a more suitable degradation rate as bone implants.
In this work, the electrochemical tests and immersion tests indicated that MC enhanced the degradation rate of Fe. As compared with the electrochemical test, the immersion test with a long period was able to more accurately characterize its degradation behavior [38]. The corrosion mechanism of the Fe/MC composite in body fluid was shown in Figure 8c–e. At the initial corrosion stage, the grain boundaries encountered galvanic corrosion due to the potential difference between grains and grain boundaries [39]. The Fe matrix was gradually dissolved into Fe ions by
Fe → Fe2+ + 2e-
Electrons raised from the dissolution of Fe matrix moved to MC, where cathodic reaction occurred as follows
2H2O + O2 + 4e-→ 4OH-
Significantly, MC possessed a mesoporous structure with a large specific surface area, as presented in Figure 8d, which considerably increased the area ratio between the cathode and anode. In this condition, the consumption of anode was accelerated. In addition, MC also exhibited excellent conductivity, which reduced the charge transfer resistance and consequently increased the corrosion current [40]. Due to the enhanced galvanic corrosion, a large amount of corrosion product covered the matrix (Figure 8e), which was generated by the following equation [41]:
Fe2+ + 2OH- → Fe(OH)2
4Fe(OH)2 + O2 + H2O → 4Fe(OH)3
Fe(OH)2 + 2Fe(OH)3 → Fe3O4 + 4 H2O
Nevertheless, the aggressive chloride ion in the physiological environment was able to break through this corrosion product layer, making the corrosion of the iron matrix continue until the whole matrix was disintegrated [42].

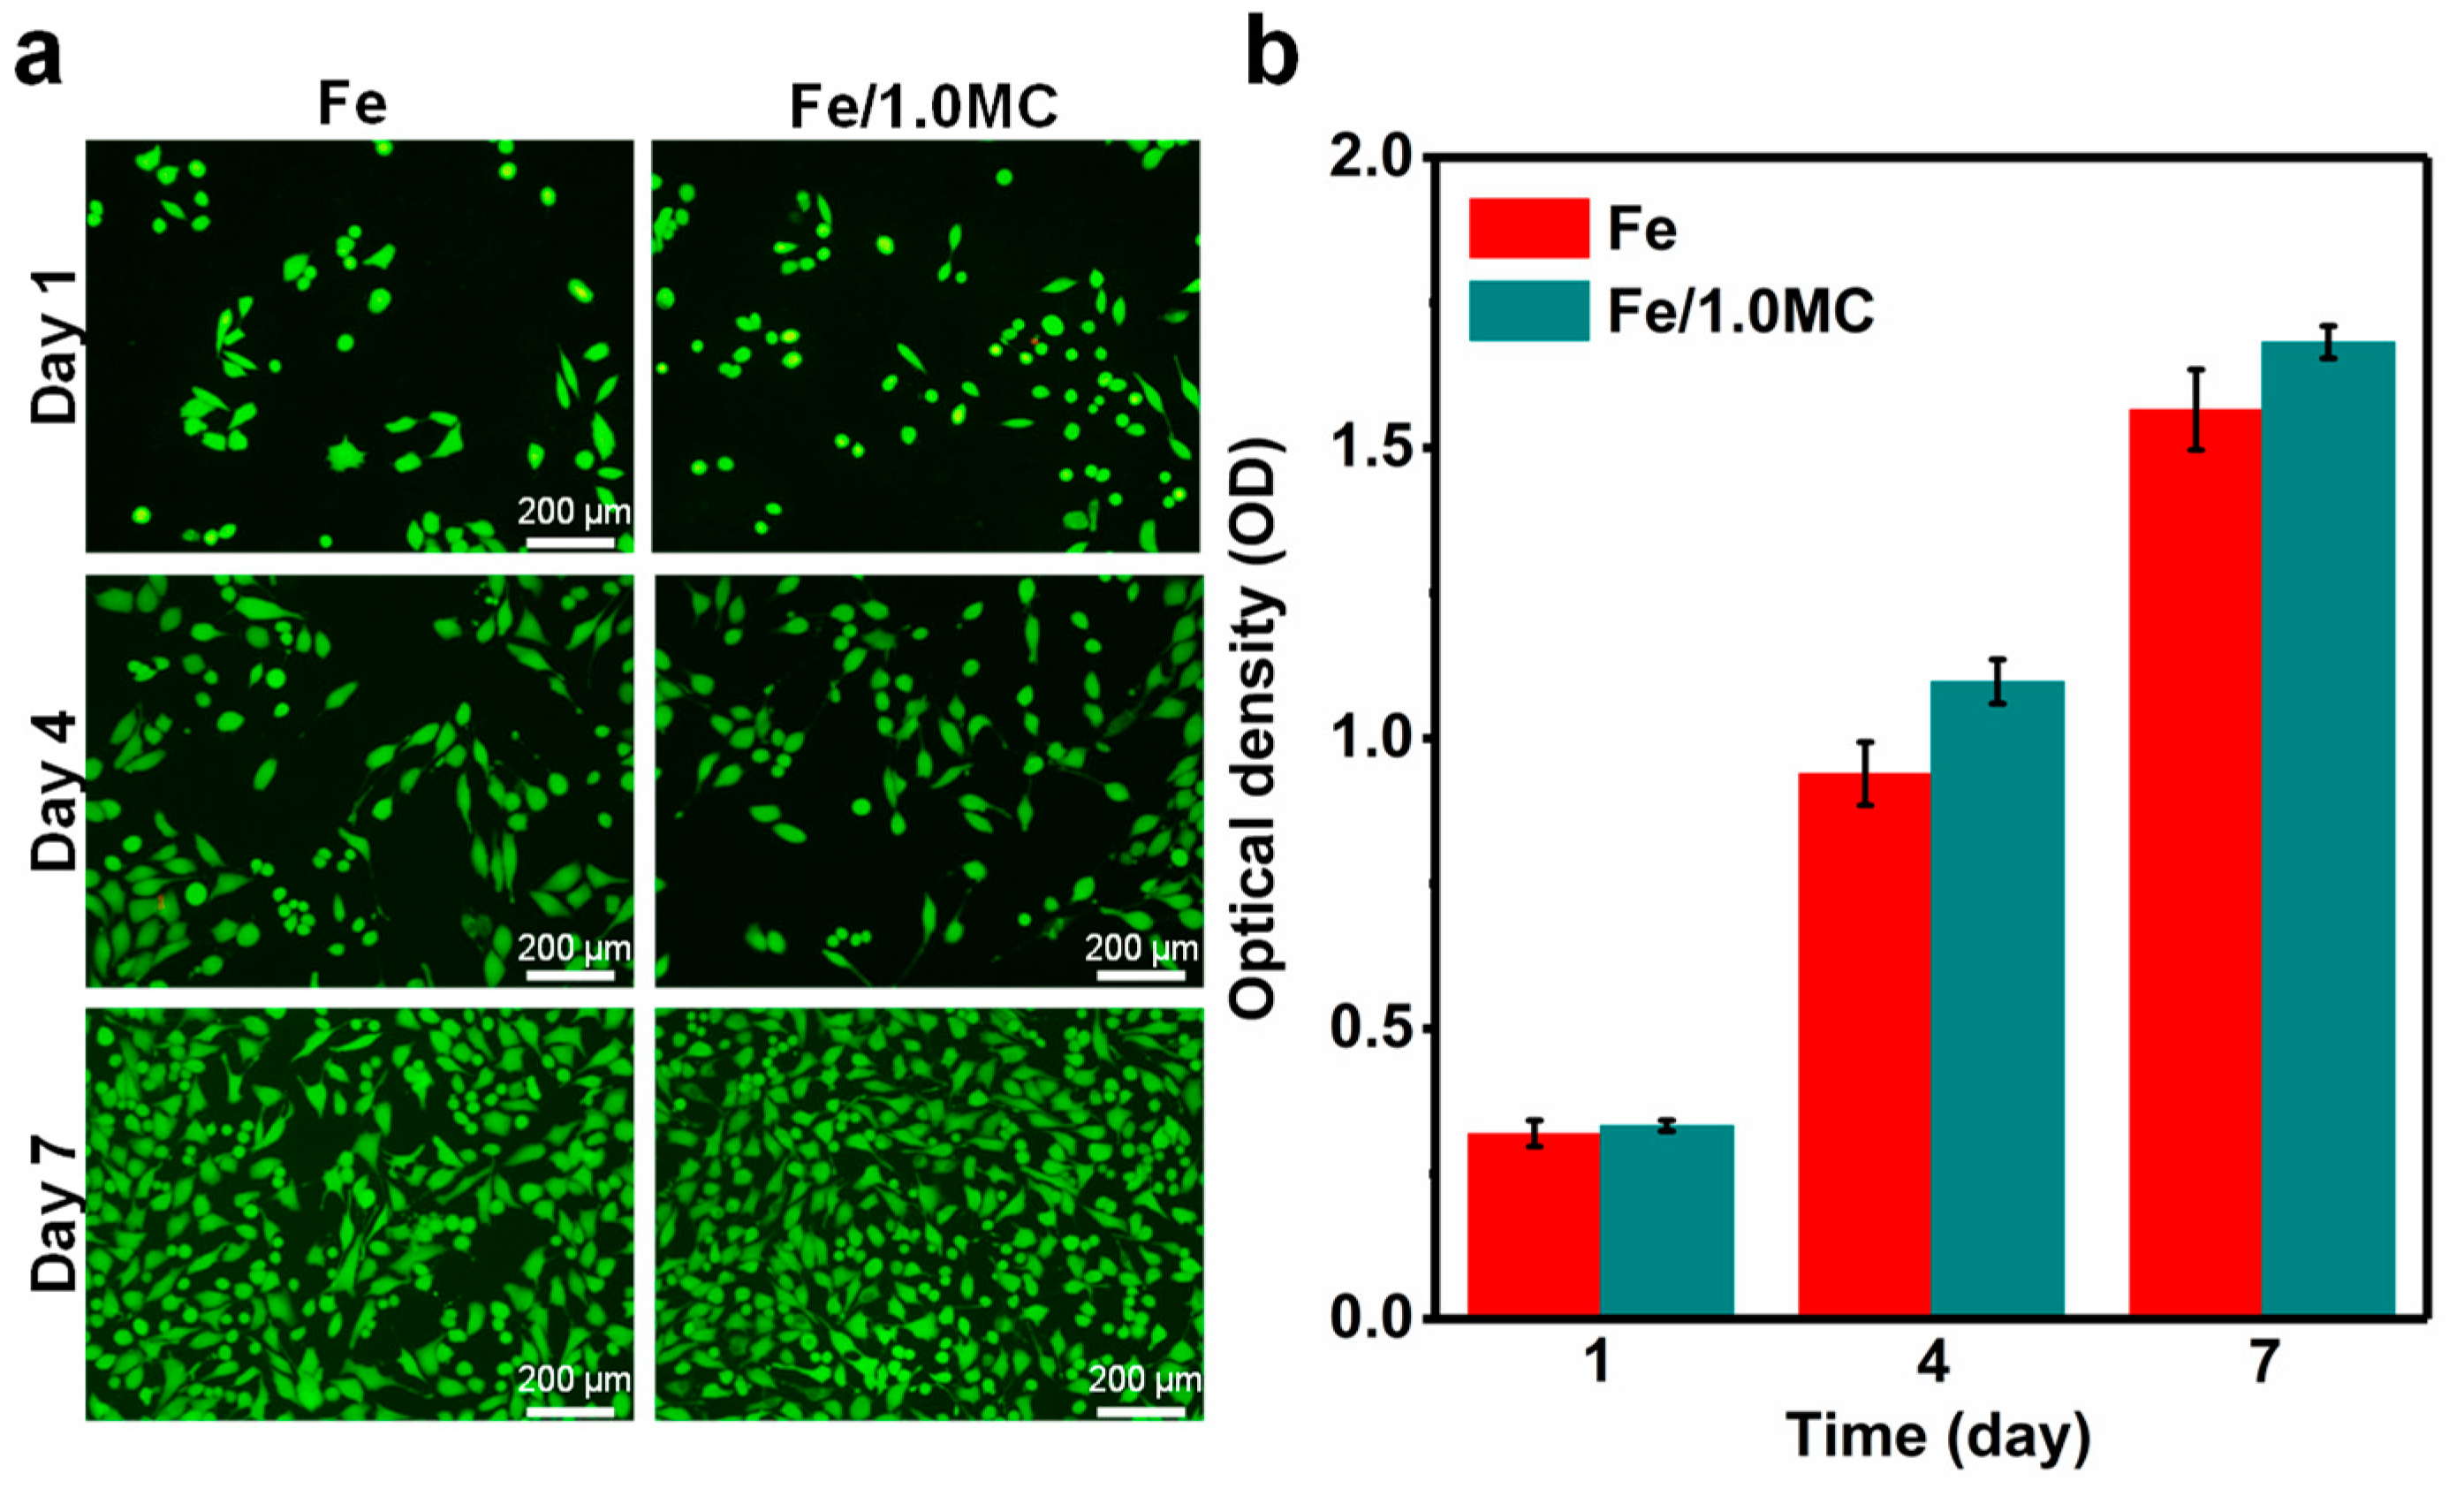
3.4. Cytocompatibility

Bone implants do not only need a suitable degradation rate, but also good biocompatibility, so as to avoid side effects on the human body after implantation [43,44,45,46,47]. The biocompatibility of Fe/1.0MC was investigated to evaluate its potential bone repair application. Herein, Fe was used as control. The MG-63 cells exhibited representative polygonal or fusiform shapes after culture for 4 and 7 d, indicating their normal growth [48]. Notably, the cells increased markedly, with culture time increasing from 1 to 7 d. The MG-63 cells began to secrete abundant pseudopods at day 4, and formed numerous extracellular matrixes with an extended culture time. The cell viability was quantitatively analyzed using CCK-8 assay (Figure 9b). The determined optical densities increased considerably, with culture time increasing, which was consistent with the above fluorescent observation. Meanwhile, no significant difference could be observed between the Fe and Fe/1.0MC after culture for 4 and 7 d. All these results suggested that both Fe and Fe/1.0MC were conducive to cell proliferation.

4. Conclusions

In this study, MC was introduced into Fe to improve the degradation behavior. The Fe/MC composite was manufactured by a laser additive manufacturing process. MC with a high specific surface area enhanced the area ratio between cathode and anode, thus acting as an effective cathode and activating micro-galvanic corrosion in the Fe matrix. The degradation rates were significantly increased from 0.09 mm/year for Fe to 0.24 mm/year for the Fe/1.0MC composite. In addition, the Fe/1.0MC composite showed no obvious cytotoxicity to MG-63 cells. In sum, the Fe/MC composite with high mechanical strength, an enhanced degradation rate and good cytocompatibility was an alternative candidate for bone repair.

Author Contributions

Conceptualization, Y.Y. and C.S.; Validation, S.P.; investigation, Y.L., F.D.; resources, L.S.; writing—review and editing, Y.Y. and C.S.; visualization, F.Q.; project administration, C.S. All authors have read and agreed to the published version of the manuscript.

Funding

This study was supported by the following funds: (1) The Natural Science Foundation of China (51935014, 51905553, 81871494, 81871498, 51705540); (2) Hunan Provincial Natural Science Foundation of China (2019JJ50774, 2018JJ3671, 2019JJ50588); (3) JiangXi Provincial Natural Science Foundation of China (20192ACB20005); (4) Guangdong Province Higher Vocational Colleges & Schools Pearl River Scholar Funded Scheme (2018); (5) The Open Sharing Fund for the Large-scale Instruments and Equipments of Central South University; (6) The Project of Hunan Provincial Science and Technology Plan (2017RS3008).

Conflicts of Interest

The authors declare no conflict of interest.

References

  1. Yang, C.; Huan, Z.; Wang, X.; Wu, C.; Chang, J. 3D printed Fe scaffolds with HA nanocoating for bone regeneration. Acs Biomater. Sci. Eng. 2018, 4, 608–616. [Google Scholar] [CrossRef]
  2. Tong, X.; Shi, Z.; Xu, L.; Lin, J.; Zhang, D.; Wang, K.; Li, Y.; Wen, C. Degradation behavior, cytotoxicity, hemolysis, and antibacterial properties of electro-deposited Zn–Cu metal foams as potential biodegradable bone implants. Acta Biomater. 2019, 102, 481–492. [Google Scholar] [CrossRef]
  3. Shuai, C.; Wang, B.; Bin, S.; Peng, S.; Gao, C. Interfacial strengthening by reduced graphene oxide coated with MgO in biodegradable Mg composites. Mater. Des. 2020, 191, 108612. [Google Scholar] [CrossRef]
  4. Gao, C.; Yao, M.; Shuai, C.; Peng, S.; Deng, Y. Technology, Nano-SiC reinforced Zn biocomposites prepared via laser melting: Microstructure, mechanical properties and biodegradability. J. Mater. Sci. Technol. 2019, 201935, 2608–2617. [Google Scholar] [CrossRef]
  5. Yang, Y.; He, C.; E, D.; Yang, W.; Qi, F.; Xie, D.; Shen, L.; Peng, S.; Shuai, C. Mg bone implant: Features, developments and perspectives. Mater. Des. 2020, 185, 108259. [Google Scholar] [CrossRef]
  6. Pratesa, Y.; Suharno, B.; Wardhana, A.C.; Harjanto, S. Application of carbamide as foaming agent of FE-MN-C alloy for degradable biomaterial candidate with powder metallurgy process. J. Teknol. 2019, 81. [Google Scholar] [CrossRef] [Green Version]
  7. He, F.; Qian, G.; Ren, W.; Ke, J.; Fan, P.; Shi, X.; Cheng, Y.; Wu, S.; Deng, X.; Ye, J. Preparation and characterization of iron/β-tricalcium phosphate bio-cermets for load-bearing bone substitutes. Ceram. Int. 2017, 43, 8348–8355. [Google Scholar] [CrossRef]
  8. Xie, L.; Yang, Y.; Fu, Z.; Li, Y.; Shi, J.; Ma, D.; Liu, S.; Luo, D. Fe/Zn-modified tricalcium phosphate (TCP) biomaterials: Preparation and biological properties. Rsc Adv. 2019, 9, 781–789. [Google Scholar] [CrossRef] [Green Version]
  9. Wang, H.; Zheng, Y.; Jiang, C.; Li, Y.; Fu, Y. In vitro corrosion behavior and cytocompatibility of pure Fe implanted with Ta. Surface and Coatings Technology 2017, 320, 201–205. [Google Scholar] [CrossRef] [Green Version]
  10. Wang, H.; Zheng, Y.; Liu, J.; Jiang, C.; Li, Y. In vitro corrosion properties and cytocompatibility of Fe-Ga alloys as potential biodegradable metallic materials. Mater. Sci. Eng. C 2017, 71, 60–66. [Google Scholar] [CrossRef]
  11. Sikora-Jasinska, M.; Chevallier, P.; Turgeon, S.; Paternoster, C.; Mostaed, E.; Vedani, M.; Mantovani, D. Long-term in vitro degradation behaviour of Fe and Fe/Mg 2 Si composites for biodegradable implant applications. Rsc Adv. 2018, 8, 9627–9639. [Google Scholar] [CrossRef] [Green Version]
  12. Li, H.; Wang, Y.; Peng, Q. High degradation rate of Fe-20Mn-based bio-alloys by accumulative cryo-rolling and annealing. Mater. Sci. Eng. C. 2017, 79, 37–44. [Google Scholar] [CrossRef] [PubMed]
  13. Huang, T.; Cheng, J.; Zheng, Y. In vitro degradation and biocompatibility of Fe–Pd and Fe–Pt composites fabricated by spark plasma sintering. Mater. Sci. Eng. C 2014, 35, 43–53. [Google Scholar] [CrossRef] [PubMed]
  14. Sharipova, A.; Swain, S.; Gotman, I.; Starosvetsky, D.; Psakhie, S.; Unger, R.; Gutmanas, E. Mechanical, degradation and drug-release behavior of nano-grained Fe-Ag composites for biomedical applications. J. Mech. Behav. Biomed. Mater. 2018, 86, 240–249. [Google Scholar] [CrossRef]
  15. Shuai, C.; Yang, W.; Yang, Y.; Pan, H.; He, C.; Qi, F.; Xie, D.; Liang, H. Selective laser melted Fe-Mn bone scaffold: Microstructure, corrosion behavior and cell response. Mater. Res. Express 2020, 7, 015404. [Google Scholar] [CrossRef]
  16. Čapek, J.; Msallamová, Š.; Jablonská, E.; Lipov, J.; Vojtěch, D. A novel high-strength and highly corrosive biodegradable Fe-Pd alloy: Structural, mechanical and in vitro corrosion and cytotoxicity study. Mater. Sci. Eng. C 2017, 79, 550–562. [Google Scholar] [CrossRef]
  17. Zhao, Y.-C.; Tang, Y.; Zhao, M.-C.; Liu, C.; Liu, L.; Gao, C.-D.; Shuai, C.; Atrens, A. Study on Fe-xGO Composites Prepared by Selective Laser Melting: Microstructure, Hardness, Biodegradation and Cytocompatibility. JOM 2019, 72, 1163–1174. [Google Scholar] [CrossRef]
  18. Atkins, P.; Overton, T. Shriver and Atkins’ Inorganic Chemistry; Oxford University Press: Oxford, UK, 2010. [Google Scholar]
  19. Ma, T.-Y.; Liu, L.; Yuan, Z.-Y. Direct synthesis of ordered mesoporous carbons. Chem. Soc. Rev. 2013, 42, 3977–4003. [Google Scholar] [CrossRef]
  20. Shuai, C.; Li, S.; Wang, G.; Yang, Y.; Peng, S.; Gao, C. Strong corrosion induced by carbon nanotubes to accelerate Fe biodegradation. Mater. Sci. Eng. C 2019, 104, 109935. [Google Scholar] [CrossRef]
  21. Wang, Z.; Wang, Y.; Wang, C. Area Ratio of Cathode/Anode Effect on the Galvanic Corrosion of High Potential Difference Coupling in Seawater; IOP Conference Series: Materials Science and Engineering; IOP Publishing: Bristol, UK, 2018; p. 022046. [Google Scholar]
  22. Hu, S.; Liu, R.; Liu, L.; Cui, Y.; Oguzie, E.E.; Wang, F. Effect of hydrostatic pressure on the galvanic corrosion of 90/10 Cu-Ni alloy coupled to Ti6Al4V alloy. Corros. Sci. 2019, 163, 108242. [Google Scholar] [CrossRef]
  23. Li, Z.; Zhang, J.; Guan, B.Y.; Lou, X.W. Mesoporous Carbon@ Titanium Nitride Hollow Spheres as an Efficient SeS2 Host for Advanced Li–SeS2 Batteries. Angew. Chem. Int. Ed. 2017, 56, 16003–16007. [Google Scholar] [CrossRef] [PubMed]
  24. Wang, J.; Xu, Y.; Ding, B.; Chang, Z.; Zhang, X.; Yamauchi, Y.; Wu, K.C.W. Confined Self-Assembly in Two-Dimensional Interlayer Space: Monolayered Mesoporous Carbon Nanosheets with In-Plane Orderly Arranged Mesopores and a Highly Graphitized Framework. Angewandte Chemie International Edition 2018, 57, 2894–2898. [Google Scholar] [CrossRef] [PubMed]
  25. Vallet-Regí, M. Ordered mesoporous materials in the context of drug delivery systems and bone tissue engineering. Chem.–A Eur. J. 2006, 12, 5934–5943. [Google Scholar]
  26. Shuai, C.; Yuan, X.; Yang, W.; Peng, S.; He, C.; Feng, P.; Qi, F.; Wang, G. Cellulose nanocrystals as biobased nucleation agents in poly-l-lactide scaffold: Crystallization behavior and mechanical properties. Polym. Test. 2020, 85, 106458. [Google Scholar] [CrossRef]
  27. Shuai, C.; Cheng, Y.; Yang, W.; Feng, P.; Yang, Y.; He, C.; Qi, F.; Peng, S. Magnetically actuated bone scaffold: Microstructure, cell response and osteogenesis. Compos. Part B Eng. 2020, 192, 107986. [Google Scholar] [CrossRef]
  28. Shuai, C.; Zeng, Z.; Yang, Y.; Qi, F.; Peng, S.; Yang, W.; He, C.; Wang, G.; Qian, G. Graphene oxide assists polyvinylidene fluoride scaffold to reconstruct electrical microenvironment of bone tissue. Mater. Des. 2020, 190, 108564. [Google Scholar] [CrossRef]
  29. Yang, Y.; Zan, J.; Yang, W.; Qi, F.; he, C.; Huang, S.; Peng, S.; Shuai, C. Metal organic framework as compatible reinforcement in biopolymer bone scaffold. Mater. Chem. Front. 2020, 4, 973–984. [Google Scholar] [CrossRef]
  30. Cheng, J.; Zheng, Y. In vitro study on newly designed biodegradable Fe-X composites (X= W, CNT) prepared by spark plasma sintering. J. Biomed. Mater. Res. Part B: Appl. Biomater. 2013, 101, 485–497. [Google Scholar] [CrossRef]
  31. Wang, C.; Zhang, S.; Shen, Q.; Zhang, L. Investigation on reactive sintering process of boron carbide ceramics by XRD. Mater. Sci. Technol. 2009, 25, 809–812. [Google Scholar] [CrossRef]
  32. Yuan, Q.; Xu, G.; Liu, S.; Liu, M.; Hu, H.; Li, G. Effect of rolling reduction on microstructure and property of ultrafine grained low-carbon steel processed by cryorolling martensite. Metals 2018, 8, 518. [Google Scholar] [CrossRef] [Green Version]
  33. Abdizadeh, H.; Baghchesara, M. Investigation into the mechanical properties and fracture behavior of A356 aluminum alloy-based ZrO 2-particle-reinforced metal-matrix composites. Mech. Compos. Mater. 2013, 49, 571–576. [Google Scholar] [CrossRef]
  34. Lai, D.; Kong, G.; Che, C. Synthesis and corrosion behavior of ZnO/SiO2 nanorod-sub microtube superhydrophobic coating on zinc substrate. Surf. Coat. Technol. 2017, 315, 509–518. [Google Scholar] [CrossRef]
  35. Solmaz, R. Gold-supported activated NiZn coatings: Hydrogen evolution and corrosion studies. Int. J. Energy Res. 2017, 41, 1452–1459. [Google Scholar] [CrossRef]
  36. Meng, J.; Sun, W.; Tian, Z.; Qiu, X.; Zhang, D. Corrosion performance of magnesium (Mg) alloys containing rare-earth (RE) elements. In Corrosion Prevention of Magnesium Alloys; Elsevier: Amsterdam, The Netherlands, 2013; pp. 38–60. [Google Scholar]
  37. Zhou, Y.; Du, C.; Han, G.; Gao, Y.; Yin, G. Ultra-low Pt decorated PdFe alloy nanoparticles for formic acid electro-oxidation. Electrochimica Acta 2016, 217, 203–209. [Google Scholar] [CrossRef]
  38. Shuai, C.; Zan, J.; Yang, Y.; Peng, S.; Yang, W.; Qi, F.; Shen, L.; Tian, Z. Surface modification enhances interfacial bonding in PLLA/MgO bone scaffold. Mater. Sci. Eng. C 2020, 108, 110486. [Google Scholar] [CrossRef]
  39. Prabhu, T.R. An overview of high-performance aircraft structural Al alloy-AA7085. Acta Metall. Sin. (Engl. Lett.) 2015, 28, 909–921. [Google Scholar] [CrossRef] [Green Version]
  40. Sun, W.; Wang, L.; Wu, T.; Dong, C.; Liu, G. Tuning the functionalization degree of graphene: Determining critical conditions for inhibiting the corrosion promotion activity of graphene/epoxy nanocomposite coatings. Mater. Lett. 2019, 240, 262–266. [Google Scholar] [CrossRef]
  41. Cheng, J.; Huang, T.; Zheng, Y. Microstructure, mechanical property, biodegradation behavior, and biocompatibility of biodegradable Fe–Fe2O3 composites. J. Biomed. Mater. Res. Part A 2014, 102, 2277–2287. [Google Scholar] [CrossRef]
  42. Liu, B.; Zheng, Y. Effects of alloying elements (Mn, Co, Al, W, Sn, B, C and S) on biodegradability and in vitro biocompatibility of pure iron. Acta Biomater. 2011, 7, 1407–1420. [Google Scholar] [CrossRef]
  43. Feng, P.; Kong, Y.; Yu, L.; Li, Y.; Gao, C.; Peng, S.; Pan, H.; Zhao, Z.; Shuai, C. Molybdenum disulfide nanosheets embedded with nanodiamond particles: Co-dispersion nanostructures as reinforcements for polymer scaffolds. Appl. Mater. Today 2019, 17, 216–226. [Google Scholar] [CrossRef]
  44. Feng, P.; Jia, J.; Peng, S.; Yang, W.; Bin, S.; Shuai, C. Graphene oxide-driven interfacial coupling in laser 3D printed PEEK/PVA scaffolds for bone regeneration. Virtual Phys. Prototyp. 2020. [Google Scholar] [CrossRef]
  45. Qian, G.; Lu, T.; Zhang, J.; Liu, R.; Wang, Z.; Yu, B.; Li, H.; Shi, H.; Ye, J. Promoting bone regeneration of calcium phosphate cement by addition of PLGAmicrospheres and zinc silicate via synergistic effect of in-situ pore generation, bioactive ion stimulation and macrophage immunomodulation. Appl. Mater. Today 2020, 19, 100615. [Google Scholar] [CrossRef]
  46. Wang, G.; He, C.; Yang, W.; Qi, F.; Qian, G.; Peng, S.; Shuai, C. Surface-Modified Graphene Oxide with Compatible Interface Enhances Poly-L-Lactic Acid Bone Scaffold. J. Nanomater. 2020, 2020, 5634096. [Google Scholar] [CrossRef]
  47. Shuai, C.; Liu, G.; Yang, Y.; Yang, W.; He, C.; Wang, G.; Liu, Z.; Qi, F.; Peng, S. Functionalized BaTiO3 enhances piezoelectric effect towards cell response of bone scaffold. Colloids Surf. B Biointerfaces 2020, 185, 110587. [Google Scholar] [CrossRef] [PubMed]
  48. He, S.; Yang, S.; Zhang, Y.; Li, X.; Gao, D.; Zhong, Y.; Cao, L.; Ma, H.; Liu, Y.; Li, G.; et al. LncRNA ODIR1 Inhibits Osteogenic Differentiation of hUC-MSCs through the FBXO25/H2BK120ub/H3K4me3/OSX Axis. Cell Death Dis. 2019, 10, 1–16. [Google Scholar] [CrossRef] [PubMed] [Green Version]
Figure 1. (a) SEM images of as-received Fe powder; (b) Transmission electron micrographs of mesoporous carbon (MC); Photograph showing (c) as-built samples and (d) stretch samples.
Applsci 10 02487 g001
Figure 2. Secondary electron (SE) and back-scattered (BSE) images showed the microstructure of as-built Fe and Fe/MC composites.
Applsci 10 02487 g002
Figure 3. The XRD spectrum of Fe and Fe/MC composites.
Applsci 10 02487 g003
Figure 4. (a) Representative stress–strain curves obtained from tensile tests; (b) The calculated tensile strength and elongation from the stress–strain curves. n = 3. Fracture surface morphologies of as-built (4) Fe, (d) Fe/0.5MC, (e) Fe/1.0MC and (f) Fe/1.5MC.
Applsci 10 02487 g004
Figure 5. (a) The potential polarization curve; (b) The obtained Ecorr and Icorr from Tafel extrapolation; (c) The typical Nyquist diagram for the alternating current impedance measurements; (d) Corrosion rates calculated from the electrochemical results. n = 3, * p ˂ 0.05.
Applsci 10 02487 g005
Figure 6. Surface of (a) Fe, (b) Fe/0.5MC, (c) Fe/1.0MC and (d) Fe/1.5MC after polarization tests; (e) Locally enlarged image of Fe/1.0MC and (f) energy dispersive spectrometer (EDS) analysis of the marked area in Figure 6e.
Applsci 10 02487 g006
Figure 7. Corrosion surface of (a) Fe, (b) Fe/0.5MC, (c) Fe/1.0MC and (d) Fe/1.5MC composites after immersion for 21 d; (e) and (f) were the corresponding EDS analyses of points A and B, respectively.
Applsci 10 02487 g007
Figure 8. (a) Fe ion concentrations released from the Fe/MC composites after immersion for 7, 14, 21, and 28 d, n = 3, * p ˂ 0.05; (b) Calculated degradation rate basing on immersion tests; (c) Initial corrosion stage caused by galvanic corrosion; (d) Local enlarged drawing of electron transfer between galvanic couple; (e) Corrosion products precipitated on surface.
Applsci 10 02487 g008
Figure 9. (a) Fluorescent microscopy images of stained cells; (b) CCK-8 assay results of Fe and Fe/1.0MC after 1, 4 and 7 d. n = 3.
Applsci 10 02487 g009
Table 1. Physical and chemical parameters of MC.
Micro Porosity (%)Pore Diameter (nm)BET Surface Area (m2/g)Pore Volume (cm3/g)
3.73.912011.36

