Selection of an Appropriate Pre-Injection Pattern in a Marine Diesel Engine Through a Multiple-Criteria Decision Making Approach
Abstract
1. Introduction
2. Materials and Methods
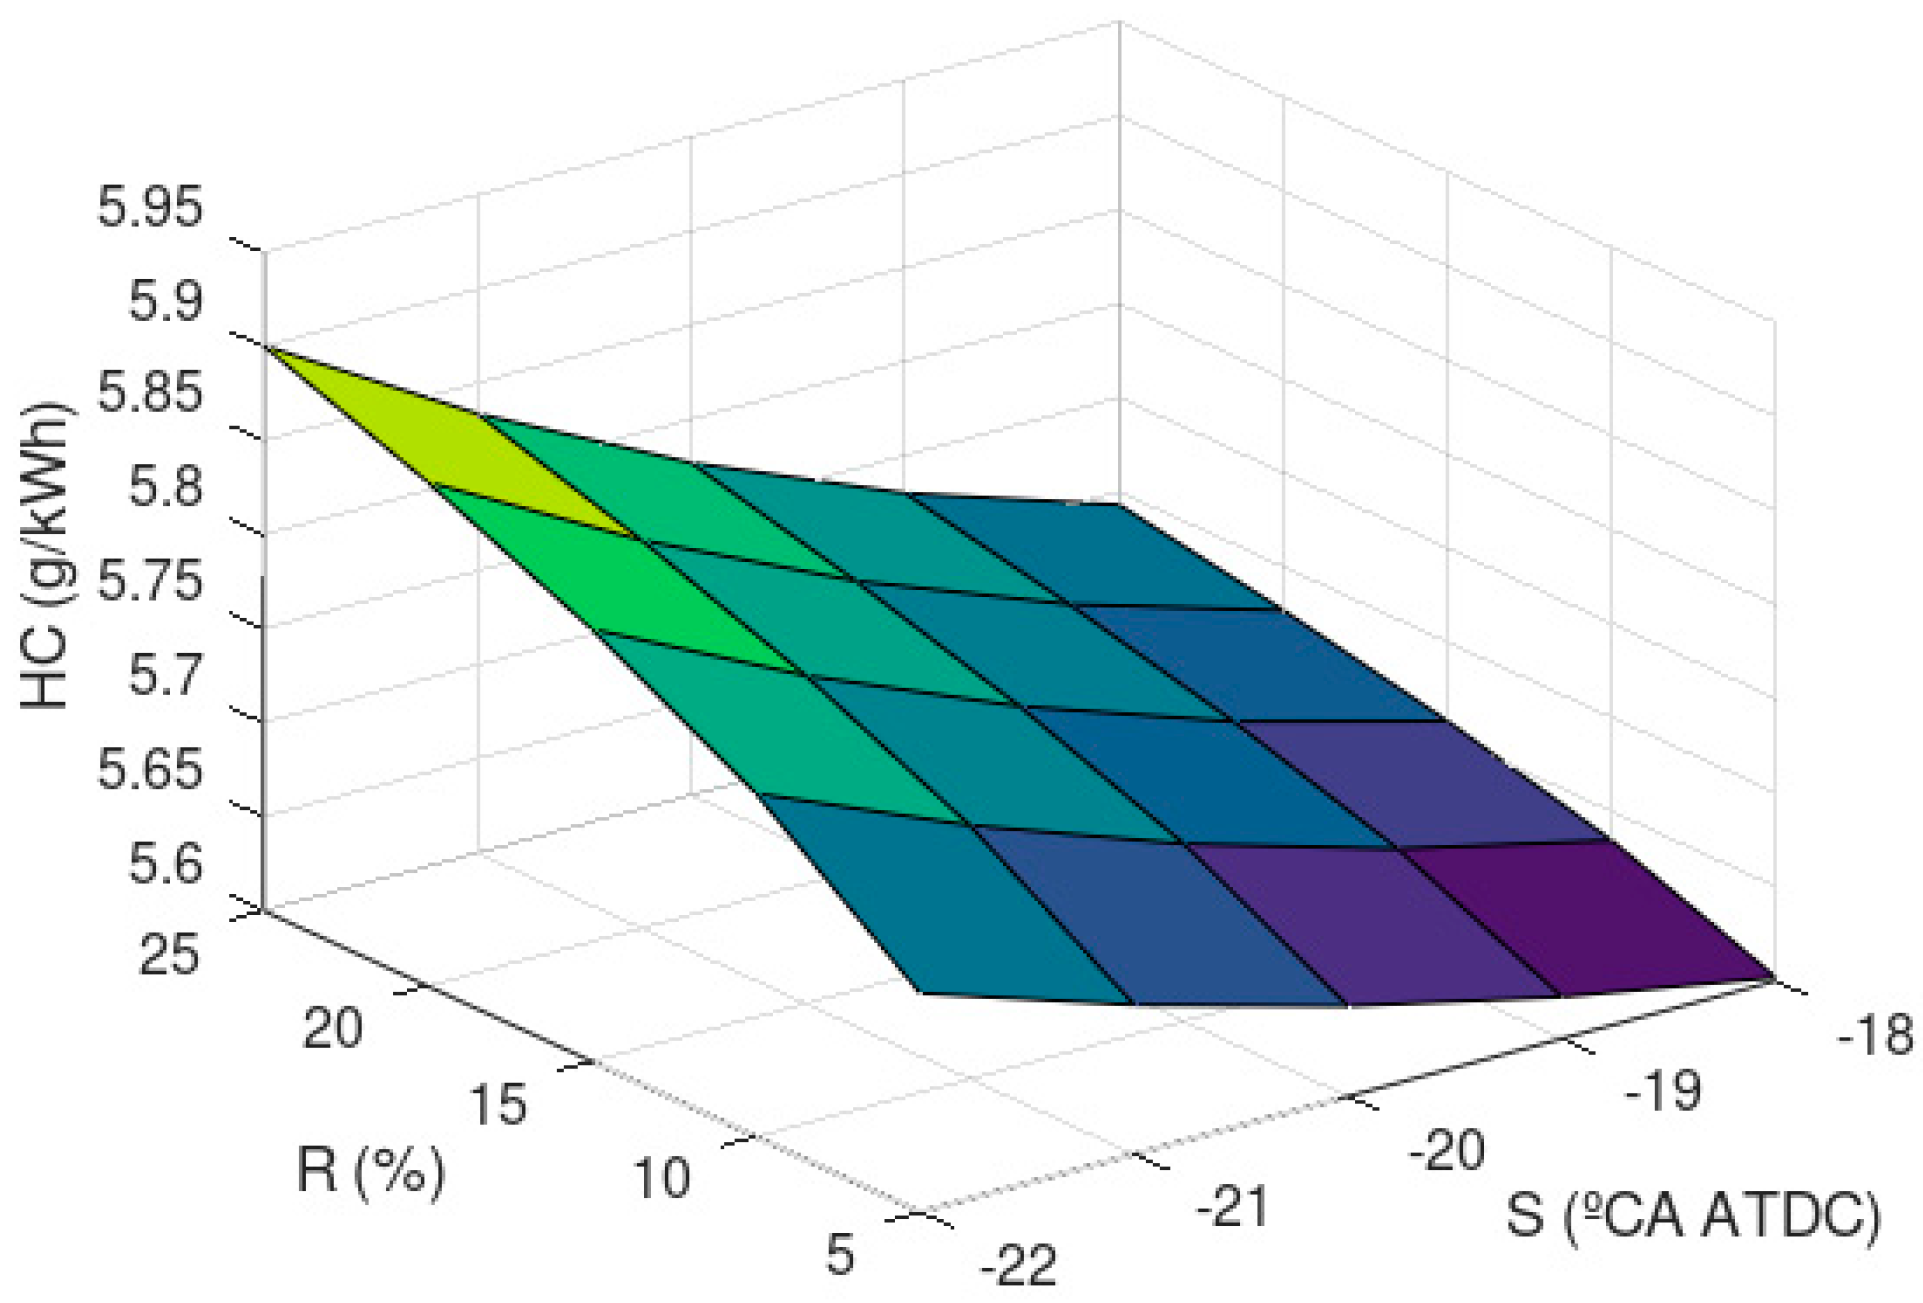
3. Results and Discussion
4. Conclusions
Author Contributions
Funding
Acknowledgments
Conflicts of Interest
Appendix A
| Case | S (°CA ATDC) | R (%) | D (°CA) | SFC (−) | NOx (−) | CO (−) | HC (−) | AI (−) |
|---|---|---|---|---|---|---|---|---|
| 1 | −22 | 5 | 1 | 0.1099 | −0.4455 | 0.0338 | 0.0393 | −0.0072 |
| 2 | −22 | 5 | 2 | 0.0987 | −0.4111 | 0.0385 | 0.0426 | −0.0058 |
| 3 | −22 | 5 | 3 | 0.0902 | −0.3846 | 0.0446 | 0.0474 | −0.0037 |
| 4 | −22 | 5 | 4 | 0.0846 | −0.3659 | 0.0523 | 0.0538 | −0.0011 |
| 5 | −22 | 5 | 5 | 0.0818 | −0.3551 | 0.0613 | 0.0619 | 0.0022 |
| 6 | −22 | 10 | 1 | 0.1421 | −0.5484 | 0.0450 | 0.0514 | −0.0045 |
| 7 | −22 | 10 | 2 | 0.1275 | −0.5061 | 0.0510 | 0.0555 | −0.0030 |
| 8 | −22 | 10 | 3 | 0.1166 | −0.4735 | 0.0590 | 0.0618 | −0.0006 |
| 9 | −22 | 10 | 4 | 0.1094 | −0.4505 | 0.0688 | 0.0701 | 0.0027 |
| 10 | −22 | 10 | 5 | 0.1058 | −0.4371 | 0.0806 | 0.0805 | 0.0068 |
| 11 | −22 | 15 | 1 | 0.1650 | −0.6194 | 0.0530 | 0.0600 | −0.0020 |
| 12 | −22 | 15 | 2 | 0.1481 | −0.5716 | 0.0600 | 0.0648 | −0.0005 |
| 13 | −22 | 15 | 3 | 0.1355 | −0.5347 | 0.0693 | 0.0721 | 0.0020 |
| 14 | −22 | 15 | 4 | 0.1271 | −0.5087 | 0.0807 | 0.0817 | 0.0057 |
| 15 | −22 | 15 | 5 | 0.1229 | −0.4937 | 0.0943 | 0.0938 | 0.0104 |
| 16 | −22 | 20 | 1 | 0.1836 | −0.6752 | 0.0595 | 0.0669 | 0.0001 |
| 17 | −22 | 20 | 2 | 0.1648 | −0.6231 | 0.0673 | 0.0723 | 0.0016 |
| 18 | −22 | 20 | 3 | 0.1507 | −0.5829 | 0.0775 | 0.0804 | 0.0044 |
| 19 | −22 | 20 | 4 | 0.1413 | −0.5546 | 0.0902 | 0.0911 | 0.0083 |
| 20 | −22 | 20 | 5 | 0.1367 | −0.5382 | 0.1054 | 0.1045 | 0.0135 |
| 21 | −22 | 25 | 1 | 0.1994 | −0.7219 | 0.0650 | 0.0728 | 0.0021 |
| 22 | −22 | 25 | 2 | 0.1790 | −0.6662 | 0.0734 | 0.0787 | 0.0036 |
| 23 | −22 | 25 | 3 | 0.1637 | −0.6232 | 0.0846 | 0.0874 | 0.0065 |
| 24 | −22 | 25 | 4 | 0.1535 | −0.5930 | 0.0984 | 0.0991 | 0.0107 |
| 25 | −22 | 25 | 5 | 0.1485 | −0.5755 | 0.1149 | 0.1137 | 0.0163 |
| 26 | −21 | 5 | 1 | 0.0770 | −0.3497 | 0.0276 | 0.0326 | −0.0098 |
| 27 | −21 | 5 | 2 | 0.0658 | −0.3153 | 0.0323 | 0.0358 | −0.0084 |
| 28 | −21 | 5 | 3 | 0.0573 | −0.2888 | 0.0384 | 0.0407 | −0.0064 |
| 29 | −21 | 5 | 4 | 0.0517 | −0.2701 | 0.0460 | 0.0471 | −0.0037 |
| 30 | −21 | 5 | 5 | 0.0489 | −0.2593 | 0.0551 | 0.0551 | −0.0004 |
| 31 | −21 | 10 | 1 | 0.0995 | −0.4305 | 0.0370 | 0.0427 | −0.0088 |
| 32 | −21 | 10 | 2 | 0.0850 | −0.3882 | 0.0430 | 0.0469 | −0.0073 |
| 33 | −21 | 10 | 3 | 0.0741 | −0.3555 | 0.0509 | 0.0531 | −0.0050 |
| 34 | −21 | 10 | 4 | 0.0668 | −0.3325 | 0.0608 | 0.0614 | −0.0017 |
| 35 | −21 | 10 | 5 | 0.0633 | −0.3192 | 0.0725 | 0.0718 | 0.0024 |
| 36 | −21 | 15 | 1 | 0.1156 | −0.4862 | 0.0437 | 0.0499 | −0.0077 |
| 37 | −21 | 15 | 2 | 0.0987 | −0.4384 | 0.0507 | 0.0547 | −0.0062 |
| 38 | −21 | 15 | 3 | 0.0861 | −0.4015 | 0.0599 | 0.0620 | −0.0037 |
| 39 | −21 | 15 | 4 | 0.0777 | −0.3755 | 0.0713 | 0.0716 | 0.0000 |
| 40 | −21 | 15 | 5 | 0.0735 | −0.3605 | 0.0850 | 0.0837 | 0.0047 |
| 41 | −21 | 20 | 1 | 0.1286 | −0.5300 | 0.0491 | 0.0557 | −0.0067 |
| 42 | −21 | 20 | 2 | 0.1098 | −0.4779 | 0.0569 | 0.0611 | −0.0052 |
| 43 | −21 | 20 | 3 | 0.0957 | −0.4377 | 0.0671 | 0.0691 | −0.0025 |
| 44 | −21 | 20 | 4 | 0.0864 | −0.4094 | 0.0798 | 0.0799 | 0.0015 |
| 45 | −21 | 20 | 5 | 0.0817 | −0.3930 | 0.0950 | 0.0933 | 0.0067 |
| 46 | −21 | 25 | 1 | 0.1397 | −0.5667 | 0.0537 | 0.0607 | −0.0057 |
| 47 | −21 | 25 | 2 | 0.1193 | −0.5110 | 0.0621 | 0.0665 | −0.0042 |
| 48 | −21 | 25 | 3 | 0.1040 | −0.4680 | 0.0733 | 0.0753 | −0.0014 |
| 49 | −21 | 25 | 4 | 0.0938 | −0.4377 | 0.0871 | 0.0869 | 0.0029 |
| 50 | −21 | 25 | 5 | 0.0888 | −0.4202 | 0.1036 | 0.1015 | 0.0085 |
| 51 | −20 | 5 | 1 | 0.0537 | −0.2774 | 0.0227 | 0.0269 | −0.0112 |
| 52 | −20 | 5 | 2 | 0.0425 | −0.2431 | 0.0273 | 0.0301 | −0.0098 |
| 53 | −20 | 5 | 3 | 0.0341 | −0.2165 | 0.0335 | 0.0350 | −0.0077 |
| 54 | −20 | 5 | 4 | 0.0285 | −0.1979 | 0.0411 | 0.0414 | −0.0050 |
| 55 | −20 | 5 | 5 | 0.0257 | −0.1870 | 0.0502 | 0.0494 | −0.0018 |
| 56 | −20 | 10 | 1 | 0.0695 | −0.3416 | 0.0306 | 0.0353 | −0.0113 |
| 57 | −20 | 10 | 2 | 0.0549 | −0.2992 | 0.0366 | 0.0395 | −0.0098 |
| 58 | −20 | 10 | 3 | 0.0440 | −0.2666 | 0.0445 | 0.0457 | −0.0074 |
| 59 | −20 | 10 | 4 | 0.0368 | −0.2436 | 0.0544 | 0.0540 | −0.0042 |
| 60 | −20 | 10 | 5 | 0.0332 | −0.2303 | 0.0661 | 0.0644 | −0.0001 |
| 61 | −20 | 15 | 1 | 0.0807 | −0.3857 | 0.0362 | 0.0413 | −0.0111 |
| 62 | −20 | 15 | 2 | 0.0638 | −0.3379 | 0.0432 | 0.0462 | −0.0096 |
| 63 | −20 | 15 | 3 | 0.0511 | −0.3011 | 0.0525 | 0.0534 | −0.0070 |
| 64 | −20 | 15 | 4 | 0.0427 | −0.2751 | 0.0639 | 0.0631 | −0.0034 |
| 65 | −20 | 15 | 5 | 0.0386 | −0.2601 | 0.0775 | 0.0751 | 0.0013 |
| 66 | −20 | 20 | 1 | 0.0898 | −0.4205 | 0.0408 | 0.0462 | −0.0108 |
| 67 | −20 | 20 | 2 | 0.0710 | −0.3684 | 0.0486 | 0.0516 | −0.0093 |
| 68 | −20 | 20 | 3 | 0.0569 | −0.3282 | 0.0589 | 0.0596 | −0.0066 |
| 69 | −20 | 20 | 4 | 0.0475 | −0.2999 | 0.0716 | 0.0704 | −0.0026 |
| 70 | −20 | 20 | 5 | 0.0429 | −0.2835 | 0.0868 | 0.0838 | 0.0026 |
| 71 | −20 | 25 | 1 | 0.0975 | −0.4496 | 0.0447 | 0.0503 | −0.0105 |
| 72 | −20 | 25 | 2 | 0.0771 | −0.3939 | 0.0532 | 0.0561 | −0.0090 |
| 73 | −20 | 25 | 3 | 0.0618 | −0.3509 | 0.0643 | 0.0649 | −0.0061 |
| 74 | −20 | 25 | 4 | 0.0516 | −0.3207 | 0.0781 | 0.0766 | −0.0019 |
| 75 | −20 | 25 | 5 | 0.0466 | −0.3031 | 0.0946 | 0.0911 | 0.0037 |
| 76 | −19 | 5 | 1 | 0.0401 | −0.2287 | 0.0190 | 0.0222 | −0.0113 |
| 77 | −19 | 5 | 2 | 0.0289 | −0.1944 | 0.0237 | 0.0254 | −0.0098 |
| 78 | −19 | 5 | 3 | 0.0204 | −0.1678 | 0.0298 | 0.0303 | −0.0078 |
| 79 | −19 | 5 | 4 | 0.0148 | −0.1492 | 0.0374 | 0.0367 | −0.0051 |
| 80 | −19 | 5 | 5 | 0.0121 | −0.1384 | 0.0465 | 0.0447 | −0.0018 |
| 81 | −19 | 10 | 1 | 0.0519 | −0.2816 | 0.0258 | 0.0292 | −0.0119 |
| 82 | −19 | 10 | 2 | 0.0373 | −0.2393 | 0.0319 | 0.0334 | −0.0104 |
| 83 | −19 | 10 | 3 | 0.0264 | −0.2066 | 0.0398 | 0.0396 | −0.0080 |
| 84 | −19 | 10 | 4 | 0.0192 | −0.1837 | 0.0497 | 0.0479 | −0.0048 |
| 85 | −19 | 10 | 5 | 0.0156 | −0.1703 | 0.0614 | 0.0583 | −0.0007 |
| 86 | −19 | 15 | 1 | 0.0602 | −0.3180 | 0.0308 | 0.0343 | −0.0121 |
| 87 | −19 | 15 | 2 | 0.0433 | −0.2703 | 0.0378 | 0.0391 | −0.0106 |
| 88 | −19 | 15 | 3 | 0.0307 | −0.2334 | 0.0470 | 0.0463 | −0.0080 |
| 89 | −19 | 15 | 4 | 0.0223 | −0.2074 | 0.0584 | 0.0560 | −0.0044 |
| 90 | −19 | 15 | 5 | 0.0181 | −0.1924 | 0.0721 | 0.0681 | 0.0003 |
| 91 | −19 | 20 | 1 | 0.0670 | −0.3467 | 0.0347 | 0.0383 | −0.0122 |
| 92 | −19 | 20 | 2 | 0.0482 | −0.2946 | 0.0425 | 0.0437 | −0.0107 |
| 93 | −19 | 20 | 3 | 0.0341 | −0.2544 | 0.0528 | 0.0518 | −0.0080 |
| 94 | −19 | 20 | 4 | 0.0248 | −0.2261 | 0.0655 | 0.0625 | −0.0040 |
| 95 | −19 | 20 | 5 | 0.0201 | −0.2097 | 0.0807 | 0.0759 | 0.0012 |
| 96 | −19 | 25 | 1 | 0.0728 | −0.3707 | 0.0381 | 0.0418 | −0.0122 |
| 97 | −19 | 25 | 2 | 0.0524 | −0.3150 | 0.0465 | 0.0476 | −0.0107 |
| 98 | −19 | 25 | 3 | 0.0371 | −0.2720 | 0.0577 | 0.0564 | −0.0079 |
| 99 | −19 | 25 | 4 | 0.0269 | −0.2418 | 0.0715 | 0.0680 | −0.0036 |
| 100 | −19 | 25 | 5 | 0.0219 | −0.2242 | 0.0880 | 0.0826 | 0.0020 |
| 101 | −18 | 5 | 1 | 0.0361 | −0.2036 | 0.0166 | 0.0185 | −0.0101 |
| 102 | −18 | 5 | 2 | 0.0249 | −0.1692 | 0.0213 | 0.0217 | −0.0086 |
| 103 | −18 | 5 | 3 | 0.0164 | −0.1427 | 0.0274 | 0.0266 | −0.0066 |
| 104 | −18 | 5 | 4 | 0.0108 | −0.1241 | 0.0351 | 0.0330 | −0.0039 |
| 105 | −18 | 5 | 5 | 0.0081 | −0.1132 | 0.0441 | 0.0410 | −0.0007 |
| 106 | −18 | 10 | 1 | 0.0467 | −0.2507 | 0.0228 | 0.0245 | −0.0106 |
| 107 | −18 | 10 | 2 | 0.0322 | −0.2084 | 0.0288 | 0.0286 | −0.0091 |
| 108 | −18 | 10 | 3 | 0.0213 | −0.1757 | 0.0368 | 0.0349 | −0.0068 |
| 109 | −18 | 10 | 4 | 0.0140 | −0.1527 | 0.0466 | 0.0432 | −0.0035 |
| 110 | −18 | 10 | 5 | 0.0104 | −0.1394 | 0.0583 | 0.0536 | 0.0006 |
| 111 | −18 | 15 | 1 | 0.0543 | −0.2831 | 0.0272 | 0.0287 | −0.0108 |
| 112 | −18 | 15 | 2 | 0.0374 | −0.2353 | 0.0342 | 0.0336 | −0.0093 |
| 113 | −18 | 15 | 3 | 0.0247 | −0.1984 | 0.0434 | 0.0408 | −0.0067 |
| 114 | −18 | 15 | 4 | 0.0163 | −0.1725 | 0.0549 | 0.0505 | −0.0031 |
| 115 | −18 | 15 | 5 | 0.0121 | −0.1574 | 0.0685 | 0.0625 | 0.0016 |
| 116 | −18 | 20 | 1 | 0.0604 | −0.3086 | 0.0308 | 0.0322 | −0.0109 |
| 117 | −18 | 20 | 2 | 0.0416 | −0.2565 | 0.0386 | 0.0375 | −0.0094 |
| 118 | −18 | 20 | 3 | 0.0275 | −0.2163 | 0.0488 | 0.0456 | −0.0066 |
| 119 | −18 | 20 | 4 | 0.0181 | −0.1880 | 0.0615 | 0.0563 | −0.0027 |
| 120 | −18 | 20 | 5 | 0.0135 | −0.1716 | 0.0767 | 0.0697 | 0.0025 |
| 121 | −18 | 25 | 1 | 0.0656 | −0.3300 | 0.0338 | 0.0351 | −0.0108 |
| 122 | −18 | 25 | 2 | 0.0451 | −0.2743 | 0.0423 | 0.0409 | −0.0094 |
| 123 | −18 | 25 | 3 | 0.0298 | −0.2313 | 0.0534 | 0.0497 | −0.0065 |
| 124 | −18 | 25 | 4 | 0.0197 | −0.2010 | 0.0672 | 0.0613 | −0.0023 |
| 125 | −18 | 25 | 5 | 0.0146 | −0.1835 | 0.0837 | 0.0759 | 0.0033 |
References
- Shen, H.; Zhang, J.; Yang, B.; Jia, B. Development of a marine two-stroke diesel engine MVEM with in-cylinder pressure predictive capability and a novel compressor model. J. Mar. Sci. Eng. 2020, 8, 204. [Google Scholar] [CrossRef]
- Sencic, T.; Mrzljak, V.; Blecich, P.; Bonefacic, I. 2D CFD simulation of water injection strategies in a large marine engine. J. Mar. Sci. Eng. 2019, 7, 296. [Google Scholar] [CrossRef]
- Sinay, J.; Puskar, M.; Kopas, M. Reduction of the NOx emissions in vehicle diesel engine in order to fulfill future rules concerning emissions released into air. Sci. Total Environ. 2018, 624, 1421–1428. [Google Scholar] [CrossRef] [PubMed]
- Lamas, M.I.; Rodriguez, C.G. Emissions from marine engines and NOx reduction methods. J. Marit. Res. 2012, 9, 77–82. [Google Scholar]
- di Sarli, V.; di Benedetto, A. Using CFD simulation as a tool to identify optimal operating conditions for regeneration of a catalytic diesel particulate filter. Appl. Sci. 2019, 9, 3453. [Google Scholar] [CrossRef]
- Lamas, M.I.; Rodriguez, C.G. NOx reduction in diesel-hydrogen engines using different strategies of ammonia injection. Energies 2019, 12, 1255. [Google Scholar] [CrossRef]
- Lamas, M.I.; Rodriguez, C.G. Numerical model to analyze NOx reduction by ammonia injection in diesel-hydrogen engines. Int. J. Hydrog. Energy 2017, 42, 26132–26141. [Google Scholar] [CrossRef]
- Leach, F.; Ismail, R.; Davy, M. Engine-out emissions from a modern high speed diesel engine—The importance of nozzle tip protrusion. Appl. Energy 2018, 226, 340–352. [Google Scholar] [CrossRef]
- Gao, Z.; Schreiber, W. The effects of EGR and split fuel injection on diesel engine emission. Int. J. Automot. Technol. 2001, 2, 123–133. [Google Scholar]
- Park, S.W.; Suh, H.K.; Lee, C.S. Effects of a split injection on spray characteristics for a common-rail type diesel injection system. Int. J. Automot. Technol. 2005, 6, 315–322. [Google Scholar]
- Chen, S.K. Simultaneous Reduction of NOx and Particulate Emissions by Using Multiple Injections in a Small Diesel Engine; SAE Technical Paper 2000-01-3084; SAE International: Warrendale, PA, USA, 2000. [Google Scholar] [CrossRef]
- Shundoh, S.; Komori, M.; Tsujimura, K.; Kobayashi, S. NOx Reduction from Diesel Combustion Using Pilot Injection with High Pressure Fuel Injection; SAE Technical Paper 920461; SAE International: Warrendale, PA, USA, 1992. [Google Scholar] [CrossRef]
- Carlucci, P.; Ficarella, A.; Laforgia, D. Effects of Pilot Injection Parameters on Combustion for Common Rail Diesel Engines; SAE Technical Paper 2003-01-0700; SAE International: Warrendale, PA, USA, 2003. [Google Scholar] [CrossRef]
- Tanaka, T.; Ando, A.; Ishizaka, K. Study on pilot injection of DI diesel engine using common rail injection system. JSAE Rev. 2002, 23, 297–302. [Google Scholar] [CrossRef]
- Benajes, J.; Molina, S.; Novella, R.; DeRudder, K. Influence of injection conditions and exhaust gas recirculation in a high-speed direct-injection diesel engine operating with a late split injection. Proc. Inst. Mech. Eng. Partd: J. Automob. Eng. 2008, 222, 629–641. [Google Scholar] [CrossRef]
- Pierpont, D.; Montgomery, D.; Reitz, R. Reducing Particulate and NOx Using Multiple Injections and EGR in a DI Diesel; SAE Technical Paper 950217; SAE International: Warrendale, PA, USA, 1995. [Google Scholar] [CrossRef]
- Hotta, Y.; Inayoshi, M.; Nakakita, K.; Fujiwara, K. Achieving Lower Exhaust Emissions and Better Performance in an HSDI Diesel Engine with Multiple Injection; SAE Technical Paper 2005-01-0928; SAE International: Warrendale, PA, USA, 2005. [Google Scholar] [CrossRef]
- Fang, T.; Coverdill, R.; Lee, C.F.; White, R.A. Effects of injection angles on combustion process using multiple injection strategies in an HSDI diesel engine. Fuel 2008, 87, 3232–3239. [Google Scholar] [CrossRef]
- Ishida, M.; Chen, Z.L.; Luo, G.F.; Ueki, H. The Effect of Pilot Injection on Combustion in a Turbocharged D. I. Diesel Engine; SAE Technical Paper 941692; SAE International: Warrendale, PA, USA, 1994. [Google Scholar] [CrossRef]
- Minami, T.; Takeuchi, K.; Shimazaki, N. Reduction of Diesel Engine NOx Using Pilot Injection; SAE Techical Paper 950611; SAE International: Warrendale, PA, USA, 1995. [Google Scholar] [CrossRef]
- Dhar, A.; Agarwal, A.K. Experimental investigations of the effect of pilot injection on performance, emissions and combustion characteristics of Karanja biodiesel fuelled CRDI engine. Energy Convers. Manag. 2015, 93, 357–366. [Google Scholar] [CrossRef]
- Puskar, M.; Bigos, P. Output performance increase of two-stroke combustion engine with detonation combustion optimization. Strojarstvo 2010, 52, 577–587. [Google Scholar]
- Puskar, M.; Brestovic, T.; Jasminska, N. Numerical simulation and experimental analysis of acoustic wave influences on brake mean effective pressure in thrust-ejector inlet pipe of combustion engine. Int. J. Veh. Des. 2015, 67, 63–76. [Google Scholar] [CrossRef]
- Hunicz, J.; Geca, M.S.; Kordos, P.; Komsta, H. An experimental study on a boosted gasoline HCCI engine under different direct fuel injection strategies. Exp. Therm. Fluid Sci. 2015, 62, 151–163. [Google Scholar] [CrossRef]
- Alla, G.H.A.; Soliman, H.A.; Badr, O.A. Effect of injection timing on the performance of a dual fuel engine. Energy Convers. Manag. 2002, 43, 269–277. [Google Scholar] [CrossRef]
- Papagiannakis, R.G.; Hountalas, D.T.; Rakopoulos, C.D. Theoretical study of the effects of pilot fuel quantity and its injection timing on the performance and emissions of a dual fuel diesel engine. Energy Convers. Manag. 2007, 48, 2951–2961. [Google Scholar] [CrossRef]
- Ryu, K. Effects of pilot injection timing on the combustion and emissions characteristics in a diesel engine using biodiesel–CNG dual fuel. Appl. Energy 2013, 111, 721–730. [Google Scholar] [CrossRef]
- Yang, B.; Wang, L.; Ning, L.; Zeng, K. Effects of pilot injection timing on the combustion noise and particle emissions of a diesel/natural gas dual-fuel engine at low load. Appl. Therm. Eng. 2016, 102, 822–828. [Google Scholar] [CrossRef]
- Seddiek, I.S.; Elgohary, M.M.; Ammar, N. The hydrogen-fuelled internal combustion engines for marine applications with a case study. Brodogradnja 2015, 66, 23–38. [Google Scholar]
- Carlucci, A.P.; Ficarella, A.; Laforgia, D. Control of the combustion behaviour in a diesel engine using early injection and gas addition. Appl. Therm. Eng. 2006, 26, 2279–2286. [Google Scholar] [CrossRef]
- Hwang, J.; Qi, D.; Jung, Y.; Bae, C. Effect of injection parameters on the combustion and emission characteristics in a common-rail direct injection diesel engine fueled with waste cooking oil biodiesel. Renew. Energy 2014, 63, 9–17. [Google Scholar] [CrossRef]
- Sinay, J.; Tompos, A.; Puskar, M.; Pctkova, V. Multiparametric diagnostics of gas engines. Trans. R. Inst. Nav. Archit. Part A: Int. J. Marit. Eng. 2014, 156, 149–156. [Google Scholar] [CrossRef]
- Shi, J.; Wang, T.; Zhao, Z.; Yang, T.; Zhang, Z. Experimental study of injection parameters on the performance of a diesel engine with Fischer-Tropsch fuel synthesized from coal. Energies 2018, 11, 3280. [Google Scholar] [CrossRef]
- di Sarli, V. Stability and emissions of a lean pre-mixed combustor with rich catalytic/lean-burn pilot. Int. J. Chem. React. Eng. 2014, 12, 77–89. [Google Scholar] [CrossRef]
- Lechner, G.; Jacobs, T.; Chryssakis, C. Evaluation of a Narrow Spray Cone Angle, Advanced Injection Timing Strategy to Achieve Partially Premixed Compression Ignition Combustion in a Diesel Engine; SAE Technical Paper 2005-01-0167; SAE International: Warrendale, PA, USA, 2005. [Google Scholar] [CrossRef]
- Sun, Y.; Reitz, R.D. Modeling Diesel Engine NOx and Soot Reduction with Optimized Two-Stage Combustion; SAE Technical Paper 2006-01-0027 2006; SAE International: Warrendale, PA, USA, 2006. [Google Scholar] [CrossRef]
- Verbiezen, K.; Donkerbroek, A.J.; Klein-Douwel, R.J.H.; van Vliet, A.P.; Frijters, P.J.M.; Seykens, X.L.J. Diesel combustion: In-cylinder NO concentrations in relation to injection timing. Combust. Flame 2007, 151, 333–346. [Google Scholar] [CrossRef]
- Zehni, A.; Jafarmadar, S. Multi-dimensional modeling of the effects of split injection scheme on combustion and emissions of direct-injection diesel engines at full load state. IJE Trans. 2009, 22, 369–378. [Google Scholar]
- Abdullah, N.R.; Mamat, R.; Rounce, P.; Tsolakis, A.; Wyszynski, M.L.; Xu, H.M. Effect of Injection Pressure with Split Injection in a V6 Diesel Engine; SAE Technical Paper 2009-20-0049; SAE International: Warrendale, PA, USA, 2009; Volume 16, pp. 1–11. [Google Scholar] [CrossRef]
- Coskun, G.; Soyhan, H.S.; Demir, U.; Turkcan, A.; Ozsezen, A.N.; Canakci, M. Influences of second injection variations on combustion and emissions of an HCCI-DI engine: Experiments and CFD modelling. Fuel 2014, 136, 287–294. [Google Scholar] [CrossRef]
- Wang, X.; Zhao, H.; Xie, H. Effect of piston shapes and fuel injection strategies on stoichiometric stratified flame ignition (SFI) hybrid combustion in a PFI/DI gasoline engine by numerical simulations. Energy Convers. Manag. 2015, 98, 387–400. [Google Scholar] [CrossRef]
- Zhaojie, S.; Cui, W.; Ju, X.; Liu, Z. Numerical investigation on effects of assigned EGR stratification on a heavy duty diesel engine with two-stage fuel injection. Energies 2018, 11, 515. [Google Scholar] [CrossRef]
- Lamas, M.I.; de Dios Rodriguez, J.; Castro-Santos, L.; Carral, L.M. Effect of multiple injection strategies on emissions and performance in the Wärtsilä 6L 46 marine engine. A numerical approach. J. Clean. Prod. 2019, 206, 1–10. [Google Scholar] [CrossRef]
- Lamas, M.I.; Rodriguez, C.G. Computational fluid dynamics analysis of the scavenging process in the MAN B&W 7S50MC two-stroke diesel marine engine. J. Ship Res. 2012, 56, 154–161. [Google Scholar] [CrossRef]
- Sencic, T. Analysis of soot and NOx emissions reduction possibilities on modern low speed, two-stroke, diesel engines. Strojarstvo 2010, 52, 525–533. [Google Scholar]
- Ricart, L.M.; Xin, J.; Bower, G.R.; Reitz, R.D. In-Cylinder Measurement and Modeling of Liquid Fuel Spray Penetration in a Heavy-Duty Diesel Engine; SAE Technical Paper 971591; SAE International: Warrendale, PA, USA, 1997. [Google Scholar] [CrossRef]
- Dukowicz, J.K. A particle-fluid numerical model for liquid sprays. J. Comput. Phys. 1980, 35, 229–253. [Google Scholar] [CrossRef]
- Ra, Y.; Reitz, R. A reduced chemical kinetic model for IC engine combustion simulations with primary reference fuels. Combust. Flame 2008, 155, 713–738. [Google Scholar] [CrossRef]
- Yang, H.; Krishnan, S.R.; Srinivasan, K.K.; Midkiff, K.C. Modeling of NOx emissions using a superextended Zeldovich mechanism. In Proceedings of the ICEF03 2003 Fall Technical Conference of the ASME Internal Combustion Engine Division, Erie, PA, USA, 7–10 September 2003. [Google Scholar]
- Miller, J.A.; Glarborg, P. Modeling the formation of N2O and NO2 in the thermal DeNOx process. Springer Ser. Chem. Phys. 1996, 61, 318–333. [Google Scholar]
- Lamas, M.I.; Rodríguez, C.G.; Rebollido, J.M. Numerical model to study the valve overlap period in the Wärtsilä 6L46 four-stroke marine engine. Pol. Marit. Res. 2012, 1, 31–37. [Google Scholar] [CrossRef]
- Lamas, M.I.; Rodríguez, C.G. Numerical model to study the combustion process and emissions in the Wärtsilä 6L 46 four-stroke marine engine. Pol. Marit. Res. 2013, 20, 61–66. [Google Scholar] [CrossRef]
- Galdo, M.I.L.; Castro-Santos, L.; Vidal, C.G.R. Numerical analysis of NOx reduction using ammonia injection and comparison with water injection. J. Mar. Sci. Eng. 2020, 8, 109. [Google Scholar] [CrossRef]
- Lamas, M.I.; Rodriguez, C.G.; Telmo, J.; Rodriguez, J.D. Numerical analysis emissions from marine engines using alternative fuels. Pol. Marit. Res. 2015, 22, 48–52. [Google Scholar] [CrossRef]
- Lamas, M.I.; Rodriguez, C.G.; Rodriguez, J.D.; Telmo, J. Internal modifications to reduce pollutant emissions from marine engines. A numerical approach. Int. J. Nav. Archit. Mar. Eng. 2013, 5, 493–501. [Google Scholar] [CrossRef]
- Heywood, J. Internal Combustion Engine Fundamentals, 2nd ed.; McGraw-Hill Education: New York, NY, USA, 2018. [Google Scholar]



| Requirement | Sub-Requirement |
|---|---|
| SFC (50%) | SFC (100%) |
| Emissions (50%) | NOx (33.3%) |
| CO (33.3%) | |
| HC (33.3%) |
© 2020 by the authors. Licensee MDPI, Basel, Switzerland. This article is an open access article distributed under the terms and conditions of the Creative Commons Attribution (CC BY) license (http://creativecommons.org/licenses/by/4.0/).
Share and Cite
Lamas Galdo, M.I.; Castro-Santos, L.; Rodríguez Vidal, C.G. Selection of an Appropriate Pre-Injection Pattern in a Marine Diesel Engine Through a Multiple-Criteria Decision Making Approach. Appl. Sci. 2020, 10, 2482. https://doi.org/10.3390/app10072482
Lamas Galdo MI, Castro-Santos L, Rodríguez Vidal CG. Selection of an Appropriate Pre-Injection Pattern in a Marine Diesel Engine Through a Multiple-Criteria Decision Making Approach. Applied Sciences. 2020; 10(7):2482. https://doi.org/10.3390/app10072482
Chicago/Turabian StyleLamas Galdo, María Isabel, Laura Castro-Santos, and Carlos G. Rodríguez Vidal. 2020. "Selection of an Appropriate Pre-Injection Pattern in a Marine Diesel Engine Through a Multiple-Criteria Decision Making Approach" Applied Sciences 10, no. 7: 2482. https://doi.org/10.3390/app10072482
APA StyleLamas Galdo, M. I., Castro-Santos, L., & Rodríguez Vidal, C. G. (2020). Selection of an Appropriate Pre-Injection Pattern in a Marine Diesel Engine Through a Multiple-Criteria Decision Making Approach. Applied Sciences, 10(7), 2482. https://doi.org/10.3390/app10072482


