Abstract
Highly sensitive biosensor systems are particularly sensitive to the charge state of an analyte. This charge state can have either a positive (for instance, in case of increasing the efficiency of fishing of low-abundant proteins) or negative effect (for instance, in case of the appearance of charge jumps upon the injection of analyte solution into a measuring cell, what can cause undesirable parasitic signals). Previously, it was demonstrated that upon the pumping of analyte solution through polymeric communications of biosensors with a peristaltic pump at a low (~1 mL/min) flow rate, an accumulation of charge, transferred by the liquid drops from the feeding system into the measuring cell, is observed. At this point, the time dependence of charge accumulation has a linear-stepwise form. In the present study, the influence of the flow rate of water on the parameters of the time dependence of the accumulation of charge in such a system—including the influence on the stepwise charge accumulation—has been investigated. The measurements have been performed with a highly sensitive electrometer sensor at 38 °C, which corresponds to a pathological state of a human body. It has been found that a linear-stepwise time dependence of charge accumulation is observed in a wide range of water flow rates (V= 0.9 to 7.2 mL/min). At that point, upon increasing the flow rate with the transition from the drop-by-drop mode of water supply (0.9 mL/min) to the jet flow (7.2 mL/min), an increase in the absolute value of accumulated charge is observed, but the magnitude of the charge jumps does not change significantly. Thus, the amount of charge accumulated in the cell ambiguously depends on the water flow rate—i.e., this dependence can be non-linear. Accounting for the discovered phenomenon is important in the development of new, more accurate models describing physicochemical properties of aqueous solutions and hemodynamics. This effect should also be taken into account in the development of highly sensitive diagnostic systems intended for the detection of single biomarkers of pathologies in humans and crops, as well as in other living systems. In low-concentration systems, the occurrence of a charge can become a significant factor affecting the efficiency of detection of biomolecules and the reliability of the data obtained. The detection of biomolecules present in the solution at low concentrations is in high demand in medical diagnostics for the revelation of biomarkers at the early asymptomatic stage of various diseases, including aggressive forms of cancer.
1. Introduction
Modern proteomic and biosensor systems (including chromato-mass-spectrometric and atomic force microscopy (AFM)-based ones, nanowire biosensors, etc.) allow one to detect proteins in water and water solutions with an ultra-high (10−18 to 10−15 M) concentration sensitivity [1,2,3,4,5,6].
As a rule, in such systems, polymeric communications and various pumps are employed to supply the solutions to be analyzed. In the supply systems, the liquid flow rate varies over a wide range. So, in chromatography systems employing standard columns (for instance, with an i.d. of 4.6 mm), combined with registration sensor systems, the fluid flow rate is within 0.1 to 10 mL/min [7]. In systems for AFM-based fishing, this rate can be of the order of 1 mL/min [8]. The liquid supply can be organized with an even higher flow rate to provide the efficient delivery of the target analyte molecules to the sensitive area of the sensor chip: for instance, in a nanowire system, this rate can achieve tens of milliliters per minute [6]. In analytical systems based on AFM and nanowire detectors, the liquid is supplied into the measuring cell with an injector represented by a plastic tip for an automatic pipette. As was discussed in the literature, upon the motion of a liquid along a solid surface, a charge separation occurs due to a triboelectric effect; this effect was considered in many papers [9,10,11,12,13,14,15,16,17,18,19,20,21,22,23,24,25,26]. In the literature, triboelectric phenomena or an electric charge transfer between two materials during friction is commonly described from the viewpoint of physicochemical processes. In this way, to describe the liquid flow electrification, in the paper by Paillat et al. [24], the authors discussed the formation of a double electric layer in a liquid, flowing through pipes, owing to the interaction of ions (present in the liquid) with atoms of the pipes’walls [25]. After solving a system of equations describing association/dissociation in the liquid and desorption from/adsorption onto the solid surface, the authors dwelled an equation expressing the wall current density; the latter is proportional to the difference between the charge density in the diffusion layer and wall space charge density. In the paper by Ravelo et al. [26], the authors demonstrated that the voltage, occurring upon pumping of water through a plastic pipe with a pump, was linearly dependent on the flow rate. In the same paper, it was theoretically justified that the current, occurring upon the liquid flow, is proportional to the pressure gradient, and is connected with hydromechanical parameters (including the pipe length). Micropipette tips are often used in bioanalytical devices for the injection of biological samples into a measuring cell. In these injectors, a generation of charge is also observed. It is caused by triboelectric effects, as discussed in [27]. In this way, Choi et al. [27] discussed several mechanisms of charge generation, occurring upon the flowing of a liquid through a plastic pipette tip. One of these mechanisms is found in the accumulation of static charge on the tip nozzle before the aspiration of the liquid. The electrization of the inner surface of the pipette tip during the contact of its ionized surface groups with water is assumed to be another possible source of charge. In [27], the electrization of a liquid upon its injection is mainly caused by the ionization of surface chemical groups of the pipette tip. In the paper by Choi et al., the influence of air humidity on charge generation was also studied. A relatively weak dependence of the generation of charge in a liquid drop on the air humidity was shown. At the same time, the amount of charge carried by the drop was shown to be dependent on the coating material of the pipette tip. As was noted by the authors [27], their results are in contradiction with commonly accepted assumptions (which state the electrization of the drop is caused not by pre-developed charges on the pipette, but by the distribution of charges between the drop and the pipette tip surface).
Such a triboelectric effect, described above, occurring upon the injection of a liquid with pipette tips, should also take place in nanotechnological highly sensitive atomic force microscopy (AFM)-based and nanowire biosensors, which are promising for the early diagnosis of diseases. In such biosensors, when an electric charge is generated in the supply system, it is supposed to play an important positive role in providing highly sensitive protein detection [2,28]. So, in [28], we demonstrated that a correlation is observed between the amount of protein, captured onto the sensor chip in the system for AFM-based fishing, and the charge generated per single protein particle. In a number of papers, the negative effects of charge jumps—which occur upon the injection of solutions into a highly sensitive biosensor (for instance, into a nanowire-based one)—were demonstrated. Negative effects can lead to a significant change in the baseline signal during measurements [29,30]. Such charge jumps can even cause a failure in nanowire biosensors, particularly if the nanowire thickness is very low (of the order of 100 nm).
Previously, we demonstrated [30,31,32] that at a temperature of between 35 °C and 38 °C and a continuous supply of either water or highly diluted (femtomolar) protein solutions with a low (0.9 mL/min) flow rate, a stepwise accumulation of charge in the measuring cell of such biosensors can be observed. At this point, the appearance and magnitude of the charge jumps depends on the distance between the tip nozzle of the supply system and the grounded electrode [31].
In the present study, we report the results of the continuation of our research on the appearance of charge jumps upon the injection of solutions obtained not at a fixed flow rate, but at varying the flow rate over a broad range. The dependence of the amount of charge—generated in such an analyte supply system—on the liquid flow rate has been determined. In the experiments, the specially made highly sensitive measurement system based on an electrometer is also employed. The measurements have been carried out at a temperature of 38 °C, which is often used in biosensor measurements and corresponds to a pathological state of a human body. It has been demonstrated that upon supplying water with varying its flow rate over a broad range (from 0.9 to 7.2 mL/min), a linear-stepwise accumulation of charge in the measuring cell can be observed. It has been found that, upon transition from the drop-by-drop mode of water injection to the jet flow, with increasing the supply flow rate, the amount of charge accumulated in the measuring cell also increases. At that point, the magnitude of the jumps in the time dependence of charge accumulation does not depend on the supply flow rate. The results obtained herein should be taken into account in the development of highly sensitive protein detection systems, including those for AFM-based fishing and nanowire detectors. Highly sensitive protein detection systems are in high demand in the field of early medical diagnosis of diseases such as brain cancer, prostate cancer and other aggressive oncological pathologies. The results obtained herein can also be used in the development of refined models of hemodynamics.
2. Materials and Methods
2.1. Chemicals
Ultrapure deionized water (with 18 MΩ×cm resistivity) was obtained with a Millipore Simplicity UV deionizer (Millipore, Molsheim, France).
2.2. Charge Measurements
Schematic representation of the experimental setup, used to measure the amount of charge in the measuring cell, is shown in Figure 1.
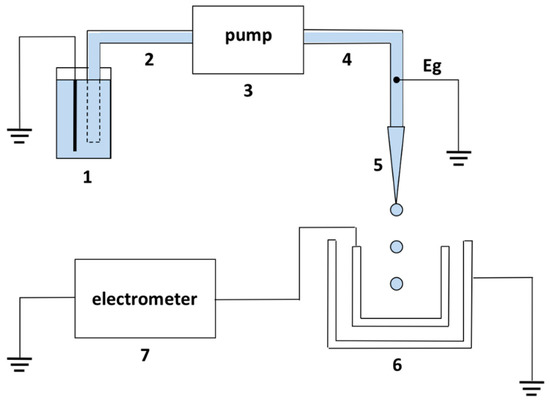
Figure 1.
Experimental setup. 1 is the reservoir with water; 2 is the silicone pipe (input section); 3 is the peristaltic pump; 4 is the silicone pipe (output section); 5 is the tip; 6 is the measuring cell with the connected electrometer; 7 is the electrometer; and Eg is the grounding electrode placed at a 15-cm distance from the tip nozzle orifice.
The charge measurements were carried out with a highly sensitive electrometer connected to a flow-based sample injection system for atomic force microscopy (AFM)-based fishing. The flow-based system was based on polymeric communications [32] (see Figure 1). The main elements of the sample supply system were: a peristaltic pump; a pipe with a tip for water supply; and a measuring cell. In the course of measurements, water was continuously pumped from a 50-mL polypropylene reservoir (1) into the cell (6) through the tip (5) with an Ismatech (IDEX) peristaltic pump (3). A sterile silicone pipe (4) (40 cm length, 2 mm i.d.) with a polypropylene tip (5) (a standard disposable Eppendorf-type pipette tip with a nominal capacity of 10 µl and nozzle diameter Ø = 0.4 mm) was used to supply water into the cell. The volume flow rate was varied from 0.9 to 7.2 mL/min, which corresponds to the linear velocity of the flow through the nozzle from 0.12 to 0.96 m/s. To maintain a constant level of the potential in the reservoir (1) with water, from which water was supplied into the supply pipe, a grounding electrode (Eg) was inserted into the pipe. The distance between the electrode in the pipe and the tip nozzle orifice was 15 cm. The stainless steel cell (6) served as an inner cylinder in the system, connected with the electrometer (7). In general, the measurement system was analogous to that used in [32]. The charge was registered in the cell by means of an electric system (7) based on an electrometer developed in Institute of Biomedical Chemistry (IBMC). The charge measurement accuracy was 0.1 nC. Water temperature was set and maintained constant with a thermostat, into which the reservoir was placed (1). Experiments were carried out at 38 °C. The duration of the preliminary equilibration of the system under the experimental conditions was no less than two hours. The duration of one measurement was seven minutes. The experimental series for each set of conditions comprised at least three repetitions.
The experiment technique was as follows. The system was filled with water from the reservoir (1), and flushed with ~10 mL of water. After the flush, the supplying system remained filled with water. Water was removed from the measuring cell with a pipette. Firstly, control measurements of the signal baseline for an empty cell were performed (three repetitions). Then, the pump was turned on, and water was supplied into the cell. From the moment the pump is turned on, the experiment time counting and recording the readings of the measuring system from the electrometer display started. Recording was performed with a 15-s interval during 7 min. After finishing the measurements in one experiment, the readings were reset. The so-obtained data were present in the form of time dependencies of the amount of charge entering the measuring cell ∆q(t). The measuring cell was empty. After each measurement, the cell was emptied, and the charge was drained to prepare the next measurement in a series.
3. Results
In the present study, monitoring the generation and accumulation of charge in the cell in the water supply system was performed at the following flow rates: 0.9, 1.8, 3.6, 5.4 and 7.2 mL/min. The corresponding ∆q(t) dependencies are shown in Figure 2.
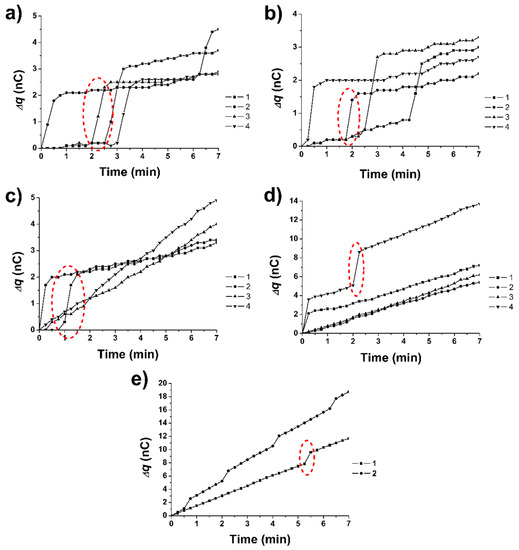
Figure 2.
Typical time dependencies of charge accumulation (∆q) obtained upon the pumping of water with various flow rates: 0.9 mL/min (a), 1.8 mL/min (b), 2.7 mL/min (c), 3.6 mL/min (d), 5.4 mL/min and 7.2 mL/min (e). Red dashed ellipses indicate typical charge jumps. Numbers 1 to 4 indicate curves obtained in different technical replicates of the experiments.
As seen from Figure 2a–e, a linear-stepwise mode of charge accumulation (which we observed earlier at the 0.9 mL/min flow rate [30]) is observed over the entire range of flow rates studied. In Figure 2a (curve 1), for instance, from 0 to 2.5 min, a linear, slowly increasing section of the curve with a gradient (∆q/∆t) of ~0.1 nC/min is observed. This is followed by a ~2.5-nC jump with a 5 nC/min gradient for 0.5 min. Then, a further slow linear increase in charge accumulation with a gradient of (∆q/∆t) ~0.2 nC/min is observed. For curve 2, a stepwise accumulation of charge is observed from the very start of the observation time. For curves 3 and 4 in Figure 2a, the appearance of jumps is observed from the second and third minutes, respectively. For all these curves, the amplitude of a jump was roughly of the order of 2 to 3 nC. For the four curves in Figure 2a, the total amount of charge (∆q) accumulated in the measuring cell for seven minutes was of the order of ∆q =2.7 to 4.2 nC.
A similar situation was observed for a water supply rate of 1.8 mL/min (see Figure 2b). The appearance of jumps is observed for all four curves. So, for curve 1, after the phase of slow accumulation of charge in the measuring cell with a gradient (∆q/∆t) of ~0.7 nC/4 min, an appearance of a jump with a ∆q~1.5 nC amplitude and (∆q/∆t) ~3 nC/min gradient for 0.5 min is observed at the 4th min. For the four curves in Figure 2b, the total amount of charge accumulated in the measuring cell during the measurement time was of the order of ∆q =2.2 to 3.2 nC.
For the flow rate of 2.7 mL/min, both linear (curves 3 and 4) and linear-stepwise (curves 1 and 2) modes of charge accumulation in the measuring cell are observed. For the linear mode, charge accumulation with gradients (∆q/∆t) of 3.5 nC/7 min (curve 3) and 4.5 nC/7 min (curve 4) is characteristic, while for the linear-stepwise one, the appearance of jumps at the 1st min (curve 1), or even at the very start of the measurement (curve 2), is typical. For the four curves in Figure 2c, the total amount of charge accumulated in the measuring cell for 7 min was from ∆q =2.2 to 3.2 nC.
It is to be noted that a drop-by-drop mode of water injection from the tip into the measuring cell was observed at flow rates from 0.9 to 2.7 mL/min. With further increase of the flow rate, in the range from 3.6 to 5.4 mL/min, a jet flow of water from the tip is observed.
As seen from Figure 2d,e, despite the drop-by-drop mode of liquid flow from the tip changed to the jet flow, this did not lead to a disappearance of the stepwise accumulation of charge in the measuring cell. So, for a water flow rate of 3.6 mL/min, a linear-stepwise mode of charge accumulation (curves 1 and 4, Figure 2d) is observed alongside with a linear one (curves 2 and 3). For curve 1, the magnitude of the jump was of the order of 2 nC with a gradient of (∆q/∆t)~2 nC/0.25 min for 0.25 min. At the same time, for curve 4 (Figure 2d), the appearance of two jumps with greater (3.6 nC/0.25 min) amplitude was observed. The total magnitude of the two jumps amounted to 3.6 nC. The total amount of accumulated charge accumulated during the observation time of seven minutes was from ∆q = 5 to 14 nC.
For the flow rates of 5.4 mL/min and 7.2 mL/min (Figure 2e), a linear-stepwise mode of charge accumulation, with jumps with a gradient (∆q/∆t)~ 4 nC/0.5 min, was observed. The total amount of charge accumulated in 7 min makes up ∆q=11.7 nC for 5.4 mL/min, and ∆q=18.7 nC for a 7.2 mL/min flow rate.
Table 1 summarizes characteristic values of charge accumulation rate (both in linear and in linear-stepwise modes) for the entire range of water flow rates. Table 2 lists the same data on the charge accumulation, normalized per the flow rate of water.

Table 1.
Results of measurements of charge accumulated in the measuring cell at various flow rates of water.
Table 2.
Measurements of charge accumulated in the measuring cell, normalized per water flow rate (V).
4. Discussion
In our previous studies, we demonstrated that under certain conditions, upon the pumping of water through an injector with a peristaltic pump in the drop-by-drop mode at 0.9 mL/min flowrate and a temperature of 38 °C, an accumulation of charge in the measuring cell has a linear-stepwise character [30]. The temperature of 38 °C is interesting, owing to the fact that it is near the viscosity-associated characteristic temperature point of water [33,34]. In the present work, the research on charge accumulation in the flow-based system for atomic force microscopy (AFM)-based fishing has been continued, and the influence of flow rate has been studied in a wide range from 0.9 to 7.2 mL/min has been studied. Table 1 and Table 2 summarize the data obtained herein.
As seen from Table 1, a linear-stepwise increase in the amount of charge is observed over the entire range of water flow rates. At this point, a tendency for an increase in the amount of charge (∆q) accumulated in the measuring cell during the measurement time upon the transition from the drop-by-drop injection mode to the jet one is observed (Table 1, row 4). That is, the absolute value of accumulated charge increases with the increasing flow rate. However, the magnitude of a separate jump of charge (~2 nC) remains constant in all the measurements (Table 1, row 2). Such a constancy in jumps’magnitude is observed even upon an eight-fold increase of the supply flow rate (Table 1, row 3). At the same time, an increase in the charge accumulation rate vs. water flow rate dependence is observed in the linear sections (Table 1, row 1).
Table 2 lists the parameters of the obtained dependencies (listed in Table 1), normalized per the water flow rate. One can see that the stepwise change in the amount of charge, normalized per the flow rate, is significantly decreased with increasing the flow rate (Table 2, rows 2 and 3). As seen from Table 2, linear sections of the listed dependencies are virtually unchanged, with an eight-fold increase of the flow rate from 0.9 to 7.2 mL/min (Table 2, row 1). That is, the amount of charge accumulated in the measuring cell is ambiguously dependent on the water flow rate, i.e., this dependence can be nonlinear.
As discussed previously in [32], the appearance of jumps in the time dependence of the amount of the accumulated charge can be caused by the probability of the fact that the charge comes out of the injector nozzle in the presence of an electrohydrodynamic barrier occurring in the injector. The physical cause for the presence of this barrier, in its turn, can be conditioned by several factors, such as the presence of a negative charge on the polymeric surface of the injector [27], or a possible change in the viscosity of water upon its ortho-para conversion occurring in the course of operation of the peristaltic pump during the compression of the supply pipe. Negative charges are present on a polymer surface. They can hold positive charges in the liquid, thus creating a barrier during the formation of a positively charged drop [27]. This can be particularly sharply pronounced within the peristatic pump, where the pump rollers significantly squeeze the feeding pipe, thereby significantly distorting the fluid flow near the boundary layer. Another cause of the charge jumps is connected with the ortho-para conversion of water, and leads to a shift in the equilibrium in the boundary layer under the action of the peristaltic pump—this can be explained in a way analogous to [33]. In the paper by Pershin et al. [33], it is noted that under the action of a pipette (and in our case, under the action of the peristaltic pump), a change in the hydration surface layer can be observed. In [33], it is stated that there is a hydration shell near the surface of proteins, which represents an ice-like structure. At this point, it is known that the ortho/para ratio of 3:1, which is valid for gases at room temperature, shifts in water towards a more than twofold increase in the amount of para-H2O isomers. Thus, water represents a nonequilibrium liquid in terms of spin temperature. In such a state, water can therefore stepwisely change this ratio towards the equilibrium one, i.e., towards the increase in the amount of para-isomers—particularly under the influence of physical factors, such as an increase in temperature near the characteristic point of water (~37°C) upon the local pressure increase in the compression section of the peristaltic pump. Accordingly, upon passing through a peristaltic pump, a local conversion of ortho-para isomers can occur in water, what causes a corresponding jump in charge. Stepwise jumps are sometimes not reproducible—possibly due to the fact that their formation is affected by the simultaneous combination of several processes. Two of these processes we have described above; others, possibly, have not been described herein, and further investigation of these processes is required.
Ortho-para conversion in water, associated with the anomalous properties of water (which has a complex heterostructure), is described in [33,34]. Since the studied range of supply flow rates is typical not only for systems for AFM-based fishing, but also for other proteomic detection systems (chromatographic, chromato-mass-spectrometric, nanowire-based ones, etc.), the data obtained in these studies can be used in the development of novel highly efficient systems for the detection of biomarkers in patients’blood.
Another factor provoking interest to the studies on the dependence of charge generation on the flow rate in a wide range of flow rates is the fact that in the human body, the rate of blood flow through the vessels makes up from ~0.5 m/s (aorta) down to the value of several orders of magnitude lower (0.5 mm/s in capillaries [35]). Thus, studying the dependence of charge generation on the liquid flow rate is of great interest for the development and refinement of hemodynamic models in the body.
5. Conclusions
It has been demonstrated that, upon the use of peristaltic pumps in biosensors during repeated experiments in the same series using the same communication, charge generation can vary significantly. This can lead to variation in the results obtained with these biosensors, due to the variation in their operating parameters (for instance, the operation point of a nanowire transistor, whose surface represents a virtual gate sensitive to the charge of an analyte). It has been found that a charge generated in plastic components of a sample supply system is transferred into the measuring cell of a flow-based system during a continuous supply of water. The charge accumulation has been shown to occur not only linearly, but also stepwisely over a wide range of flow rates (from 0.9 to 7.2 mL/min). This phenomenon has been observed for both drop-by-drop and jet flow modes of water supply.
This effect should be taken into account in the development of flow-based highly sensitive diagnostic systems for the detection of biomolecules present in solution at low concentrations. In such low-concentration systems, the appearance of a charge can become a significant factor affecting both the sensitivity of the system and the detection efficiency, as well as the reliability of the data obtained. In its turn, the detection of biomolecules present in the solution at low concentration is in high demand in diagnostics for the revelation of a pathological process at an early asymptomatic stage in humans and crops.
Author Contributions
Conceptualization, Y.D.I.; Data curation, A.F.K. and R.A.G.; Formal analysis, A.A.V.; Investigation, A.F.K., R.A.G., A.A.V. and T.O.P.; Methodology, T.O.P.; Project administration, Y.D.I.; Supervision, Y.D.I.; Validation, A.A.V.; Visualization, A.F.K.; Writing—original draft, Y.D.I. and T.O.P. All authors have read and agreed to the published version of the manuscript.
Funding
The present study was funded by the Program for Basic Research of State Academies of Sciences for 2013–2020.
Conflicts of Interest
The authors declare no conflict of interest.
References
- Kopylov, A.T.; Zgoda, V.G.; Lisitsa, A.V.; Archakov, A.I. Combined use of irreversible binding and MRM technology for low- and ultralow copy-number protein detection and quantitation. Proteomics 2013, 13, 727–742. [Google Scholar] [CrossRef] [PubMed]
- Pleshakova, T.O.; Malsagova, K.A.; Kaysheva, A.L.; Kopylov, A.T.; Tatur, V.Y.; Ziborov, V.S.; Kanashenko, S.L.; Galiullin, R.A.; Ivanov, Y.D. Highly sensitive protein detection by biospecific AFM-based fishing with pulsed electrical stimulation. FEBS Open Bio 2017, 7, 1186–1195. [Google Scholar] [CrossRef] [PubMed]
- Pleshakova, T.O.; Malsagova, K.A.; Kozlov, A.F.; Kanashenko, S.L.; Ivanova, N.D.; Sadovskaya, T.A.; Archakov, A.I.; Ivanov, Y.D. Highly sensitive AFM-fishing of albumin. Pathogenesis 2016, 14, 23–30. [Google Scholar]
- Archakov, A.I.; Ivanov, Y.D.; Lisitsa, A.V.; Zgoda, V.G. Biospecific irreversible fishing coupled with atomic force microscopy for detection of extremely low-abundant proteins. Proteomics 2009, 9, 1326–1343. [Google Scholar] [CrossRef]
- Ivanov, Y.D.; Pleshakova, T.O.; Kozlov, A.F.; Malsagova, K.A.; Krohin, N.V.; Shumyantseva, V.V.; Shumov, I.D.; Popov, V.P.; Naumova, O.V.; Fomin, B.I.; et al. SOI nanowire for the high-sensitive detection of HBsAg and α-fetoprotein. Lab Chip 2012, 12, 5104–5111. [Google Scholar] [CrossRef]
- Ivanov, Y.D.; Pleshakova, T.O.; Malsagova, K.A.; Kozlov, A.F.; Kaysheva, A.L.; Shumov, I.D.; Galiullin, R.A.; Kurbatov, L.K.; Popov, V.P.; Naumova, O.V.; et al. Detection of marker miRNAs in plasma using SOI—NW biosensor. Sens. Actuators B Chem. 2018, 261, 566–571. [Google Scholar] [CrossRef]
- Böcker, J. Chromatographie. Instrumentelle Analytik mit Chromatographie und Kapillarelektrophorese; Vogel Industrie Medien GmbH & Co KG: Wurzburg, Germany, 1997. [Google Scholar]
- Ivanov, Y.D.; Pleshakova, T.O.; Malsagova, K.A.; Kaysheva, A.L.; Kopylov, A.T.; Izotov, A.A.; Tatur, V.Y.; Vesnin, S.G.; Ivanova, N.D.; Ziborov, V.S.; et al. AFM-based protein fishing in the pulsed electric field. Biochem. Suppl. Ser. B Biomed. Chem. 2015, 9, 121–129. [Google Scholar] [CrossRef]
- Suh, Y.K. Numerical study on transient induced-charge electro-osmotic flow in a cavity. Coll. Surf. A Physicochem. Eng. Asp. 2011, 376, 111–121. [Google Scholar] [CrossRef]
- Sow, M.; Widenor, R.; Kumar, A.; Lee, S.W.; Lacks, D.J.; Sankaran, R.M. Strain-Induced Reversal of Charge Transfer in Contact Electrification. Angew. Chem. Int. Ed. 2012, 51, 2695–2697. [Google Scholar] [CrossRef]
- Sood, A.K.; Ghosh, S.; Das, A. Flow-driven voltage generation in carbon nanotubes. Pramana 2005, 65, 571–579. [Google Scholar] [CrossRef]
- Steffes, C.; Baier, T.; Hardt, S. Enabling the enhancement of electroosmotic flow over superhydrophobic surfaces by induced charges. Coll. Surf. A Physicochem. Eng. Aspects 2011, 376, 85–88. [Google Scholar] [CrossRef]
- Leung, K. Surface Potential at the air-water interface computed using density functional theory. J. Phys. Chem. Lett. 2010, 1, 496–499. [Google Scholar] [CrossRef]
- Knorr, N. Squeezing out hydrated protons: Low-frictional-energy triboelectric insulator charging on a microscopic scale. AIP Adv. 2011, 1, 022119. [Google Scholar] [CrossRef]
- McCarty, L.S.; Whitesides, G.M. Electrostatic charging due to separation of ions at interfaces: Contact electrification of ionic electrets. Angew. Chem. Int. Ed. 2008, 47, 2188–2207. [Google Scholar] [CrossRef]
- Sun, Q.; Wang, D.; Li, Y.; Zhang, J.; Ye, S.; Cui, J.; Chen, L.; Wang, Z.; Butt, H.-J.; Vollmer, D.; et al. Surface charge printing for programmed droplet transport. Nat. Mater. 2019, 18, 936–941. [Google Scholar] [CrossRef]
- Diaz, A.F.; Felix-Navarro, R.M. A semi-quantitative tribo-electric series for polymeric materials: The influence of chemical structure and properties. J. Electrost. 2004, 62, 277–290. [Google Scholar] [CrossRef]
- Lyklema, J. Fundamentals of Interface and Colloid Science: Soft Colloids; Elsevier: Amsterdam, The Netherlands, 2005; Volume 5. [Google Scholar]
- Lin, Z.-H.; Cheng, G.; Lee, S.; Pradel, K.C.; Wang, Z.L. Harvesting water drop energy by a sequential contact-electrification and electrostatic-induction process. Adv. Mater. 2014, 26, 4690–4696. [Google Scholar] [CrossRef]
- Moon, J.K.; Jeong, J.; Lee, D.; Pak, H.K. Electrical power generation by mechanicallymodulating electrical double layers. Nat. Commun. 2013, 4, 1487. [Google Scholar] [CrossRef]
- Moon, J.K.; Song, M.W.; Pak, H.K. Investigation of surface charge density on solid–liquid interfaces by modulating the electrical double layer. J. Phys. Condens. Matter. 2015, 27, 194102. [Google Scholar] [CrossRef]
- Banpurkar, A.G.; Sawane, Y.; Wadhai, S.M.; Murade, C.U.; Siretanu, I.; van den Ende, D.; Mugele, F. Spontaneous electrification of fluoropolymer–water interfaces probed by electrowetting. Faraday Discuss 2017, 199, 29–47. [Google Scholar] [CrossRef]
- Park, H.-Y.; Kim, H.K.; Hwang, Y.-H. Water-Through triboelectric nanogenerator based on ti-mesh for harvesting liquid flow. J. Korean Phys. Soc. 2018, 72, 499–503. [Google Scholar] [CrossRef]
- Paillat, T.; Touchard, G. Electrical charges and liquids motion. J. Electrost. 2009, 67, 326–334. [Google Scholar] [CrossRef]
- Touchard, G.; Patzek, T.W.; Radke, C.J. A physicochemical explanation for flow electrification in low-conductivity liquids. IEEE Trans. Ind. Appl. 1996, 32, 1051–1057. [Google Scholar] [CrossRef]
- Ravelo, B.; Duval, F.; Kane, S.; Nsom, B. Demonstration of the triboelectricity effect by the flow of liquid water in the insulating pipe. J. Electrost. 2011, 69, 473–478. [Google Scholar] [CrossRef]
- Choi, D.; Lee, H.; Im, D.J.; Kang, I.S.; Lim, G.; Kim, D.S.; Kang, K.H. Spontaneous electrical charging of droplets by conventional pipetting. Sci. Rep. 2013, 3, 1–7. [Google Scholar] [CrossRef] [PubMed]
- Ivanov, Y.D.; Pleshakova, T.; Malsagova, K.; Kozlov, A.; Kaysheva, A.; Kopylov, A.; Izotov, A.; Andreeva, E.; Kanashenko, S.; Usanov, S.; et al. Highly sensitive protein detection by combination of atomic force microscopy fishing with charge generation and mass spectrometry analysis. FEBS J. 2014, 281, 4705–4717. [Google Scholar] [CrossRef]
- Tian, R.; Regonda, S.; Gao, J.; Liu, Y.; Hu, W. Ultrasensitive protein detection using lithographically defined Si multi-nanowire field effect transistors. Lab Chip 2011, 11, 1952–1961. [Google Scholar] [CrossRef]
- Ivanov, Y.D.; Kozlov, A.F.; Galiullin, R.A.; Kolesanova, E.F.; Pleshakova, T.O. Spontaneous charge generation in flowing albumin solutions at 35°C and 38°C. Biosensors 2017, 7, 60. [Google Scholar] [CrossRef]
- Ivanov, Y.D.; Kozlov, A.F.; Galiullin, R.A.; Ivanova, N.D.; Tatur, V.Y.; Ziborov, V.S.; Yushkov, E.S.; Pleshakova, T.O. Generation and accumulation of charge in a flow system for detecting protein markers of diseases. Patologicheskaya Fiziologiya i Eksperimental’naya Terapiya (Pathol. Physiol. Exp. Ther. Rus. J.) 2017, 61, 167–175. [Google Scholar]
- Ivanov, Y.D.; Kozlov, A.F.; Galiullin, R.A.; Kanashenko, S.L.; Usanov, S.A.; Ivanova, N.D.; Ziborov, V.S.; Pleshakova, T.O. Spontaneous generation of charge in the flow-based AFM fishing system. J. Electrost. 2018, 91, 16–20. [Google Scholar] [CrossRef]
- Pershin, S. Conversion of ortho-para H2O isomers in water and a jump in erythrocyte fluidity through a microcapillary at a temperature of 36.6±0.3 °C. Phys. Wave Phenom. 2009, 17, 241–250. [Google Scholar] [CrossRef]
- Kholmanskiy, A.S. Two types of anomalous thermodynamics of water. Apriori. Ser. Iestestvennye i Tekhnicheskie Nauki 2015, 1, 1–17. (In Russian) [Google Scholar]
- Vorobyova, E.A.; Gubar, A.V.; Safyannikova, E.B. Anatomy and Physiology, 5th ed.; Meditsina: Moscow, Russia, 2009. [Google Scholar]
© 2020 by the authors. Licensee MDPI, Basel, Switzerland. This article is an open access article distributed under the terms and conditions of the Creative Commons Attribution (CC BY) license (http://creativecommons.org/licenses/by/4.0/).