Article

Micro-Raman Spectroscopy of Dental Implants Subjected to Different Surface Treatments

by
Saturnino Marco Lupi
1,*,
Pietro Galinetto
2,
Benedetta Albini
2,
Elisa Di Ronza
1,
Silvana Rizzo
1 and
Ruggero Rodriguez y Baena
1
1
Department of Clinical Surgical, Diagnostic and Pediatric Sciences, University of Pavia, P.le Golgi 2, 27100 Pavia, Italy
2
Department of Physics, University of Pavia, Via Bassi 6, 27100 Pavia, Italy
*
Author to whom correspondence should be addressed.
Appl. Sci. 2020, 10(7), 2417; https://doi.org/10.3390/app10072417
Submission received: 28 February 2020 / Revised: 21 March 2020 / Accepted: 27 March 2020 / Published: 1 April 2020
(This article belongs to the Special Issue Implantable Medical Device)

Abstract

:
The aim of the study was to qualitatively investigate the structure of the surface layer of TiO2 on dental implants made of Ti-6Al-4V subjected to different manufacturing treatments. M (machined), B (Al2O3-blasted), E (HNO3\HF-etched), B + E and A (B + E + anodized) implants and a further group receiving the same treatments as the first group with the addition of a final decontamination with cold plasma were included in the study. Examination was performed using micro-Raman spectroscopy. The surface treatments evaluated did not achieve the formation of crystalline TiO2. The increase in the complexity of surface treatment produced a proportional increase in the thickness of amorphous TiO2 oxide. In the B + E group, the plasma treatment enhanced the amorphous oxide thickness of TiO2. The other surfaces treated by plasma decontamination did not show a difference to the respective untreated ones. The investigated surface treatments did not change the crystalline cage of TiO2 in Ti-6Al-4V implants but affected the thickness of the oxide layer. The biological response could be influenced by different oxide thicknesses. Additional information on superficial TiO2 structural organization can be obtained by micro-Raman evaluation of dental implants. Dental implants with B + E + plasma and A superficial treatments allowed the maximum formation of the amorphous oxide thickness.

1. Introduction

From Brånemark’s initial studies, titanium represents the most-used material, although not the only one, for the production of endosseous dental implants [1,2,3]. Success rates with titanium implants are high in both the short and long term; moreover, they are indicated in many particular situations [4,5,6,7,8,9,10].
The native very thin (<10 nm) oxide layer of TiO2 gives features of exceptional biocompatibility to titanium [11,12,13,14]. Moreover, Ti and its alloys possess mechanical and chemical properties that make them ideal implant materials [15]. Commercially, pure titanium is classified into four grades by its stoichiometric composition, with grade one having the least (0.18%) and grade four having the most (0.4%); in addition, grade five titanium alloy (Ti-6Al-4V) is also used for commercially available dental implants [16,17]. Due to the presence of minimal quantities of contaminants, mechanical features of resistance increase from grade one to grade five [16,18]. Amorphous titanium oxide forms during normal ambient conditions on Ti; moreover, in nature, three crystalline phases of titanium dioxide exist, namely anatase, rutile and brookite; the latter is rarely found because of its metastable crystal structure [19,20].
Through the application of an appropriate heat treatment, amorphous TiO2 transforms to the anatase, thanks to its lower surface free energy compared to rutile, and then to the rutile phases. The anatase phase completely transforms into the rutile phase at 680 °C [20]. To obtain rutile at low temperatures, precipitation of crystalline TiO2 and hydrothermal methods are needed [21]. The biological effects of the morphological characteristics of the implant surfaces have been thoroughly investigated [17,22], while little information concerns the influence of the different polymorphic crystalline phases of TiO2 on osseointegration. The crystalline phase of TiO2 can influence bioactivity. Crystalline TiO2 appears to favor apatite deposition [13,23,24,25]. Anatase coating enhanced osseointegration in in-vivo studies in rabbits [26,27] and reduced marginal bone loss in humans [28].
Moreover, the anatase-coated surfaces proved to be more sensitive to UV light and showed a greater photocatalytic effect [29]. Recent studies have also shown that bacterial flora can be influenced by the titanium surface structure. Anatase exposed to near-UV light demonstrated a strong bactericidal effect [30,31]. Anatase-coated titanium surfaces significantly reduced the presence of bacteria on the subgingival and screw-threaded portion of healing screws in humans [32], but, recently, in a small-sample-size and short-term study in humans, antibacterial features of anatase-coated implant collars were only partially confirmed [28].
Literature on the relation between surface treatment and superficial oxide layer structure is scarce. Most clinical titanium implants have thin surface oxides and can therefore be expected to have essentially amorphous surface oxides. As the oxides’ thickness increases, a crystalline structure becomes possible [12].
Anodic oxidation (anodization) and thermal treatment demonstrated the ability to form a crystalline layer of TiO2 on commercial pure and alloy titanium surface [27,33,34,35].
Recently, anatase was clearly identified in two commercially available implants, with an anodizing surface treatment. The remaining surfaces (machined, acid-etched, blasted or plasma-sprayed) presented spectra that can be fitted only weakly or moderately to the rutile and/or amorphous TiO2 spectra. Moreover, this study does not disclose the alloy composition of each implant analyzed [36]. Another study on commercially available implants evaluated the structure of TiO2 by TEM. This study identified anatase on anodized and on blasted and acid-etched surfaces and rutile on machined surfaces [37].
Plasmas can be categorized as either thermal (hot) plasmas or cold (low-pressure) plasmas (CPs or LPPs) [38]. CP treatment allows surface activation while operating at low ambient temperatures, with an enhancement of the surface energy and an osteoblastic spread [39,40,41]. CP-treated titanium implant surfaces showed a significant reduction in surface-adsorbed C content and more uniform and higher osteogenic responses in vivo [42,43].
Raman Spectroscopy (RS) is a non-invasive and non-destructive method widely used to investigate the crystalline degree and quality of material [44,45], and in the case of TiO2, RS can identify its naturally occurring crystalline phases [20,46]. TiO2 anatase phase is tetragonal, with two chemical formula per unit cell (space group D194h(I41/amd)). Among its six Raman active modes (Table 1), the most intense is the Eg mode, peaked at 144 cm−1, whose linewidth is also correlated to the average grain size or crystalline disorder. The rutile structure is tetragonal, with two TiO2 units per cell, and space group D144h(P42/mnm) has four Raman active modes (Table 1) [46,47,48].
For the brookite structure, the lower symmetry and larger unit cell with respect to anatase and rutile cells result in a larger number of Raman active modes with a rich Raman spectrum. The reference Raman spectra for the three crystal cages of TiO2 are reported in Figure 1a. Recently, the TiO2 phases of the root surface of commercially available titanium dental implants, subjected to various surface treatments, were investigated by RS [18,36]. It has been proposed that the rapid formation of the oxide layer during manufacturing leads to an amorphous TiO2 layer on implant surfaces [19,36], but information on the formation of TiO2 phases during manufacturing stages is extremely limited.
Therefore, although the presence of TiO2 has been identified as responsible for osseointegration, little is known about the quality of this TiO2 or the relationship between the crystallographic conformation of TiO2 and the surface treatment carried out. Since the crystalline conformation of TiO2 could have interesting biological effects, in this study we tried to evaluate its presence following different commonly performed surface treatments.
The aim of this article is to evaluate the presence and transformation of TiO2 at the implant surface at different manufacturing stages by means of RS. The sampled thicknesses are strongly reduced by the highly inhomogeneous surfaces of the samples, and we estimate scattering volume heights of the order of tens of nanometers, markedly reduced with respect to the typical focus depth in transparent materials.

2. Materials and Methods
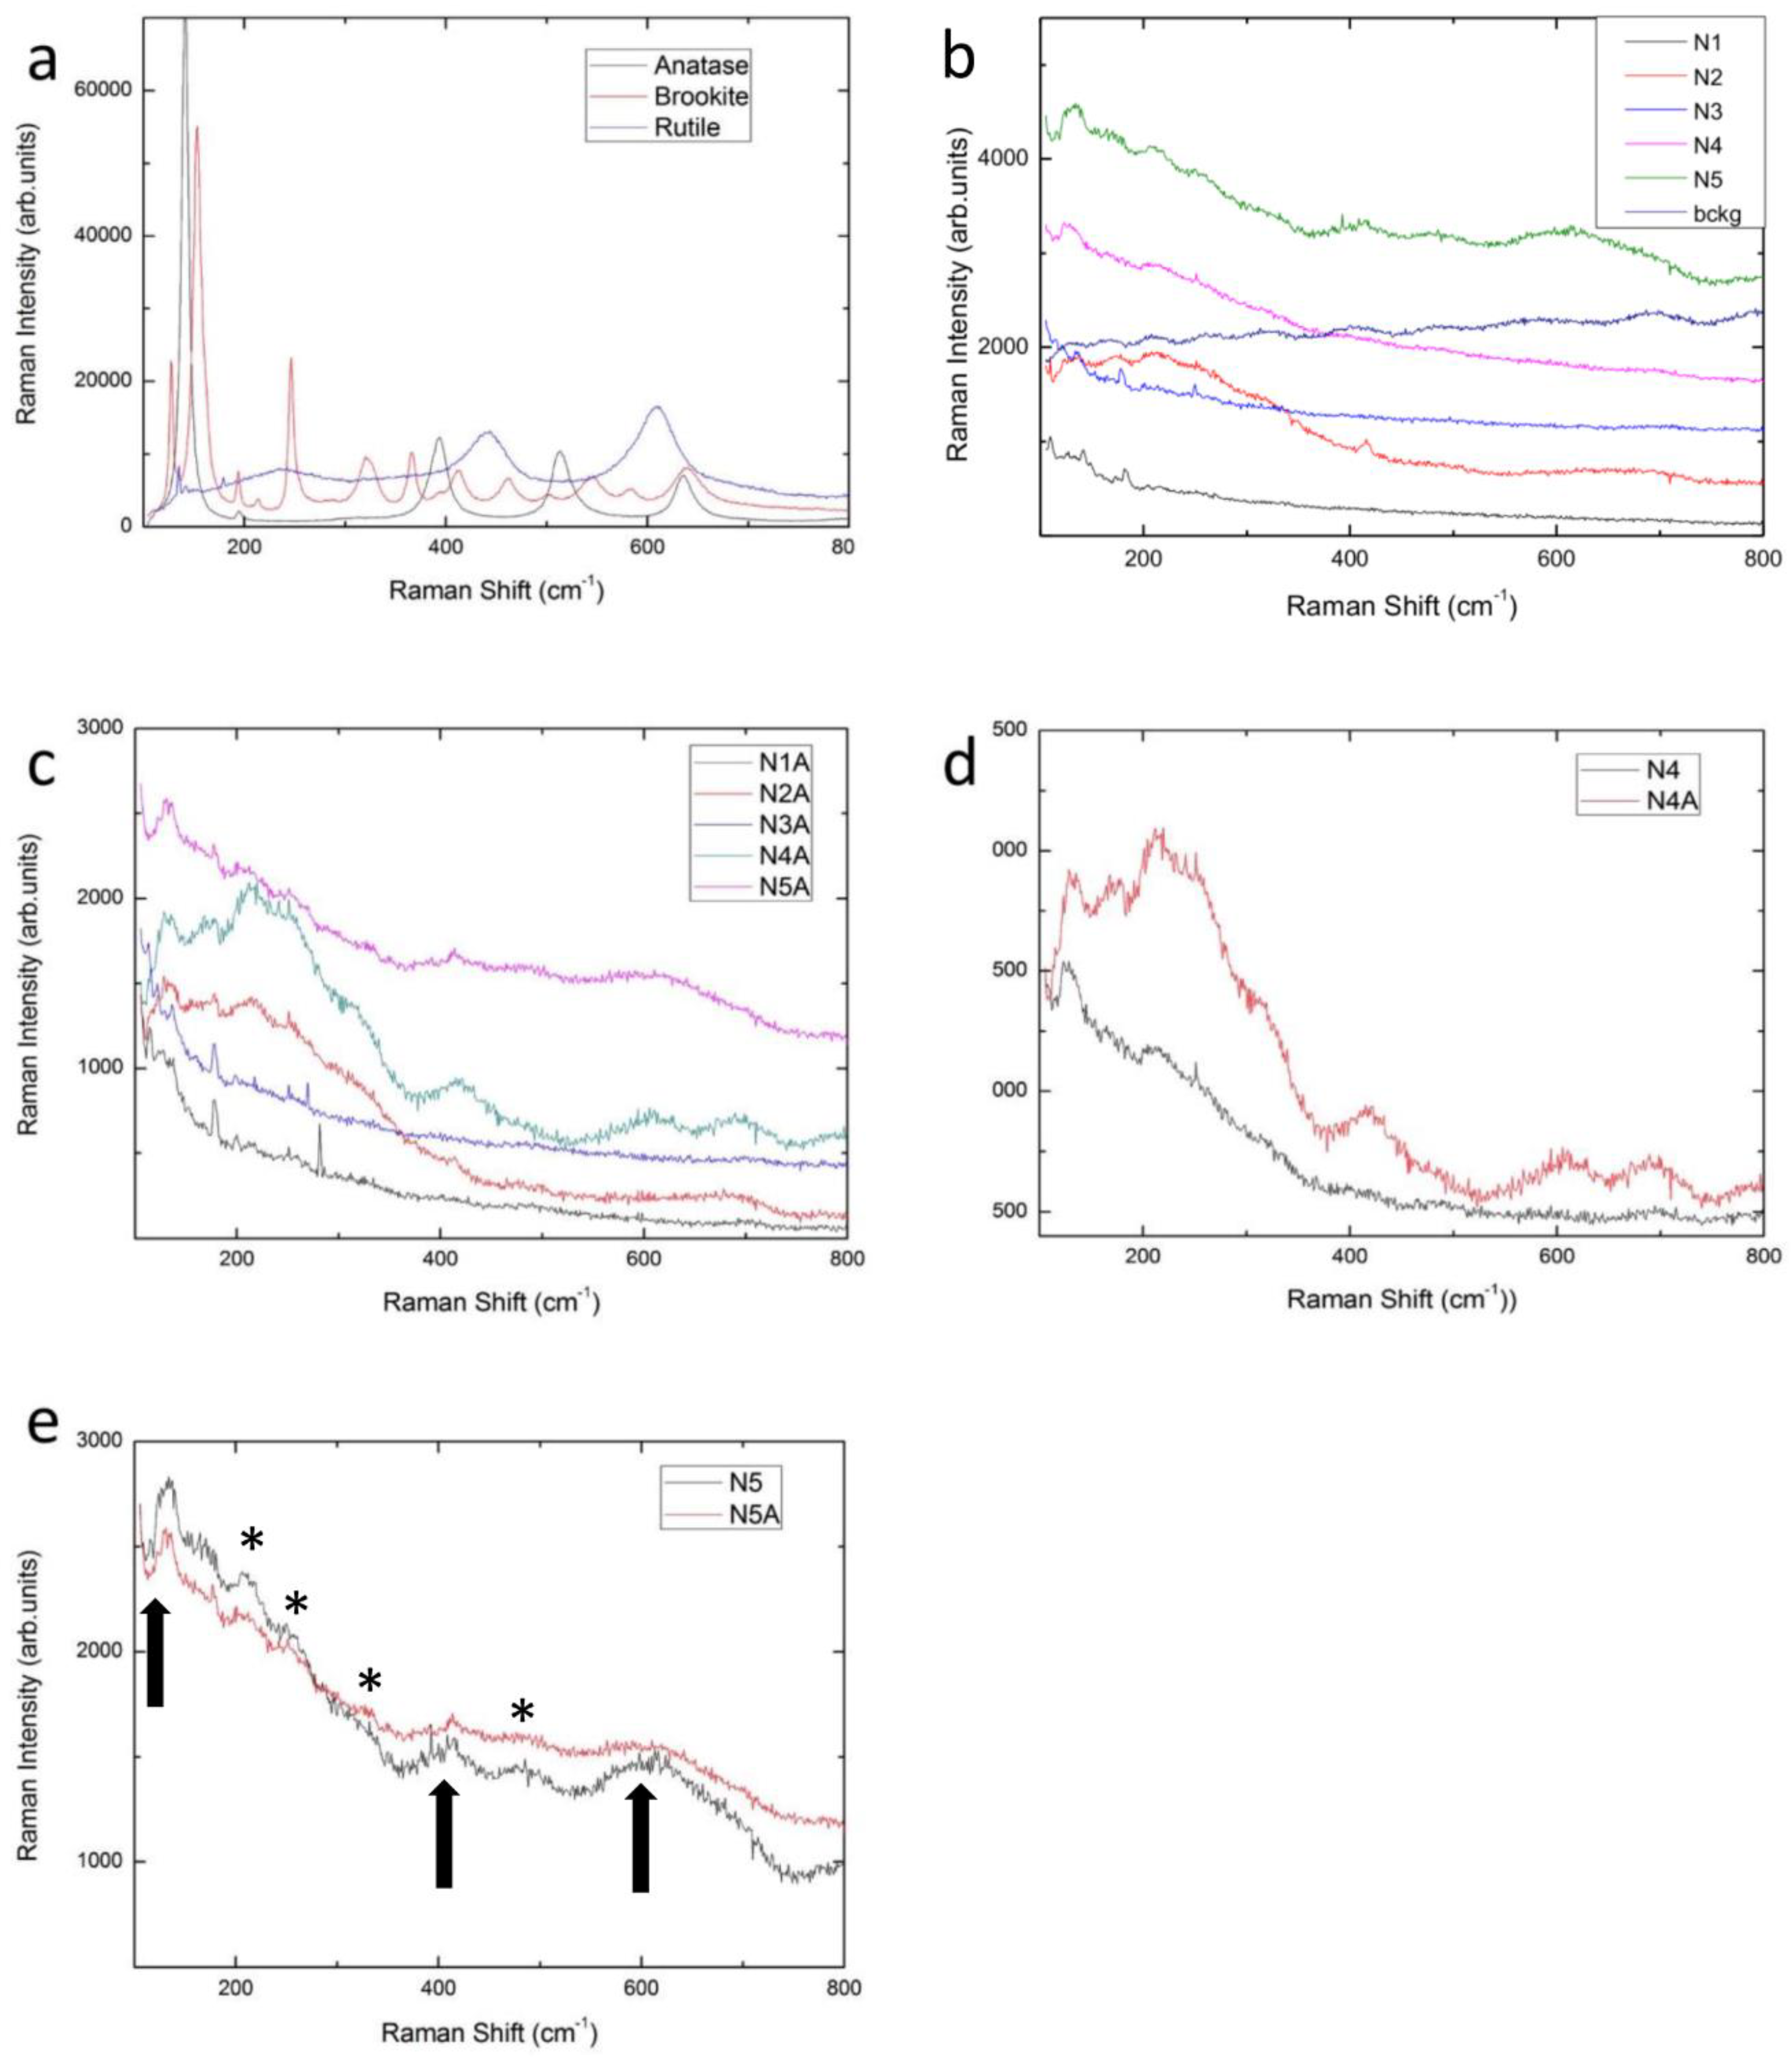
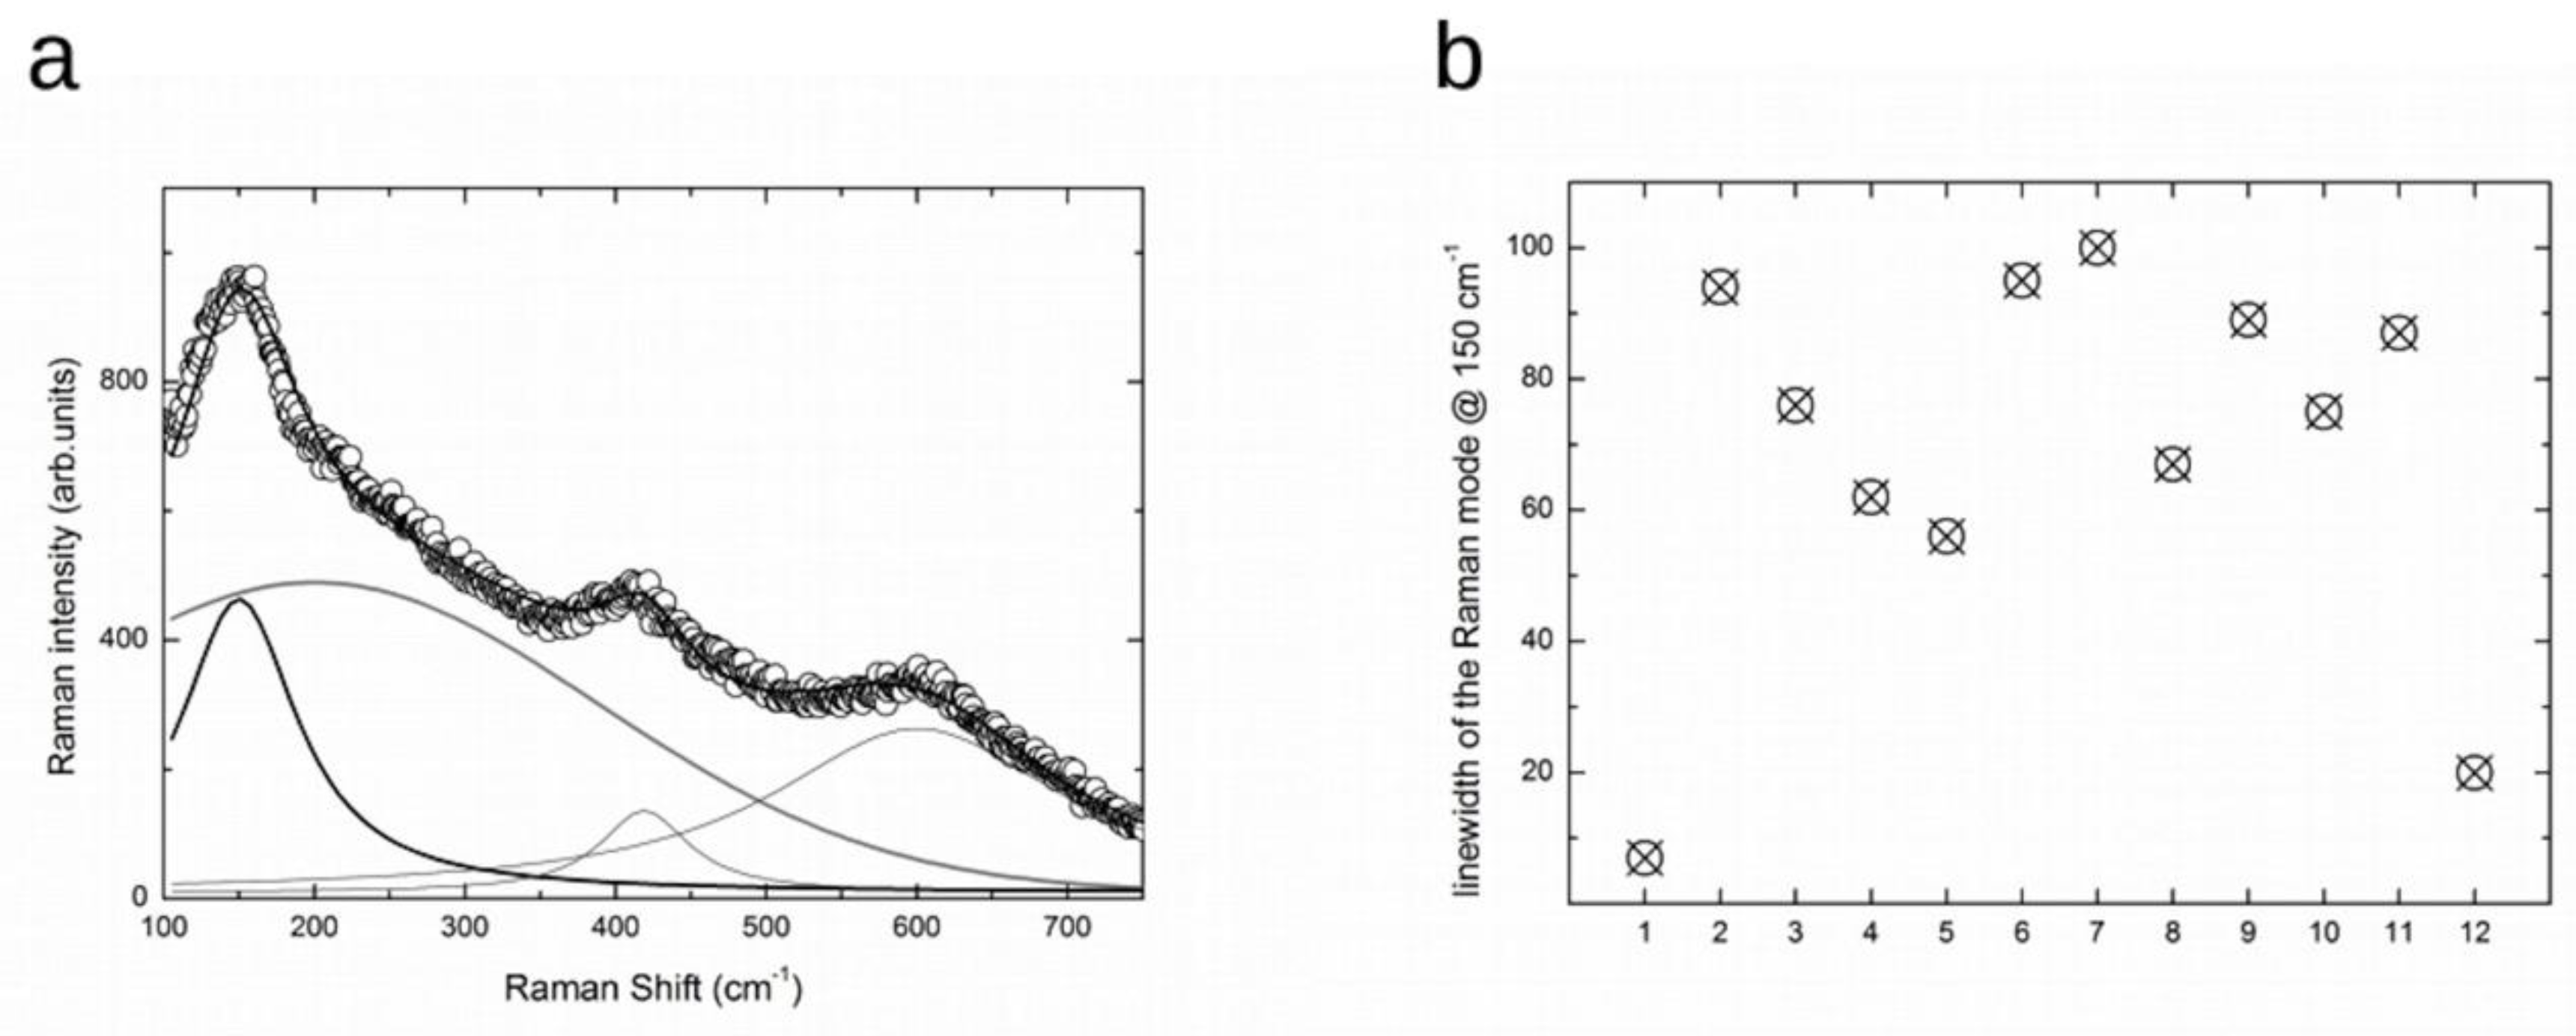
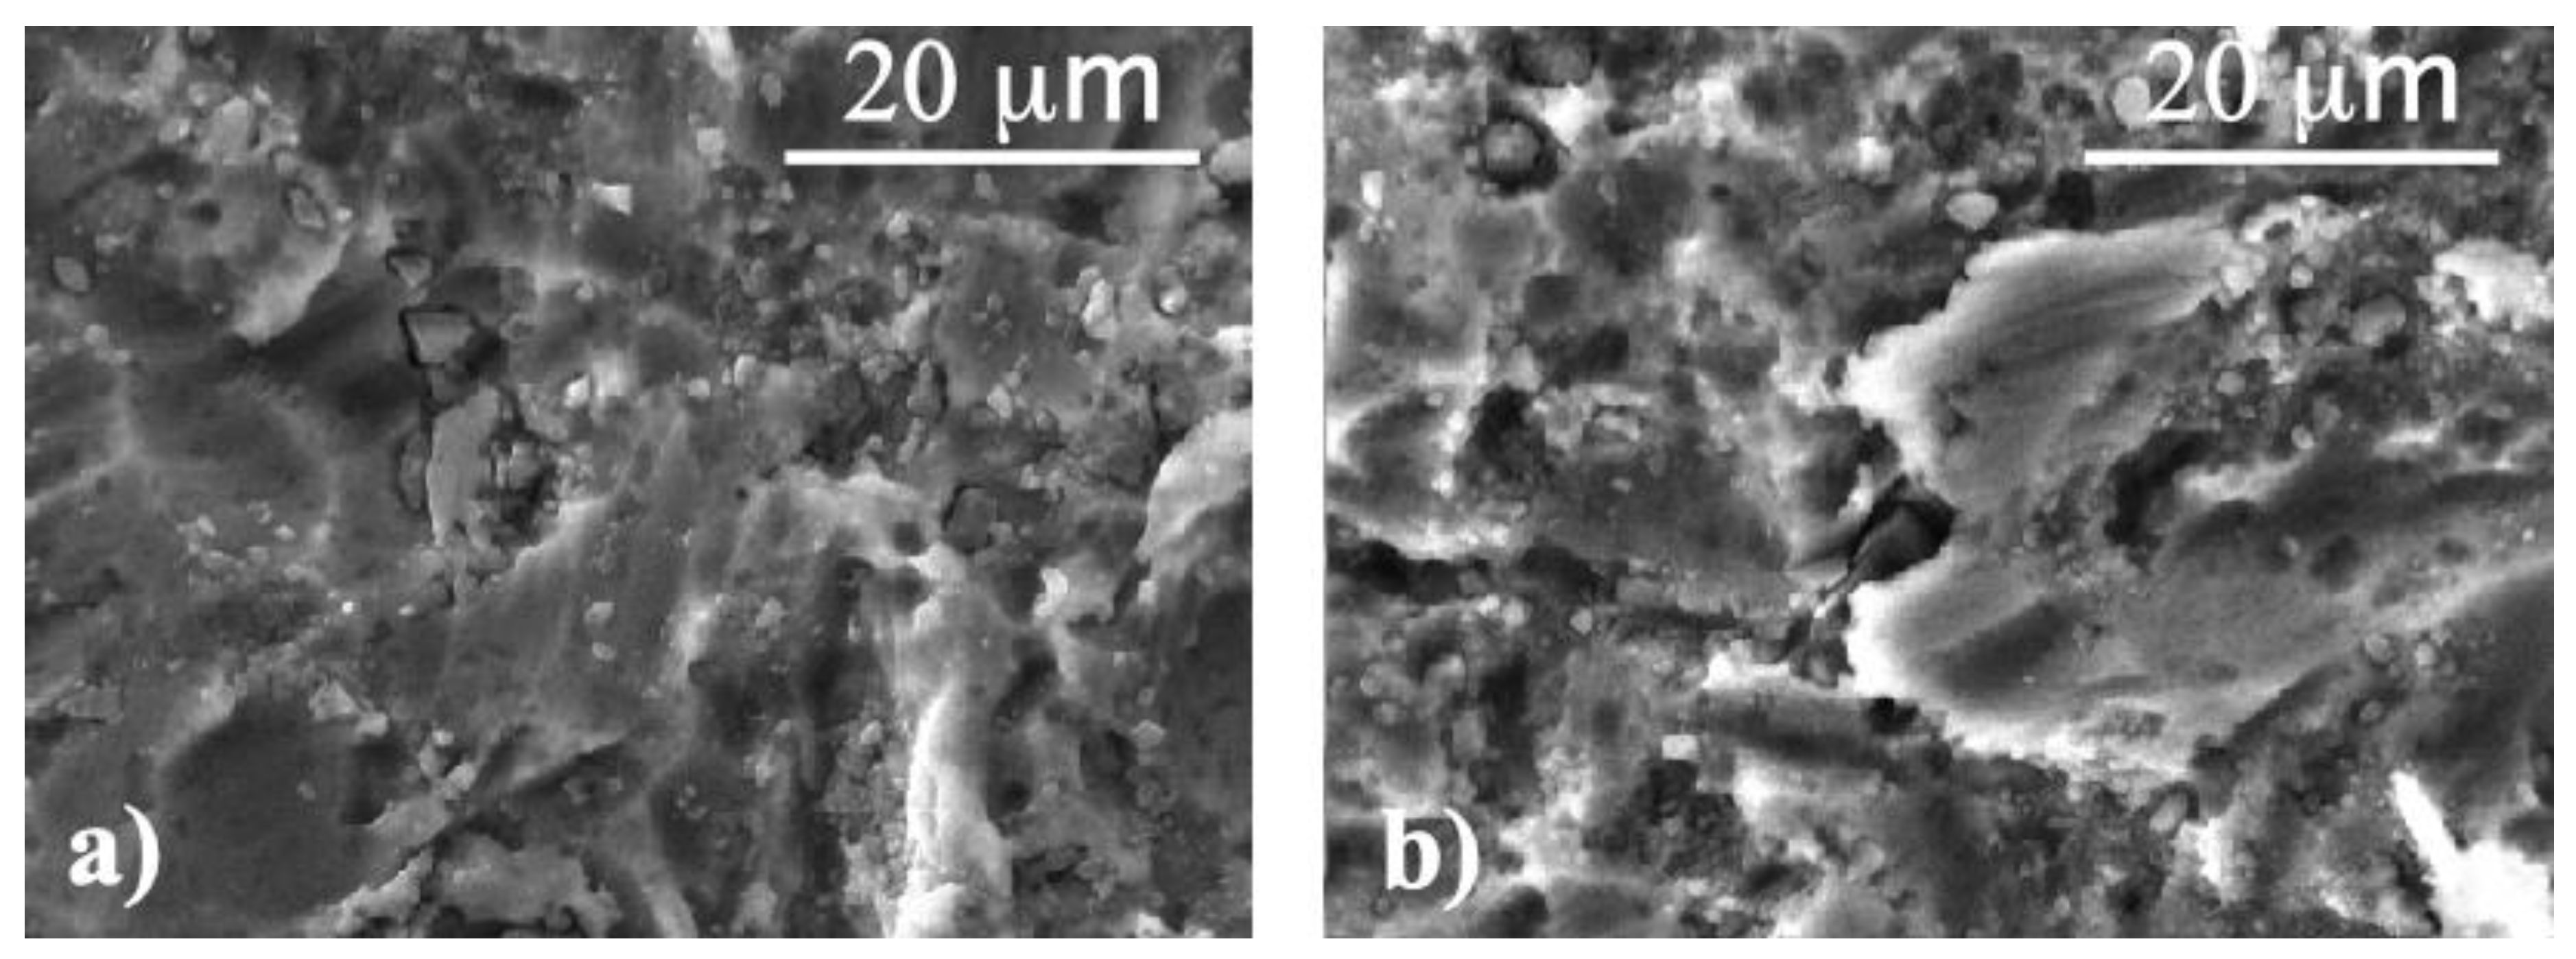
To study the presence and the transformation of TiO2 at the implant surface at different manufacturing stages, experimental Ti-6Al-4V implants were produced by FMD Medical Devices (Rome, Italy). All the samples were obtained from the same titanium alloy lot and underwent the same manufacturing procedures, like those used for commercial Ti dental implants, excepting from those characterizing the surface. In this study, samples consisted of screw-form implants measuring 5.5 mm in diameter and 14 mm in length. A couple of implants for each surface treatment were examined. The basic common procedures consisted of: 1) machining (milling) of the initial rod in the presence of a lubricant; 2) ultrasonication bath with solvents, and 3) packaging in glass tubes under laminar flow hood and dry heat sterilization at 170 °C for 3 h.
The surface treatments are listed in Table 2. Surface treatment procedures consisted of: Al2O3 sandblasting with particles with an average size of 180–200 μm; etching with a HNO3 (64.5%) and HF (0.5%) solution for 15 s; direct current anodization at 60 V for 15 s; etching with a HNO3 (65%) solution for 15 s; low-pressure plasma (LPP) treatment with Ar gas for a period of 20 min at 0.35 mbar with an Atto Plasma Cleaner with integrated PC control (Diener electronic GmbH, Ebhausen, Germany).
A randomly selected site in the apical and in the collar zone was analyzed by RS for each of the implants tested. Spectra were considered identical when the Raman shifts of the peaks appeared at the same wavenumber, and the relative intensities of the major peaks demonstrated a less than 20% height difference [36].
Micro-Raman measures were conducted at room temperature. A LabRAM Dilor spectrometer (HORIBA, Japan) and an Olympus microscope HS BX40 (Shinjuku Monolith, Japan) were used for measurements. A He-Ne laser with a wavelength of 632.8 nm was employed to produce the excitation radiation. The implants were mounted on a motorized xy stage and tested with a laser spot of about 2 µm in diameter and with a 50x objective. In this case the numerical aperture was NA = 0.95 with a focal depth at the minimum confocal hole width equal to 10 microns in transparent materials. A long working distance objective was also used to focus the light on the valleys between the threads of the screw. The spectral resolution was about 1 cm−1. Neutral filters with different optical density irradiated the samples at different light intensities leading to power density values from 5 × 10³ W/cm2 to 5 × 10⁵ W/cm2. As a detector, a cooled CCD camera was used, with typical integration times of about 2 min.
Attention was paid to the acquisition of background signals in order to perform reliable background subtractions for each sample. The surface roughness provoked a very intense, unresolved backscatter, with the appearance of interferential ripples in the spectra. For each sample, an incoherent white light source was used to acquire sample-dependent background signal, resulting from the superposition of electronic noise and blank scattered field.
The spectra reported in Figure 1 are the raw data, while the spectrum reported in Figure 2 has been obtained after subtraction of the scattered background. In any case, the spectra have been sampled in different regions, and for each sample region the spectrum has been averaged over 5 runs. The data were analyzed by using best-fitting procedures from Origin LabCalc from Origin Lab Corporation (Northampton, MA, USA). Lorentzian curves were used as fitting functions. With the actual spectral resolution, Raman modes from different sample regions or different samples were considered equal when the peaks appeared at the same wavenumber within an interval of ± 1cm−1 and the relative intensities demonstrated less than 20% height difference.
Microstructural characterization of all samples was performed using a high-resolution scanning electron microscope (SEM, TESCAN Mira 3XMU) operated at 25kV and equipped with an energy dispersion spectroscopy (EDS) analysis unit (EDAX).

3. Results

We analyzed a series of implants, from untreated Ti-alloy to the finished implant. For each step, the effect of plasma treatment was verified. In Figure 1b the Raman representative spectra from sample N1-N5 are reported in the energy range between 100–800 cm−1, i.e., the region where the Raman modes of titania should be active.
N1 samples present a machined surface. No Raman signals are evident in their spectra. Only weak and narrow lines are visible at low energy due to the laser plasma straight lines clearly visible for the high reflectivity of the starting material. A clear sign of TiO2 is not evident. Nevertheless, since the TiO2 layer in machined implants is below 10 nm, a non-typical spectrum is usually obtained, possibly resembling structures arising from a thin discontinuous TiO2 layer formed at the metal/oxide interface [36,49]. In such cases, Raman analysis may fail to identify the type of the oxides due to bulk interference [36,50]. Although a previous study [36] observed traces indicating the presences of anatase and amorphous TiO2, the intensity of the Raman signal is too low in both our observation and, in our opinion, in theirs, to attribute to the spectra a unique interpretation.
N2 samples present a machined and Al2O3-blasted surface. The related spectrum displays unresolved frequency Raman activities in the spectral region from 100 to 400 cm−1 together with a weak but well-structured Raman signal at about 416 cm−1. The unresolved frequency Raman activity observed in the N2 sample spectrum could be ascribed to an oxide amorphous phase, and it is impossible to rule out the presence of Ti-O bonds in this phase. The Raman signal at about 416 cm−1 is consistent with the presence of corundum residuals [see database http://rruff.info/Corundum]. All the Al2O3-blasted samples presented RS features of corundum.
N3 is a machined and acid-etched surface. The Raman spectrum is very similar to the N1 ones and the same considerations allowed to exclude any formation of TiO2 layer, even highly disordered. The etching treatment tested in the present study does not appear to affect the solid state of implant surfaces.
The N4 surface was blasted with Al2O3 and subsequently etched with HNO3/HF. The Raman spectrum displays a sizable band centered close to 140 cm−1 accompanied by broadened Raman activity extending to 400 cm−1. These features can be considered a direct indication of the formation of TiO2 amorphous phase [36], characterized by a much less intense Raman signal than the one of anatase or rutile phases, but with the clear presence of the Raman signal reminiscent of the Eg mode of anatase structure. Therefore, it seems appropriate to state that the synergistic effect of sandblasting with Al2O3 and etching with HNO3/HF further increases the thickness of the amorphous TiO2 layer.
The N5 surfaces were subjected to the blasting and acid etching treatment and were also subjected to anodization with direct current at 60 V for 10 s. The Raman spectrum in the first region between 100 and 300 cm−1 is quite similar to the N4 spectra but with a net increase in the total scattered yield. Furthermore, one can appreciate in the region between 400 and 700 cm−1 the presence of weak and broadened Raman structures, in just the energy region where other Eg modes and, in particular, A1g stretching modes of anatase are expected. Therefore, it is possible to say that the applied anodization procedures cause a further development of the oxide layer; we can also infer that the disorder tends to decrease, and, even if a good crystal quality is far from being achieved, as evidenced by the very low Raman band intensities and the observed broadening, it is likely that highly distorted TiO6 octahedra tend to be assembled on a long range scale.
It is interesting to evaluate if this highly disordered TiO2 oxide layer was affected by the plasma treatment.
Figure 1c shows the room-temperature Raman signals of the same samples previously described, but in this case each sample has undergone the final LPP decontamination treatment.
It could be claimed that the plasma treatment does not lead to any significant change in the surface, except for blasted and etched surfaces. By directly comparing the samples that differ only in the plasma process, some assessments could be done. In Figure 1d,e, respectively, a comparison between the Raman spectra of N4 and N4A, and of N5 and N5A samples is shown. As regards N4 and N4A samples, it is possible to appreciate an increase in the Raman yield after plasma treatment, probably due to the presence of an amorphous TiO2 phase. The same thing is not verified for N5 and N5A samples; in this regard, it is reasonable to conclude that the amorphous TiO2 phase is promoted by the anodizing process, the plasma treatment being ineffective on an already anodized surface.
Thus, the anodized surface, regardless of the occurrence of CP treatment, is characterized by the presence of highly disordered TiO2 phase. We tried to evaluate the degree of disorder of the TiO2 layer by analyzing the Raman linewidth of the low energy mode for sample N5.
In Figure 2a, the Raman spectrum from the top of the sample N5 is reported in the range 100–750 cm−1. The rough data have previously been subtracted from by the correct background. Indeed, some ripples visible in Figure 1a are here absent. We then performed a best-fitting procedure using as the fitting function a sum of three Lorentzian curves and one Gaussian curve. Raman activity from an ordered structure gave rise to Lorentzian-shaped bands with the linewidth as a marker of crystalline quality. The lower the value of the linewidth, the higher the crystalline quality. Gaussian curves are instead commonly used in Raman spectra to consider the effect of diffuse disorder in the studied solid oxide, regardless of the source and nature of the disorder.
The best-fitting procedure made it possible to satisfactory interpolate the experimental data with the evidence of a Gaussian component with an integrated intensity greater than the sum of the three Lorentzian curves. The Gaussian is centered at around 200 cm−1 while the Lorentzian curves are peaked at around 148, 419 and 600 cm−1. The lower energy component is clearly a signature of the Eg mode in the anatase structure. It is difficult to attribute the other component due to the highly defective system. In any case, we observe an intense, highly broadened Raman response extending beyond 500 cm−1, displaying a Gaussian behavior on which three Lorentzian modes emerge, of which the first, at 148 cm−1, is the most intense.
In addition, from the estimation of the linewidth of the Eg mode at lower energies, we can further obtain information about the disorder affecting that part of the TiO2 oxide layer which can be considered anatase-like.
In Figure 2b the linewidths derived from the best-fitting procedure are plotted. On the x axis there are the points from the sample, N5. The first and the last are the value obtained from anatase single crystal and anatase nano-structured powders, with an average grain size of about 10 nm [51,52].⁠ One can see that the values obtained from 10 different regions of sample N5 are markedly scattered, but in any case they range between 50 cm and 100 cm−1. These values are extremely large relative to those obtained from single crystal (around 7 cm−1) and from nano-structured crystals (around 20 cm−1). The present values, 8–14 times larger than those from an ordered anatase structure, indicate that the TiO2 oxide layers are characterized by a lacking crystal order both on the long range and short-range scale. This is an indication of an amorphous surface layer, where in any case a weak presence of highly defective crystalline TiO2 phase is observable.
We corroborated these results by means of SEM analyses, in particular on the samples N5 before and after CP treatment. This was because the N5 samples had been subjected to the whole set of treatments, i.e., to the blasting and acid etching treatment and also to anodization. The SEM micrographs are reported in Figure 3 for both samples.
SEM results indicate that the surface morphologies are not affected by plasma treatments. Indeed, both sample surfaces are characterized by flat areas larger than 10 microns mixed with small grains (1–5 microns) often edge-shaped. EDS analyses allowed us to quantify the amount of oxygen and other elements (Table 3). In the table, the elemental analyses from sample N1 have been also reported for the sake of comparison. It is clearly shown that in treated samples the amount of oxygen increases, as a result of the ongoing oxidative processes involving titanium and also due to the presence of oxygen in residual corundum from the blasting process, as evidenced by the Al increase. In any case, these results confirmed that plasma treatment does not affect the surface of implants and, in particular, that effectively a layer of titanium dioxide is formed, even if with a high disorder degree as derived from Raman measurements.

4. Discussion

This study evaluated qualitatively, by means of RS, the TiO2 layer on dental implants made of Ti-6Al-4V subjected to the most common surface treatments performed during the production procedures. The analysis showed an increase of the thickness of amorphous TiO2 in the following steps in ascending order: N1, N3, N2, N4, N4A, and N5. LPP did not affect TiO2 presence and quality, except for on the N4A surface, which showed an increased oxide layer relative to the untreated surface. Our observations indicate that the increase in the complexity of the surface treatment corresponds to an increase in the thickness of the surface oxide layer, but the formation of crystalline TiO2 has not been observed.
N1, N3 and N2 surfaces showed a low Raman intensity even though it progressively increased, corresponding to a reduced TiO2 thickness. This result is compatible with that of a study carried out on commercially available implants, in which the constitutive alloy is not reported [36].
N1 showed the lowest Raman intensity; this result should not be interpreted as the absence of an oxide layer, but as the presence of a thinner oxide layer than the analysis capacity of RS can detect, of the order of 10 nm, as already reported in the literature [12]. For the N2 surface, the RS peak at about 416 cm−1 is interpreted as the presence of Al2O3, as also reported on commercially available implants [36]. As the RS signal of corundum traces is present on all the Al2O3-blasted surfaces, it is possible to affirm that the treatments of acid etching, anodization and cold plasma evaluated in this study were not able to completely remove the corundum residues.
Surface N4 showed a further increase in RS intensity but did not indicate the presence of crystalline TiO2. Instead, a previous study showed for an Al2O3-blasted and double acid-etched surface a much higher RS intensity and a spectrum clearly corresponding to the presence of crystalline TiO2 [36].
However, it must be considered that the two surfaces are very different both in the type of acid treatment and in the composition of the titanium bulk. These results would seem to indicate that the combined treatment of sandblasting and acid etching assessed in the present study on grade five titanium alloy is not able to stimulate the growth of crystalline TiO2, as was previously reported using different acids and etching times on commercial pure grade four titanium.
The N5 surface showed the greatest RS intensity, without indicating the presence of crystalline TiO2. Previously published results regarding commercially available implants with an anodized surface instead showed instead in the spectrum clearly indicative of a significant presence of anatase [36]. Additionally, in this case, it should be pointed out that the two surfaces were very different both for the anodizing treatment and for the bulk material.
Previously, it has been reported that anodization treatment produces the formation of anatase also on grade five titanium [34]. In that study, however, the anodizing treatment occurs with a lower current (20 V instead of 60 V) and for much longer times (15 min instead of 15 s). Other studies showed the formation of anatase on grade four titanium implants subjected to anodizing processes [37]. Additionally, in this case, besides the anodizing process being different, the material constituting the bulk was also different.
The results of the present study therefore indicate, overall, that the experimental treatments evaluated on grade five titanium alloy did not produce the appearance of anatase or crystalline TiO2, as previously published. However, it is necessary to specify that, in the previous studies, the implant surface was not analyzed after each manufacturing step, and that only the final surfaces of different commercially available implants were analyzed, not providing much information on the manufacturing procedures, including for the titanium alloy. In this study, on the other hand, the effects of the various manufacturing steps on Ti-6Al-4V alloy implants were evaluated. Our observations indicate an increase in the TiO2 layer, in amorphous form, in the following steps in ascending order: turning; etching with HNO3/HF; sandblasting with Al2O3; sandblasting and etching; sandblasting, etching and plasma decontamination; sandblasting, etching and anodizing with or without plasma decontamination. Further studies are needed to explore the biological implications of the characteristics of the TiO2 layer.

5. Conclusions

The results of the present study make it possible to deepen the knowledge of the TiO2 layer structure present on Ti-6Al-4V alloy dental implant surfaces, in relation to different widely used production treatments. Through Raman microscopy, the presence of amorphous TiO2 has been identified, with increasing intensity, on surfaces: 1) sandblasted and etched; 2) sandblasted, etched and plasma-treated; and 3) sandblasted, etched and anodized.

Author Contributions

Conceptualization, S.M.L., P.G. and S.R.; methodology, S.M.L. and P.G.; software, P.G. and B.A.; validation, E.D.R., P.G. and B.A.; formal analysis, R.R.y.B.; investigation, P.G. and B.A.; resources, B.A.; data curation, E.D.R.; writing—original draft preparation, S.M.L. and P.G.; writing—review and editing, S.R. and R.R.y.B.; supervision, S.R.; project administration, R.R.y.B. All authors have read and agreed to the published version of the manuscript.

Funding

This research received no external funding.

Acknowledgments

We thank FMD (Ladispoli, Rome, Italy) and specifically Sergio and Marco Falappa for the preparation of the experimental implants.

Conflicts of Interest

The authors declare no conflict of interest.

References

  1. Brånemark, P.I.; Breine, U.; Adell, R.; Hansson, B.O.; Lindström, J.; Ohlsson, A. Intra-osseous anchorage of dental prostheses: I. Experimental studies. Scand. J. Plast. Reconstr. Surg. Hand Surg. 1969, 3, 81–100. [Google Scholar] [CrossRef]
  2. Bollati, D.; Morra, M.; Cassinelli, C.; Lupi, S.M.; Rodriguez y Baena, R. In vitro cytokine expression and in vivo healing and inflammatory response to a collagen-coated synthetic bone filler. BioMed Res. Int. 2016, 2016, 6427681. [Google Scholar] [CrossRef] [Green Version]
  3. Prithviraj, D.R.; Deeksha, S.; Regish, K.M.; Anoop, N. A systematic review of zirconia as an implant material. Indian J. Dent. Res. 2012, 23, 643. [Google Scholar]
  4. Roos-Jansåker, A.M.; Lindahl, C.; Renvert, H.; Renvert, S. Nine- to fourteen-year follow-up of implant treatment. Part I: Implant loss and associations to various factors. J. Clin. Periodontol. 2006, 33, 283–289. [Google Scholar] [CrossRef] [PubMed]
  5. Rizzo, S.; Zampetti, P.; Rodriguez Y Baena, R.; Svanosio, D.; Lupi, S.M. Retrospective analysis of 521 endosseous implants placed under antibiotic prophylaxis and review of literature. Minerva Stomatol. 2010, 59, 75–88. [Google Scholar] [PubMed]
  6. Rodriguez y Baena, R.; Lupi, S.M.; Cislaghi, M.; Rizzo, S. Rehabilitation with implant-retained removable dentures and its effects on perioral aesthetics: A prospective cohort study. Clin. Cosmet. Investig. Dent. 2016, 8, 105–110. [Google Scholar] [CrossRef] [Green Version]
  7. Lupi, S.M.; Granati, M.; Butera, A.; Collesano, V.; Rodriguez Y Baena, R. Air-abrasive debridement with glycine powder versus manual debridement and chlorhexidine administration for the maintenance of peri-implant health status: A six-month randomized clinical trial. Int. J. Dent. Hyg. 2017, 15, 287–294. [Google Scholar] [CrossRef]
  8. Rodriguez y Baena, R.; Pastorino, R.; Gherlone, E.; Perillo, L.; Saturnino, S.; Lucchese, A. Histomorphometric evaluation of two different bone substitutes in sinus augmentation procedures: A randomized controlled trial in humans. Int. J. Oral Maxillofac. Implant. 2016, 32, 188–194. [Google Scholar] [CrossRef] [Green Version]
  9. Lupi, S.M.; Rodriguez y Baena, A.; Cervino, G.; Todaro, C.; Rizzo, S. Long-term effects of acute myeloid leukemia treatment on the oral system in a pediatric patient. Open Dent. J. 2018, 12, 230–237. [Google Scholar] [CrossRef]
  10. Lupi, S.M.; Rodriguez y Baena, A.; Todaro, C.; Ceccarelli, G.; Rodriguez y Baena, R. Maxillary sinus lift using autologous periosteal micrografts: A new regenerative approach and a case report of a 3-year follow-up. Case Rep. Dent. 2018, 2018, 3023096. [Google Scholar] [CrossRef]
  11. Ducheyne, P. Titanium and calcium phosphate ceramic dental implants, surfaces, coatings and interfaces. J. Oral Implant. 1988, 14, 325–340. [Google Scholar]
  12. Lausmaa, J. Surface spectroscopic characterization of titanium implant materials. J. Electron Spectros. Relat. Phenom. 1996, 81, 343–361. [Google Scholar] [CrossRef]
  13. Zhou, W.; Zhong, X.; Wu, X.; Yuan, L.; Shu, Q.; Xia, Y.; Ostrikov, K.K. Plasma-controlled nanocrystallinity and phase composition of TiO2: A smart way to enhance biomimetic response. J. Biomed. Mater. Res. A 2007, 81, 453–464. [Google Scholar] [CrossRef] [PubMed]
  14. Lautenschlager, E.P.; Monaghan, P. Titanium and titanium alloys as dental materials. Int. Dent. J. 1993, 43, 245–253. [Google Scholar]
  15. Parr, G.R.; Gardner, L.K.; Toth, R.W. Titanium: The mystery metal of implant dentistry. Dental materials aspects. J. Prosthet. Dent. 1985, 54, 410–414. [Google Scholar] [CrossRef]
  16. Albrektsson, T. The response of bone to titanium implants. CRC Crit. Rev. Biocompat. 1985, 1, 53–84. [Google Scholar]
  17. Rodriguez y Baena, R.; Rizzo, S.; Manzo, L.; Lupi, S.M. Nanofeatured titanium surfaces for dental implantology: Biological effects, biocompatibility, and safety. J. Nanomater. 2017, 2017, 6092895. [Google Scholar] [CrossRef]
  18. Galli, C.; Guizzardi, S.; Passeri, G.; Martini, D.; Tinti, A.; Mauro, G.; Macaluso, G.M. Comparison of human mandibular osteoblasts grown on two commercially available titanium implant surfaces. J. Periodontol. 2005, 76, 364–372. [Google Scholar] [CrossRef]
  19. Xia, W.; Lindahl, C.; Lausmaa, J.; Engqvist, H. Biomimetic hydroxyapatite deposition on titanium oxide surfaces for biomedical application. Adv. Biomim. 2011, 20, 429–452. [Google Scholar]
  20. Chen, C.A.; Huang, Y.S.; Chung, W.H.; Tsai, D.S.; Tiong, K.K. Raman spectroscopy study of the phase transformation on nanocrystalline titania films prepared via metal organic vapour deposition. J. Mater. Sci. Mater. Electron. 2009, 20, 303–306. [Google Scholar] [CrossRef]
  21. Shin, H.; Jung, H.S.; Hong, K.S.; Lee, J.K. Crystal phase evolution of TiO2 nanoparticles with reaction time in acidic solutions studied via freeze-drying method. J. Solid State Chem. 2005, 178, 15–21. [Google Scholar] [CrossRef]
  22. Hatamleh, M.M.; Wu, X.; Alnazzawi, A.; Watson, J.; Watts, D. Surface characteristics and biocompatibility of cranioplasty titanium implants following different surface treatments. Dent. Mater. 2018, 34, 676–683. [Google Scholar] [CrossRef] [Green Version]
  23. Uchida, M.; Kim, H.M.; Kokubo, T.; Fujibayashi, S.; Nakamura, T. Structural dependence of apatite formation on titania gels in a simulated body fluid. J. Biomed. Mater. Res. A 2003, 64, 164–170. [Google Scholar] [CrossRef]
  24. Wu, W.; Nancollas, G.H. Kinetics of heterogeneous nucleation of calcium phosphates on anatase and rutile surfaces. J. Colloid Interface Sci. 1998, 199, 206–211. [Google Scholar] [CrossRef]
  25. Svetina, M.; Colombi Ciacchi, L.; Sbaizero, O.; Meriani, S.; De Vita, A. Deposition of calcium ions on rutile (110): A first-principles investigation. Acta Mater. 2001, 49, 2169–2177. [Google Scholar] [CrossRef]
  26. Sollazzo, V.; Pezzetti, F.; Scarano, A.; Piattelli, A.; Massari, L.; Brunelli, G.; Carinci, F. Anatase coating improves implant osseointegration in vivo. J. Craniofacial Surg. 2007, 18, 806–810. [Google Scholar] [CrossRef]
  27. Wang, G.; Li, J.; Lv, K.; Zhang, W.; Ding, X.; Yang, G.; Liu, X.; Jiang, X. Surface thermal oxidation on titanium implants to enhance osteogenic activity and in vivo osseointegration. Sci. Rep. 2016, 6, 31769. [Google Scholar] [CrossRef] [Green Version]
  28. Cucchi, A.; Mole, F.; Rinaldi, L.; Marchetti, C.; Corinaldesi, G. The efficacy of an anatase-coated collar surface in inhibiting the bacterial colonization of oral implants: A pilot prospective study in humans. Int. J. Oral Maxillofac. Implant. 2018, 33, 395–404. [Google Scholar] [CrossRef] [Green Version]
  29. Rupp, F.; Haupt, M.; Eichler, M.; Doering, C.; Klostermann, H.; Scheideler, L.; Lachmann, S.; Oehr, C.; Wendel, H.P.; Decker, E.; et al. Formation and photocatalytic decomposition of a pellicle on anatase surfaces. J. Dent. Res. 2012, 91, 104–109. [Google Scholar] [CrossRef]
  30. Ireland, J.C.; Klostermann, P.; Rice, E.W.; Clark, R.M. Inactivation of Escherichia coli by titanium dioxide photocatalytic oxidation. Appl. Environ. Microbiol. 1993, 59, 1668–1670. [Google Scholar] [CrossRef] [Green Version]
  31. Marciano, F.R.; Lima-Oliveira, D.A.; Da-Silva, N.S.; Diniz, A.V.; Corat, E.J.; Trava-Airoldi, V.J. Antibacterial activity of DLC films containing TiO2 nanoparticles. J. Colloid Interface Sci. 2009, 340, 87–92. [Google Scholar] [CrossRef]
  32. Scarano, A.; Piattelli, A.; Polimeni, A.; Di Iorio, D.; Carinci, F. Bacterial adhesion on commercially pure titanium and anatase-coated titanium healing screws: An in vivo human study. J. Periodontol. 2010, 81, 1466–1471. [Google Scholar] [CrossRef]
  33. Li, L.H.; Kong, Y.M.; Kim, H.W.; Kim, Y.W.; Kim, H.E.; Heo, S.J.; Koak, J.Y. Improved biological performance of Ti implants due to surface modification by micro-arc oxidation. Biomaterials 2004, 25, 2867–2875. [Google Scholar] [CrossRef] [PubMed]
  34. Abdelrahim, R.A.; Badr, N.A.; Baroudi, K. Effect of anodization and alkali-heat treatment on the bioactivity of titanium implant material (an in vitro study). J. Int. Soc. Prev. Community Dent. 2016, 6, 189–195. [Google Scholar]
  35. Ask, M.; Rolander, U.; Lausmaa, J.; Kasemo, B. Microstructure and morphology of surface oxide films on Ti–6A1–4V. J. Mater. Res. 2011, 5, 1662–1667. [Google Scholar] [CrossRef]
  36. Gaintantzopoulou, M.; Zinelis, S.; Silikas, N.; Eliades, G. Micro-Raman spectroscopic analysis of TiO(2) phases on the root surfaces of commercial dental implants. Dent. Mater. 2014, 30, 861–867. [Google Scholar] [CrossRef]
  37. Jarmar, T.; Palmquist, A.; Branemark, R.; Hermansson, L.; Engqvist, H.; Thomsen, P. Characterization of the surface properties of commercially available dental implants using scanning electron microscopy, focused ion beam, and high-resolution transmission electron microscopy. Clin. Implant Dent. Relat. Res. 2008, 10, 11–22. [Google Scholar] [CrossRef]
  38. Foest, R.; Schmidt, M.; Becker, K. Microplasmas, an emerging field of low-temperature plasma science and technology. Int. J. Mass Spectrom. 2006, 248, 87–102. [Google Scholar] [CrossRef]
  39. Foest, R.; Kindel, E.; Ohl, A.; Stieber, M.; Weltmann, K.D. Non-thermal atmospheric pressure discharges for surface modification. Plasma Phys. Control. Fusion 2005, 47, B525–B536. [Google Scholar] [CrossRef]
  40. Becker, K.H. Non-Equilibrium Air Plasmas at Atmospheric Pressure; Institute of Physics: London, UK, 2005; ISBN 0750309628 (hbk.). [Google Scholar]
  41. Duske, K.; Koban, I.; Kindel, E.; Schroder, K.; Nebe, B.; Holtfreter, B.; Jablonowski, L.; Weltmann, K.D.; Kocher, T. Atmospheric plasma enhances wettability and cell spreading on dental implant metals. J. Clin. Periodontol. 2012, 39, 400–407. [Google Scholar] [CrossRef]
  42. Guastaldi, F.P.S.; Yoo, D.; Marin, C.; Jimbo, R.; Tovar, N.; Zanetta-Barbosa, D.; Coelho, P.G. Plasma treatment maintains surface energy of the implant surface and enhances osseointegration. Int. J. Biomater. 2013, 2013, 354125. [Google Scholar] [CrossRef]
  43. Coelho, P.G.; Giro, G.; Teixeira, H.S.; Marin, C.; Witek, L.; Thompson, V.P.; Tovar, N.; Silva, N.R. Argon-based atmospheric pressure plasma enhances early bone response to rough titanium surfaces. J. Biomed. Mater. Res. A 2012, 100, 1901–1906. [Google Scholar] [CrossRef]
  44. Bersani, D.; Lottici, P.P.; Ding, X.-Z. Phonon confinement effects in the Raman scattering by TiO2 nanocrystals. Appl. Phys. Lett. 1998, 72, 73–75. [Google Scholar] [CrossRef]
  45. Parker, J.C.; Siegel, R.W. Raman microprobe study of nanophase TiO2 and oxidation-induced spectral changes. J. Mater. Res. 2011, 5, 1246–1252. [Google Scholar] [CrossRef]
  46. Balachandran, U.; Eror, N.G. Raman spectra of titanium dioxide. J. Solid State Chem. 1982, 42, 276–282. [Google Scholar] [CrossRef]
  47. Ohsaka, T.; Izumi, F.; Fujiki, Y. Raman spectrum of anatase, TiO2. J. Raman Spectrosc. 1978, 7, 321–324. [Google Scholar] [CrossRef]
  48. Porto, S.P.S.; Fleury, P.A.; Damen, T.C. Raman Spectra of TiO2, MgF2, ZnF2, FeF2, and Mn F2. Phys. Rev. 1967, 154, 522–526. [Google Scholar] [CrossRef]
  49. Sul, Y.-T.; Johansson, C.B.; Petronis, S.; Krozer, A.; Jeong, Y.; Wennerberg, A.; Albrektsson, T. Characteristics of the surface oxides on turned and electrochemically oxidized pure titanium implants up to dielectric breakdown: The oxide thickness, micropore configurations, surface roughness, crystal structure and chemical composition. Biomaterials 2002, 23, 491–501. [Google Scholar] [CrossRef]
  50. Palmquist, A.; Omar, O.M.; Esposito, M.; Lausmaa, J.; Thomsen, P. Titanium oral implants: Surface characteristics, interface biology and clinical outcome. J. R. Soc. Interface 2010, 7 (Suppl. 5), S515–S527. [Google Scholar] [CrossRef]
  51. Zhang, W.F.; He, Y.L.; Zhang, M.S.; Yin, Z.; Chen, Q. Raman scattering study on anatase TiO2 nanocrystals. J. Phys. D Appl. Phys. 2000, 33, 912. [Google Scholar] [CrossRef]
  52. Salis, M.; Ricci, P.; Anedda, A. Effective linewidth in Raman spectra of titanium dioxide nanocrystals. Open Condens. Matter Phys. J. 2009, 2, 15–18. [Google Scholar] [CrossRef] [Green Version]
Figure 1. Raman spectra at room temperature for different systems: (a) anatase, rutile and brookite synthetic powders; (b) samples N1-N5 and the background signal for N5 sample; (c) CP-treated samples N1A-N5A. In panels (d) and (e) a comparison between untreated and CP-treated samples is reported respectively for N4 and N5 samples. The arrows in Figure 1e indicate the TiO2 Raman bands while the asterisks indicate the main ripple structures.
Applsci 10 02417 g001
Figure 2. (a) Raman spectrum at room temperature for N5 sample (open circle) and the result from the best-fitting procedure (solid line). The single components used to obtain the best-fitting curve are also reported [see text]. (b) The values of the linewidth for the Eg mode at around 150 cm-1, derived from the results of the best-fitting analyses from ten Raman spectra (point 2–point 11). The first and the latter are the typical values obtained from a single crystal anatase crystal and nanosized (10 nm) powders.
Applsci 10 02417 g002
Figure 3. SEM micrographs of (a) sample N5 and (b) sample N5A.
Applsci 10 02417 g003
Table 1. Raman active modes for anatase and rutile.
Active ModesAnatase (cm−1)Rutile (cm−1)
A1g519612
B1g399, 519143
B2g-826
Eg144, 197, 639447
Table 2. List of the surface treatments examined.
CodeSurface TreatmentCodeSurface Treatment
N1Machining + ultrasonic cleaner + packaging and sterilizationN1AN1 + Plasma
N2Machining + Al2O3 blasting + ultrasonic cleaner + packaging and sterilizationN2AN2 + Plasma
N3Machining + ultrasonic cleaner + HNO3\HF etching + packaging and sterilizationN3AN3 + Plasma
N4Machining + Al2O3 blasting + ultrasonic cleaner + HNO3\HF etching + packaging and sterilization N4AN4 +Plasma
N5Machining + Al2O3 blasting + ultrasonic cleaner + HNO3\HF etching + anodization + HNO3 etching + packaging and sterilizationN5AN5 + Plasma
Table 3. Elemental composition of N1, N5, N5A samples as derived from EDS analyses. The data are expressed as percentage of weight (wt%).
N1N5N5A
Ti85,666,768,2
O1,618,717,8
Al5,87,57,3
C4,14,84,2
V2,92,62,6

