Article

Impact of Tea and Coffee Consumption on Cognitive Performance: An fNIRS and EDA Study

1
School of Biomedical Engineering, Science & Health Systems, Drexel University, Philadelphia, PA 19104, USA
2
Lebow College of Business, Drexel University, Philadelphia, PA 19104, USA
3
Drexel Solutions Institute, Drexel University, Philadelphia, PA 19104, USA
4
Department of Psychology, College of Arts and Sciences, Drexel University, Philadelphia, PA 19104, USA
5
Department of Family and Community Health, University of Pennsylvania, Philadelphia, PA 19104, USA
6
Center for Injury Research and Prevention, Children’s Hospital of Philadelphia, Philadelphia, PA 19104, USA
*
Author to whom correspondence should be addressed.
Appl. Sci. 2020, 10(7), 2390; https://doi.org/10.3390/app10072390
Submission received: 17 January 2020 / Revised: 21 March 2020 / Accepted: 24 March 2020 / Published: 1 April 2020
(This article belongs to the Section Food Science and Technology)

Abstract

:
Coffee and tea are two of the most popular beverages in the world and have been consumed for more than a thousand years. They have become an integral part of the day for many consumers and may aid not only increased social interactions but also productivity. However, there is no conclusive evidence of their comparative effect on cognitive ability. This study investigated the impact of tea and coffee products on cognitive performance in typical office work-related tasks using brain, body, and behavioral measures. In a controlled multi-day study, we explored the effects of both traditional and cognition-enhancing hot beverages through task performance and self-reported measures. A total of 120 participants completed three work-related tasks from different cognitive domains and consumed either a traditional or cognition-enhancing hot beverage. During the study, we measured brain activity in the prefrontal cortex using functional near-infrared spectroscopy (fNIRS) as well as arousal from skin conductance through electrodermal activity (EDA) while participants completed cognitive tasks and consumed the beverages. Neural efficiency was used to evaluate cognitive performance in the tasks. Neural efficiency was calculated from a composite score of behavioral efficiency and cognitive effort, and emotional arousal was estimated from EDA activity. Results indicated that for different cognitive domains, the enhanced hot beverages showed improved neural efficiency over that of a traditional hot beverage. This is the first study to assess the impact of both traditional and cognition-enhancing drinks using a multimodal approach for workplace-related assignments.

1. Introduction

Coffee and tea are two of the most popular beverages in the world and have been consumed for more than a thousand years [1]. Throughout the centuries, numerous flavors and health benefits have also been identified. In Europe and the Americas, coffee is consumed more predominantly; elsewhere, tea might be consumed more frequently [2,3]. Today, in the USA, drinking coffee entails a ritual for each person, whether it be “morning coffee” or a coffee break [4]. At work, coffee and tea consumption has become an integral part of the day that not only increase social interactions between employees but also productivity [4,5]. With coffee and tea being consumed so frequently, there is a need to better understand their effects on cognition and task performance.
Tea and coffee have both been shown to have an effect on cognitive ability [6,7]. Light coffee drinkers have shown improvements in cognitive tasks after consumption whereas heavy coffee drinkers did not show improvements [8]. This indicates that moderate consumption of caffeine can affect cognition [8]. Coffee and tea consumption has been studied extensively to determine the long-term effects of consumption and the associations with numerous diseases such as diabetes, hypertension, Alzheimer’s disease, and dementia [9,10,11,12]. Most previous studies have also only used behavioral performance and self-reported measures to understand the effects of consumption on cognition.
Further, very few studies have been conducted to investigate the effects of health and wellness products on cognitive performance. Prior research on cognition-enhancing products, specifically caffeinated drinks, has only used behavioral performance on tasks and subjective surveys as indicators of product effectiveness as well as physical performance (exercise) in some cases [13,14,15,16].
By using both brain activity and behavioral performance together, a more complete measure can be obtained to better understand the effects of coffee and tea on cognitive ability. In this study, we used neural efficiency (NE) as a comprehensive metric to better understand the relationship between brain activity and behavioral performance [17]. NE helps capture the performance under a specific cognitive load and how it varies based on the task demand and the ability of the individual [17]. The NE hypothesis proposed by Haier et al. in 1992 suggests that individuals with higher intelligence are more efficient and therefore require reduced or more focused neural activity for a given task [18]. Amended descriptions of the hypothesis state that measured efficiency is dependent on task difficulty as well as prior knowledge of the task [19,20]. Neural efficiency has also been studied previously in relationship to intelligence [21,22]. Neubauer et al. conducted a literature review of the neural efficiency hypothesis and concluded that it is observable when individuals are presented with tasks of low difficulty and is most frequently observed in frontal brain regions [21]. Most recently, Curtin and Ayaz described integrated behavioral performance and brain activity to formulate neural efficiency as a metric [17]. This combined metric can be used to evaluate participant engagement in tasks over time and under different conditions. Curtin and Ayaz proposed a formula to calculate NE using the normalized (z-score) of behavioral performance efficiency (accuracy/time) and measured task-related brain activity in a localized area that was responsive to the task [17]. This proposed formula is an extension of the efficiency view proposed by Paas et al. [23]. Neural efficiency is suggested to provide a more comprehensive measure of performance by including both behavioral and cognitive efforts.
In the current study, we assess the impact of traditional and enhanced hot beverages on cognitive performance. Coffee and tea are among the most consumed beverages in the world. In the United States, according to the National Coffee Association, 62% of Americans consume coffee on a daily basis. Similarly, according to the Tea Association of the USA, nearly 80% of Americans drink tea every day. Beyond traditional hot beverages, there has been an increase in the production of products that provide health benefits to consumers. Health and wellness foods are a growing market. Nearly 30% of all food companies now invest in health and wellness food lines. Currently, awareness about the benefits of consuming healthier food and drink products and increased promotion of healthy eating habits are underlying factors that are driving this market increase. In 2015, a Global Health and Wellness report released by Nielsen [24] indicated that health attributes or beneficial ingredients are the most important factors to consumers, and they are willing to pay a higher premium for health benefits. Nearly 88% of respondents indicated their willingness to pay more for healthier foods [24]. No study, to our knowledge, has investigated differences between the effects of traditional and cognition-enhancing hot beverages on cognitive performance in work-related tasks.
By combining behavioral measures with neurophysiological measures, new insights are revealed that traditional self-reported measures alone are unable to capture [25]. Applying a more comprehensive methodology beyond that of traditional subjective and behavioral measures, we employed a neuroergonomic approach in this study. Neuroergonomics is an emerging field in neuroscience research that aims to better understand the relationship between the human brain and behavioral performance in more naturalistic environments [26,27]. This method uses a holistic approach, combining different metrics from behavioral performance, physiological measures, and measures from the brain directly to give a more comprehensive overview beyond that of traditional methods [26,28]. The development of miniaturized, portable, wireless, and wearable sensors has allowed for continuous monitoring of participants while they perform real-world tasks in everyday settings [28,29,30,31,32].
The present study was designed to evaluate the impact of tea and coffee on cognitive performance in workplace-related tasks using brain, body, and behavioral measures. Specifically, we wanted to investigate differences between the effects of cognition-enhancing hot beverages and traditional hot beverages on cognitive performance. We hypothesized that the cognition-enhancing hot beverage would not only affect the consumer’s evaluation of the product but also their cognitive ability more than that of the traditional hot beverage. We investigated the effect of coffee and tea on cognitive performance using functional near-infrared spectroscopy (fNIRS) -based brain activity during cognitive tasks and by measuring the electrodermal activity (EDA) during consumption. Acquired information included self-reports, behavioral metrics from task performance, EDA-based assessment of arousal, and brain dynamics measured using fNIRS to assess neural efficiency. We expected that the cognition-enhancing hot beverages would improve cognitive ability, leading to a higher neural efficiency compared to traditional hot beverages. This study will provide a new way to assess the impact of coffee and tea consumption on cognitive ability through the comprehensive metric of neural efficiency. We believe, to date, this is the first study to incorporate a multimodal approach to assess neural efficiency while consuming different hot beverages and completing work-related tasks.

2. Method

2.1. Participants

One hundred and twenty participants from one of the most populous cities in the US, between the ages of 18 and 38 (85 females, mean age = 23 ± 4 years), participated in this study. All confirmed that they met the eligibility requirements of being right-handed with vision correctable to 20/20, did not have a history of brain injury or psychological disorder, and were not on medication affecting brain activity. Prior to the study, all participants signed consent forms approved by the Institutional Review Board of Drexel University. Participants also completed a survey to rule out any potential allergies to the ingredients in the tea and coffee beverages and to identify the amount of caffeine typically consumed in a day.

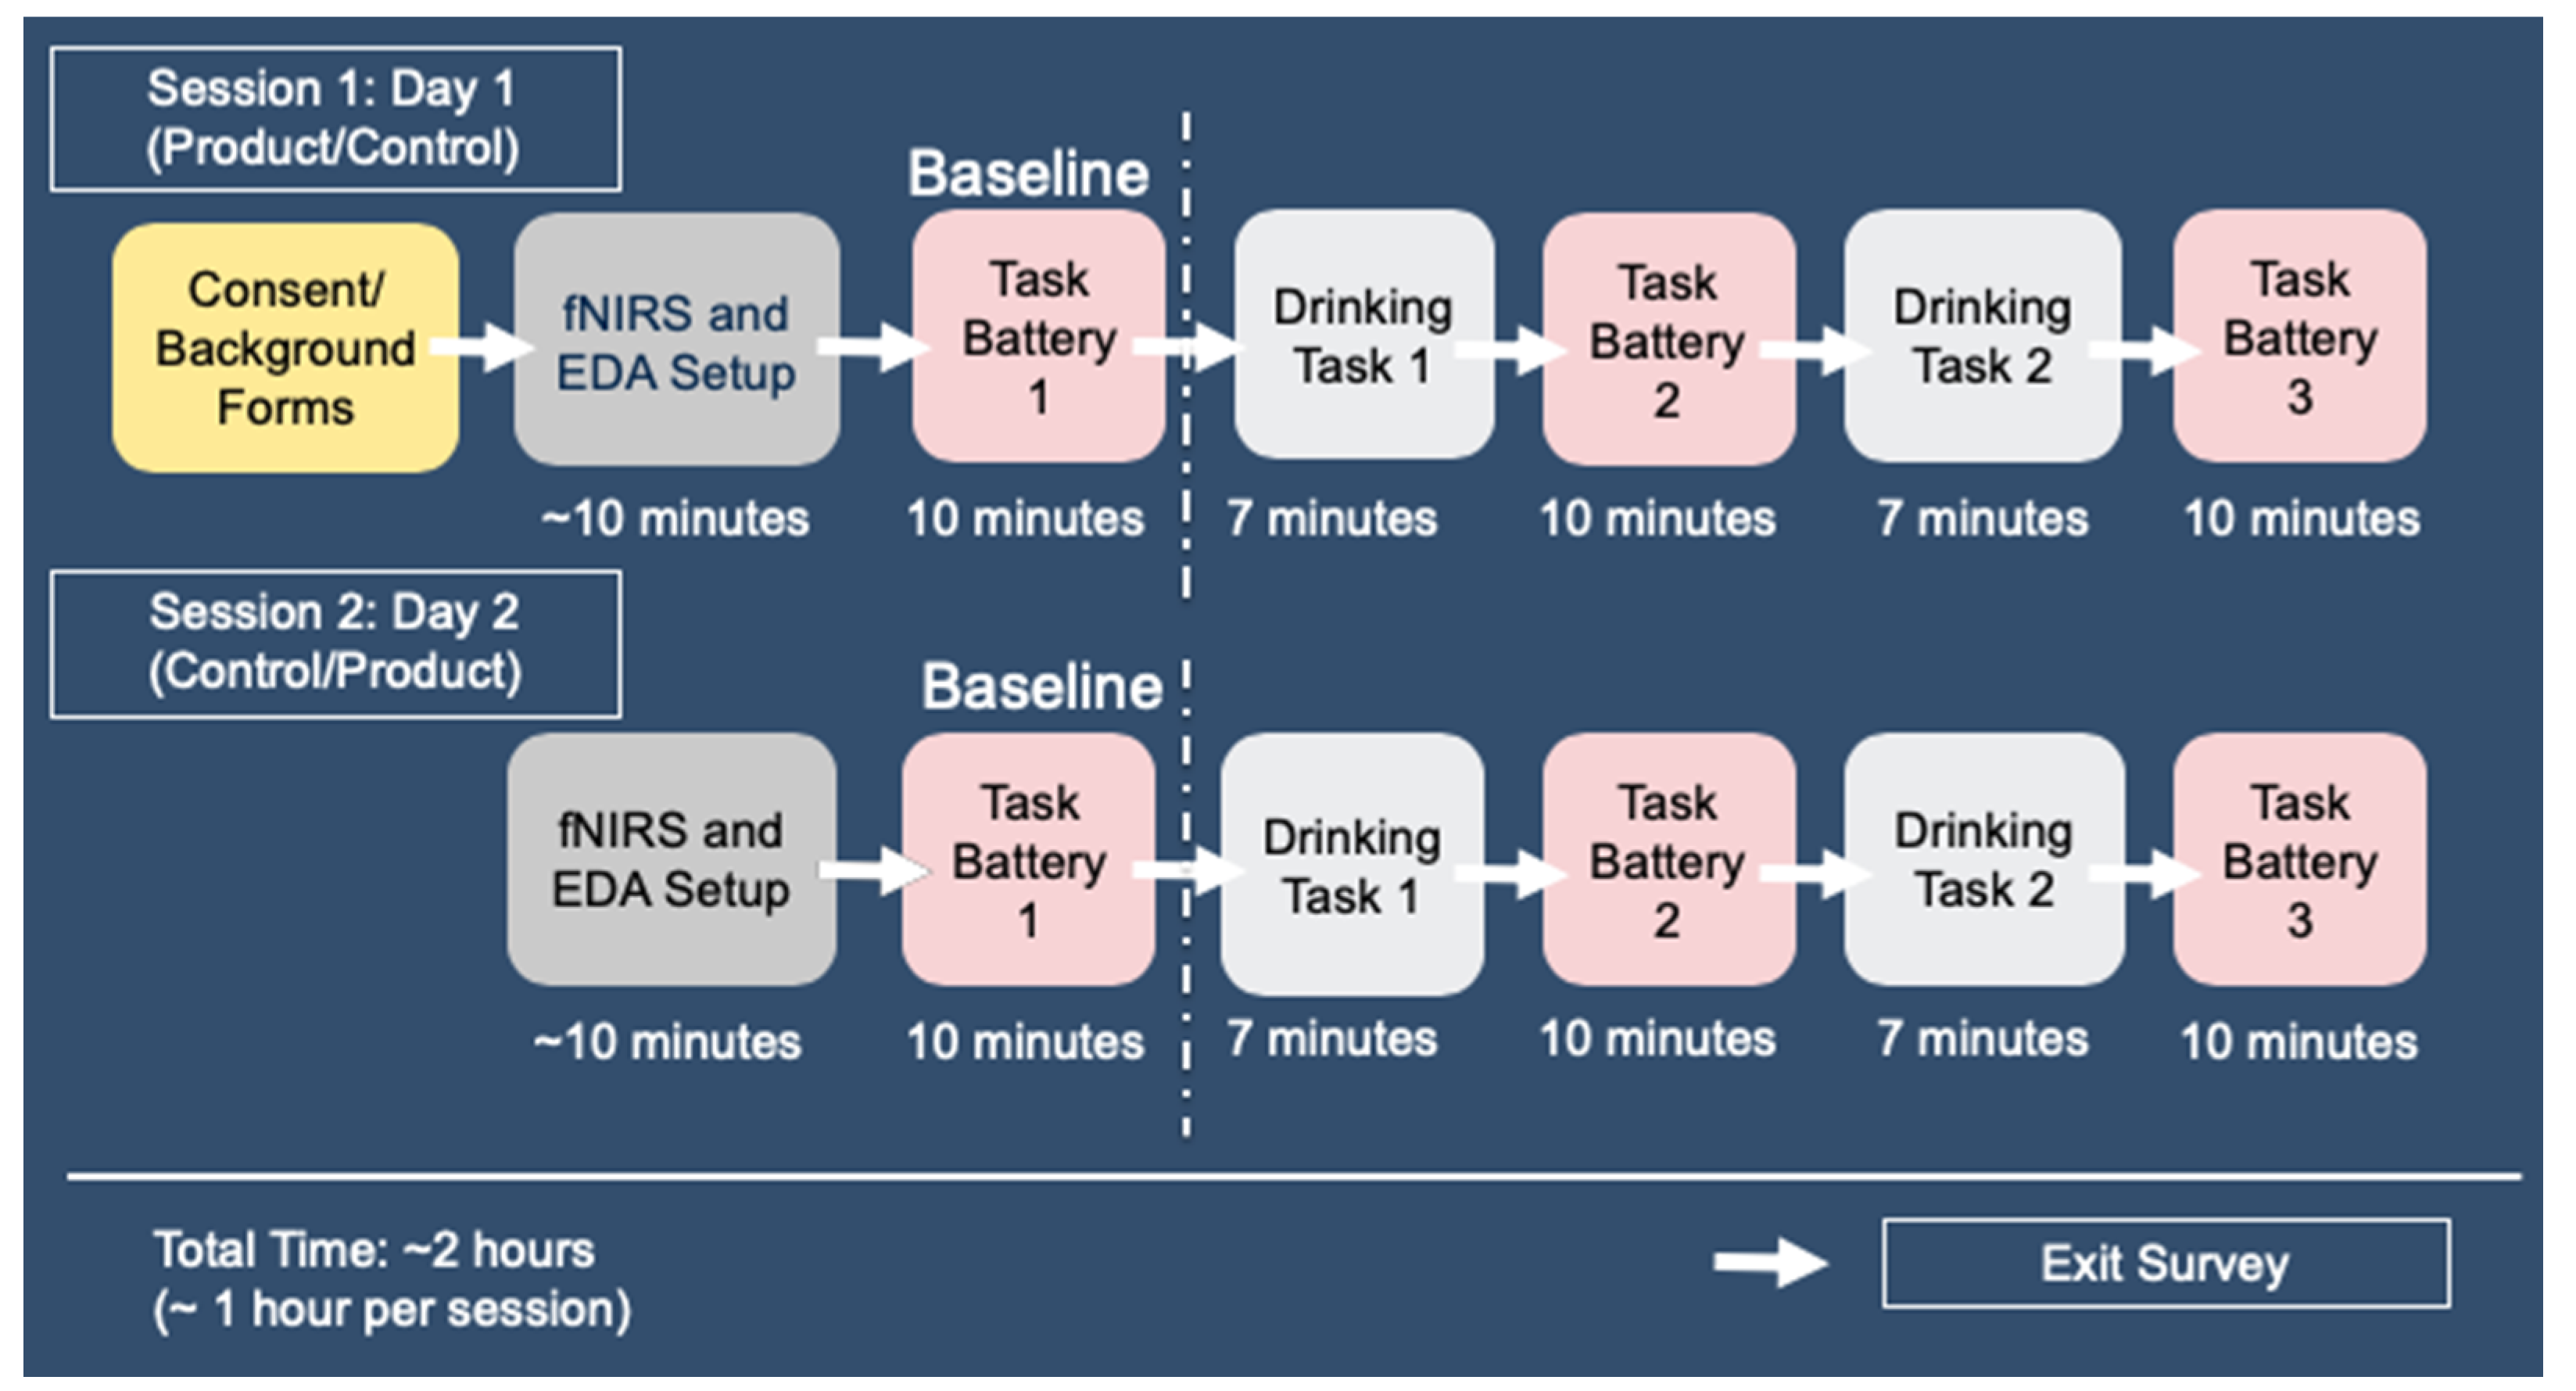
2.2. Experimental Procedure

The study compared the effects of three cognition-enhancing hot beverages (two types of tea and one type of coffee) to a comparable (control) traditional hot beverage (herbal tea and Columbian coffee). The experiment was performed over two one-hour sessions with a minimum of one week between testing sessions. Using a within-subjects repeated measures design, participants completed a series of three cognitive tasks over three blocks and consumed either a cognition-enhancing hot beverage (coffee or tea) or a traditional hot beverage. The traditional hot beverage (coffee or tea) acted as a control. Prior to the start of the study, participants expressed their preference for hot tea or coffee and were assigned to their preferred beverage category for product consumption in the study. Participants expressing preference for tea were randomly assigned to either the blue tea or yellow tea (40 per group). Both these teas were enhanced teas albeit with a slight difference in composition. These teas were lemongrass hibiscus herbal infusions with turmeric, ginseng, and ginkgo. The difference between the teas was that the yellow tea contained caffeine (40–50 mg) while the blue tea did not. The traditional (control) hot tea was a lemon herbal tea containing no caffeine. Similarly, the enhanced coffee was a ground arabica coffee with added cocoa flavanols, while the traditional (control) hot coffee contained a medium Colombian coffee blend. Both coffee types (traditional and enhanced) contained approximately 90–100 mg of caffeine. After giving consent, participants were fitted with sensor devices as described in the next section. Participants consumed a different beverage in each session (day 1 and 2), but the same beverage (enhanced or traditional) was used for all blocks in a single session. Participants were instructed not to consume any hot beverages for at least two hours before partaking in the study.
A task battery was designed to simulate tasks that participants would complete during a workday. The first task was a mental arithmetic task. Addition and multiplication were performed at varying difficulty levels. For the simple task, participants were given single-digit integers (3 + 5 or 4 × 6). For the challenging task, participants were given double-digit integers (14 + 62 or 12 × 15) to increase task difficulty. The challenging task requires more effort, concentration, and focus than the simple task. Participants were given up to 10 seconds to respond to each question with a five second inter-stimulus period. The task lasted a total of three minutes.
The next task was a sustained attention task, rapid visual processing (RVP). Participants were asked to identify a given target in a series of numbers where digits were presented serially one at a time. Target sequences were either a single-digit (2) or a triple-digit sequence (2–4–6) in order to increase difficulty. Participants were instructed to press ENTER on the last number of the sequence when it appeared in order. The digits, from 1 to 9, appeared in pseudo-random order on a screen at a rate of 100 digits per minute. This task requires sustained attention and focus to be able to perform well. Participants were given a total of 4 target sequences to identify, two simple and two challenging. The task lasted a total of three minutes.
The final task was a conflict resolution task, Stroop task. In this task, there are again two levels of difficulty, simple (congruent) and challenging (incongruent). Participants were asked to look at color words (i.e., red or blue) under two different conditions: congruent, where the word was displayed in the color that its name denoted (e.g., "blue" displayed in blue font) and incongruent, where the word was displayed in a different color font than its name denoted (e.g., "blue" displayed in yellow font). For this task, participants are required to keep multiple things in memory in order to perform well. Participants completed a total of four blocks, two congruent and two incongruent. The task lasted a total of four minutes.
After completing the task battery, at the end of trial 1 and 2, participants were provided a 236.5 ml cup of the assigned beverage (enhanced or traditional) to consume. The first task battery was completed before participants consumed either beverage, which was used as a baseline for task performance. Participants were first asked to consume the beverage unsweetened and black (without sugar). They were given three minutes to consume the beverage in this manner and were then given the opportunity to add sugar to their preference for tea and cream and sugar for the coffee. They were given four additional minutes to consume the beverage. Participants were provided a total of seven minutes to drink the beverage and then were asked to complete a survey regarding their attitude about the beverage. The beverage was weighed before consumption, after any cream/sugar was added, and after the drinking period to determine how much of the beverage was consumed by the participant. Participants completed a short survey to assess their mood as well their attitude about the beverage in the consumption session after each trial. All surveys were presented on the computer. Participants then proceeded to complete the cognitive tasks a second time. After completion of the cognitive task battery, participants then completed the 7-minute beverage consumption task that was previously described before completing the cognitive task battery a third and final time. Each session lasted approximately one hour in length. After the second session, participants completed an exit survey to compare the likeability between the enhanced and traditional beverages. A diagrammatic version of the protocol can be seen in Figure 1.

2.3. EDA (Electrodermal Activity) Signal Acquisition and Analysis

Electrodermal activity was measured using a Shimmer 3 GSR+ (Shimmer Sensing, Dublin, Ireland). Skin conductance was measured in micro Siemens (µS), with a sampling rate of 10 Hz using Shimmer Capture software. The EDA sensor included two probes attached by means of durable rubber-coated wires and two white Velcro finger connectors, placed on the middle and index fingers of the left hand [33]. The sensor uses the constant voltage method. Time-synchronized blocks for each trial were processed using the MATLAB Toolbox Ledalab [34].
Raw skin conductance (µS) levels were filtered with a 2nd-order zero-phase 0.5 Hz low-pass Butterworth filter. Trough-to-peak (TTP) analysis was applied using Ledalab for each trial. TTP looks at the peaks with respect to skin conductance levels and detects the peaks that exceed a certain threshold [34,35]. Ledalab extracted the number of peaks that met the threshold of 0.01 µS and the sum of their amplitudes. The mean of the SCR amplitude (sum of amplitudes/the number of significant peaks in the window) was calculated and extracted.

2.4. fNIRS (Optical Brain Monitoring) Signal Acquisition and Analysis

A continuous wave fNIRS system, model 1100 (fNIR Devices, LLC, Potomac, MD, USA), was used to record prefrontal hemodynamics. The positioning of the light sources and detectors on the sensor pad yielded a total of 48 channels and 16 optodes (measurement areas) with 2 Hz sampling and was designed to monitor dorsal and anterior frontal cortical areas underlying the forehead [36,37]. Anatomical landmarks were used to ensure consistency of sensor placement as described in [38]. COBI Studio software was used for data acquisition and visualization [38]. Light intensity at two near-infrared wavelengths of 730 and 850 nm was recorded. All data were filtered and processed offline after recording. Data were passed through a finite impulse response hamming filter of order 20 and cutoff frequency 0.1 Hz. Time-synchronized blocks for each trial were processed with the modified Beer–Lambert law to calculate oxygenation for each optode.

2.5. Statistical Analysis

NCSS software version 10.0.14 was used for statistical analysis using linear mixed models with repeated measures. Between and within fixed factors for the model were block (before consumption, after consumption 1 and after consumption 2), group (blue tea, yellow tea, coffee), drink (enhanced or traditional), and level (simple or challenging). The factor “block” was chosen to see if there was any difference between the baseline (before consumption) and after consuming the beverage. The factor “group” was chosen to compare between the three different enhanced beverages. “Drink” was chosen to compare the enhanced and traditional beverages. Finally, the factor “level” was chosen to determine if the beverage helped more for simple or challenging tasks or the overall task.

3. Results

Each participant performed the tasks a total of three times per session, before consumption, after drink 1, and after drink 2. The results for the self-reports, behavioral efficiency, arousal, and neural efficiency from prefrontal cortex hemodynamics are summarized below.

3.1. Self-Reports

3.1.1. Beverage Likeability

After consuming the hot beverage (tea or coffee), participants rated the likeability of the beverage on a 9-point scale (1 = not at all, 9 = extremely). A comparison of self-reported data for both traditional and enhanced beverages shows that there was no significant difference in the interaction between drink and group (F2,351 = 2.1899, p = 0.113) seen in Figure 2.

3.1.2. Confidence in Task Performance

After consuming the hot beverage (tea or coffee), participants rated their perceived confidence level about their task performance on a 9-point scale (1 = not at all, 9 = extremely). A comparison of self-reported data for both traditional and enhanced beverages shows that there was no significant difference for the interaction between drink and group (F2,351 = 1.7067, p = 0.183) seen in Figure 3.

3.2. Behavioral Performance

While analyzing the behavioral results, we developed a composite score, ‘behavioral efficiency’(BE), which was calculated by dividing the accuracy percentage of a participant’s score by their average response times. BE increases as the number of correct trials increases and the average response times decrease. A participant is more efficient when they respond quickly and correctly.

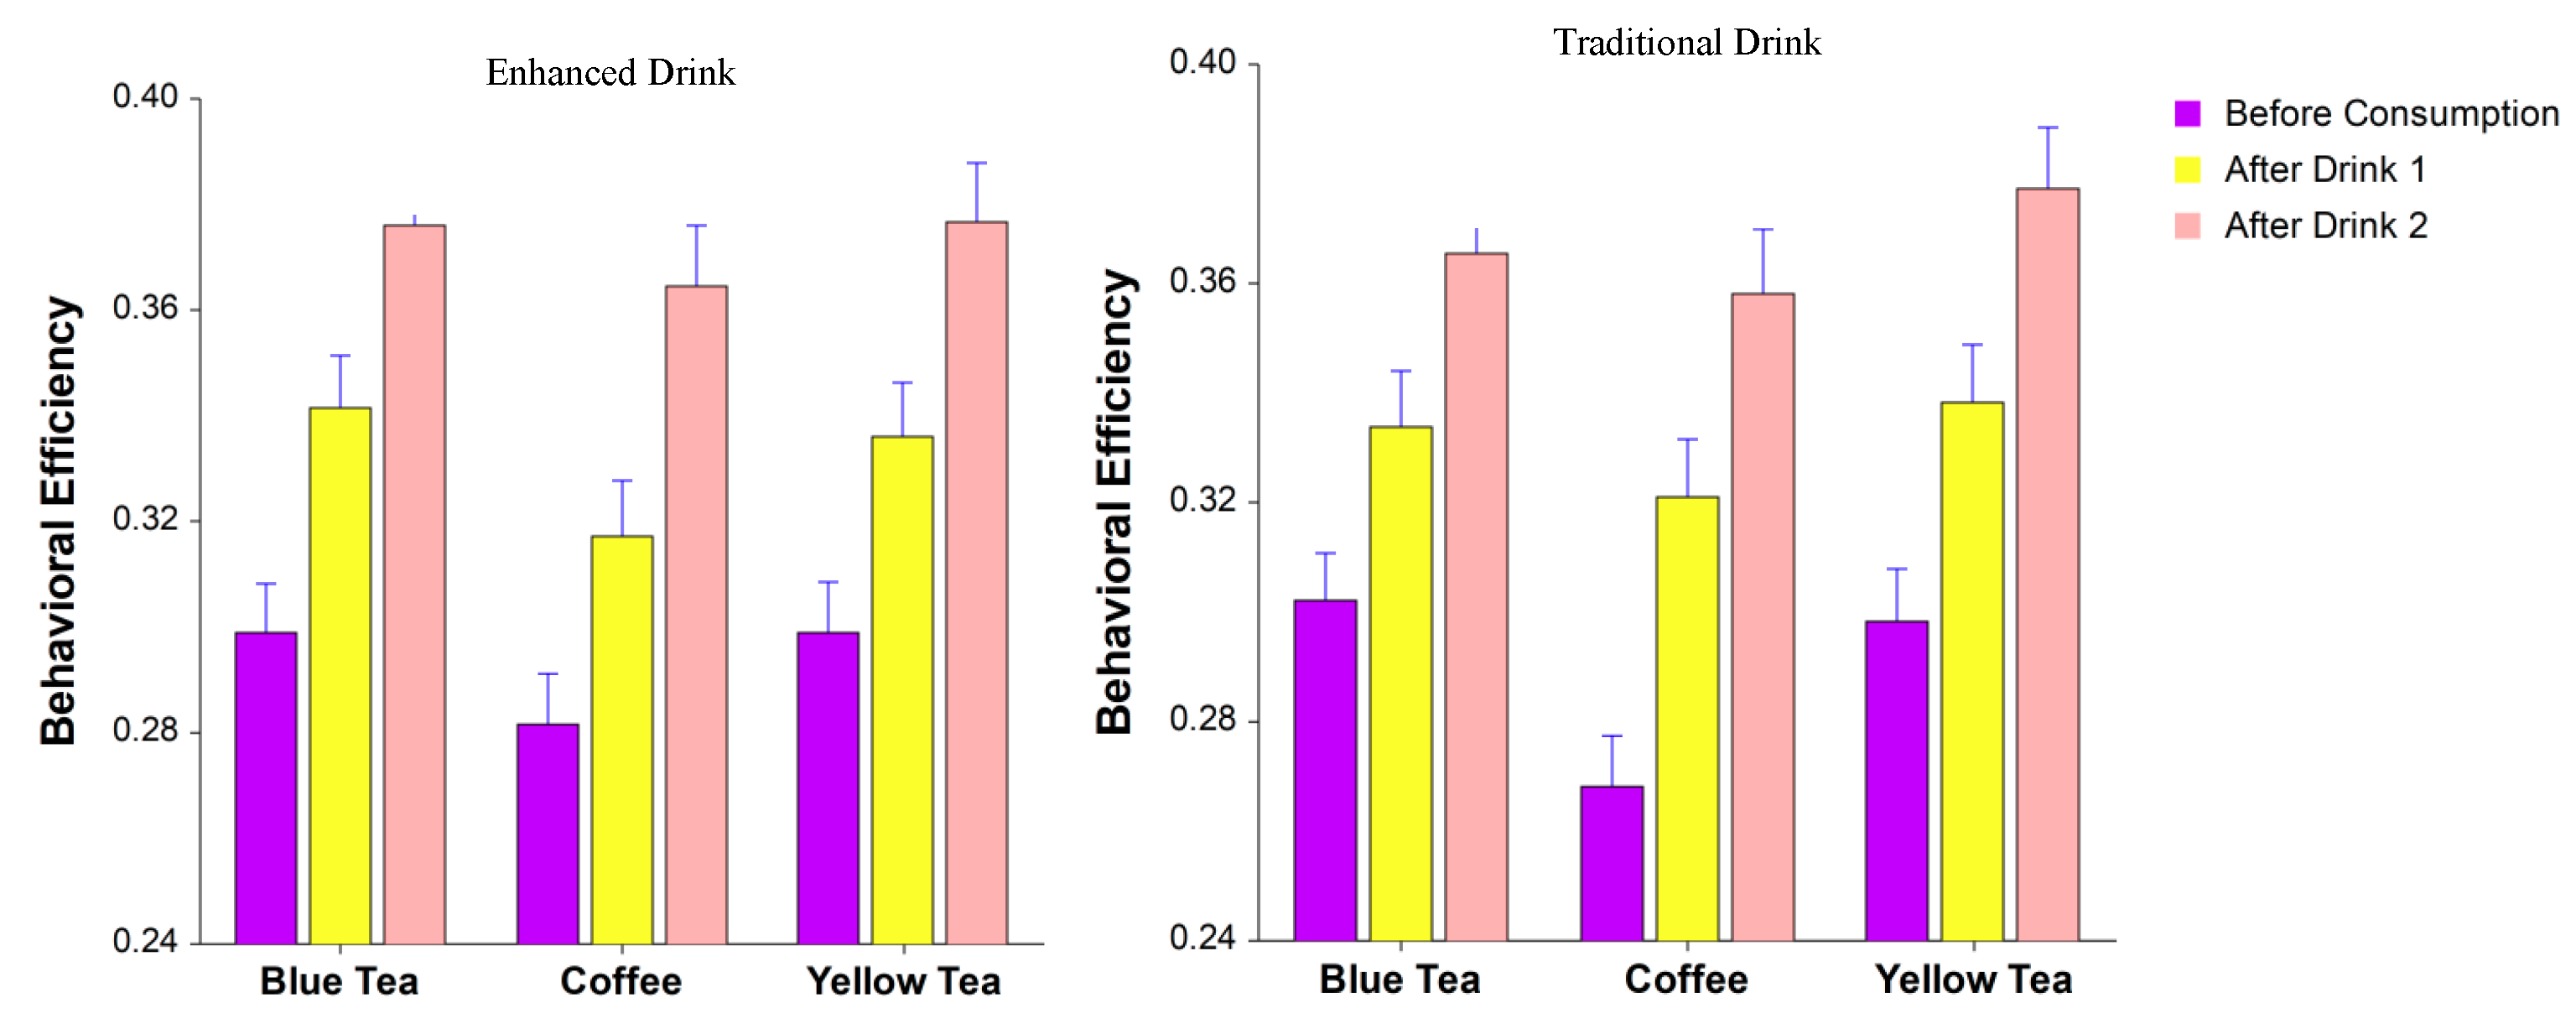
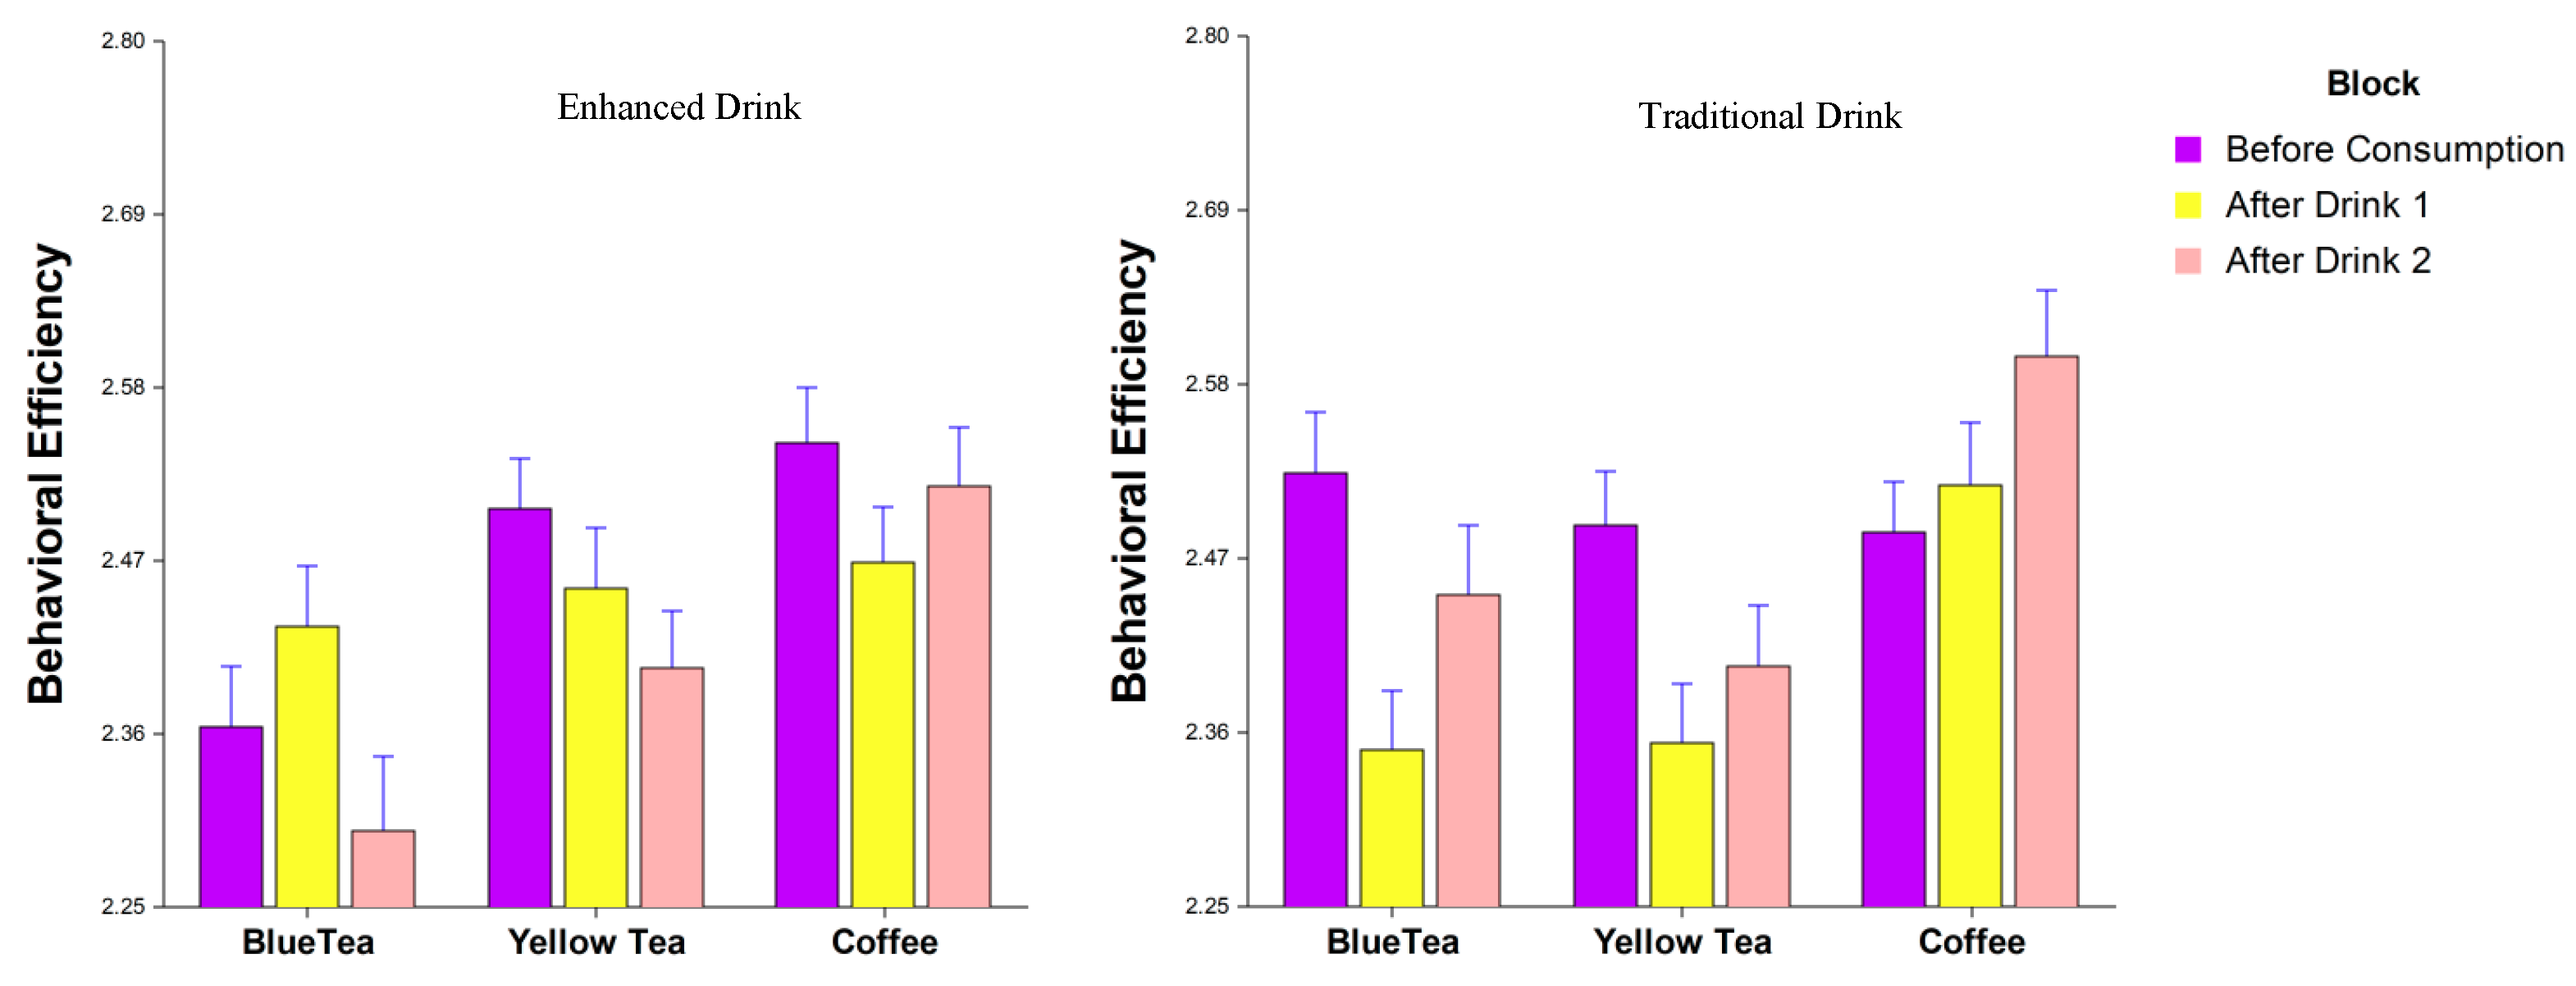
3.2.1. Task Performance

Participants completed each cognitive task a total of three times, before consumption, after drink 1, and after drink 2. We calculated their behavioral efficiency score and compared the enhanced drink and the traditional drink for each group. For the math task, there was a significant main effect for group (F2,11502 = 6.4570, p = 0.002); however, there was no significant interaction between group, drink, and block (F4,11502 = 0.2629, p = 0.902) seen in Figure 4.
Next, we looked at the behavioral efficiency in the RVP task. There was a significant main effect for group (F2,14382 = 13.323, p = 0.0001) but no significant interaction between group, drink, and block (F4,14382 = 2.1746, p = 0.069) seen in Figure 5.
Finally, for behavioral task performance, we looked at the behavioral efficiency in the Stroop task. There was no significant main effect for group (F2,702 = 1.81, p = 0.163), and there was no significant interaction between group, drink, and block (F4,702 = 0.11, p = 0.977) seen in Figure 6.

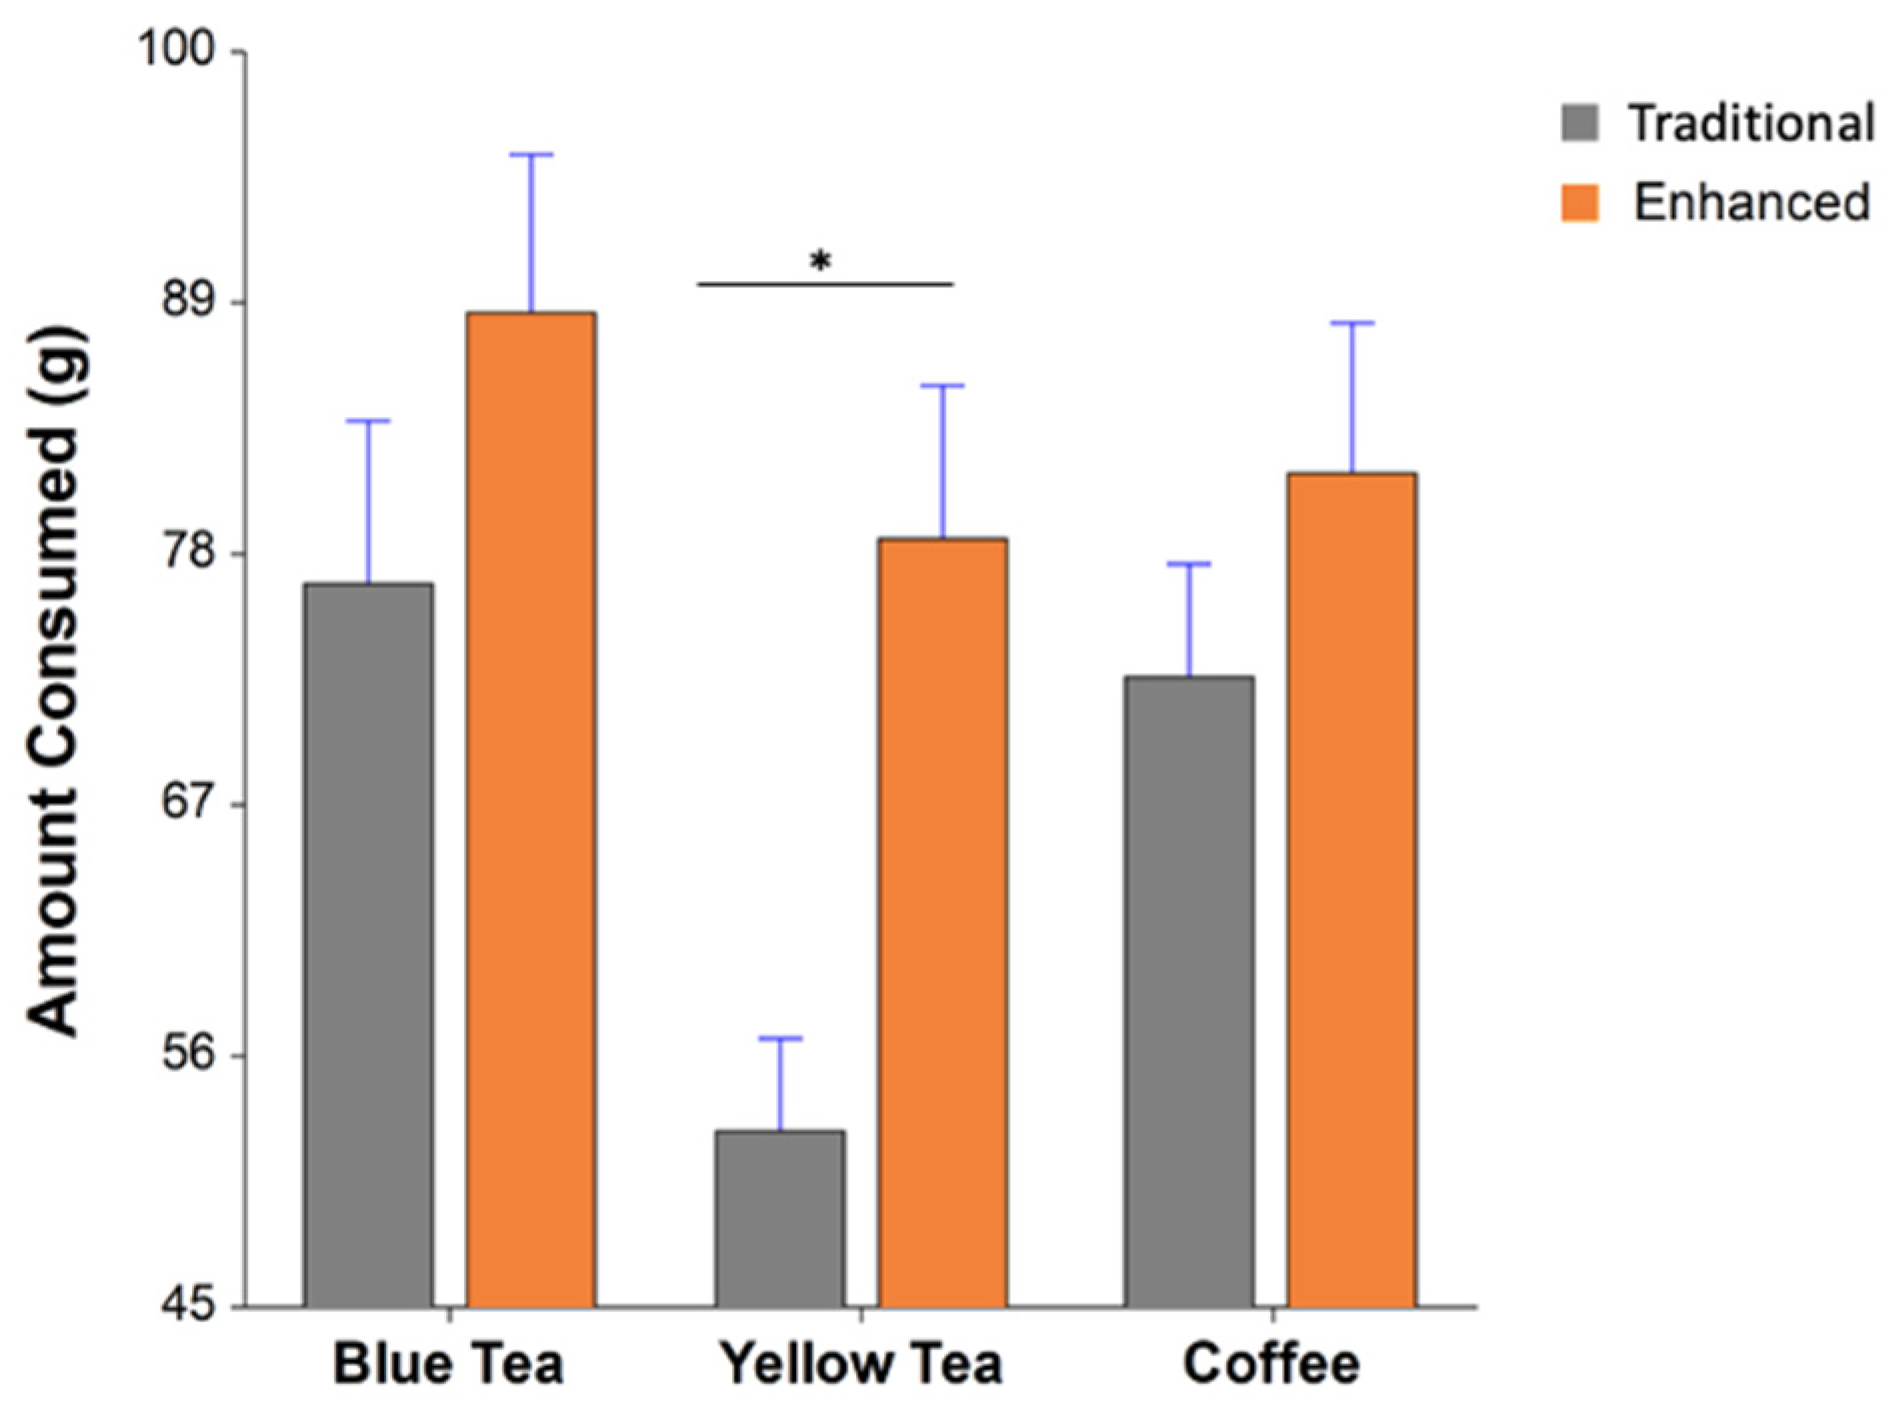
3.2.2. Beverage Consumption

Participants consumed the hot beverage two times during each session: after the first task block and after the second task block. We weighed their beverage at the start of the consumption period and at the end of the consumption period. We also weighed the amount of cream/sugar participants added if they chose to do so. There was an overall main effect for drink (enhanced/traditional) (F1,472 = 9.632, p = 0.002). Post hoc results indicated a significant difference between the enhanced and traditional drinks for the yellow tea group (F1,472 = 9.022, p = 0.008) in Figure 7.

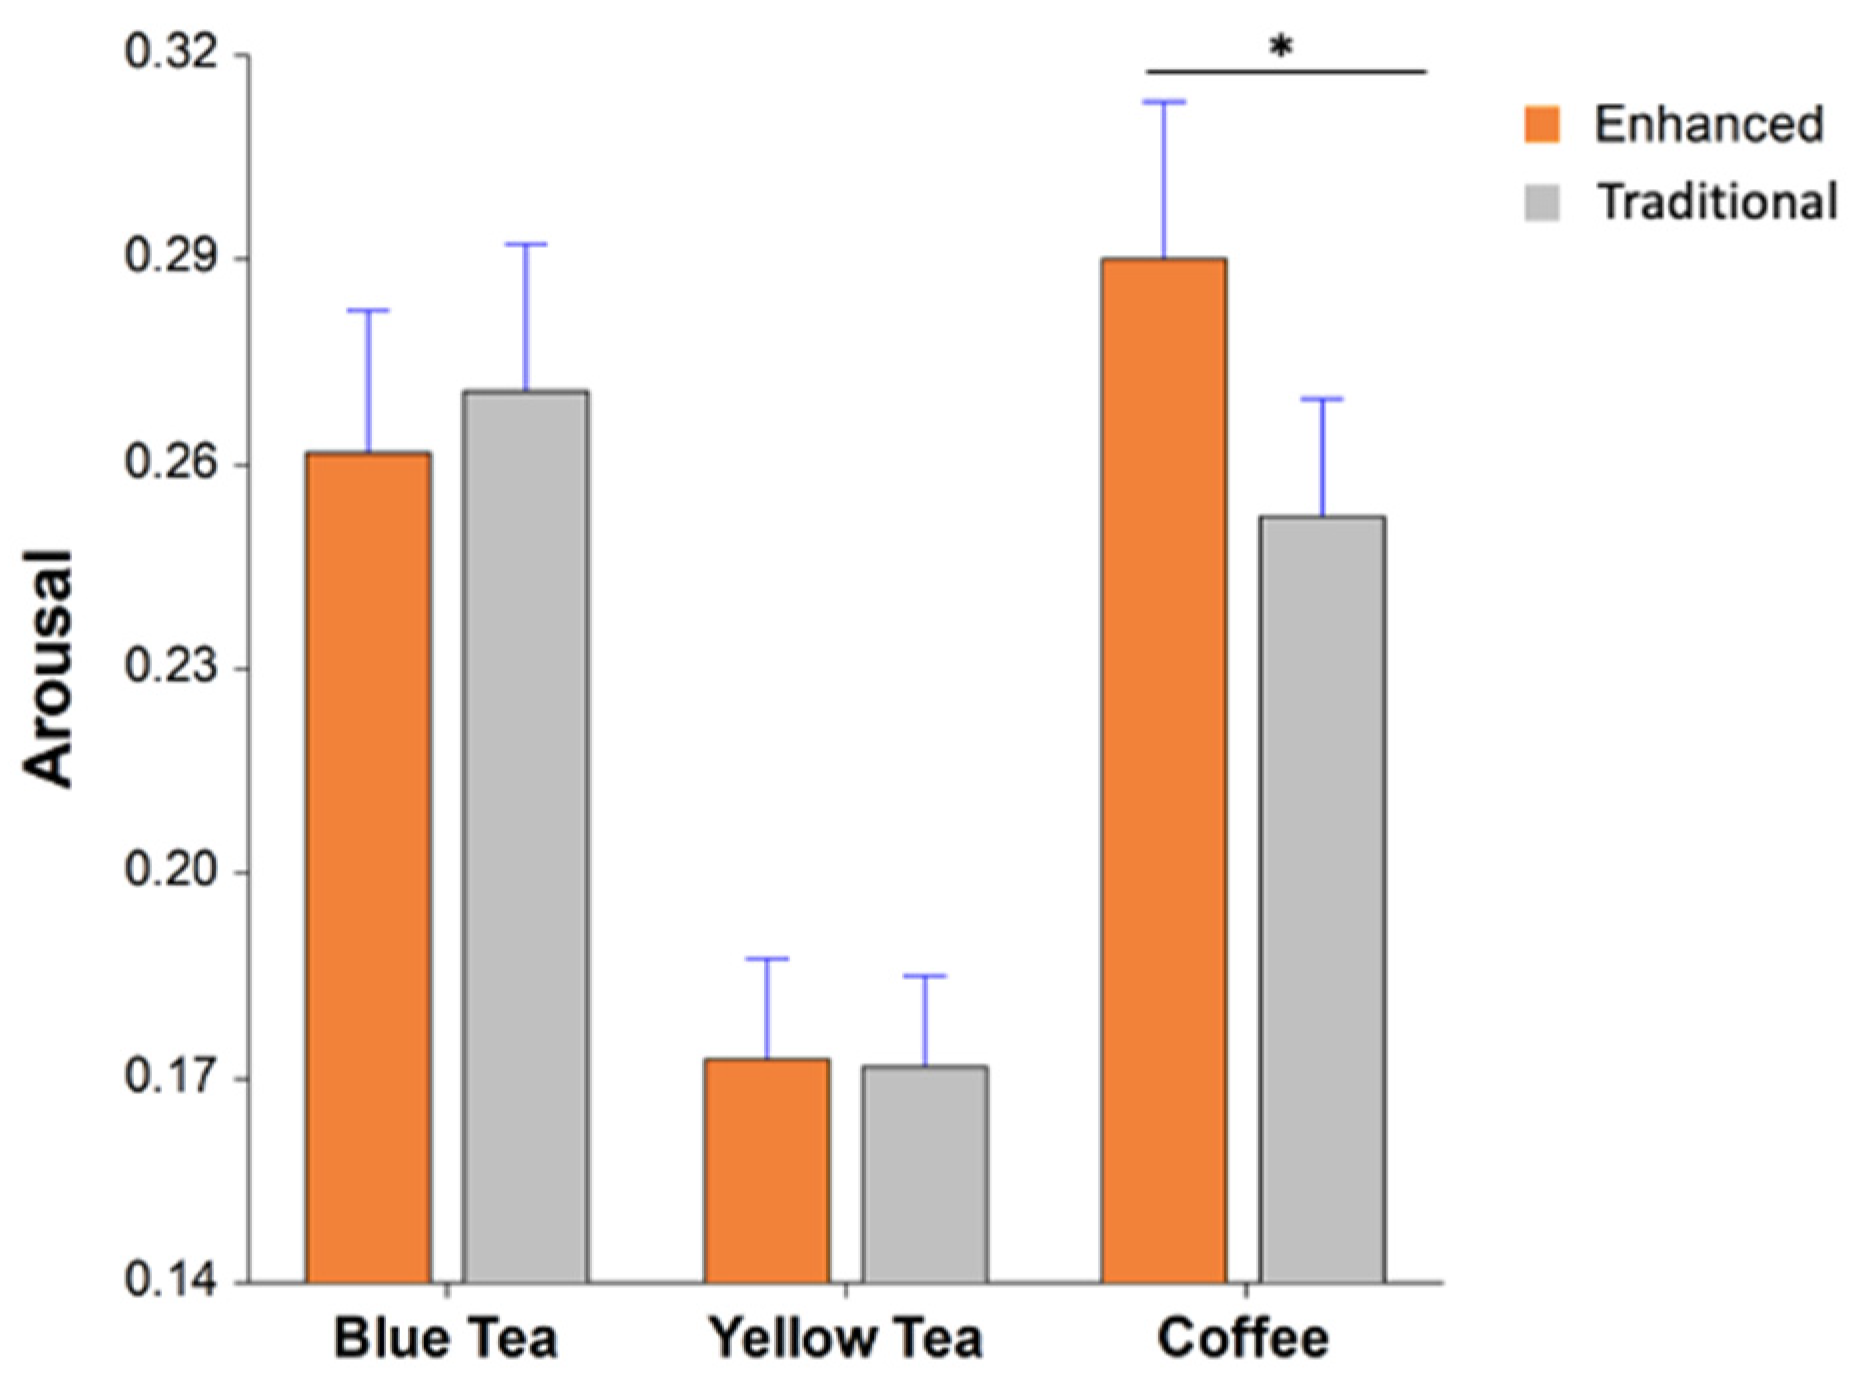
3.3. Electrodermal Activity

For the electrodermal activity, we looked at arousal levels during drink consumption using TTP analysis as previously described. While participants consumed the hot beverage, there was a significant main effect for group (F2,110.4 = 4.8256, p = 0.009) as well as a significant interaction between group and drink (F2,312.3 = 4.1855, p = 0.016). Post hoc results indicated a significant difference between the enhanced and traditional coffee (F1,309 = 8.622, p = 0.011) in Figure 8.

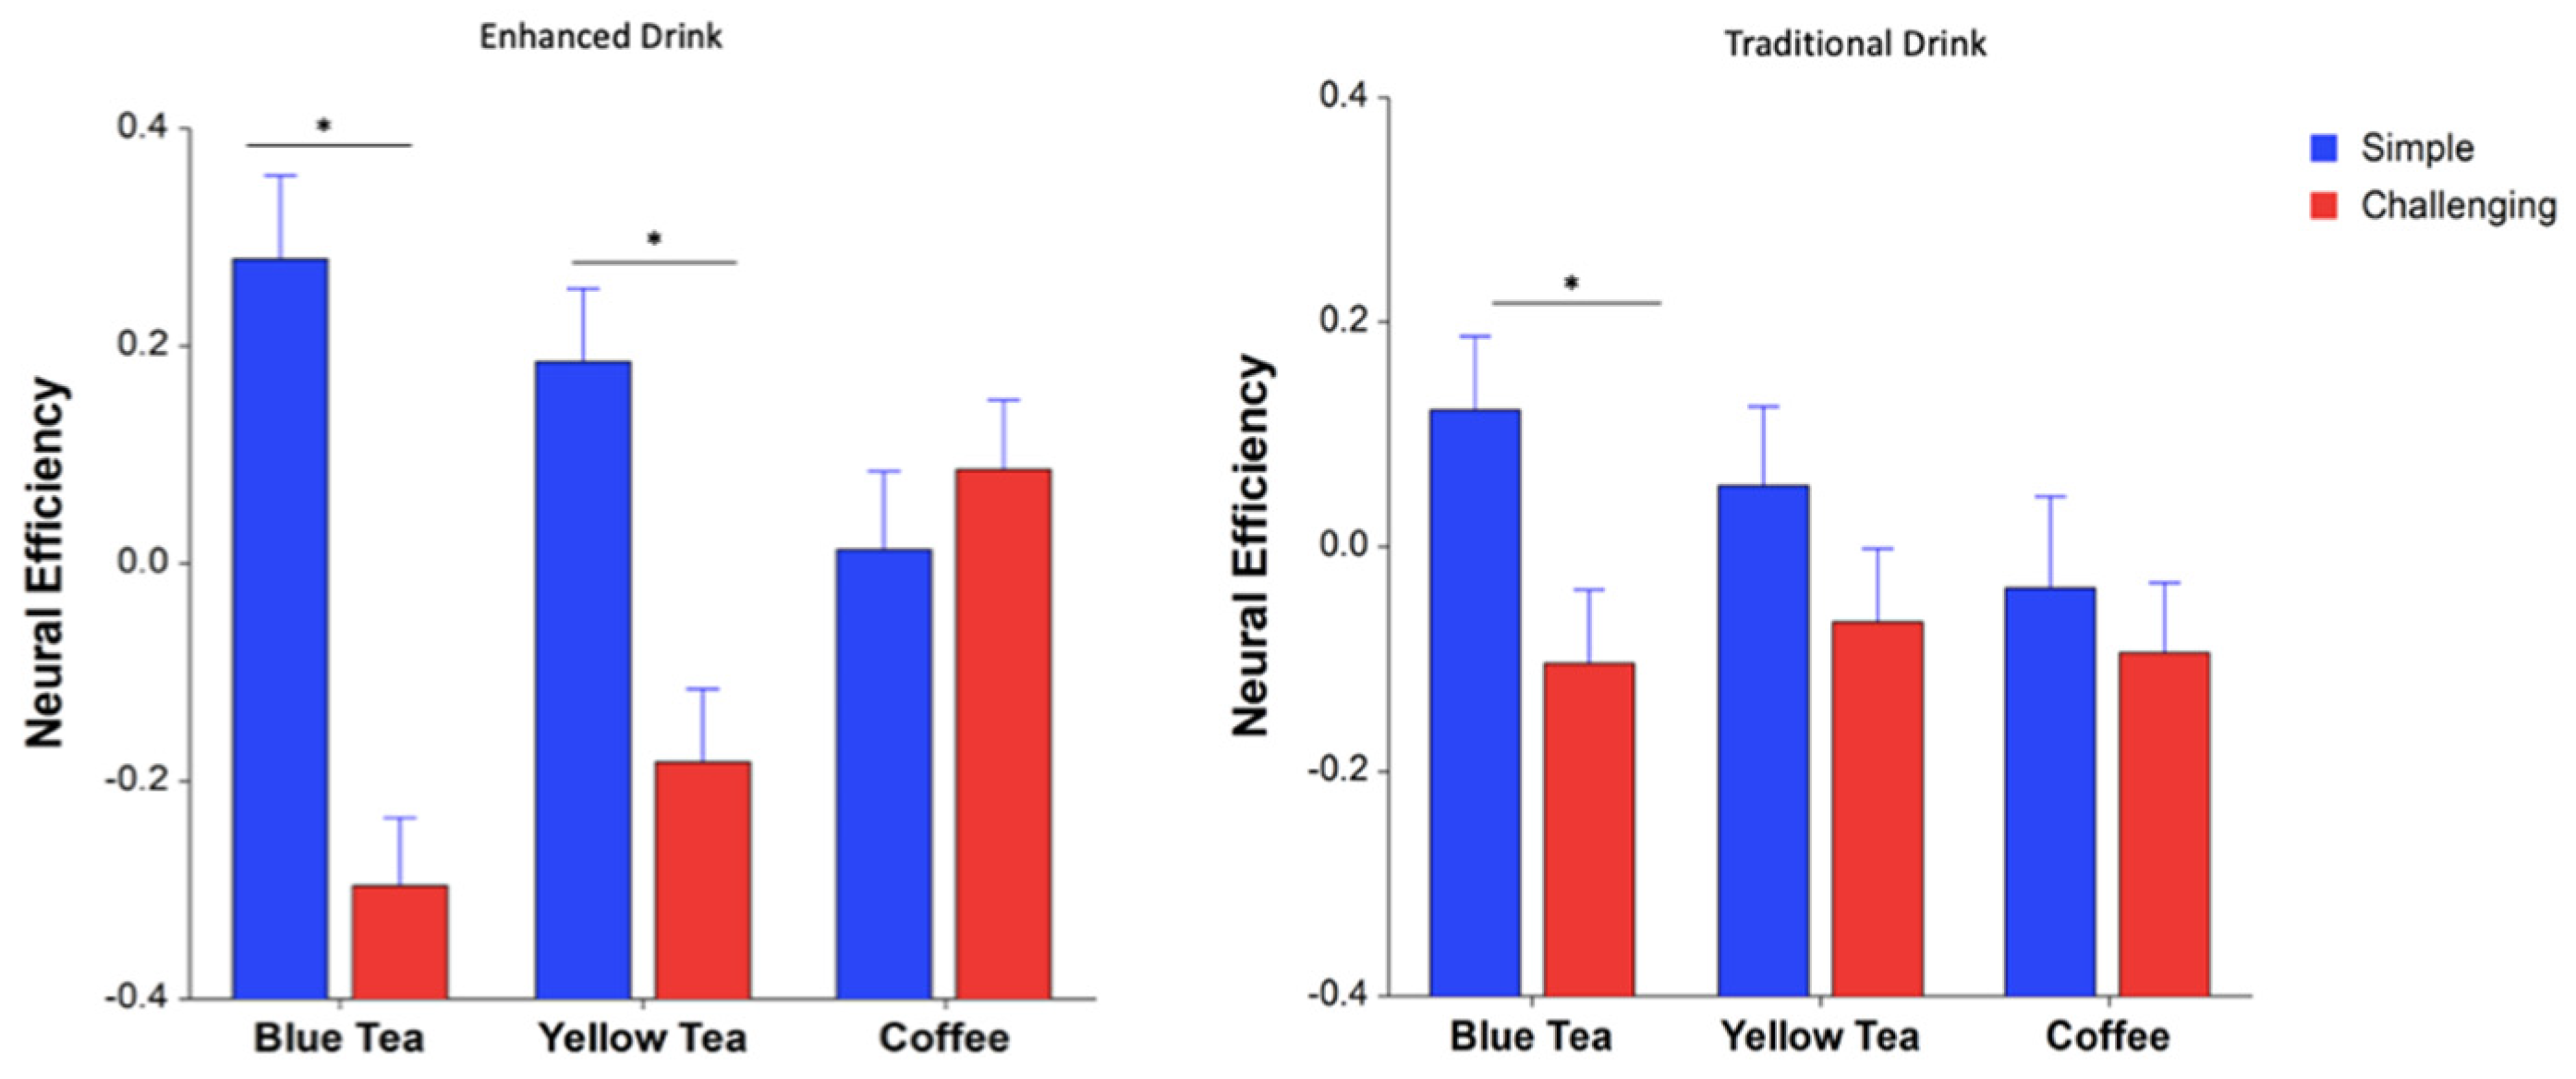
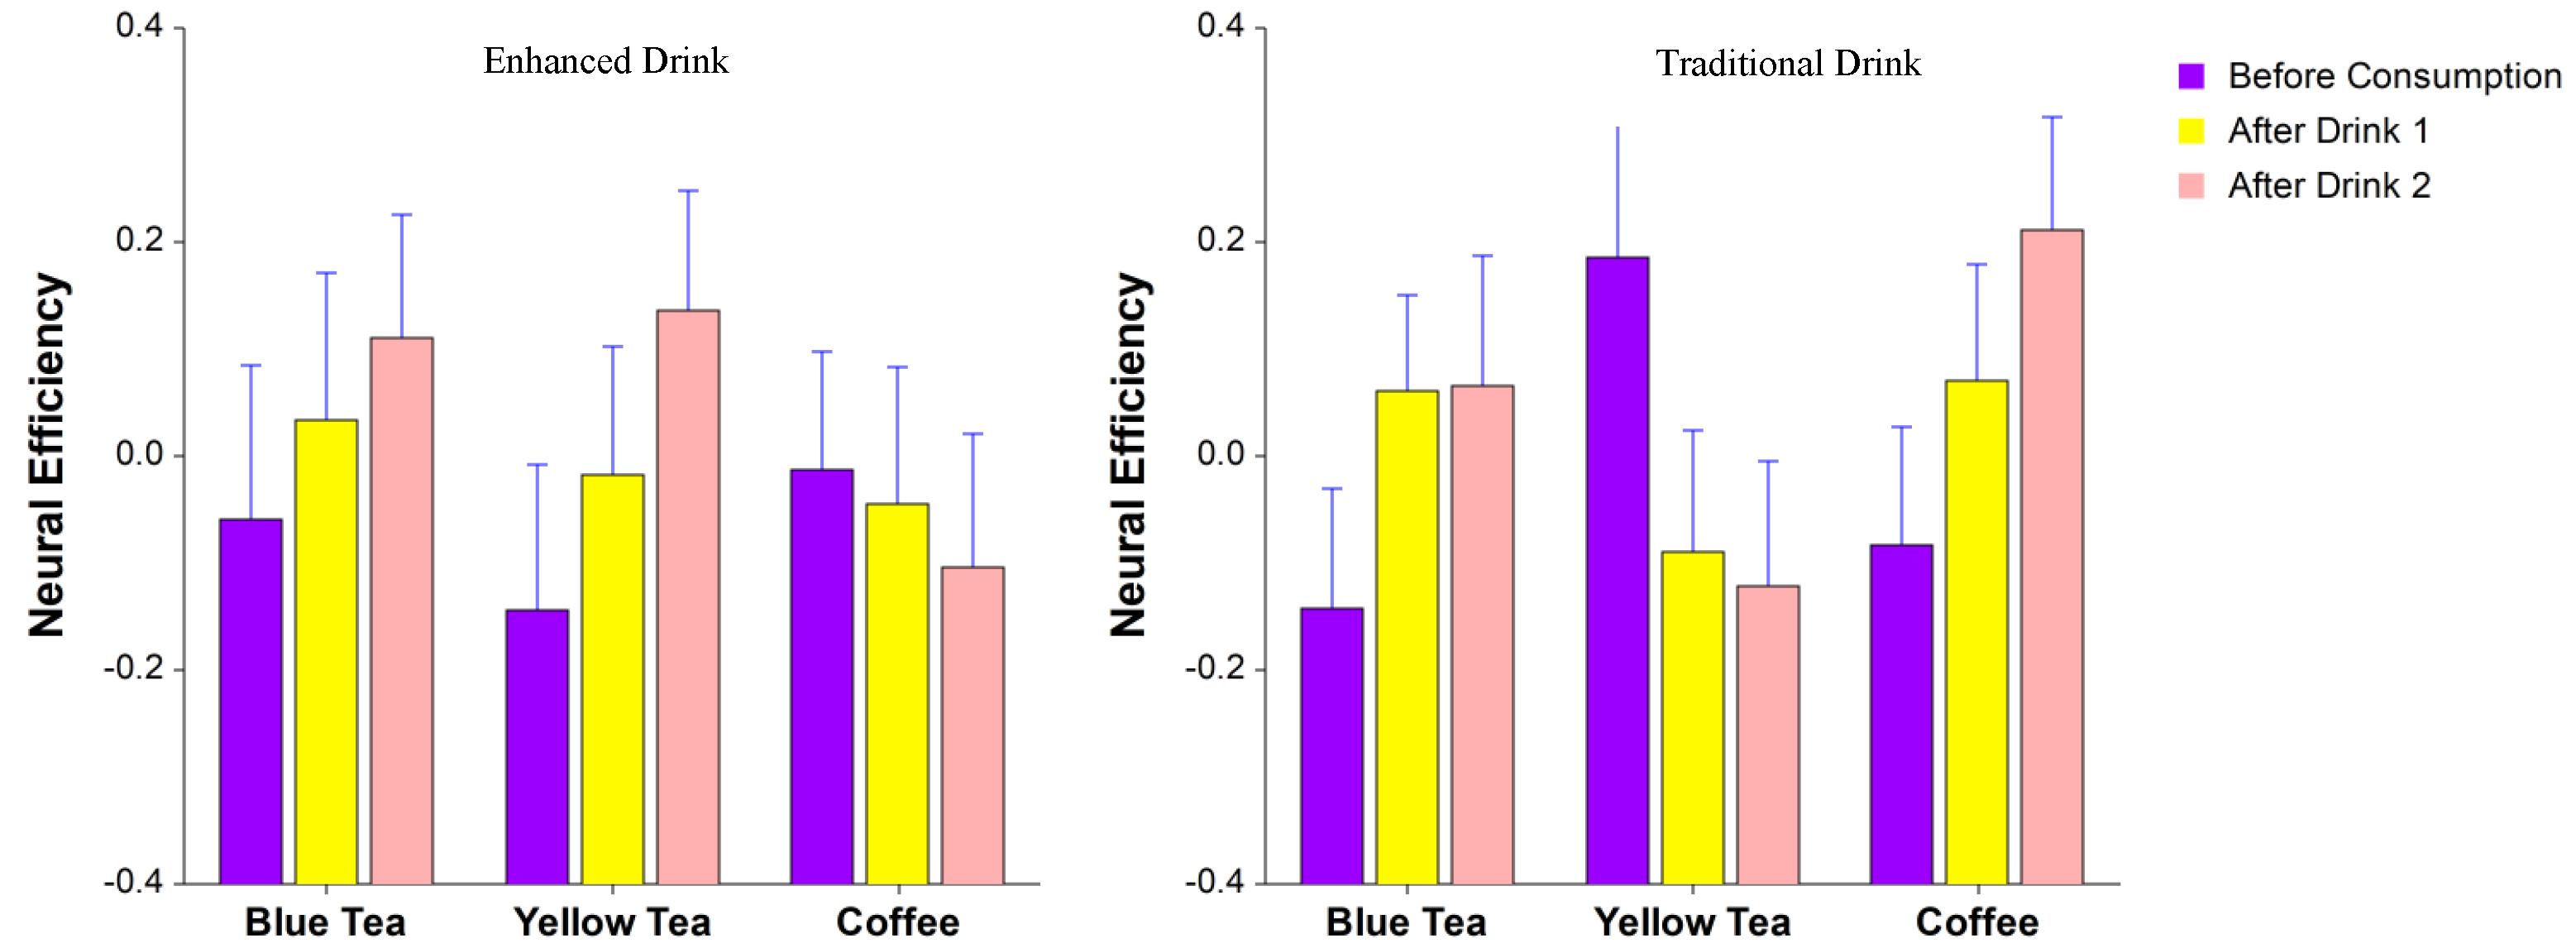
3.4. Neural Efficiency

An NE metric was calculated using a composite score from the behavioral efficiency and the brain activity (fNIRS) as described by [17].

3.4.1. Math Neural Efficiency

For the math task, there was a significant interaction between group, drink, and level (simple/challenging) (F4,2407 = 3.5266, p = 0.029). Post hoc results indicated a significant difference between the simple and challenging levels for the enhanced blue tea (F(1,377) = 13.9, p = 0.01), enhanced yellow tea (F(1,444) = 15.34, p = 0.001), and the traditional blue tea (F(1,420) = 5.805, p = 0.016) groups in Figure 9.

3.4.2. RVP (Rapid Visual Processing) Neural Efficiency

For the RVP task, there was a significant interaction between group, drink, and block (before consumption/after drink 1/after drink 2) (F4,1862 = 2.4442, p = 0.044) in Figure 10.

3.4.3. Stroop Neural Efficiency

Finally, for the Stroop task, there was a significant interaction between group, drink, and block (before consumption/after drink 1/after drink 2) (F4,1132 = 2.313, p = 0.0557) in Figure 11.

4. Discussion

Tea and coffee are consumed by millions of Americans every day, but which has a higher impact on cognitive performance has not been conclusively determined. In this study, three different cognitive domains were investigated to assess coffee and tea products during a multi-day within-subject controlled study. While participants’ self-reported responses did not indicate that they felt confident about their task performance while consuming either hot beverage, their behavioral and neural efficiency results did indicate significant group and drink differences.
One of the main ingredients in both tea and coffee is caffeine. Caffeine is one of the most widely used neurostimulants [3,39,40]. Among adults, the daily intake of caffeine ranges from 166–336 mg/day [41]. A typical cup of tea can contain between 40–60 mg of caffeine per serving, and coffee can range from 19–177 mg per serving, with Americans averaging approximately two cups per day [3,42]. Caffeine has subjectively been shown to improve performance and memory, reduce errors in tasks, speed up cognitive processing, and improve mood [43,44]. Caffeine is able to improve concentration and attention by eliminating distractors and improving focus [45]. Further caffeine consumption can improve vigilance performance and reaction time [45]. Functional magnetic resonance imaging (fMRI) has been used to look at the effects of caffeine on cognition [46]. One study reported that caffeine alters neuronal activity in the dorsolateral prefrontal cortex (DLPFC) during working memory tasks [47]. However, there is no conclusive evidence on whether tea or coffee is better for improving cognitive ability.
Specific ingredients such as cocoa flavanols and gingko and ginseng can be added to traditional tea and coffee to enhance their effects on cognition. Cocoa flavanols have been shown to positively influence cognitive performance through increased central and peripheral blood flow [48,49,50]. The increase in blood flow could improve performance for a wide range of tasks through increased attention, motivation or arousal [48,51]. Ginkgo and ginseng have been shown to improve different aspects of cognitive performance [52,53,54,55].
During the arithmetic task, behavioral efficiency showed an improvement across the blocks; however, there was no significant difference between the cognition-enhancing beverages and the traditional hot beverages. As expected, neural efficiency was higher during the simple arithmetic task compared to the challenging task. However, for the coffee group, the enhanced coffee significantly improved neural efficiency for the challenging math task compared to the traditional coffee. For the tea groups, there was no difference. The enhanced coffee contained both caffeine and cocoa flavanols, which have been shown to improve cognitive ability [3,48]. Caffeine is able to improve focus and attention while cocoa flavanols are able to increase blood flow, which also affects attention [43,51]. This indicates that enhanced coffee is better when performing mental computations compared to the enhanced and traditional teas. Tea traditionally contains less caffeine than coffee and therefore could require consuming more over a longer period of time to see an effect on cognition [42].
In the RVP task, for behavioral efficiency, we saw no distinct pattern across the blocks for both the cognition-enhancing beverages and the traditional hot beverages. However, for the neural efficiency, both the enhanced blue tea and the enhanced coffee increased neural efficiency across the blocks. Similar to the math task, the enhanced coffee contained both caffeine and cocoa flavanol, both of which have been shown to improve attention and focus [49,50]. The enhanced blue tea contained ginkgo and ginseng, which have also been shown to improve attention and memory, specifically in young adults [53,54]. The enhanced blue tea did not contain any caffeine, which makes it surprising that it outperformed the enhanced yellow tea that did contain caffeine. However, as mentioned previously, consuming more tea may be required to see the effects of caffeine. Results for RVP indicate that for tasks that require sustained attention, the enhanced blue tea and coffee were better for improving neural efficiency.
Last for the Stroop task, for behavioral efficiency, the enhanced blue tea and the enhanced coffee resulted in improvements across the blocks. However, with respect to neural efficiency, the enhanced blue tea and enhanced yellow tea had the greatest effect, whereas the enhanced coffee had the opposite effect and decreased neural efficiency over time. The traditional coffee, however, improved neural efficiency over time. Both the enhanced blue and yellow tea contained added ginkgo and ginseng, which, as mentioned previously, improve memory and attention [53,54,55]. Caffeine, a main component of coffee, has been seen to improve performance in the Stroop task by reducing interference costs [56,57,58]. However, other studies have shown that caffeine does not have an effect on higher-order tasks and also does not affect selective visual attention [59,60]. A possible explanation is that the amount of caffeine consumed during the study was less than what participants regularly consumed and therefore did not have an effect on visual attention. Results from the Stroop task indicate that the enhanced tea was better than the coffee for improving cognitive performance when performing tasks where participants have to multi-task.
During consumption, participants consumed significantly more of the enhanced drinks than the traditional hot beverages. The EDA results show that during consumption, the enhanced coffee was more stimulating to participants than the traditional coffee, which could indicate they liked the enhanced coffee more than the traditional. There was no difference in stimulation for the two tea groups.
One limitation of the study is that we did not have a group that consumed no hot beverage. In the future, we will include a group that simply drinks water to obtain a better measure for comparison of performance. Also, participants were aware of the drink they were consuming and could have been influenced by the packaging of the beverage informing them of the benefits of the cognition-enhancing hot beverages. A future study could be designed to disassociate any potential packing and messaging impact for comparison between the beverages. Finally, controlling for how much caffeine participants consume regularly should be considered in future studies and further analysis of the results.
By using brain and body measures combined with traditional measures, we were able to objectively assess improvement in cognition through the consumption of traditional and enhanced hot beverages. Based on our results, we were not able to conclusively determine whether tea or coffee was better, but we did see that in the workplace, improvement is task dependent. Further, we were able to confirm that the cognition-enhancing hot beverages improved cognitive ability more than the traditional beverages. Traditional coffee had the lowest impact on mental computation. Enhanced tea and coffee worked best for sustained attention. Traditional tea/coffee and enhanced tea worked best for conflict resolution. This is the first study to compare traditional and enhanced hot beverages while performing workplace-related tasks.

Author Contributions

H.A. and R.S. initiated and supervised the project. A.S., J.W., Y.T., and H.Y. carried out the experiment. A.S., Y.T., and H.Y. processed and analyzed the data. All authors discussed and interpreted the results. A.S. wrote the manuscript with support from J.W. and Y.T.; H.A. and R.S. provided critical revisions to the manuscript. All authors have read and agreed to the published version of the manuscript.

Funding

The authors acknowledge the support by the Drexel Solutions Institute at Drexel University to conduct this study. The authors received no financial support for the authorship, and/or publication of this article.

Conflicts of Interest

fNIR Devices LLC. manufactures the optical brain-imaging instrument and licensed IP and know-how from Drexel University. Dr. Ayaz was involved in the technology development and thus offered a minor share in the new startup firm fNIR Devices, LLC. All other authors declare no conflict of interest.

References

  1. Wang, Y.; Ho, C.-T. Polyphenolic chemistry of tea and coffee: A century of progress. J. Agric. Food Chem. 2009, 57, 8109–8114. [Google Scholar] [CrossRef]
  2. Grigg, D. The worlds of tea and coffee: Patterns of consumption. GeoJournal 2002, 57, 283–294. [Google Scholar] [CrossRef]
  3. Nehlig, A. Are we dependent upon coffee and caffeine? A review on human and animal data. Neurosci. Biobehav. Rev. 1999, 23, 563–576. [Google Scholar] [CrossRef]
  4. Stroebaek, P.S. Let’s have a cup of coffee! Coffee and coping communities at work. Symb. Interact. 2013, 36, 381–397. [Google Scholar] [CrossRef]
  5. Waber, B.N.; Olguin, D.O.; Kim, T.; Pentland, A. Productivity through coffee breaks: Changing social networks by changing break structure. Soc. Sci. Res. Netw. 2010. [Google Scholar] [CrossRef]
  6. Mancini, E.; Beglinger, C.; Drewe, J.; Zanchi, D.; Lang, U.E.; Borgwardt, S. Green tea effects on cognition, mood and human brain function: A systematic review. Phytomedicine 2017, 34, 26–37. [Google Scholar] [CrossRef] [Green Version]
  7. Shukitt-Hale, B.; Miller, M.; Chu, Y.-F.; Lyle, B.J.; Joseph, J.A. Coffee, but not caffeine, has positive effects on cognition and psychomotor behavior in aging. AGE 2013, 35, 2183–2192. [Google Scholar] [CrossRef] [Green Version]
  8. Lyvers, M.; Brooks, J.; Matica, D. Effects of caffeine on cognitive and autonomic measures in heavy and light caffeine consumers. Aust. J. Psychol. 2004, 56, 33–41. [Google Scholar] [CrossRef] [Green Version]
  9. Van Dam, R.M.; Hu, F.B. Coffee consumption and risk of type 2 diabetes. JAMA 2005, 294, 97–104. [Google Scholar] [CrossRef]
  10. Wierzejska, R. Can coffee consumption lower the risk of Alzheimer’s disease and Parkinson’s disease? A literature review. Arch. Med. Sci. 2017, 13, 507–514. [Google Scholar] [CrossRef]
  11. Steffen, M.; Kuhle, C.; Hensrud, D.; Erwin, P.J.; Murad, M.H. The effect of coffee consumption on blood pressure and the development of hypertension: A systematic review and meta-analysis. J. Hypertens. 2012, 30, 2245–2254. [Google Scholar] [CrossRef] [PubMed]
  12. Panza, F.; Solfrizzi, V.; Barulli, M.R.; Bonfiglio, C.; Guerra, V.; Osella, A.R.; Seripa, D.; Sabba’, C.; Pilotto, A.; Logroscino, G. Coffee, tea, and caffeine consumption and prevention of late-life cognitive decline and dementia: A systematic review. J. Nutr. Health Aging 2015, 19, 313–328. [Google Scholar] [CrossRef] [PubMed]
  13. Buckenmeyer, P.J.; Bauer, J.A.; Hokanson, J.F.; Hendrick, J.L. Cognitive influence of a 5-h ENERGY(R) shot: Are effects perceived or real? Physiol. Behav. 2015, 152, 323–327. [Google Scholar] [CrossRef] [PubMed]
  14. Smit, H.J.; Rogers, P.J. Effects of ‘energy’ drinks on mood and mental performance: Critical methodology. Food Qual. Prefer. 2002, 13, 317–326. [Google Scholar] [CrossRef]
  15. Warburton, D.; Bersellini, E.; Sweeney, E. An evaluation of a caffeinated taurine drink on mood, memory and information processing in healthy volunteers without caffeine abstinence. Psychopharmacology 2001, 158, 322–328. [Google Scholar] [CrossRef]
  16. Alford, C.; Cox, H.; Wescott, R. The effects of red bull energy drink on human performance and mood. Amino Acids 2001, 21, 139–150. [Google Scholar] [CrossRef]
  17. Curtin, A.; Ayaz, H. Neural efficiency metrics in neuroergonomics: Theory and applications. Neuroergonomics 2019, 133–140. [Google Scholar] [CrossRef]
  18. Haier, R.J.; Siegel, B.; Tang, C.; Abel, L.; Buchsbaum, M.S. Intelligence and changes in regional cerebral glucose metabolic rate following learning. Intelligence 1992, 16, 415–426. [Google Scholar] [CrossRef]
  19. Neubauer, A.C.; Fink, A. Fluid intelligence and neural efficiency: Effects of task complexity and sex. Personal. Individ. Differ. 2002, 35, 811–827. [Google Scholar] [CrossRef]
  20. Sayala, S.; Sala, J.B.; Courtney, S. Increased neural efficiency with repeated performance of a working memory task is information-type dependent. Cereb. Cortex 2006, 16, 609–617. [Google Scholar] [CrossRef] [Green Version]
  21. Neubauer, A.; Fink, A. Intelligence and neural efficiency. Neurosci. Biobehav. Rev. 2009, 33, 1004–1023. [Google Scholar] [CrossRef] [PubMed]
  22. Di Domenico, S.; Rodrigo, A.H.; Ayaz, H.; Fournier, M.A.; Ruocco, A.C. Decision-making conflict and the neural efficiency hypothesis of intelligence: A functional near-infrared spectroscopy investigation. Neuroimage 2015, 109, 307–317. [Google Scholar] [CrossRef] [PubMed]
  23. Paas, F.; Van Merriënboer, J.J.G. The efficiency of instructional conditions: An approach to combine mental effort and performance measures. Hum. Factors 1993, 35, 737–743. [Google Scholar] [CrossRef]
  24. Nielsen Global Health and Wellness Report (2015). We are What we Eat: Healthy Eating Trends Around the World; Nielsen: New York, NY, USA, 2015.
  25. Bhatt, S.; Agrali, A.; Suri, R.; Ayaz, H. Does comfort with technology affect use of wealth management platforms? usability testing with fnirs and eye-tracking. Adv. Intell. Syst. Comput. 2019, 775, 83–90. [Google Scholar]
  26. Ayaz, H.; Dehais, F. Neuroergonomics: The Brain at Work and Everyday Life, 1st ed.; Elsevier Academic Press: Cambridge, MA, USA, 2019. [Google Scholar]
  27. Parasuraman, R.; Christensen, J.; Grafton, S. Neuroergonomics: The brain in action and at work. Neuroimage 2012, 59, 1–3. [Google Scholar] [CrossRef] [PubMed]
  28. Curtin, A.; Ayaz, H. The age of neuroergonomics: Towards ubiquitous and continuous measurement of brain function with fnirs. Jpn. Psychol. Res. 2018, 60, 374–386. [Google Scholar] [CrossRef]
  29. Gramann, K.; Fairclough, S.H.; Zander, T.O.; Ayaz, H. Editorial: Trends in neuroergonomics. Front. Hum. Neurosci. 2017, 11, 165. [Google Scholar] [CrossRef] [Green Version]
  30. McKendrick, R.; Parasuraman, R.; Murtza, R.; Formwalt, A.; Baccus, W.; Paczynski, M.; Ayaz, H. Into the wild: Neuroergonomic differentiation of hand-held and augmented reality wearable displays during outdoor navigation with functional near infrared spectroscopy. Front. Hum. Neurosci. 2016, 10, 216. [Google Scholar] [CrossRef] [Green Version]
  31. Gateau, T.; Ayaz, H.; Dehais, F. In silico vs. over the clouds: On-the-fly mental state estimation of aircraft pilots, using a functional near infrared spectroscopy based passive-BCI. Front. Hum. Neurosci. 2018, 12, 187. [Google Scholar] [CrossRef] [Green Version]
  32. Pinti, P.; Aichelburg, C.; Gilbert, S.; Hamilton, A.; Hirsch, J.; Burgess, P.; Tachtsidis, I. A review on the use of wearable functional near-infrared spectroscopy in naturalistic environments. Jpn. Psychol. Res. 2018, 60, 347–373. [Google Scholar] [CrossRef] [Green Version]
  33. Topoglu, Y.; Watson, J.; Suri, R.; Ayaz, H. Electrodermal activity in ambulatory settings: A Narrative Review of Literature. In Advances in Neuroergonomics and Cognitive Engineering; Springer: Berlin/Heidelburg, Germany, 2020; pp. 91–102. [Google Scholar]
  34. Benedek, M.; Kaernbach, C. A continuous measure of phasic electrodermal activity. J. Neurosci. Methods 2010, 190, 80–91. [Google Scholar] [CrossRef] [Green Version]
  35. Boucsein, W. Electodermal Activity; Springer Science & Business Media: New York, NY, USA, 2012. [Google Scholar]
  36. Ayaz, H.; Izzetoglu, M.; Platek, S.; Bunce, S.; Izzetoglu, K.; Pourrezaei, K.; Onaral, B. Registering fNIR data to brain surface image using MRI templates. In Proceedings of the 2006 International Conference of the IEEE Engineering in Medicine and Biology Society, New York, NY, USA, 30 August–3 September 2006; pp. 2671–2674. [Google Scholar] [CrossRef]
  37. Ayaz, H.; Shewokis, P.A.; Bunce, S.; Izzetoglu, K.; Willems, B.; Onaral, B. Optical brain monitoring for operator training and mental workload assessment. Neuroimage 2012, 59, 36–47. [Google Scholar] [CrossRef]
  38. Ayaz, H.; Shewokis, P.A.; Curtin, A.; Izzetoglu, M.; Izzetoglu, K.; Onaral, B. Using MazeSuite and Functional Near Infrared Spectroscopy to Study Learning in Spatial Navigation. J. Vis. Exp. 2011, 2011, e3443. [Google Scholar] [CrossRef] [Green Version]
  39. Addicott, M.A.; Yang, L.L.; Peiffer, A.M.; Burnett, L.R.; Burdette, J.H.; Chen, M.Y.; Hayasaka, S.; Kraft, R.A.; Maldjian, J.A.; Laurienti, P.J. The effect of daily caffeine use on cerebral blood flow: How much caffeine can we tolerate? Hum. Brain Mapp. 2009, 30, 3102–3114. [Google Scholar] [CrossRef] [Green Version]
  40. Brunyé, T.T.; Mahoney, C.R.; Lieberman, H.R.; Giles, G.E.; Taylor, H.A. Acute caffeine consumption enhances the executive control of visual attention in habitual consumers. Brain Cogn. 2010, 74, 186–192. [Google Scholar] [CrossRef] [Green Version]
  41. Frary, C.D.; Johnson, R.K.; Wang, M.Q. Food sources and intakes of caffeine in the diets of persons in the United States. J. Am. Diet. Assoc. 2005, 105, 110–113. [Google Scholar] [CrossRef]
  42. Hindmarch, I.; Quinlan, P.T.; Moore, K.L.; Parkin, C. The effects of black tea and other beverages on aspects of cognition and psyhomotor performance. Psychopharmacology 1998, 139, 230–238. [Google Scholar] [CrossRef]
  43. Brice, C.; Smith, A. Effects of caffeine on mood and performance: A study of realistic consumption. Psychopharmacology 2002, 164, 188–192. [Google Scholar] [CrossRef]
  44. Camfield, D.; Stough, C.K.; Farrimond, J.; Scholey, A. Acute effects of tea constituents L-theanine, caffeine, and epigallocatechin gallate on cognitive function and mood: A systematic review and meta-analysis. Nutr. Rev. 2014, 72, 507–522. [Google Scholar] [CrossRef]
  45. Nehlig, A. Is caffeine a cognitive enhancer? J. Alzheimers Dis. 2010, 20, S85–S94. [Google Scholar] [CrossRef] [Green Version]
  46. Rizwan, A.; Zinchenko, A.; Özdem, C.; Rana, S.; Al-Amin, M. The effect of black tea on human cognitive performance in a cognitive test battery. Clin. Phytosci. 2017, 3, 13. [Google Scholar] [CrossRef]
  47. Borgwardt, S.; Hammann, F.; Scheffler, K.; Kreuter, M.; Drewe, J.; Beglinger, C. Neural effects of green tea extract on dorsolateral prefrontal cortex. Eur. J. Clin. Nutr. 2012, 66, 1187–1192. [Google Scholar] [CrossRef] [PubMed]
  48. Field, D.T.; Williams, C.M.; Butler, L.T. Consumption of cocoa flavanols results in an acute improvement in visual and cognitive functions. Physiol. Behav. 2011, 103, 255–260. [Google Scholar] [CrossRef] [PubMed] [Green Version]
  49. Socci, V.; Tempesta, D.; Desideri, G.; De Gennaro, L.; Ferrara, M. Enhancing Human Cognition with Cocoa Flavonoids. Front. Nutr. 2017, 4, 19. [Google Scholar] [CrossRef] [Green Version]
  50. Sokolov, A.N.; Pavlova, M.A.; Klosterhalfen, S.; Enck, P. Chocolate and the brain: Neurobiological impact of cocoa flavanols on cognition and behavior. Neurosci. Biobehav. Rev. 2013, 37, 2445–2453. [Google Scholar] [CrossRef]
  51. Nehlig, A. The neuroprotective effects of cocoa flavanol and its influence on cognitive performance. Br. J. Clin. Pharmacol. 2013, 75, 716–727. [Google Scholar] [CrossRef]
  52. Kennedy, D.O.; Scholey, A.; Wesnes, K. Modulation of cognition and mood following administration of Ginkgo biloba, ginseng, and a ginkgo/ginseng combination to healthy young adults. Physiol. Behav. 2002, 75, 739–751. [Google Scholar] [CrossRef]
  53. Elsabagh, S.; Hartley, D.E.; Ali, O.; Williamson, E.; File, S.E. Differential cognitive effects of Ginkgo biloba after acute and chronic treatment in healthy young volunteers. Psychopharmacology 2005, 179, 437–446. [Google Scholar] [CrossRef]
  54. Cieza, A.; Maier, P.; Pöppel, E. Effects of Ginkgo biloba on mental functioning in healthy volunteers. Arch. Med. Res. 2003, 34, 373–381. [Google Scholar] [CrossRef]
  55. Persson, J.; Nyberg, L. The memory-enhancing effects of Ginseng and Ginkgo biloba in healthy volunteers. Psychopharmacology 2004, 172, 430–434. [Google Scholar] [CrossRef]
  56. Brunyé, T.T.; Mahoney, C.R.; Lieberman, H.R.; Taylor, H.A. Caffeine modulates attention network function. Brain Cogn. 2010, 72, 181–188. [Google Scholar] [CrossRef]
  57. Kenemans, J.; Wieleman, J.S.; Zeegers, M.; Verbaten, M.N. Caffeine and Stroop Interference. Pharmacol. Biochem. Behav. 1999, 63, 589–598. [Google Scholar] [CrossRef]
  58. Lorist, M.; Snel, J.; Kok, A.; Mulder, G. Acute effects of caffeine on selective attention and visual search processes. Psychophysiology 1996, 33, 354–361. [Google Scholar] [CrossRef]
  59. Lorist, M.M.; Snel, J. Caffeine effects on perceptual and motor processes. Electroencephalogr. Clin. Neurophysiol. 1997, 102, 401–413. [Google Scholar] [CrossRef]
  60. Kenemans, J.L.; Verbaten, M.N. Caffeine and visuo-spatial attention. Psychopharmacology 1998, 135, 353–360. [Google Scholar] [CrossRef]
Figure 1. Diagrammatic Representation of the Protocol.
Applsci 10 02390 g001
Figure 2. Comparison of beverage likeability. Whiskers represent the standard error of the mean (SEM).
Applsci 10 02390 g002
Figure 3. Comparison of perceived confidence in task performance (self-reported rating). Whiskers represent the SEM.
Applsci 10 02390 g003
Figure 4. Math behavioral efficiency. The left graph indicates behavioral efficiency while participants consumed the enhanced drink. The right graph indicates behavioral efficiency while participants consumed the traditional drink. Whiskers represent the SEM.
Applsci 10 02390 g004
Figure 5. RVP behavioral efficiency. The left graph indicates behavioral efficiency while participants consumed the enhanced drink. The right graph indicates behavioral efficiency while participants consumed the traditional drink. Whiskers represent the SEM.
Applsci 10 02390 g005
Figure 6. Stroop behavioral efficiency. The left graph indicates behavioral efficiency while participants consumed the enhanced drink. The right graph indicates behavioral efficiency while participants consumed the traditional drink. Whiskers represent the SEM.
Applsci 10 02390 g006
Figure 7. Average amount consumed in grams. Whiskers represent the SEM.
Applsci 10 02390 g007
Figure 8. Arousal levels during drink consumption. Whiskers represent the SEM.
Applsci 10 02390 g008
Figure 9. Comparison of neural efficiency in the math task. The left graph indicates neural efficiency while participants consumed the enhanced drink. The right graph indicates neural efficiency while participants consumed the traditional drink. Whiskers represent the SEM.
Applsci 10 02390 g009
Figure 10. Comparison of neural efficiency in the RVP task. The left graph indicates neural efficiency while participants consumed the enhanced drink. The right graph indicates neural efficiency while participants consumed the traditional drink. Whiskers represent the SEM.
Applsci 10 02390 g010
Figure 11. Comparison of neural efficiency in the Stroop task. The left graph indicates neural efficiency while participants consumed the enhanced drink. The right graph indicates neural efficiency while participants consumed the traditional drink. Whiskers represent the SEM.
Applsci 10 02390 g011

