Article

Comparison of Equilibrium-Stage and Rate-Based Models of a Packed Column for Tar Absorption Using Vegetable Oil

Institut Energiesysteme und Energietechnik, Technische Universität Darmstadt, Otto-Berndt-Straße 2, 64287 Darmstadt, Germany
*
Author to whom correspondence should be addressed.
Appl. Sci. 2020, 10(7), 2362; https://doi.org/10.3390/app10072362
Submission received: 18 February 2020 / Revised: 18 March 2020 / Accepted: 18 March 2020 / Published: 30 March 2020

Abstract

:
In this study two mathematical models, rate-based and equilibrium-stage models in Aspen Plus process simulator, were used to simulate the tar absorption processes using soybean oil as a solvent in a research lab-scale experiment. The matching between simulation results and experimental data shows a good agreement. The simulation results predicted by the rate-based model show a higher level of agreement than the equilibrium model compared with the experimental data. Analysis study of tar absorption process was carried out which revealed the effect of temperature and flow rate on the soybean oil, and height-packed bed on tar removal efficiency. The methodology of selecting the optimum (most economical) operation conditions has also been performed in this study.

1. Introduction

Gasification technology makes the biomass a vital source of energy. It converts the biomass into raw syngas that is a fuel gas mixture consisting primarily of hydrogen, carbon monoxide, tar, and other gases which are considered contaminants such as hydrogen chloride, carbon dioxide, hydrogen sulfide. The tar in gasifier may create fouling and soot accumulation in downstream processes, moreover, tar solubility in the water may generate wastewater difficulties [1]. In literature, many definitions for tar have been reported. All the definitions seek to present a view about the nature of the tar. Besides, these definitions are influenced by the gas quality specifications required for a particular end-use application and how the tar is assembled and analyzed [2]. One of the definitions of the tar was described by Milne et al. [3] as follows: It is the organics components that are created under thermal or partial-oxidation process (gasification) and are supposed to be mostly aromatic. Devi et al. [4] defined the tar as a complex blend of condensable hydrocarbons, which comprises single to multiple ring aromatic compounds along with other oxygen-containing hydrocarbons and complex polycyclic aromatic hydrocarbons. The Energy Research Centre of the Netherlands (ECN) considers that the tar consists of organic molecules, which have a higher molecular weight than benzene (benzene is not considered to be tar) [5]. According to Unger et al. [6], tar is a mix of the hydrocarbons that can form liquid or highly viscous to solid accumulation by dropping the temperature of the gaseous phase down to ambient temperature; it consists of carbon, hydrogen, and other organic linked elements such as oxygen (O), nitrogen (N), or sulfur (S). The tar can be classified based on different criteria. Li et al. [7] listed tar into five classes: GC-undetectable, heterocyclic aromatics, light aromatic (one ring), light PAH compounds (two to three rings), and heavy PAH compounds (four to seven rings).
Several studies [3,8,9,10] published that the tar can also be classified into primary, secondary, and tertiary tar. Wolfesberger et al. [10] described how the tar components are created and what is the effect of temperature on the nature of the formed tar components. The primary tar components begin to appear during the pyrolysis process, the complex polymers that make the main parts of biomass (cellulose, hemicellulose and lignin) are broken down from cellulose and hemicellulose, tar components like alcohols, ketones, aldehydes, or carbon acids are formed, whereas bi-and trifunctional monoaromatics mostly substituted phenols are derived from lignin [10]. By growing temperature and attendance of an oxidant, a portion of the cellulose-contributed primary tars convert to small gaseous molecules, the remaining primary tar creates secondary tar, examples for secondary tar components are like alkylated mono- and diaromatics including heteroaromatics such as pyridine, furan, dioxin, and thiophene [10]. At a temperature above 800 °C, components such as benzene, naphthalene, phenanthrene, pyrene, and benzopyrene (polynuclear aromatic hydrocarbons (PAH)) are created; these components form the tertiary tars components [10].

1.1. Tar Treatments

The methods of tar removal can be categorized into primary and secondary measures based on the place where tar is removed [11]. With the primary methods, the tar is removed by applying processes such as thermal or catalytic cracking in the gasifier itself, while the secondary methods, the tar is separated outside the gasifier [2]. Although the primary methods have some disadvantages such as the complex construction of the gasifier and the limited flexibility of feedstock, it promises high tar removal efficiency by promoting this technology with time [2]. However, Figure 1 shows that a combination of both methods can only achieve high tar removal efficiency. Currently, secondary methods are fitting for tar separation from the produced syngas because of their low cost and simple measures [12]. Wet scrubbing process is one of the secondary methods, which applied an absorber to exclude the tar. The absorber can be a plate or packed column. It is recommended to use the packed absorber because of its high capacity [13].
Furthermore, the packed absorber can operate with lower overall pressure drops than the tray columns [14]. The packed absorber materials are categorized into random or structured packing. The modern random packings had a different wide range of geometries and shapes and are made from ceramic, metal, or plastics. The structured packings are ideal for lower pressures (i.e., less than 2 bar) and lower liquid rates (i.e., less than 50 m3/m2·h) [14].
A suitable solvent must be appropriately selected for the absorption process since the solvent type has a significant influence on equipment sizing and operating costs [15]. Phuphuakrat et al. [16] summarized that the absorption process should concentrate on separating the components of the tar that cause the fouling problem. These components as per tar classification of Bergman et al. [17] are heterocyclic compounds, light polycyclic aromatic hydrocarbons such as naphthalene, and the heavier hydrocarbons that condensate easily. According to Phuphuakrat et al. [16], light aromatic hydrocarbon tares (one ring aromatic hydrocarbon) are not the reason for blocking and fouling problems, they studied some scrubbing liquids such as diesel fuel, vegetable oil, engine oil, and water as a solvent to remove the tar. The removal efficiencies by using these solvents are shown in Table 1.
From Table 1, it can be observed that diesel fuel is the most effective solvent used to remove naphthalene. However, diesel is considered an uneconomic solvent because of its simple evaporation, which raises the losses of the solvent [16]. The vegetable oil has proven to be efficient to separate naphthalene [12]. The water has comparatively high removal efficiency for phenol because the phenol is a hydrophilic component and it can lose H+ (ion) from a hydroxyl group, whereas the other components are nonpolar substances [12]. Applying water as a solvent to remove the tar achieves removal efficiency of about 31.8%, however water is not as effective solvent since the tar has a low solubility in water and the separation of the tar from the water is difficult and expensive [12]. Phuphuakrat et al. [16] placed the efficiency of the solvent as: vegetable oil > engine oil > water > diesel fuel. Paethanom et al. [18] published the tar removal efficiency of vegetable oil as 89.8% and cooking oil as 81.4%. Bhoi [19] investigated the effect of two kinds of vegetable oils, namely soybean and canola oil to separate the tar. The author summarized that there is no significant difference between the soybean and canola oils for all the conditions of absorbent like temperatures and volumetric flow rates. Ozturk et al. [20] analyzed the relationship between the operating time and removal efficiency of some oily solvents like benzene and toluene. They concluded that the removal efficiency declines with time because of increasing the tar concentration in the absorbent.

1.2. Modelling Approaches for the Packed Column Used for Absorption Processes

Mathematical models contribute to a better understanding of the process and play an essential role in enhancing plant efficiency. A recent literature review tells that there are several studies concerning modelling the absorption process. These studies are based on two standard models: the equilibrium model and the rate-based model. The equilibrium-stage model is developed by Mofarahi et al. [21], whereas the rate-based model depends on the early work published by Pandya [22], who presented a model for rate-based CO2 absorption. Recently the rate-based model and equilibrium model of CO2 capture with Amin solvent in a packed column have been investigated by several authors. Many studies [23,24,25] applied the rate-based model for studying CO2 absorption. Afkhamipour et al. [26] compared the rate-based and equilibrium models for CO2 capturing with AMP solution in a packed column. Bhoi [19] employed equilibrium model to explain the experimental data for absorption tar by vegetable oil. The author tested two vegetable oils as absolvents namely soybean oil and canola oil.
To the best of our knowledge, few studies have been published regarding the modelling of tar absorption with vegetable oil in a packed column. Most of these studies have concentrated on modelling absorption process for CO2 capture, while the modelling of the tar absorption process is rarely presented. The objectives of this study are as follows:
Assembling a property package for tar-soybean oil and build a rate-based model as well as equilibrium model by applied Aspen Plus software for simulation of tar absorption using soybean oil as a solvent. Aspen Plus software is used because of its extensive property databanks and rigorous equation solvers.
Validation of both the mathematical models (rate-based and equilibrium stage) against experimental data is carried out at different operation points. The experimental data reported by Bhoi [19] is used for validation of the models.
The accuracy of the results predicted by the two mathematical models (rate-based and equilibrium stage) is compared with the experimental data.
Analysis of tar absorption process is essential to study the process parameters on tar removal efficiencies such as the solvent temperature, flow rate of solvent, and height packed bed.
This study presents a methodology for selecting the optimum (most economical) operating conditions.
This work is a contribution to the knowledge available for modelling studies for tar absorption using vegetable oil as a solvent in the wet packed column.

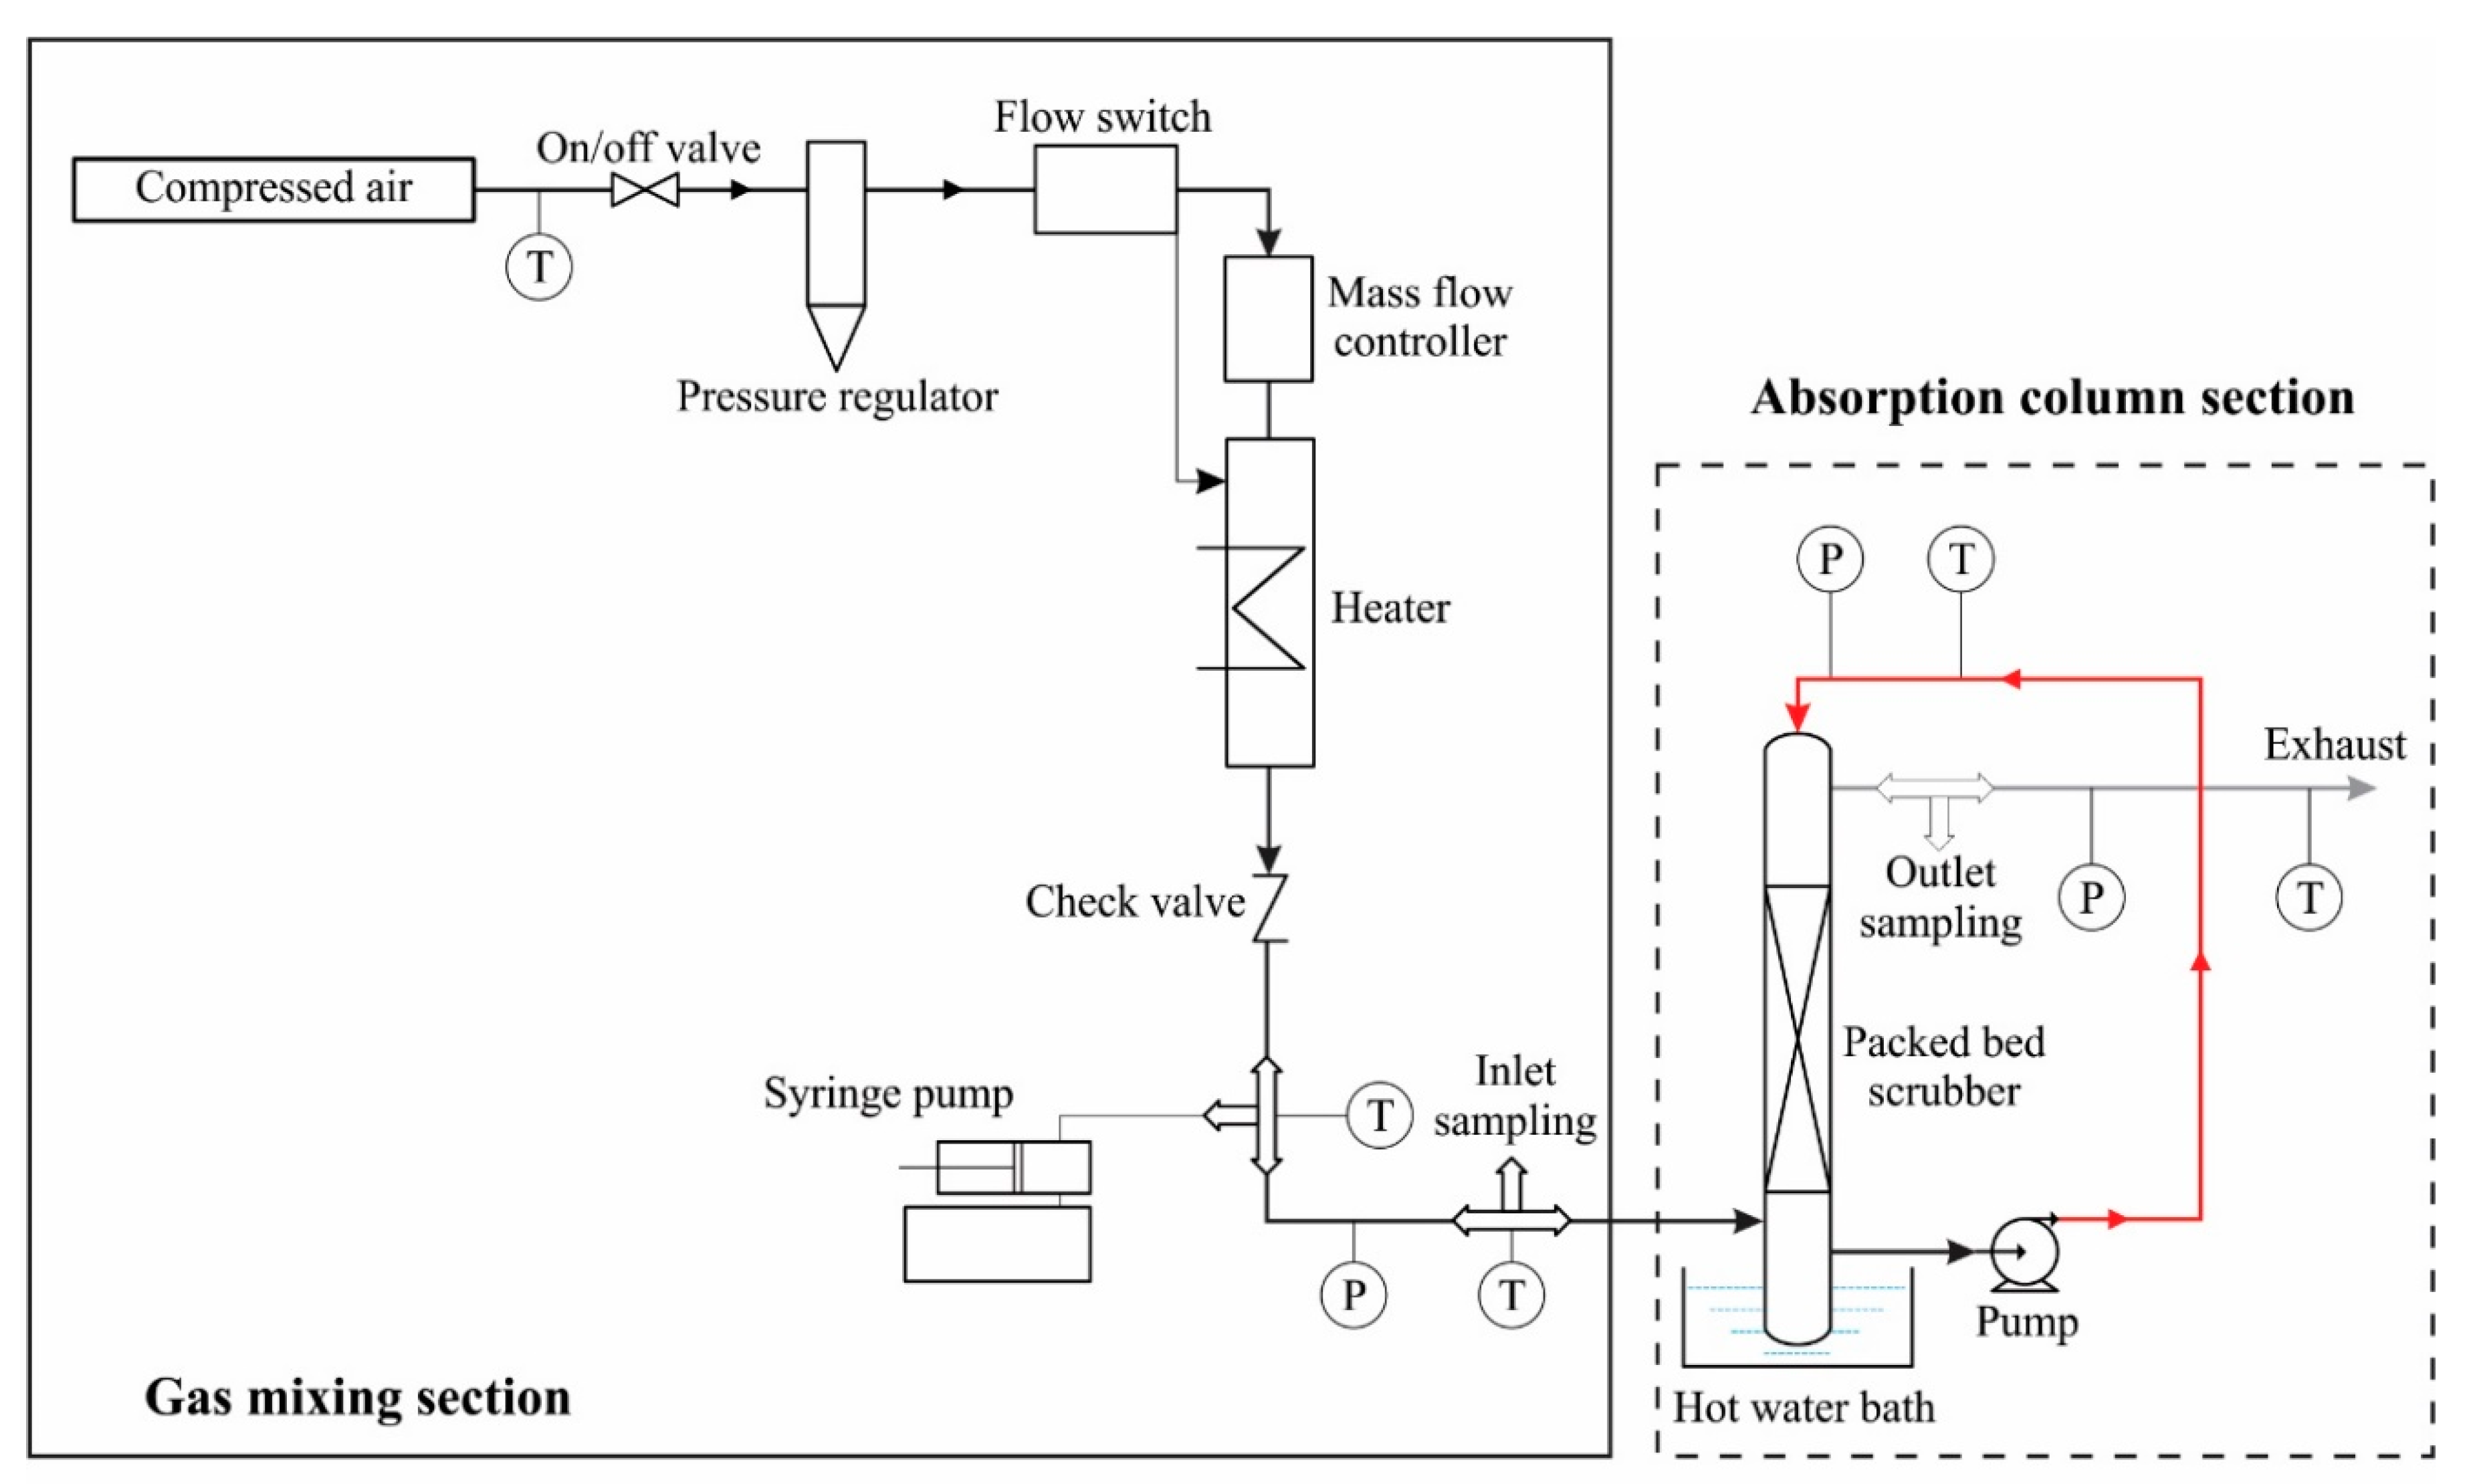
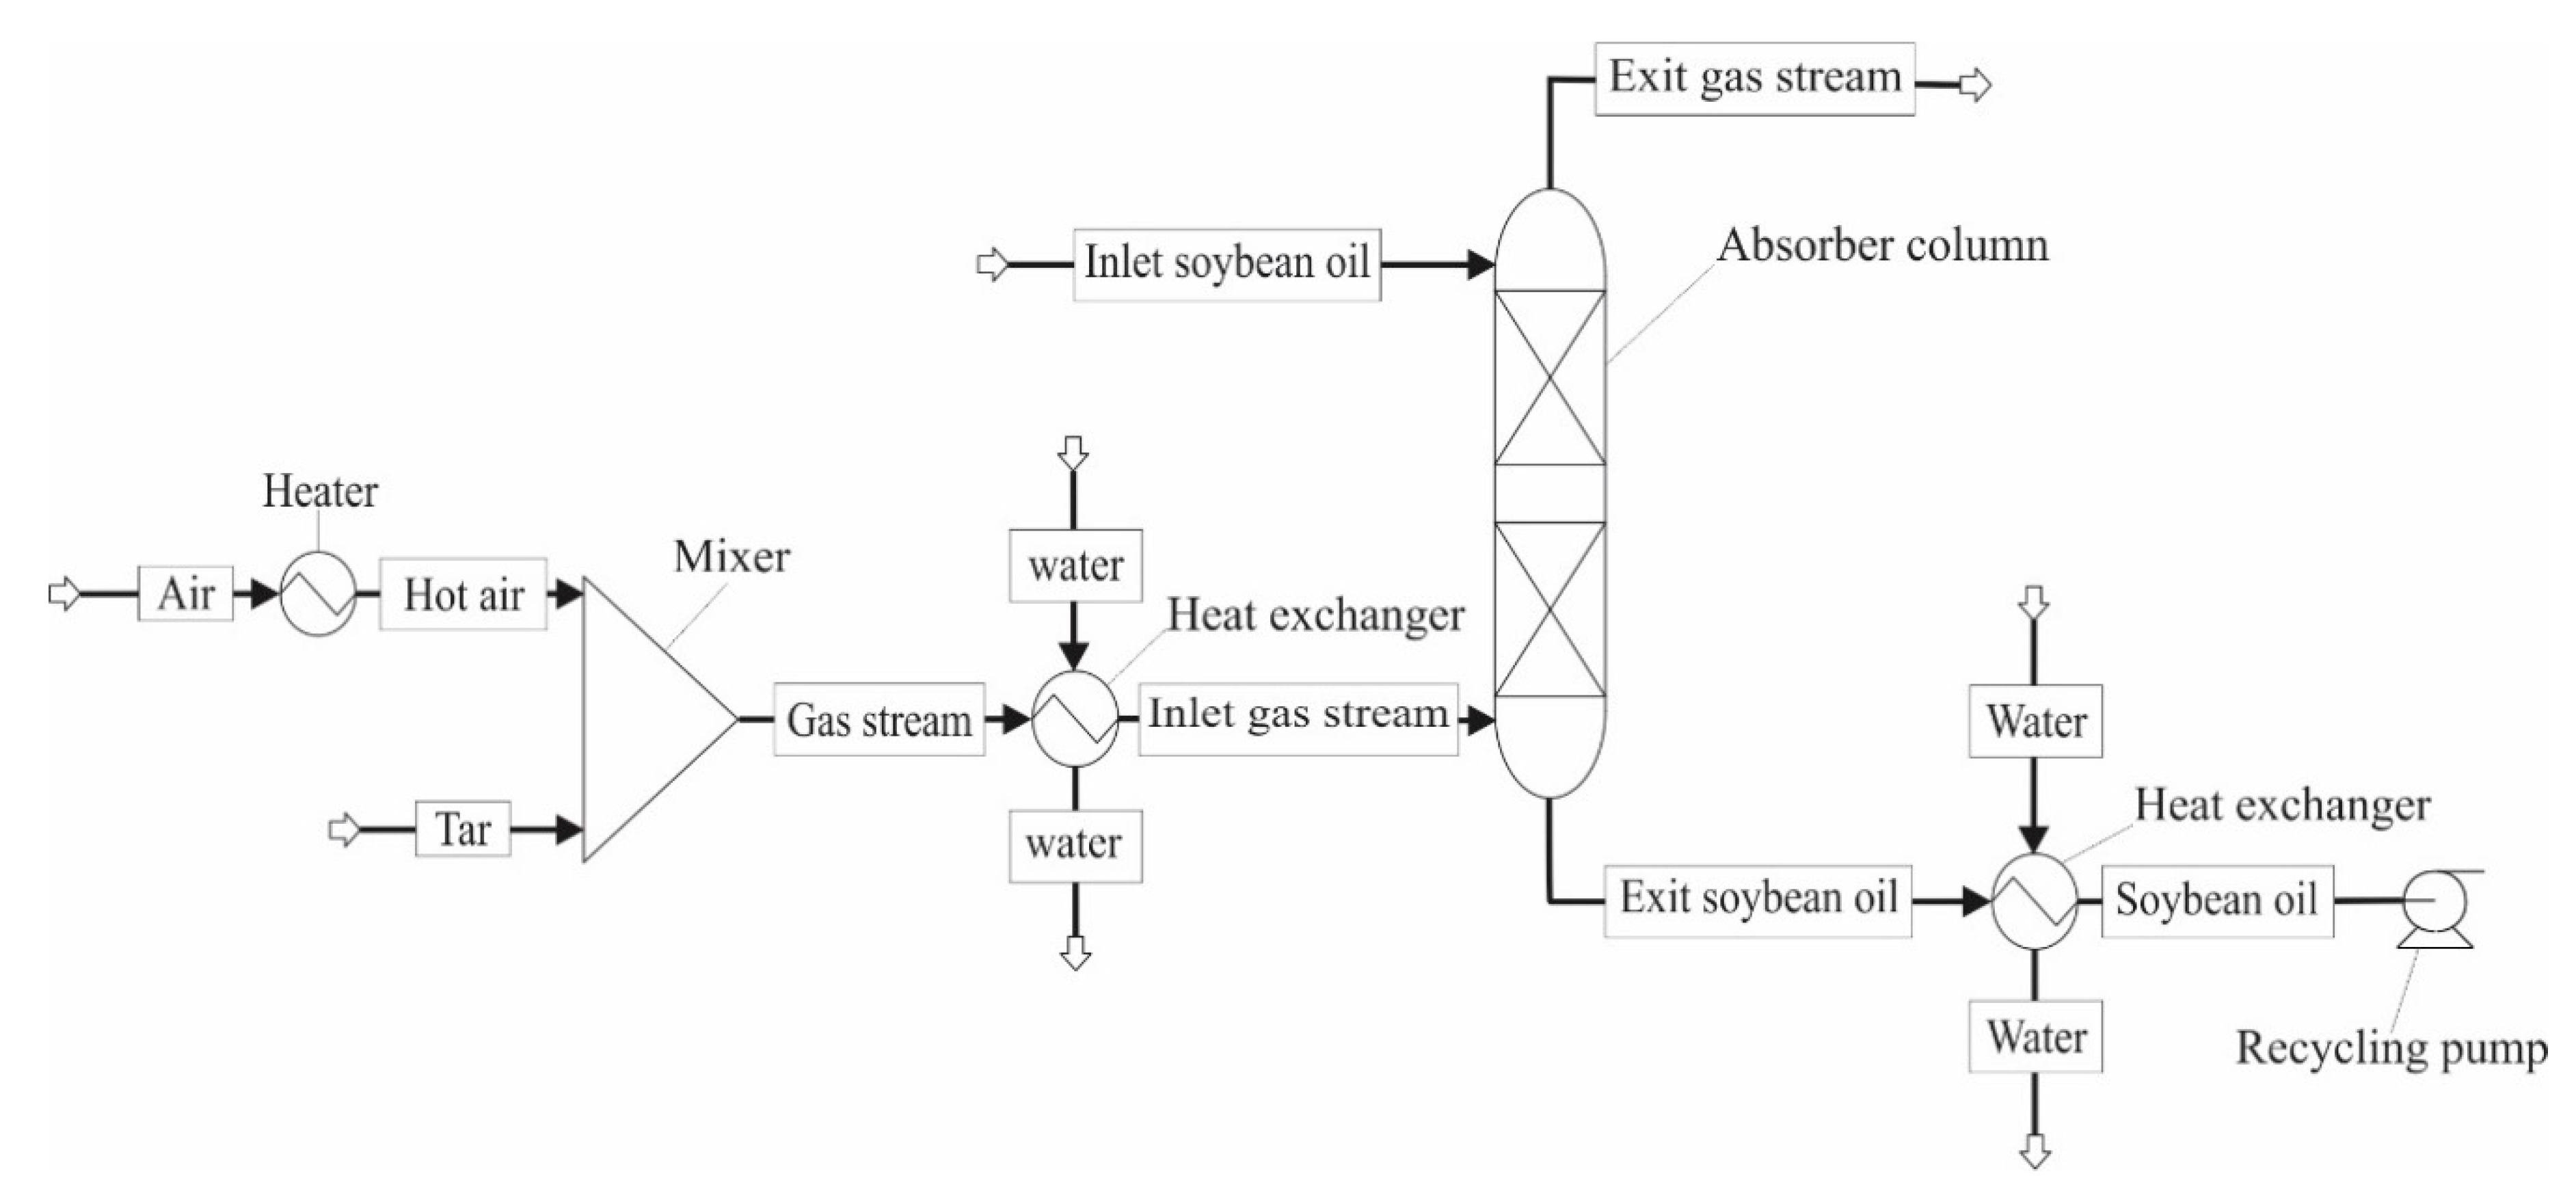
2. Description of the Experiment

The experimental research accomplished by Bhoi [19] was used as a tar removal unit, illustrated in Figure 2. From Figure 2 the pilot plant comprises two major sections, namely the gas mixing section and an absorption column, the gas mixing section consists of a sequence of instruments, which have different functions. The gas mixing section prepares a simulated gas from air and tar with a specific temperature, pressure, and volumetric flow rate [19]. The air as tar holder is heated to 350 °C to make sure that when the tar injected into the heated air, the liquid tar components are evaporated immediately and carried by the air stream [19]. The wet packed bed scrubbing system consists of a stainless steel column, water bath heater to heat the solvent soybean oil or canola to a specific temperature, and a peristaltic pump to recycle the solvent to the absorption column [19]. The designed internal diameter of the column is 50 mm, and the height of the column is 150 cm [19]. The selected packing materials were from kind metal Raschig rings with size 6-mm, a metal material to provide better strength and wettability compared to ceramic and plastic packings [19]. Raschig rings used in the experiment are of size (diameter × length × thickness) 6 × 6 × 0.3 mm respectively, density is 900 kg/m3, the specific surface area is 900 m2/m3, packing factor is 2297 1/m, and the void fraction is 89% [19].

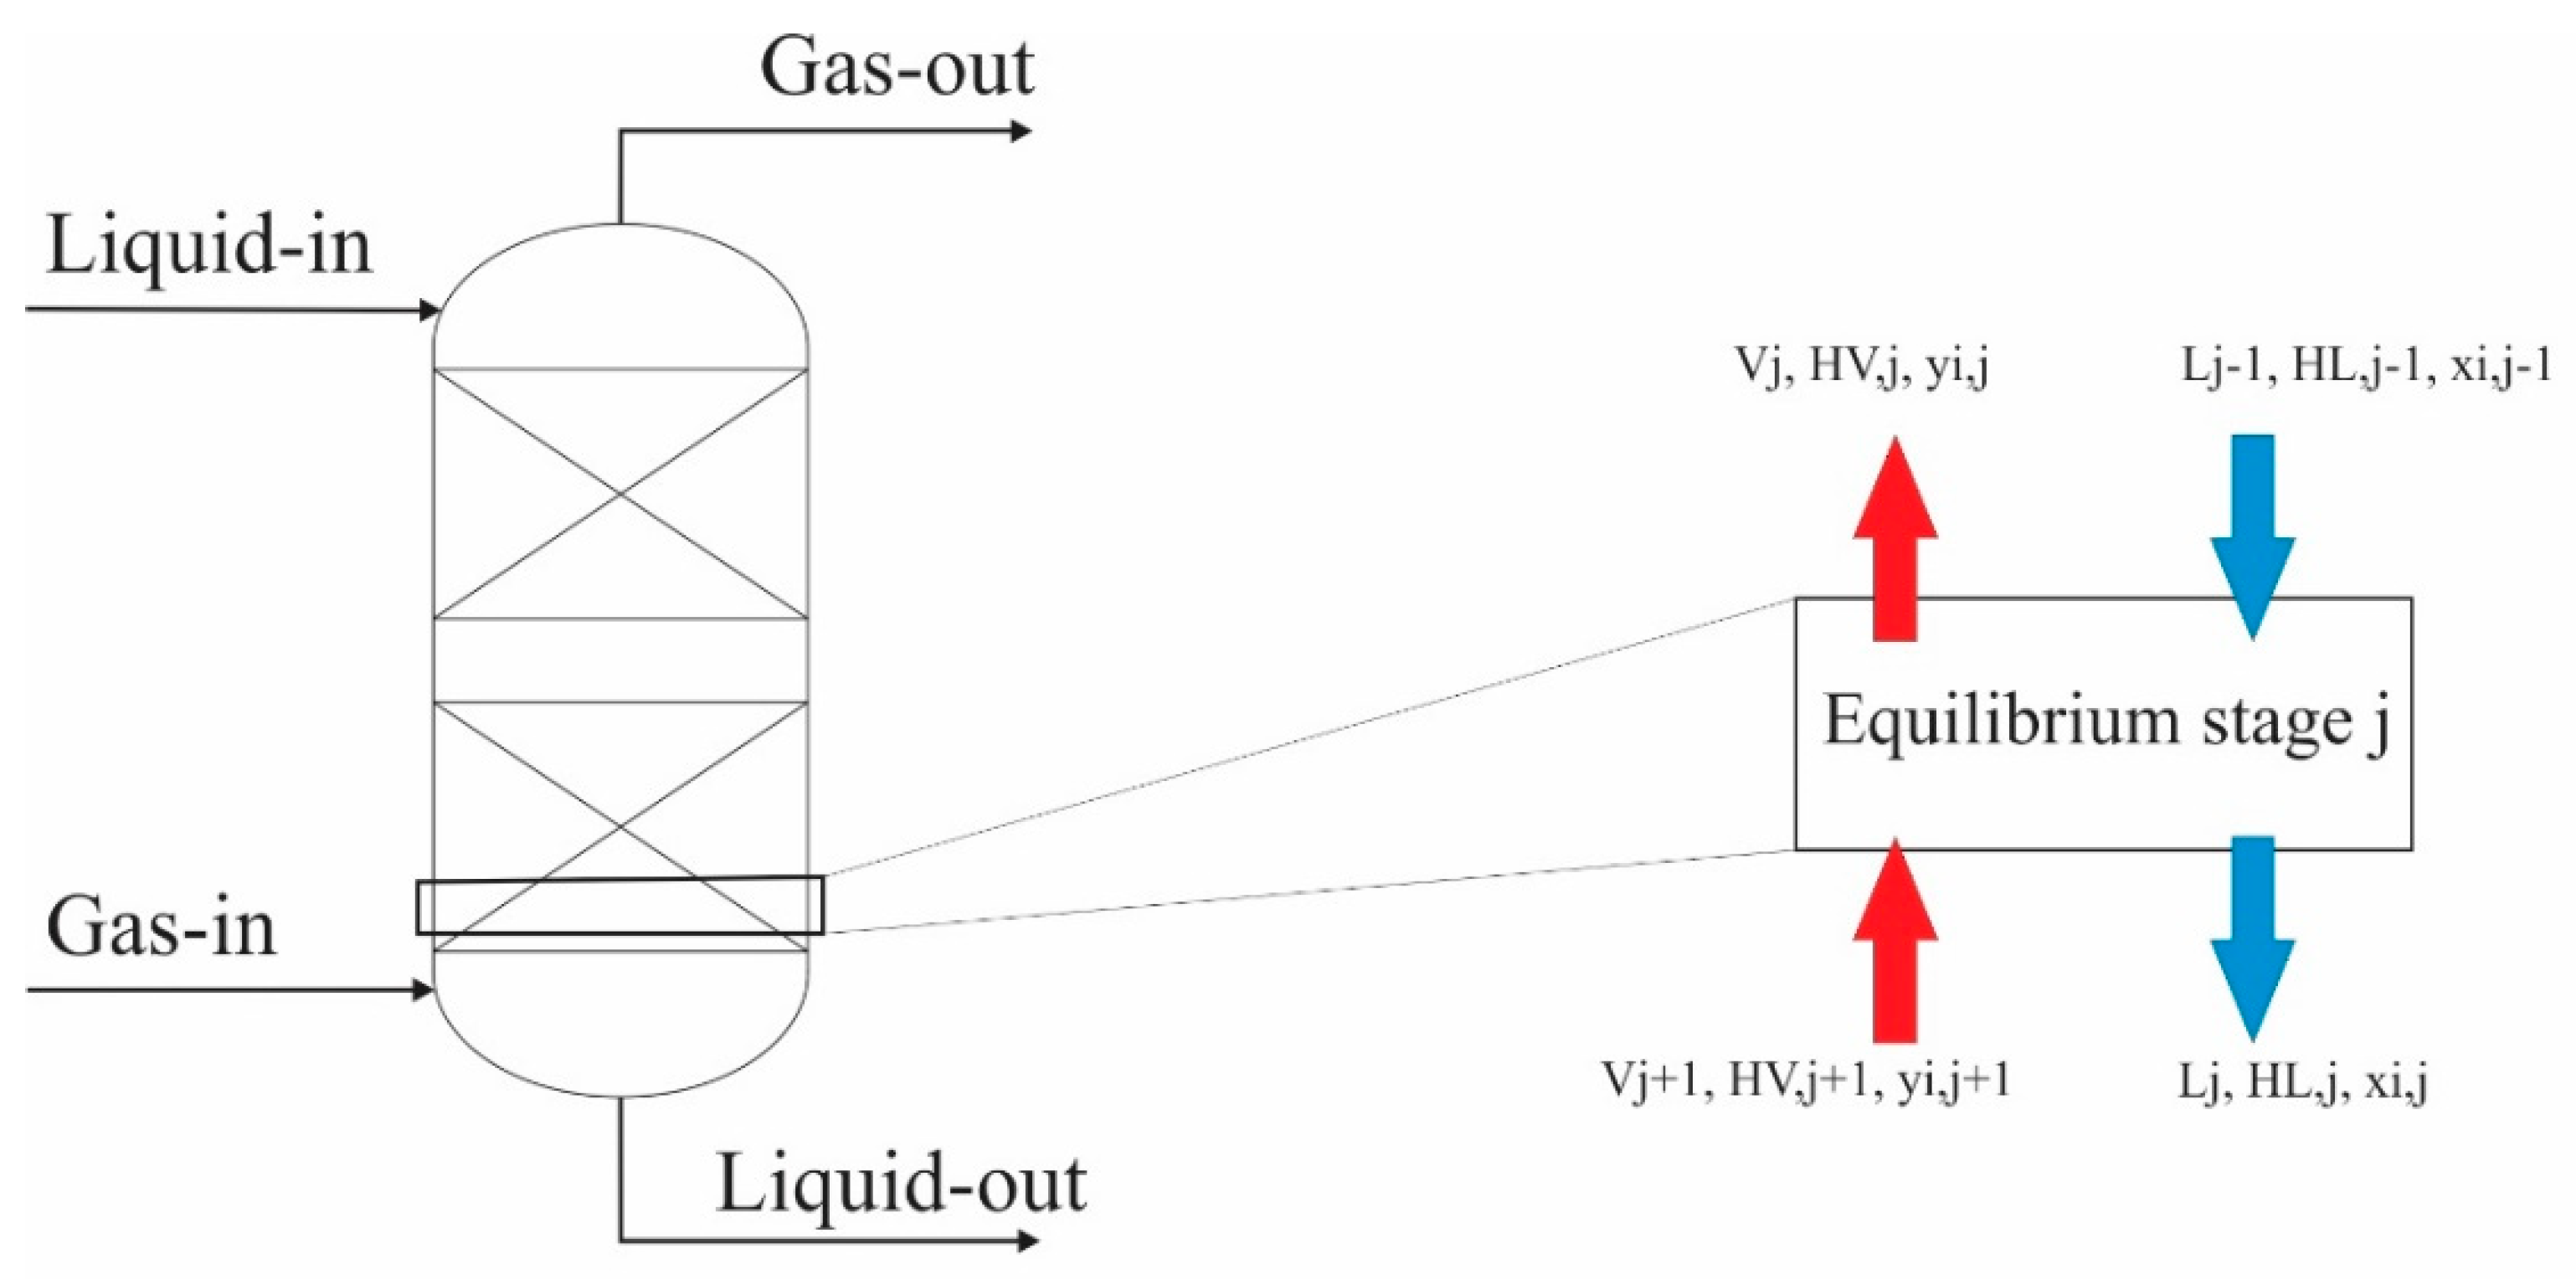
2.1. Mathematical Models of the Packed Column Used for Tar Absorption Processes

Modelling packed column aims to predict the overall performance of the packed column. The gas with a temperature T V , i n , flow rate N ˙ V and mole fraction y i , i n for the component i enters the bottom of the packed column, and it exit with temperature T V , o u t , mass flow rate N ˙ V , and mole fraction y i ,   o u t for the component i. The liquid with temperature T L , i n , flow rate N ˙ L mole fraction x i , i n for the component i enters the top of the packed column, (countercurrent flow), and it exit with temperature T L , o u t , flow rate N ˙ L , and mole fraction x i ,   o u t for the component i. Basically, two common models are used for calculating the absorption process parameters: the equilibrium model and the rate-based model [26].

2.2. Equilibrium Model

The equilibrium model based on the assumption of each plate in the absorption column is considered as a theoretical plate (equilibrium plate) which means that the vapor and the liquid leave any plate at thermodynamic equilibrium [19]. According to Seader et al. [28], the main assumptions of equilibrium model are as follows:
  • Phase equilibrium is presented at each stage;
  • There are no chemical reactions between the components of vapor and liquid;
  • Entrainment of liquid drops in vapor and occlusion of vapor bubbles in the liquid is negligible.
In practice, this equilibrium takes place only at the interfaces between the vapor and liquid phases, so the efficiencies such as point and Murphree efficiencies are used in equilibrium model to account deviations from real equilibrium state [26]. For modelling the whole packed column, the packed bed is divided into stags (equilibrium stage). Figure 3 illustrates the typical entry and exit parameters of equilibrium plate stage. The equilibrium model of absorption process consists of well-known and accepted correlations called MESH equations that include the equations of component material balance, the equations of phase equilibrium, summation equations, and energy balance for each stage as following [21,28,29]:
Overall mass balance for stage j:
L j 1 L j V j + V j + 1 = 0
Component mass balance for stage j:
L j 1 x i , j 1 L j x i , j V j y i , j + V j + 1 y i , j + 1 = 0
Energy balance equations for stage j:
L j 1 H j 1 L   L j H j L V j H j V + V j + 1 H j + 1 V = 0
Phase equilibrium
y i K i x i = 0
Summation equations
y i = 1
x i = 1
where L, V are the molar flow rate of liquid and vapor respectively, K is equilibrium ratio, H is enthalpy, x i ,   y i are the mole fractions of component i in liquid and vapor phases respectively.

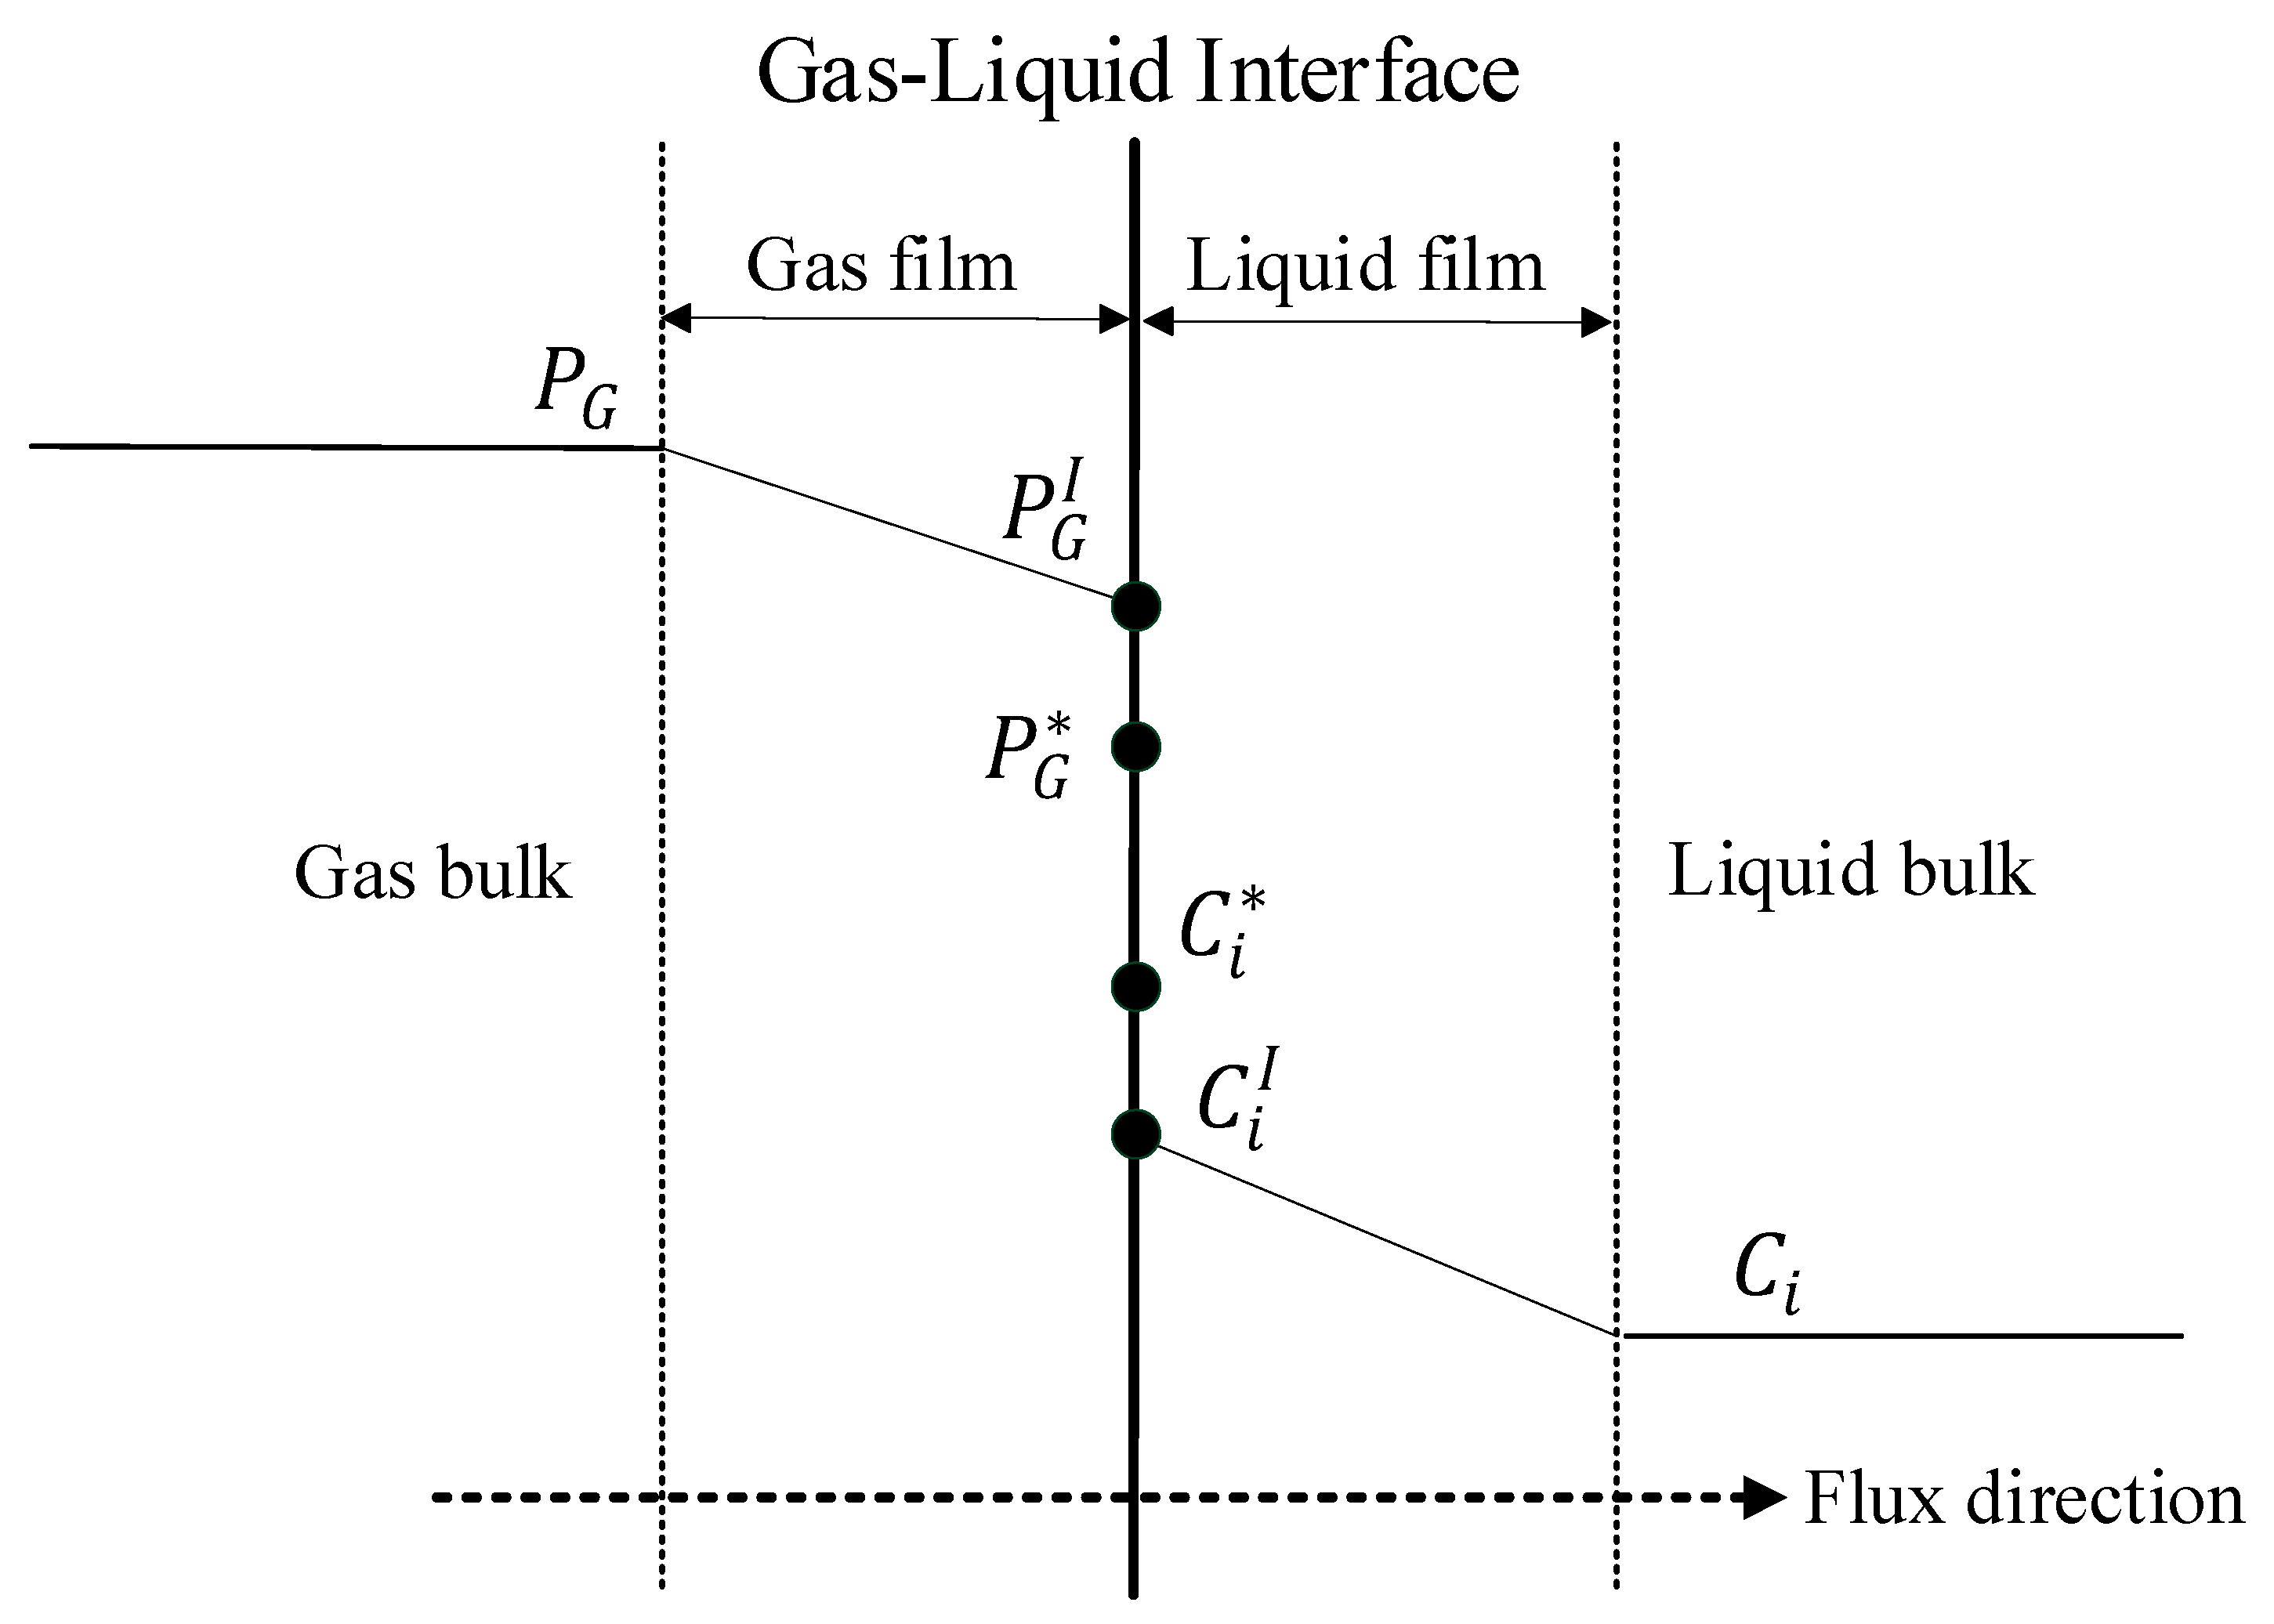
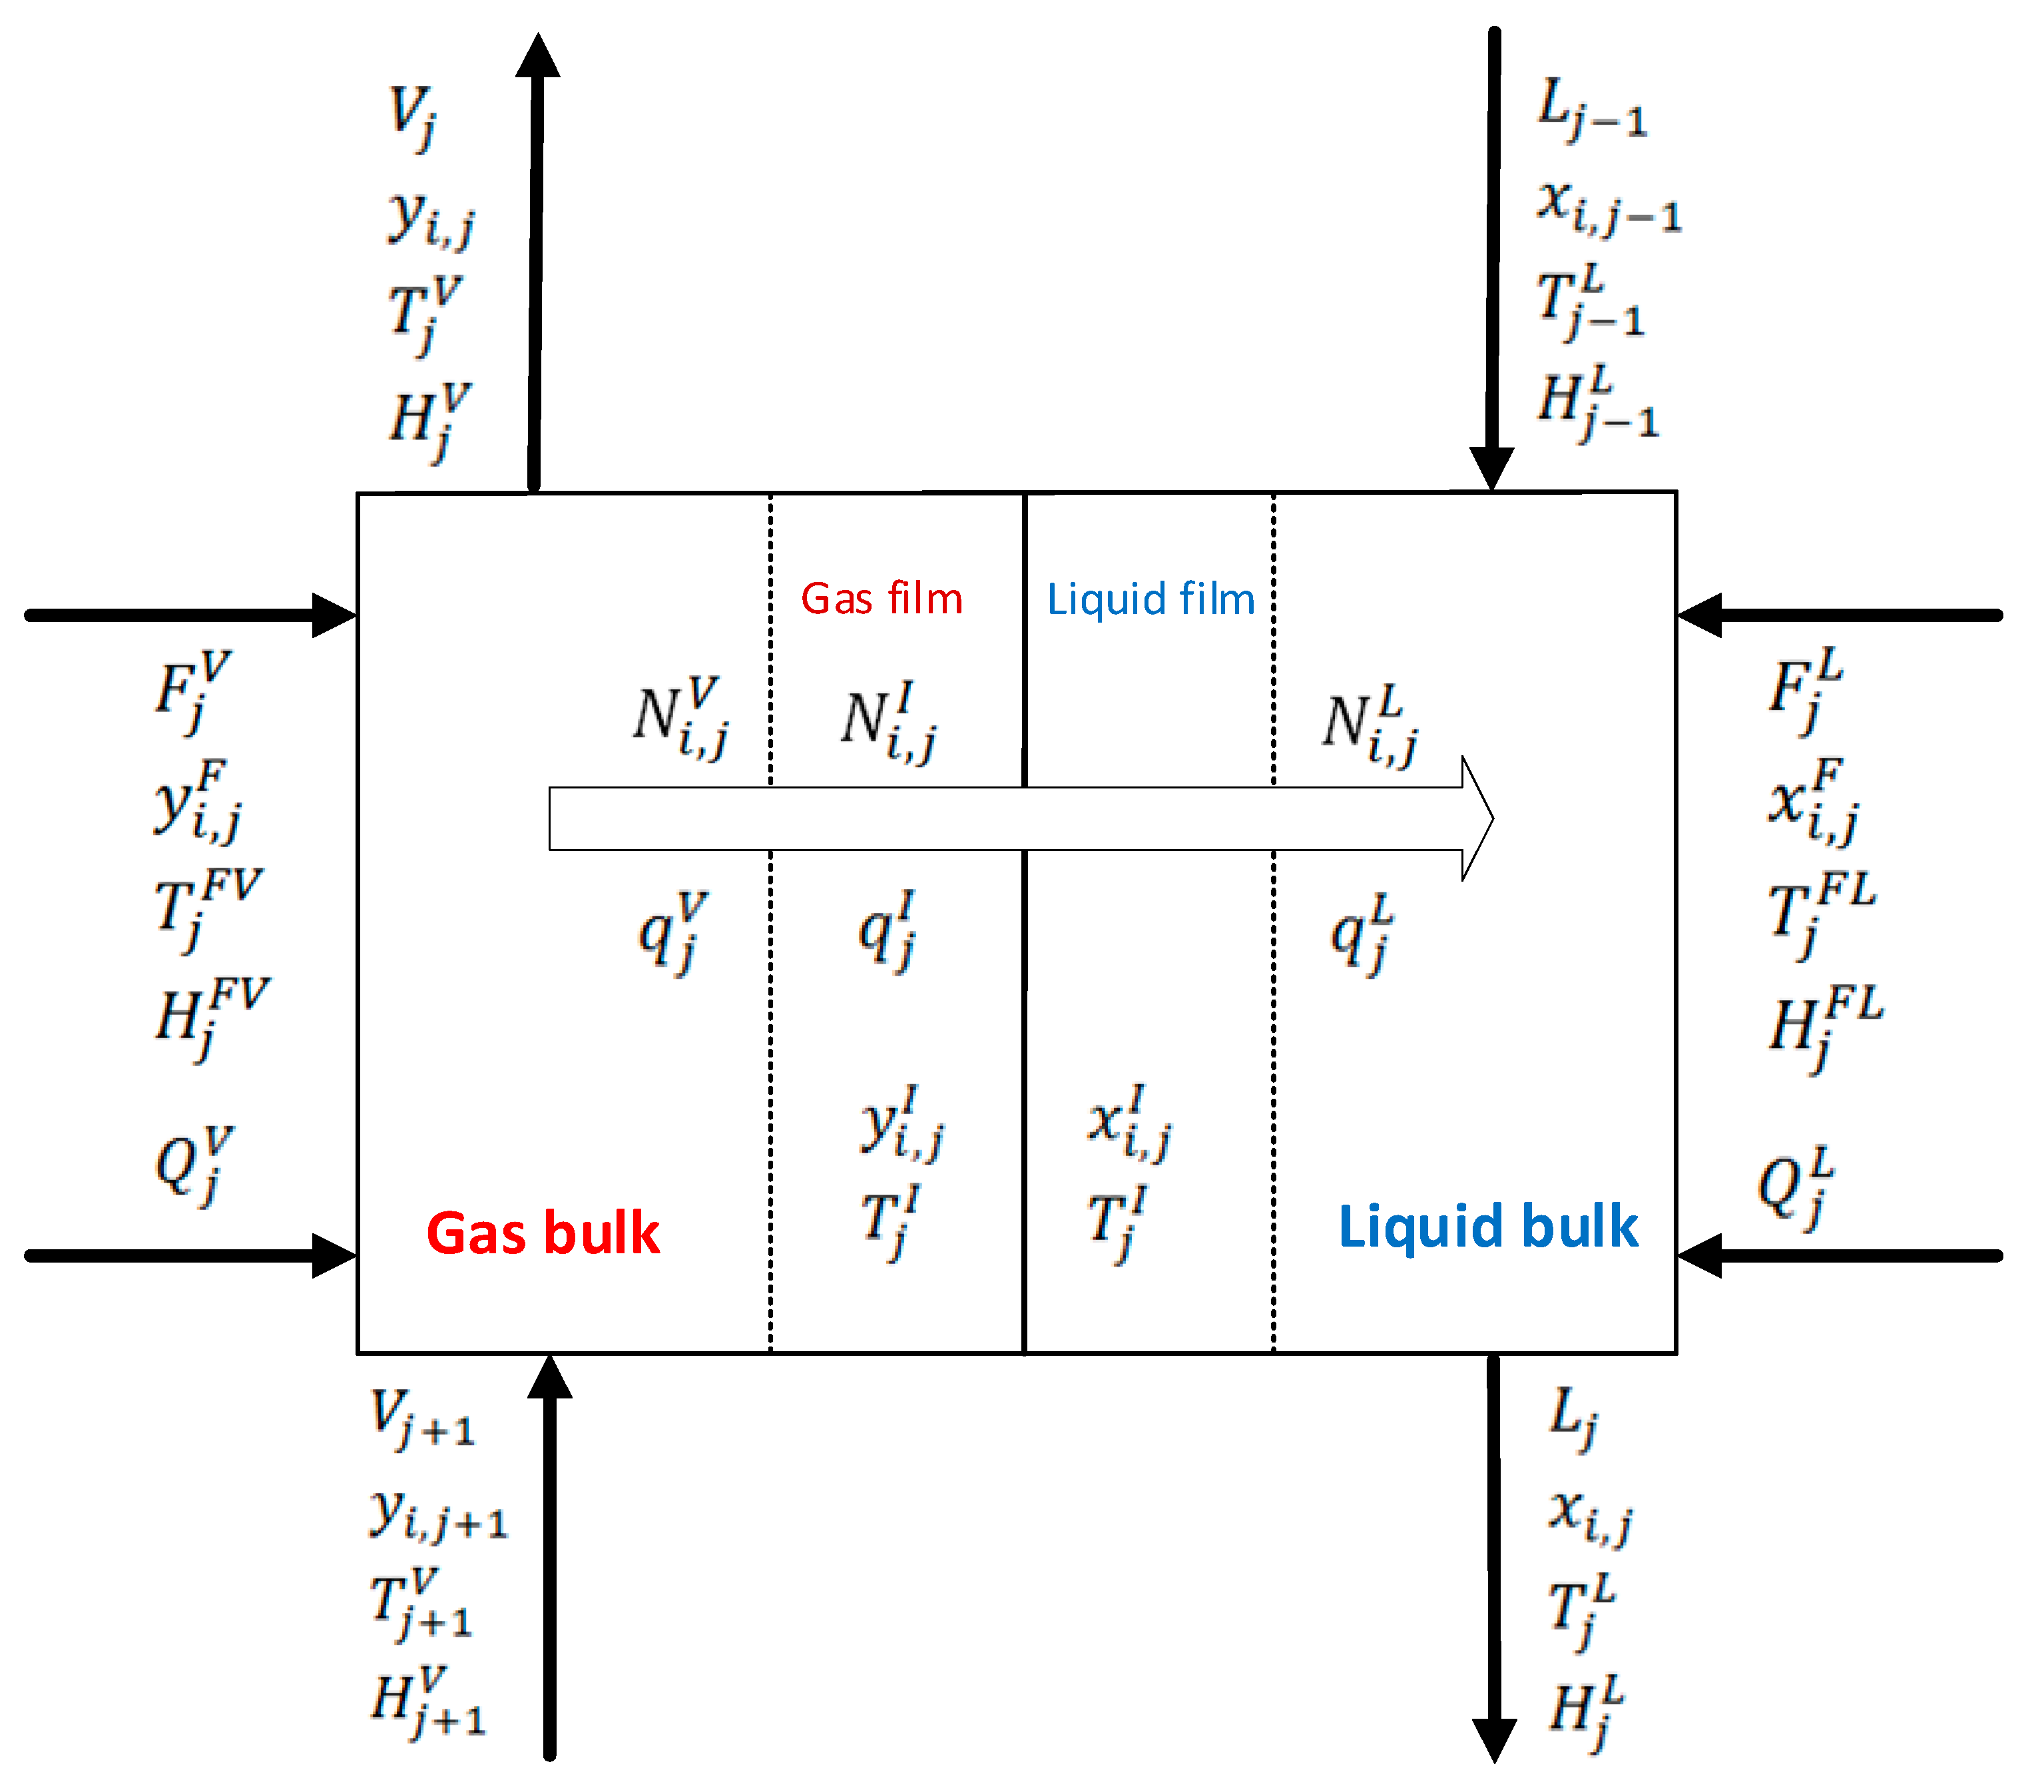
2.3. Rate-Based Model Description

The rate-based model consists of a set of well-accepted equations, which are modelled to calculate the mass and energy transfer across the interface using rate equation and mass transfer coefficients [26]. For the calculation of the mass transfer coefficient and interfacial area, the correlation by Billet and Schultes [30] can be applied.

2.4. Assumptions and Mathematical Model for Rate-Based Model

Assumptions for the rate-based approach according to Afkhamipour et al. [26] are summarized below:
  • The reaction is quick and occurs in the liquid film;
  • The absorption column is supposed to be adiabatic;
  • The interfacial surface area is identical for both heat and mass transfer;
  • The liquid-side heat transfer resistance is small compared to the gas phase, and the interface temperature is, therefore, identical as the bulk temperature;
  • The type of flow is plug flow, and concentration and temperature change in the radial direction is negligible;
  • Both liquid and gas phases are formally discussed as ideal mixtures

2.5. Material and Energy Balances

For easy and accurate calculations, the packed-bed column with a height of Z is divided into some stages. Figure 4 shows a stage j of the column, which represents a differential height of the column (j refers to the stage number, where i refers to the compounds). The material and energy balances around stage j are performed by using the MERSHQ equations (Equations of Material, Energy balances, Rate of mass and heat transfer, Summation of composition, the hydraulic equation of pressure drop, and equilibrium relation) presented by Taylor et al. [31] as the following:
Material balance for bulk liquid:
F j L x i , j F + L j 1 x i , j 1 + N i , j L + r i , j L L j x i j = 0
Material balance for bulk vapor:
F j V y i , j F + V j + 1 y i , j + 1 + N i , j V + r i , j V V j y i , j = 0
Material balance for liquid film:
N i , j I + r i , j f L N i , j L = 0
Material balance for vapor film:
N i , j V + r i , j f V N i , j I = 0
Energy balance for bulk liquid:
F j L H j F L + L j 1 H j 1 L + Q j L + q j L L j H j L = 0
Energy balance for bulk vapor:
F j V H j F V + V j + 1 H j + 1 V + Q j V q j V V j H j V = 0
Energy balance for the liquid film
q j I q j L = 0
Energy balance for vapor film:
q j V q j I = 0
Phase equilibrium at the interface:
y i , j I K i , j x i , J I = 0
Summations:
i = 1 n x i , j 1 = 0
i = 1 n y i , j 1 = 0
i = 1 n x i , j I 1 = 0
i = 1 n y i , j I 1 = 0
where F is the molar flow rate of feed. L, V are the molar flow rates of liquid and vapor respectively, N molar transfer rate, K is equilibrium ratio, r is reaction rate, H is enthalpy, Q is heat input to a stage, q is heat transfer rate, x i   ,   y i are the mole fraction of component i in liquid and vapor phases respectively.

2.6. Mass Transfer through the Interfacial Area

The rate-based model is based on the two-film theory that describes the mass transfer between gas and liquid [26]. The film theory is based on the assumption that when two fluid phases are coming in contact with each other, a thin layer of stagnant fluid exists on each side of the interface [32]. From Figure 5, the partial pressure of component i drops from P i at gas bulk to P i I at the interface [32,33]. This pressure difference creates a driving force ( P i P i I ) for component i to transfer it from the gas bulk to gas film and then from the gas film to liquid film [33]. The accumulation of the component i at the liquid film creates a concentration difference between the liquid film and the liquid bulk. Similarly, this concentration difference creates a driving force ( C i I C i ) for component i to transfer from the liquid film to the liquid bulk [32,33]. The molar flux N of component A from the bulk of one phase to the interface is written as below [33]:
N = k Δ c
where N is the molar flux of the component (moles per unit area per unit time) and Δ c is the driving force for mass transfer between the bulk and the interface. Consequently, Equation (11) can be written for phase and liquid phase [33] as:
N A , G = K G ( P i P i I )
N A , L = K L ( C i I C i )
At steady state, the flux of i from bulk gas to the interface must be equal to the flux of i from the interface to the bulk liquid [33]:
N = N L , i = N G , i
N = K G ( P i P i I ) = K L ( C i I C i )
K G and K L are two different overall mass transfer coefficients (with different units). If equilibrium conditions exist at the interface, the overall mass transfer coefficient can be calculated as follows [35]:
1 K G = 1 k G + H E k L
where H is Henry’s law constant, E is the enhancement factor. k G and k L are the mass transfer coefficients without reaction in the gas and liquid phase. The mass transfer coefficients and the wetted interfacial area for mass and heat transfer were calculated according to the correlations proposed by several studies [30,35,36] as following:
k L , i a e f f = C L ( g v L ) 1 / 6 ( D L , i d h ) 1 / 2 a 2 / 3 U L 1 / 3 ( a e f f a )
k G , i a e f f = C G ( ε h L ) 1 / 2 ( a 3 d h ) 1 / 2 D G , i ( U G a ν G ) 3 / 4 ( v G D G , i ) 1 / 3 ( a e f f a )
a e f f a = 1.5   ( a d h ) 0.5   ( U L d h v L ) 0.2 ( U L 2 ρ L d h σ ) 0.75 ( U L 2 g d h ) 0.45
d h = 4 ε a
where k L . i and k G , i and are the mass transfer coefficients of component i in the liquid and gas phase respectively, a e f f is the effective interfacial area per unit packed volume, a is the total surface area per unit packed volume, C G and C L are the gas and liquid and transfer coefficient parameter respectively; characteristic of the shape and structure of the packing, g is gravitational constant, v L and ν G are kinematic viscosity of the liquid and gas phase respectively, D L , i and D G , i are diffusivity of component i in the liquid and gas phase respectively, d h is hydraulic diameter of the dumped packing, ρ L is density of liquid, U L and U G are velocity of liquid and gas phase respectively with reference to free column cross section, ε is void fraction of the packing, h L a is column liquid holdup, σ is liquid surface tension.
Theoretical liquid holdup correlation of Billet and Schultes [30] is given below:
h L = ( 12 g v L U L a 2 ) 1 / 3

2.7. Heat Transfer through the Interfacial Area

In order to determine the heat transfer through the interfacial area, the Chilton-Colburn-Analogy is used [35]. The expressions for the analogy are taken from many studies [35,37]. These expressions lead to a heat transfer coefficient h as [35]:
h = k G ( ρ G ( c p / M w , L ) λ 2 D 2 ) 1 / 3
where k G is mass transfer coefficient, ρ G is the density of the gas, c p is specific molar heat capacity, M w , L is molecular weight of the liquid phase, λ is Thermal conductivity, D is the diffusion coefficient.

2.8. Thermodynamics Approaches for Prediction of Phase Behavior

The accuracy of equilibrium and rate-based models depend on the accurate prediction of the phase behavior properties of chemical species and their mixtures [19]. There are two conventional approaches for the prediction of phase behavior: approach ( φ , φ ) and approach ( φ / γ ) [38]. By approach ( φ , φ ) , the fugacity coefficient φ . is applied for predicting the non-ideal behavior of both vapor and liquid phases [19]. The fugacity coefficient is calculated at the equilibrium condition according to Gebreyohannes et al. [38] as below:
f i V = f i L
f i V = φ i V y i P
f i L = φ i L x i P
l n φ i a = 1 R T V a [ ( p n i ) T , V , n i , j R T V ] d V l n Z m a
where f i L and f i V are Fugacity of component i in the liquid and gas phase respectively, φ i L and φ i V are Fugacity coefficient of the component i in liquid and gas phase respectively, P is pressure, x i and y i mole fraction of the f component i in liquid and gas phase respectively, φ i a is Fugacity coefficient of the component i where a refer to liquid or gas phase, V is total volume, R is Gas constant it has the value 0.08314 [ L   bar   K 1 ] , T is temperature, n i is mole number of component i, Z m a Compression factor.
The approach ( φ / γ ) uses the fugacity coefficients ( φ ) and the activity coefficients ( γ ) to account the non-ideal behavior of vapor and liquid phase. The equations related to ( φ / γ ) approach are listed as below [38]:
f i V = f i L
f i V = φ i V y i P
f i L = x i γ i f i * , I
where f i * ,   I   is liquid fugacity of pure component i at mixture temperature, γ i is the liquid activity coefficient of component i. While φ i V is calculated according to Equation (26), the activity coefficients can be calculated from non-random two liquid model (NRTL) as below [39]:
l n γ i = j = 1 n x j τ j i G j i   k = 1 n x k G k i + j = 1 n x j G i j k = 1 n x k G k j ( τ i j m = 1 n x m τ m j G m j k = 1 n x k G k j )
G i j = e x p ( a i j τ i j )
τ i j = a i j + b i j T + e i j l n T + f i j T
a i j = c i j + d i j ( T 273.315 K )
Here, a i j is NRTL non-randomness constant for binary interaction, a i j ,   b i j ,   c i j ,   d i j ,   e i j ,   and   f i j are binary parameters. The ASPEN PLUS physical property system has extensive property databanks for binary parameters for the model.

2.9. Model Specification

For simulating the packed bed absorber, the RateFrac model is adopted. The model flowsheet generated in ASPEN PLUS is shown in Figure 6. In the RateFrac model, the NRTL method is used. The flow model is countercurrent. The packed column height is divided into ten stages. The mass transfer coefficients and the wetted interfacial area for mass and heat transfer were calculated according to the empirical correlation of Billet and Schultes [30] with the constants CL = 2.4 and CV = 0.8 [36]. The heat transfer coefficient is estimated by Chilton–Colburn method [40]. Other relevant parameters are obtained by the default correlations of RateFrac [41] (see Table 2, Table 3 and Table 4). The soybean oil used as a solvent is a blend of acids (see Table 5). The tar was considered as a mixer of benzene, toluene, and ethylbenzene. The air participates in the process as tar holder—the water is used as the cooling liquid to adjust the temperature of the gas inlet to fit in the experimental data.

3. Results and Discussion

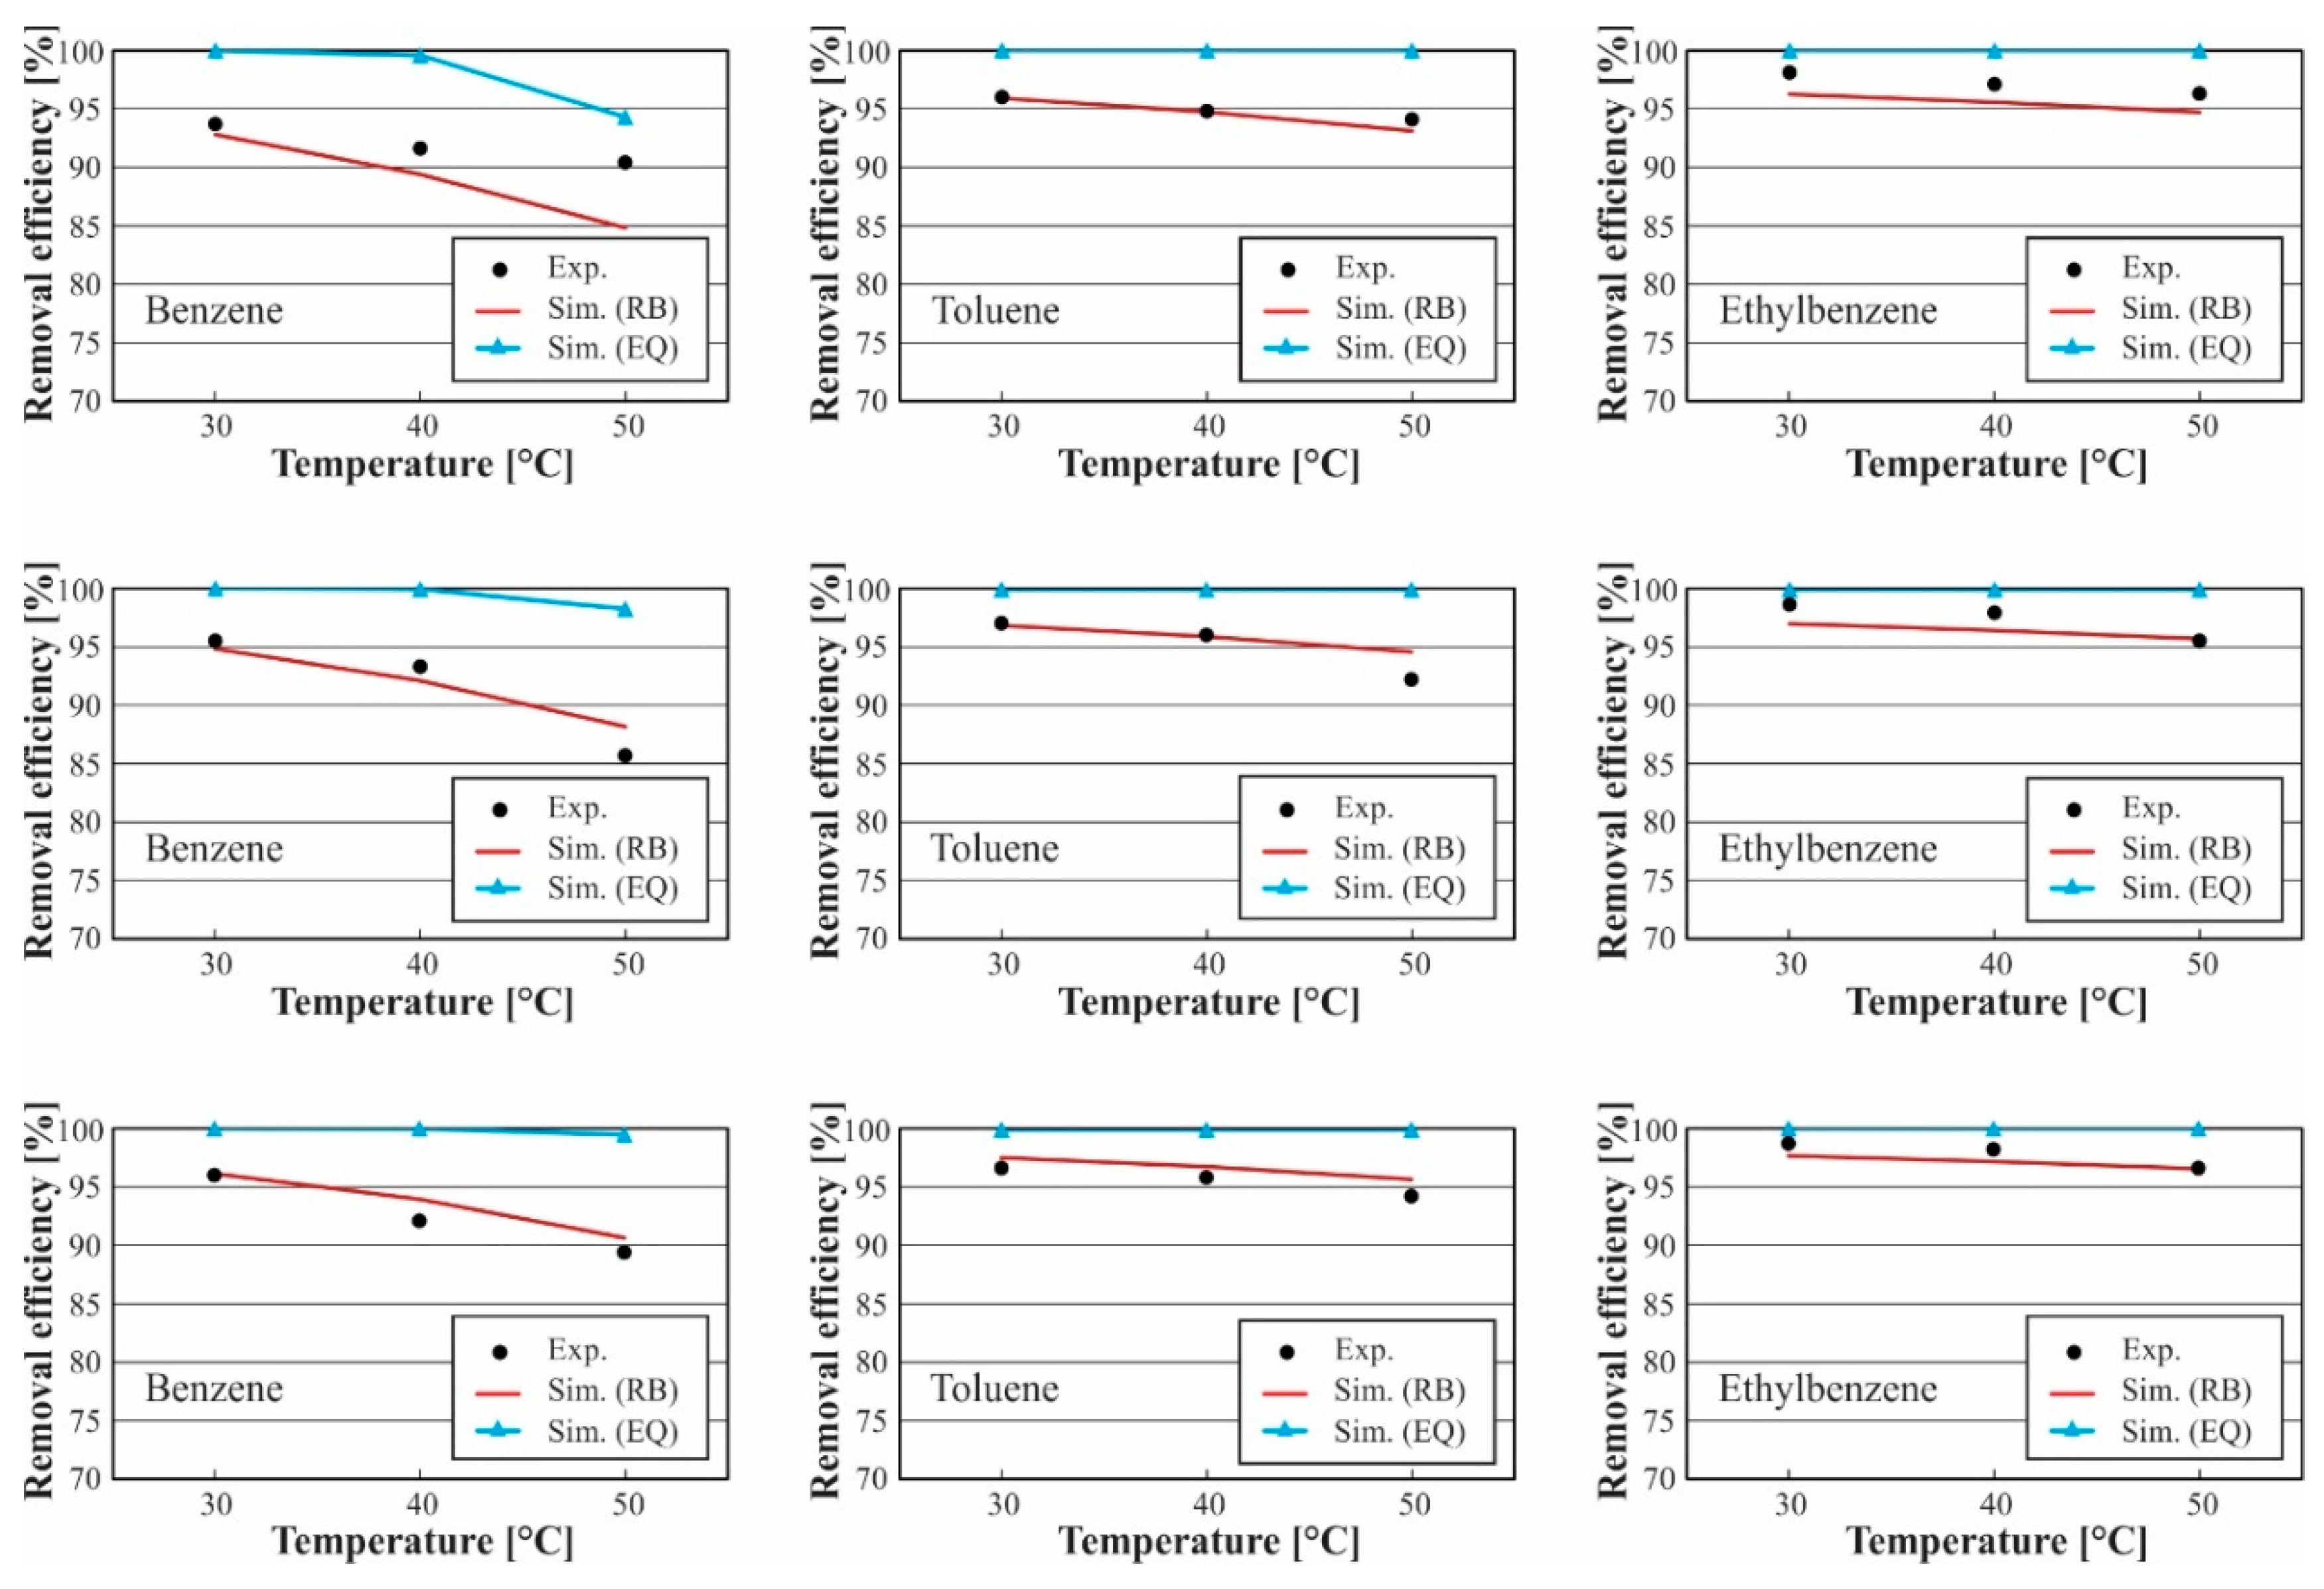
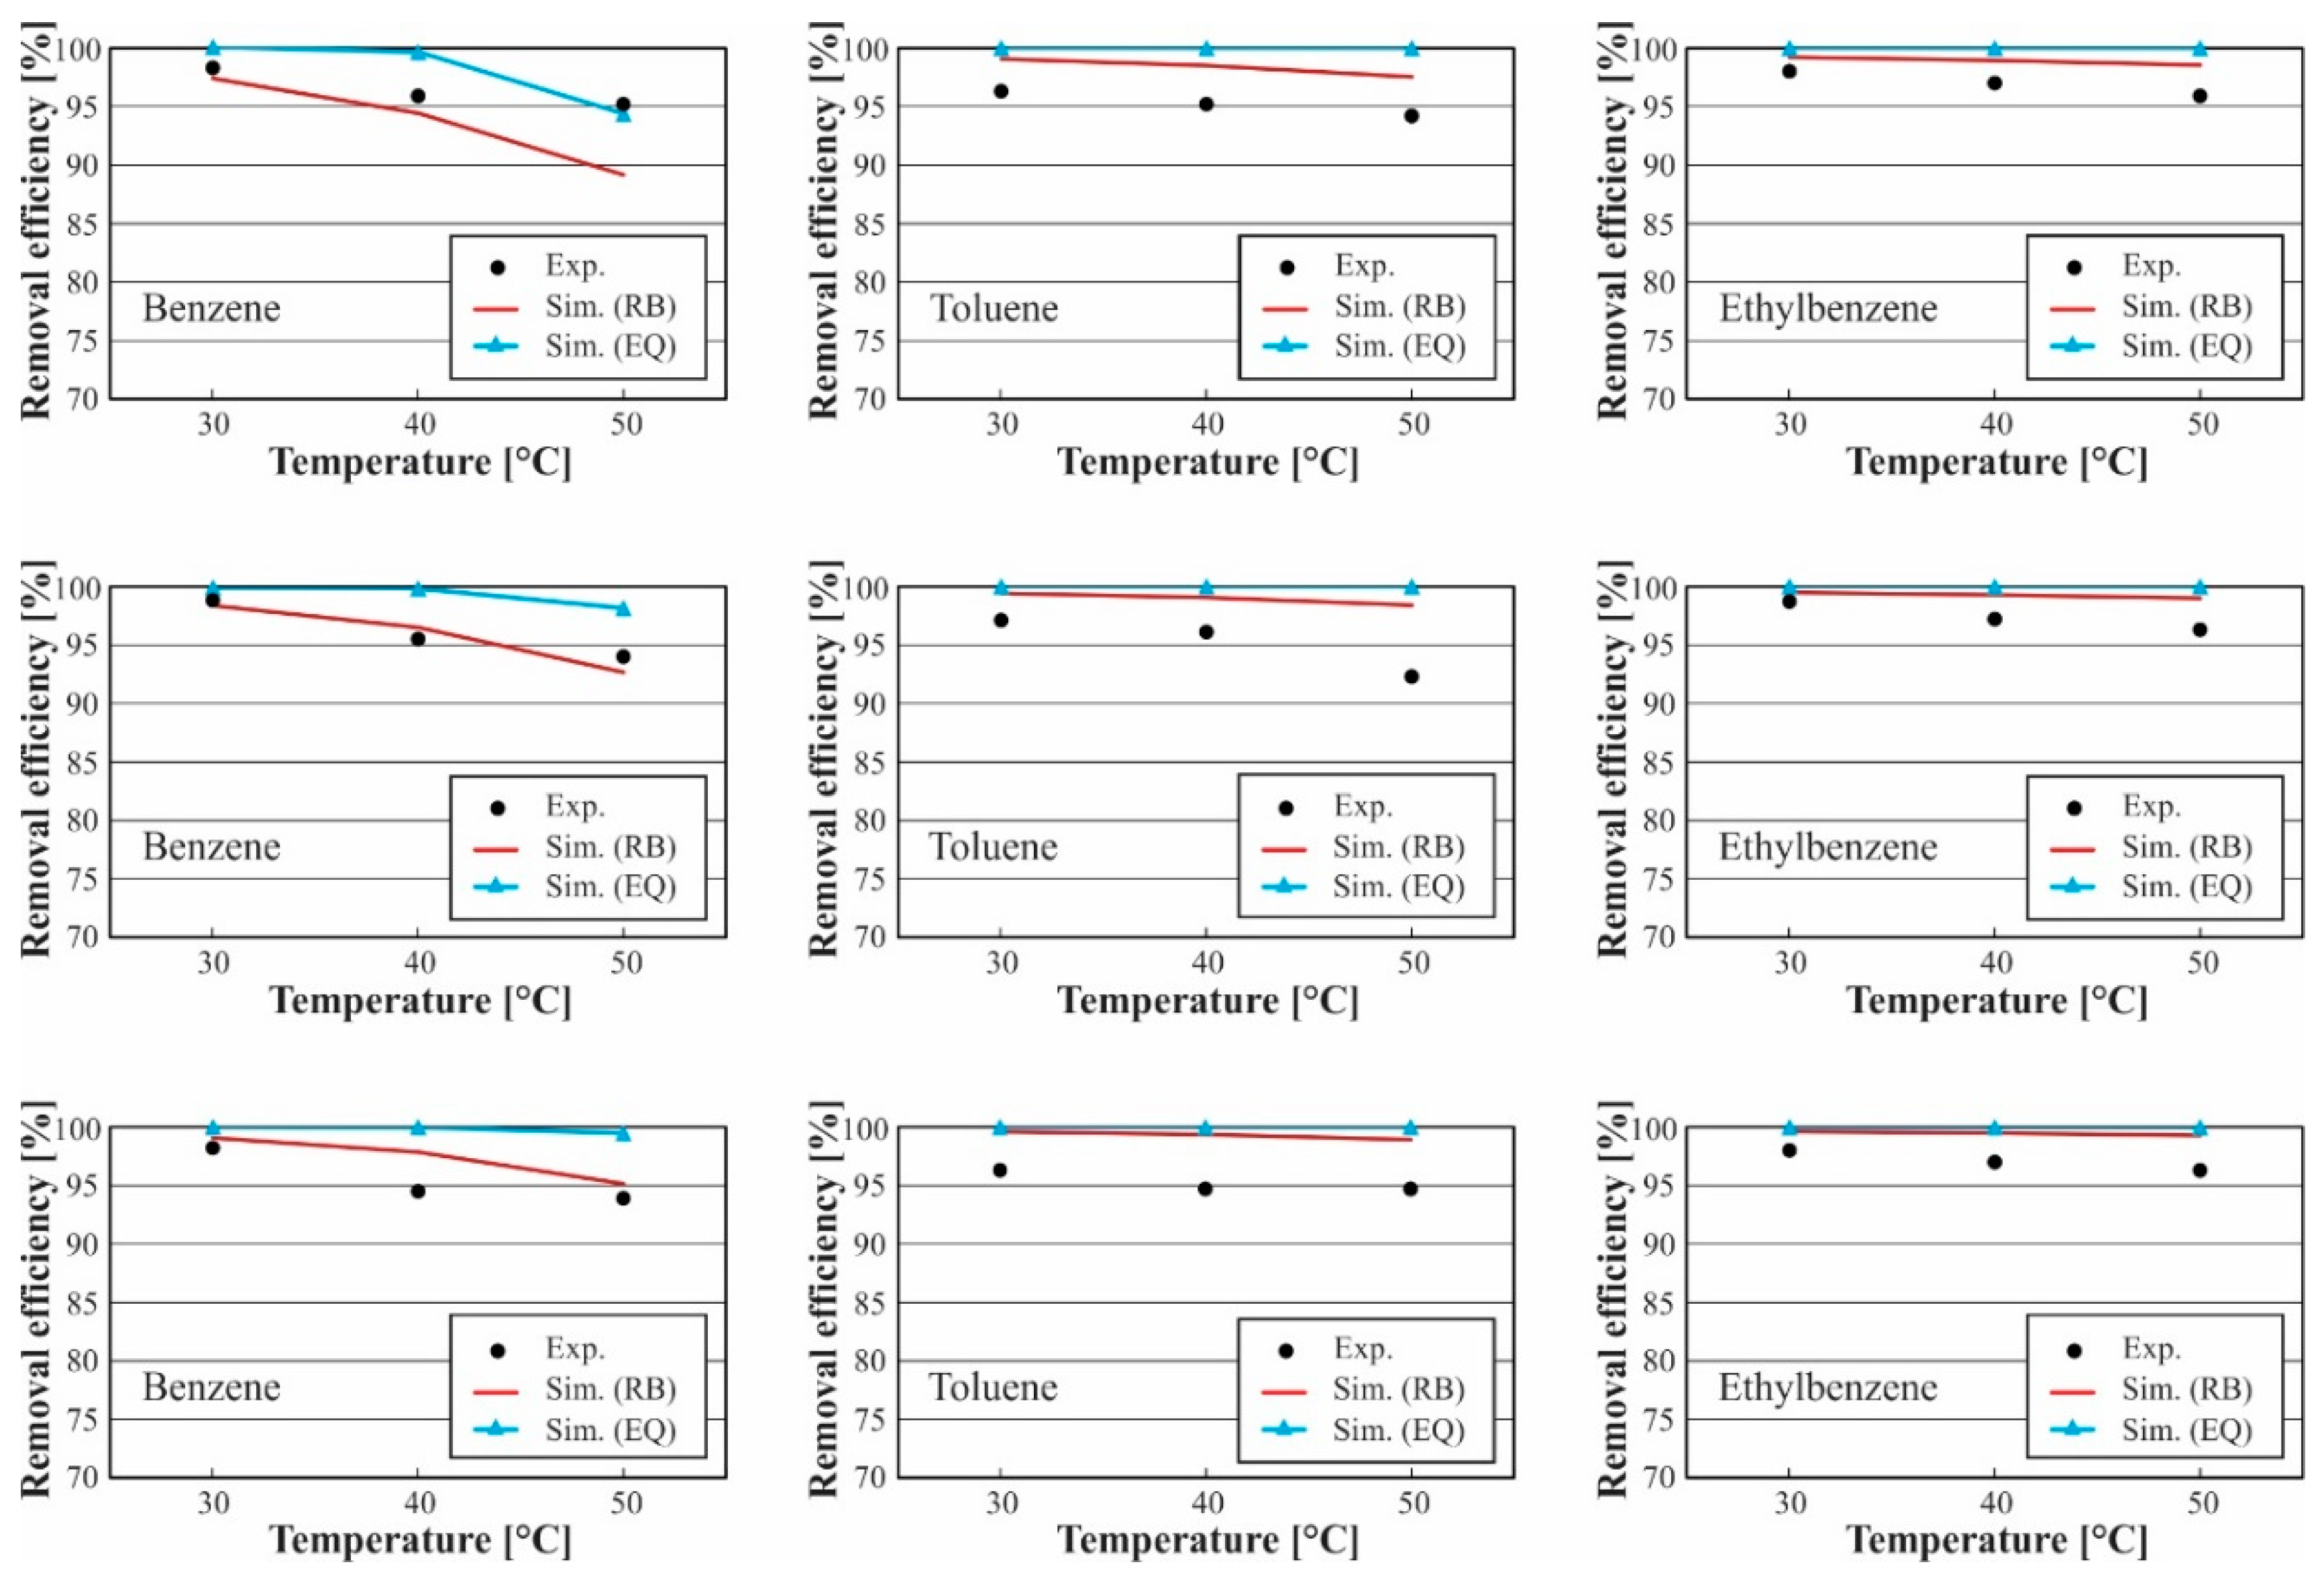
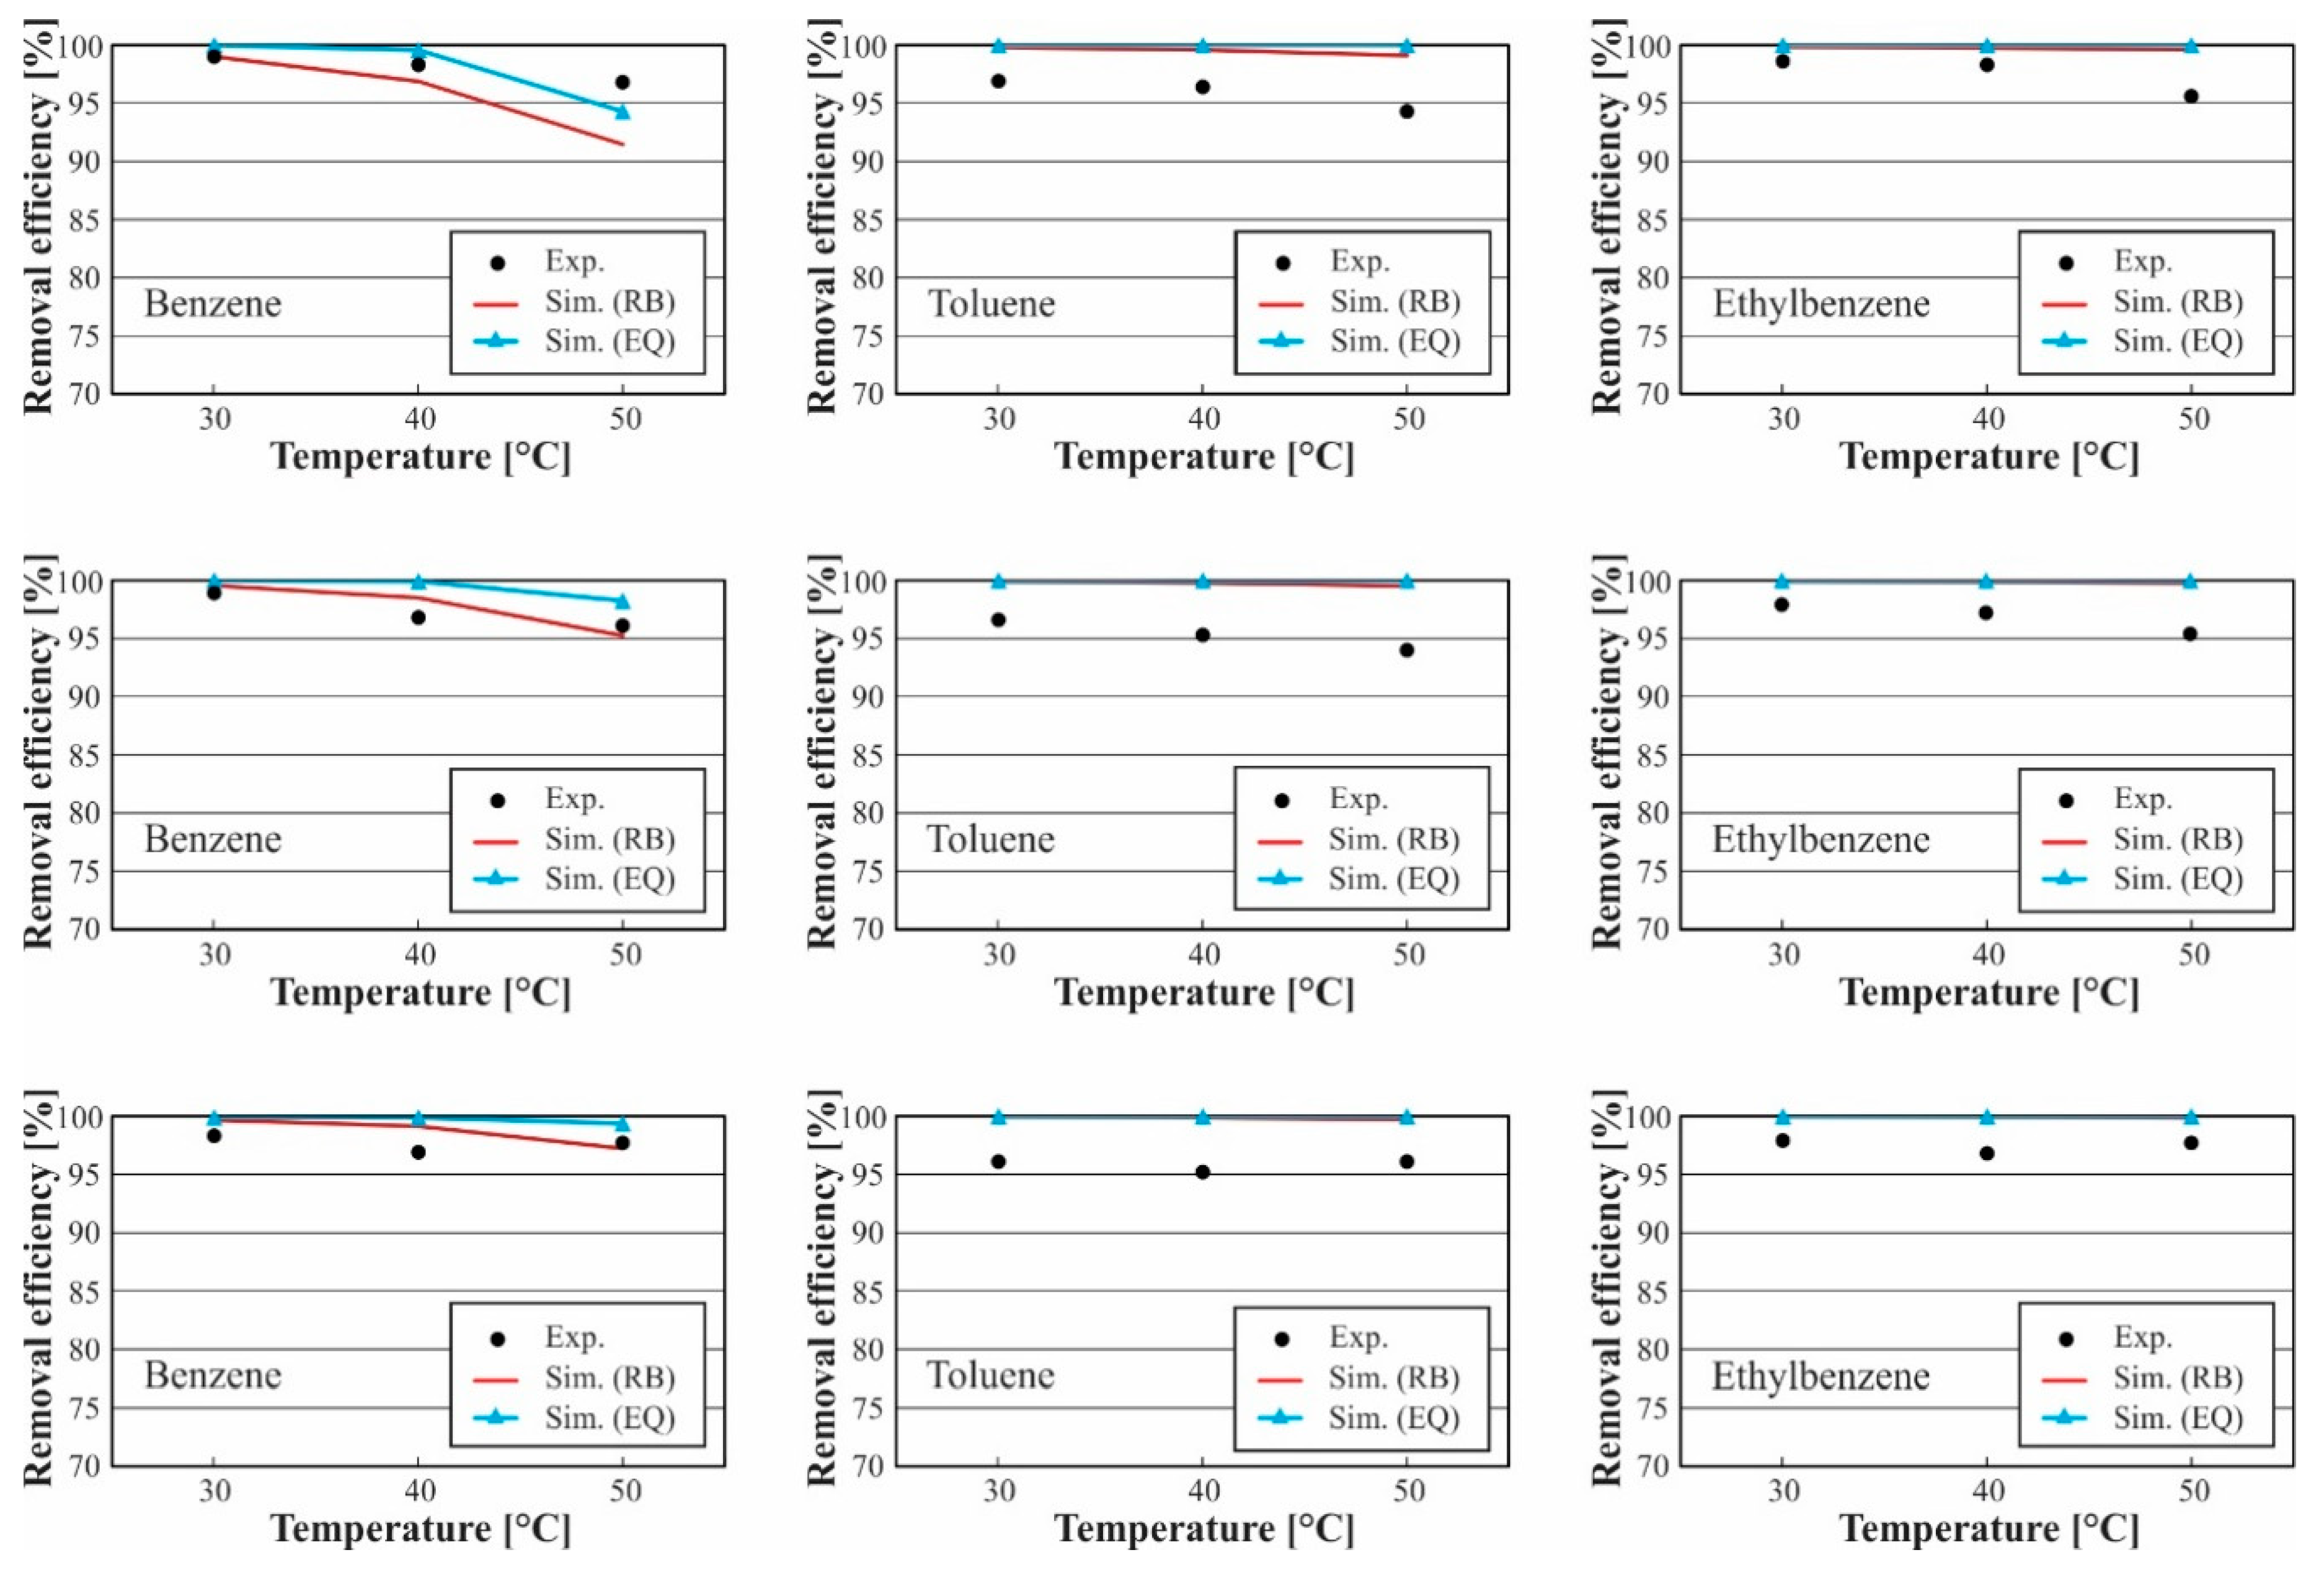
3.1. Model Validation

In this phase of simulation, the experimental data of the first minute reported by Bhoi [19] is used. The tar model used in this study was a mixture of compounds benzene, toluene, and ethylbenzene with mass fractions: 50% benzene, 30% toluene, and 20% ethylbenzene. The mass fraction values of these materials were selected because they are almost the mass fraction values of the tar compounds collected and measured from a fluidized bed gasifier [42]. The studied solvent temperatures for this experiment are 30, 40, and 50 °C. The studied solvent flow rates are 53, 63 and 73 mL/min. The studied heights of the packed bed are 0.5, 0.8, and 1.1 m. The pressure of both solvent and gas stream is 20 psig. The simulation results are presented in terms of removal efficiencies of tar compounds and reported as a function of operating parameters, i.e., the solvent temperature, the solvent mass flow rate, and the packed bed height.
Tar removal efficiency (η) was calculated using the following equation [19]:
η = C i n C o u t C i n
where C i n is cona centration of tar compounds (benzene, toluene, and ethylbenzene) at the inlet of the column [ p p m v ] , C o u t is concentration of the tar compounds (benzene, toluene and ethylbenzene) at the outlet of the column [ p p m v ] .
From the simulation, Figure 7, Figure 8 and Figure 9 show a comparison between the experimental data and the results predicted by both rate-based and equilibrium-stage models. Profiles in these figures show how the removal efficiencies of tar components change by changing the critical target parameters: solvent temperature, the flow rate of solvent (soybean oil), and the packing bed height. As shown in the figures, the prediction results of the removal efficiencies of tar components for both rate-based model and the equilibrium model are high compared to the experimental data, but the results obtained from the rate-based model have a better prediction for experimental data in comparison with the equilibrium-stage model. For assessing the accuracy of the models, MAPE (the mean absolute percentage error) is calculated between the values calculated using the models and those obtained from empirical measurements. The values of MAPE are shown in the Table 6, Table 7 and Table 8.
The deviation of results between the equilibrium model and the experimental data is because the equilibrium model assumes that the vapor and liquid left on the plates are in thermodynamic equilibrium [19]. In actual operation, the equilibrium between the gas and liquid phases is rare [29]. Although the rate-based model shows a good agreement with experimental data, there is a deviation. It may be explained because of the rate-based model based on the empirical correlations used for calculating the mass and heat transfer parameters [26]. It is clear that the deviation of results between the rate-based model and the experimental data increased by increasing the bed height. The explanation for this trend is that by increasing the packing bed height, the conditions will be close to the equilibrium state; this explains why the excellent agreement between the rate-based model and the equilibrium model increased by increasing the bed height. As a whole, the simulation results predicted by rate-based model are in the range of the experimental results.

3.2. Analysis of Tar Absorption Process

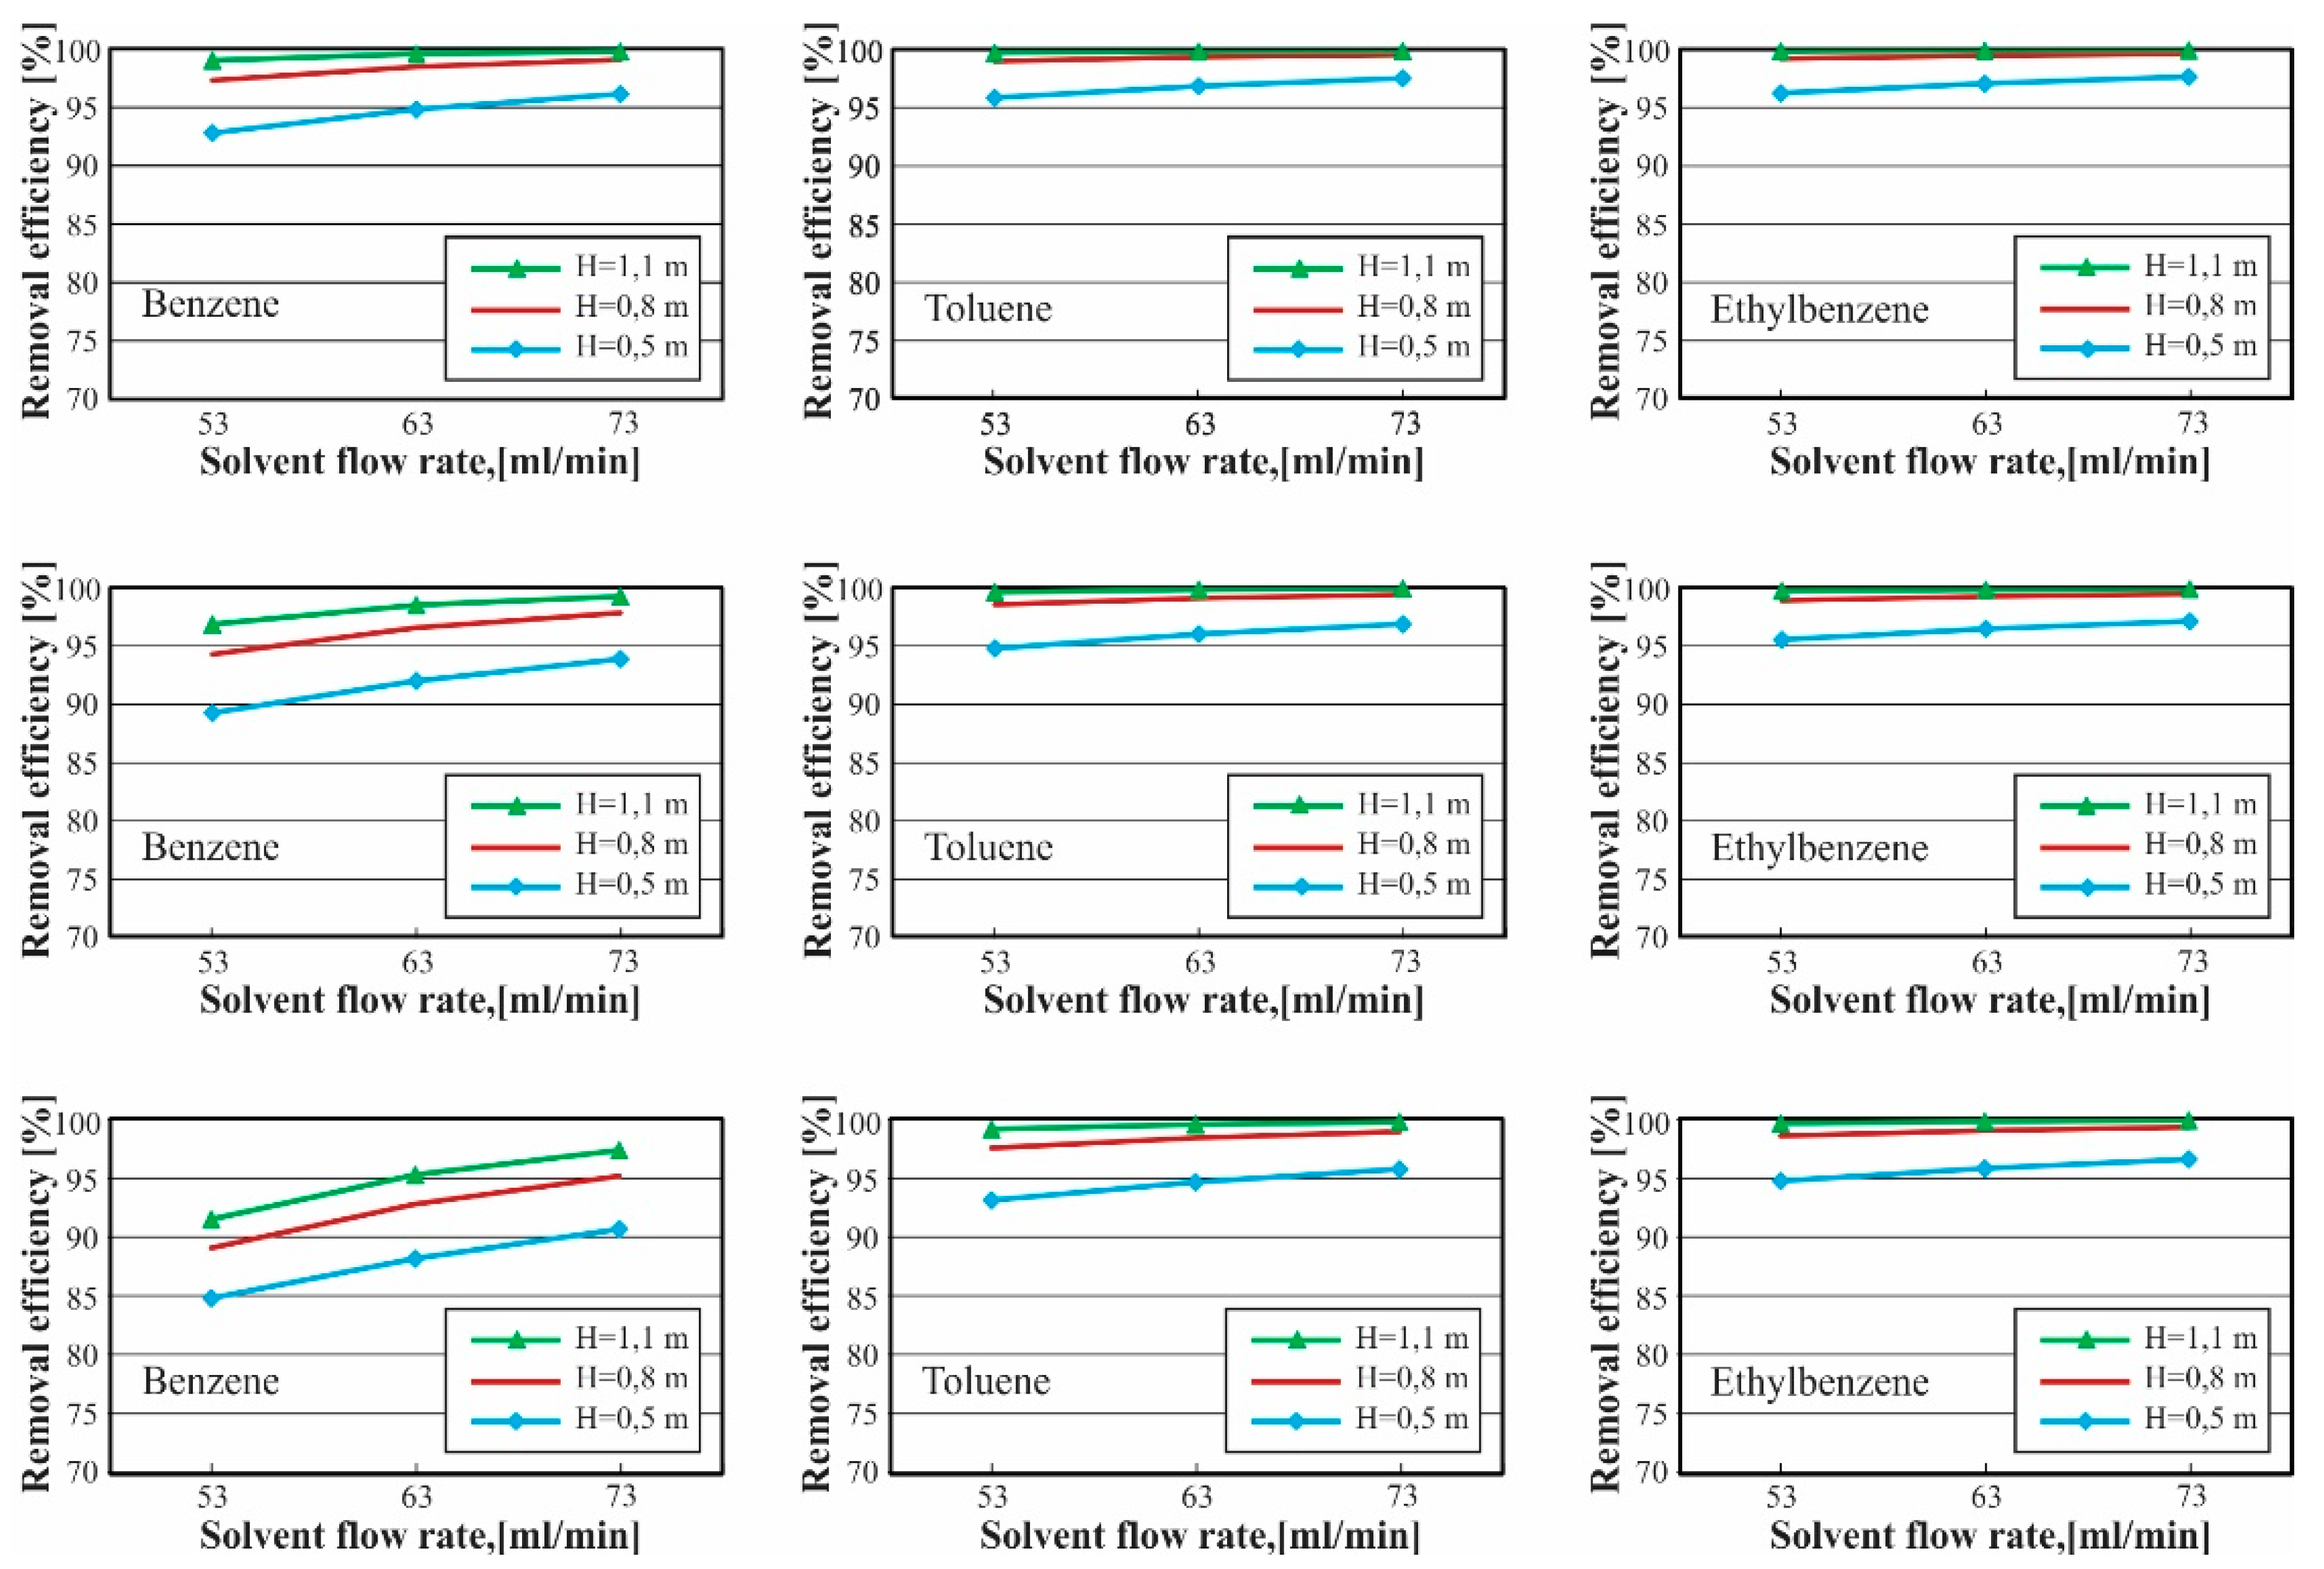
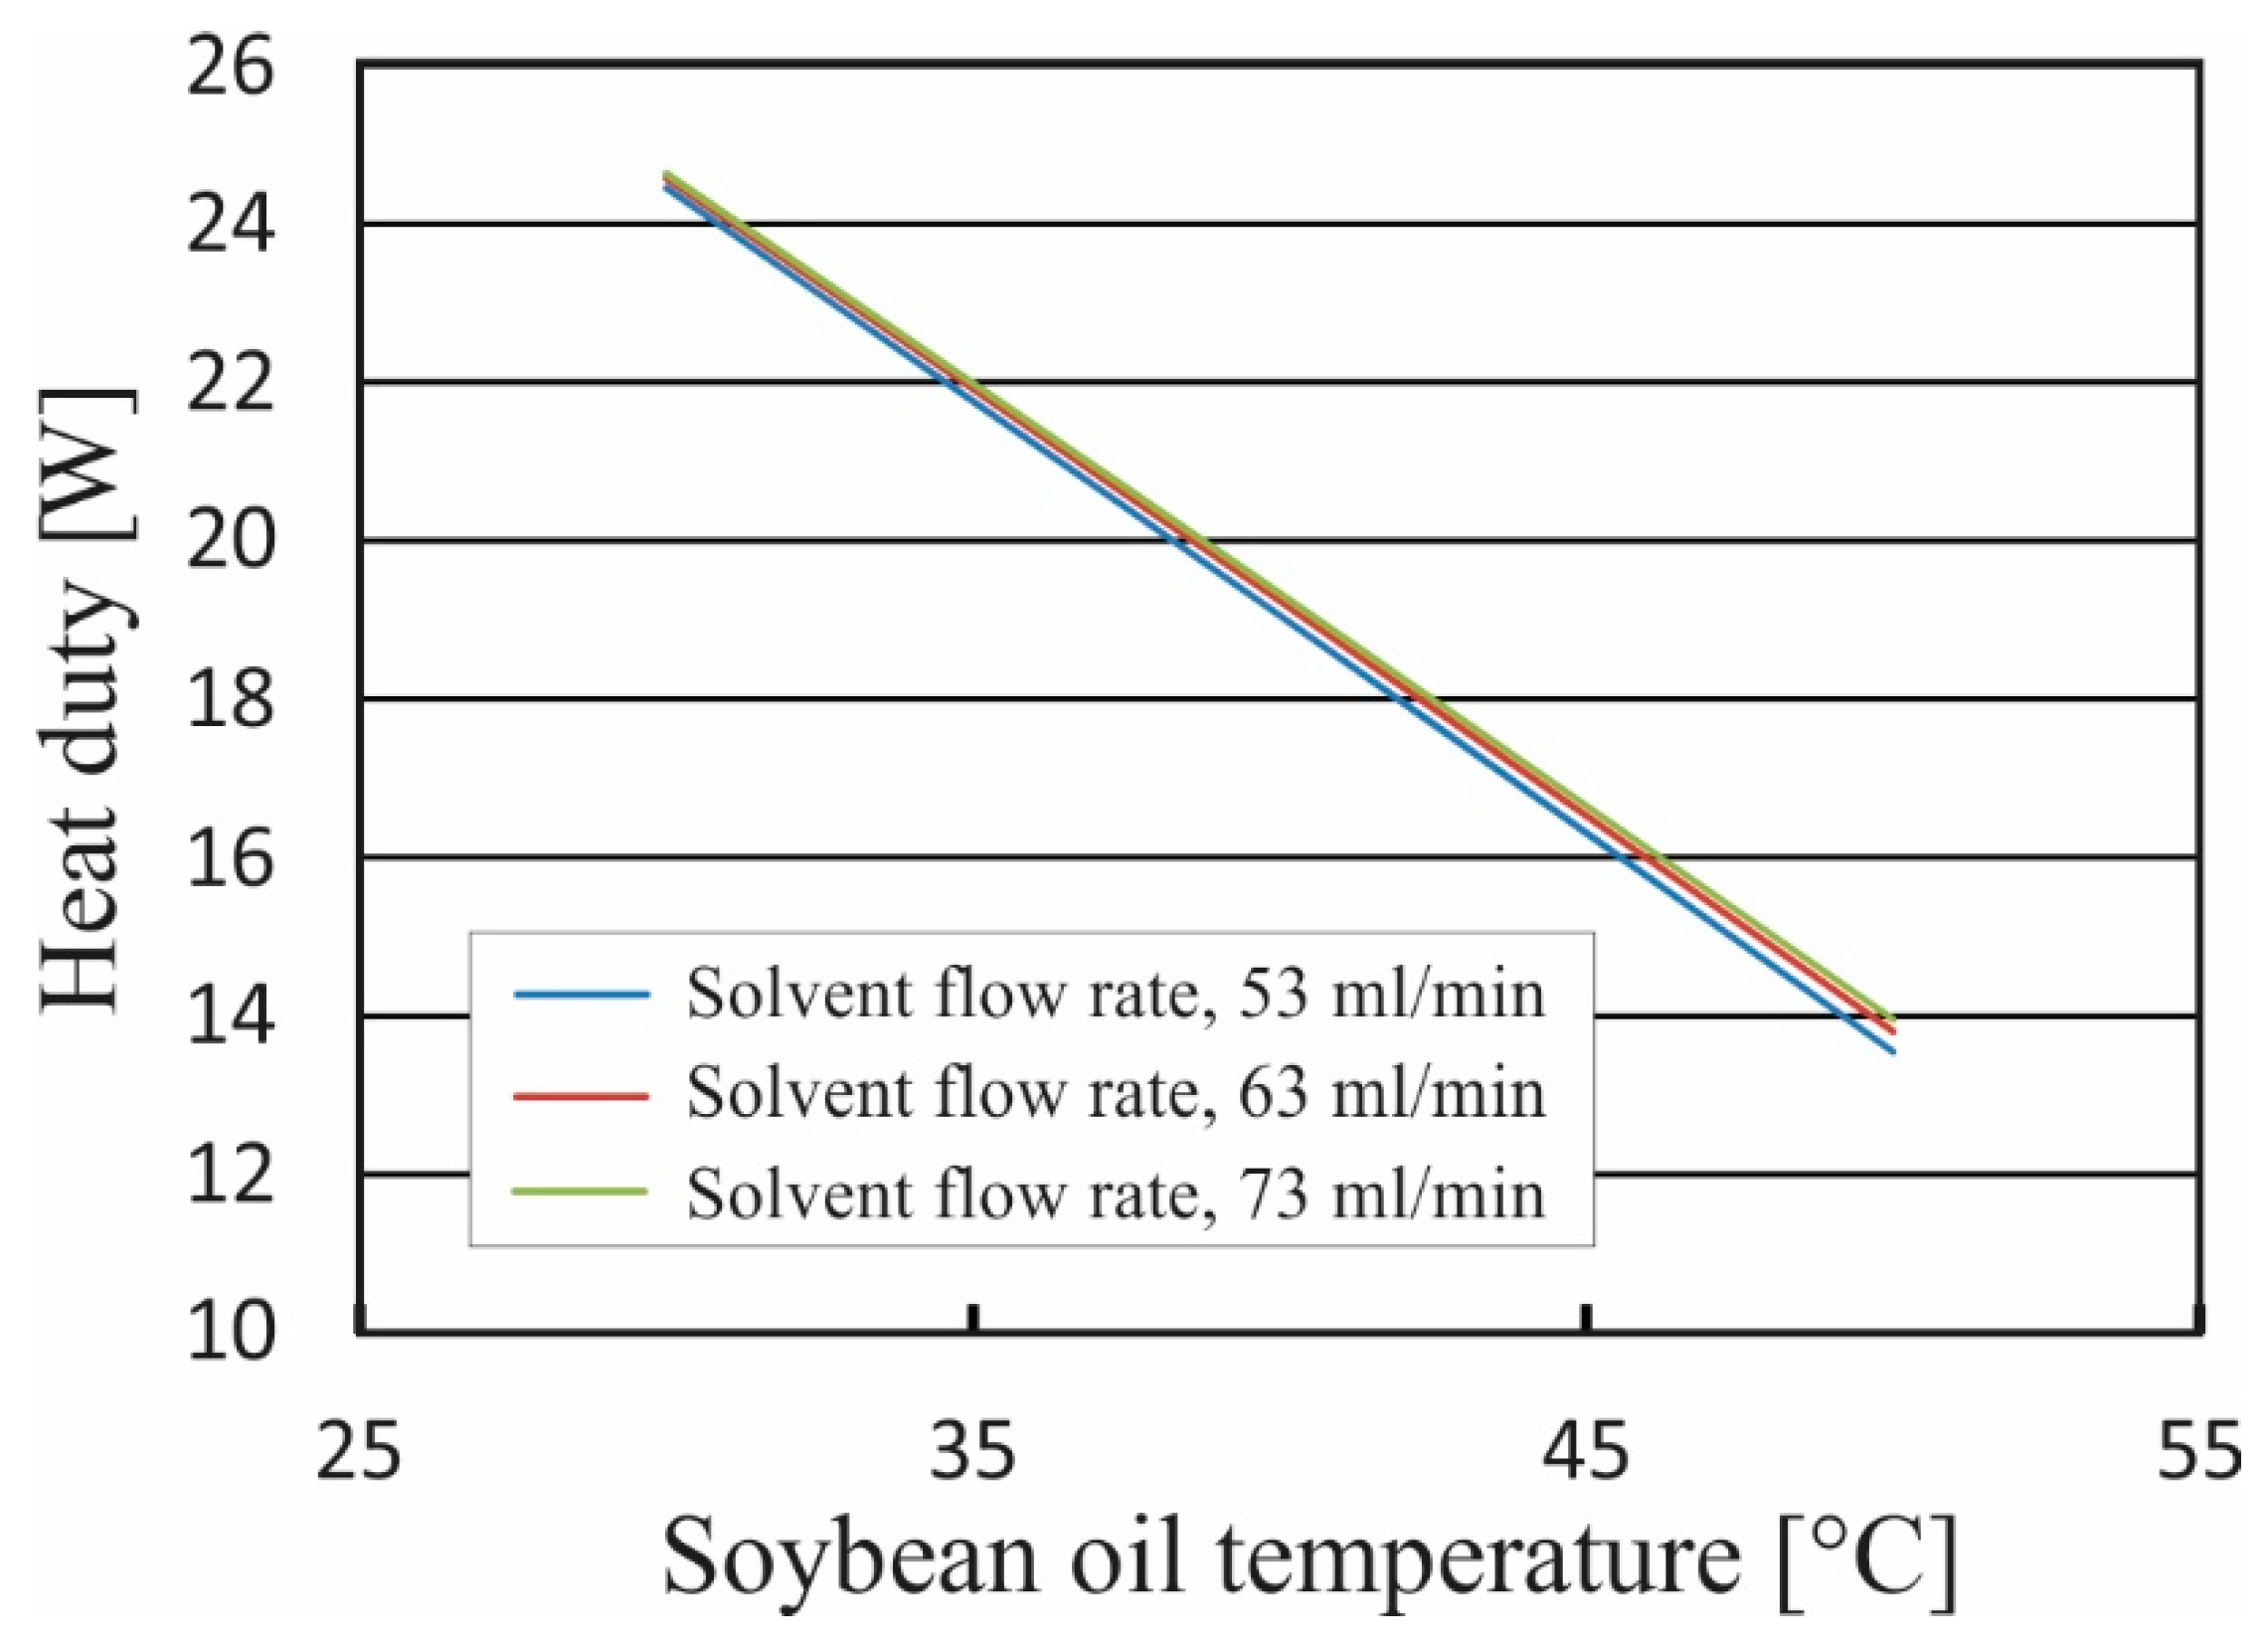
3.2.1. Effect of Solvent Temperature

Figure 7, Figure 8 and Figure 9, show the effect of the temperature of soybean oil solvent on the removal efficiency of tar components at bed heights 0.5, 0.8, and 1.1 m, and solvent flow rate of 53 mL/min (above), 63 mL/min (middle), 73 mL/min (below). It is clear from the figures that the increase in solvent temperature has a significant effect on the removal efficiencies. The removal efficiency decreases with increasing the temperature from 30 to 50 °C. The principal reason for this effect is that by increasing the solvent temperature, the solubility of tar compounds decreased, hence increasing the equilibrium ratio (K-value) [19].
On the other hand, increasing the solvent temperature leads to increasing the wettability of the solvent due to the decreased viscosity, as a result, the mass transfer and removal efficiency increase [19]. The effect of decreasing the solubility is more significant than increasing the wettability on decreasing the removal efficiency, so the removal efficiency is reduced by increasing the solvent temperature. The trend of this effect is similar for all the tar components, but the change rates (decreasing rates) of removal efficiency are different from component to component. The change rate for benzene is higher than toluene and ethylbenzene, for example at operating conditions of the volumetric flow rate of 53mL/min and a bed height of 0.5 m. Here, the removal efficiency decreased for benzene by about 8% by increasing the temperature from 30 to 50 °C, i.e., the change rate of removal efficiency for benzene is 0.4%/°C. Whereas the change rate value is 0.14%/°C for toluene and 0.08%/°C for ethylbenzene. It is also observed that the effect of increasing the soybean oil solvent temperature on the change rates of removal efficiency is influenced by the increase of the solvent volumetric flow rate. Increasing the volumetric flow rate of the soybean oil leads to a change rate decrease of the removal efficiency. For benzene at bed height of 0.5 as an example, the change rate of the removal efficiency at volumetric flow rate of 53 mL/min is 0.4%/°C and decreases to value 0.33%/°C at volumetric flow rate of 63 mL/min and it continues decreasing to a value of 0.27%/°C at 73 mL/min.
Furthermore, increasing the bed height influences the change rate of the removal efficiency. By increasing the temperature, the change rate of the removal efficiency decreases by increasing the bed height. This trend is shown in toluene and ethylbenzene for example at a volumetric flow rate of 53 mL/min. Here, the change rate of removal efficiency for toluene at a bed height of 0.5 m is 0.14%/°C, and it decreases to value 0.077%/°C at a bed height of 0.8 m, and it continues decreasing to a value 0.034%/°C at a bed height of 1.1 m.

3.2.2. Effect of Bed Height and Solvent Volumetric Flow Rate

Figure 10 shows the effect of solvent volumetric flow on the removal tar efficiency. It is evident that an increase in the solvent volumetric flow rate has a significant effect on the removal efficiency. The removal efficiency is dramatically enhanced when the solvent volumetric flow rate is increased. The reason is that by increasing the solvent volumetric flow rate, the mass transfer rates of tar compounds increase, resulting in higher tar removal efficiencies [19]. The trend of this effect is similar for all the tar components, but the change rates (increasing rates) of removal efficiencies by increasing the solvent volumetric flow rate are different from component to component. The change rates for benzene are higher than toluene and ethylbenzene.
Furthermore, increasing the bed height enhances the removal efficiency because of the mass transfer increasing between gas and liquid [19]. This trend of effect is similar for all tar components, but the change rates (increasing rates) of removal efficiency are different from components to another. Here, the change rate for benzene is higher than toluene and ethylbenzene.

3.2.3. Optimum Operation Conditions

Selecting the optimum (most economical) operation conditions should consider the requirements of the process as well as the operation cost and annualized charges on equipment. The requirement for tar concertation depends on the intended end use of the produced gas (gas application) [3]. Several researchers reported that the tar concentration should be up to 50–100 mg/Nm3 for ICE and less than 5 mg/Nm3 for gas turbines [2]. According to Hlina et al. [43], the tar concentration should be less than 0.1 mg/Nm3 for Fischer-Tropsch synthesis.
As previously mentioned, the removal efficiency is affected by three parameters: the temperature, the solvent volumetric flow rate, and the height of the bed. It is clear that increasing the bed height enhances the removal efficiency of tar components, but on the other hand, this leads to an increase in the amount of packing material needed to fill in a packed column which means more cost will be added to the total cost of the plant. Therefore, the bed height depends mainly on the requirement for tar concentration. It should meet these requirements considering the solvent volumetric flow rate to be set at a minimum value. Increasing the volumetric flow rate of the soybean oil solvent enhances the removal efficiency of tar components, but on the other hand, this leads to an increase in the operations cost. This operation cost results from the electrical energy consumed by the recycling pump. The optimum volumetric flow rate is linked to annualized charges on equipment. The total annualized cost should be calculated, which is equal to the sum of operation cost and annualized charges on equipment. The optimum flow rate of the solvent meets the minimum of the total annualized costs.
The temperature of the solvent has to be selected carefully. It has been observed that a decrease in the solvent temperature will increase the removal efficiency. However, the heat duty that should be added to the process to cool the solvent to the setup temperature (the inlet solvent temperature to absorber) should be considered. Therefore it is necessary to estimate the heat duty used to cool down the solvent temperature. The heat duty was calculated by ASPEN PLUS software. The results are illustrated in Figure 11; it clears that the heat duty to cool-down the solvent decreases by increasing the temperature of the solvent. From this curve, one can conclude that the solvent with high temperature is preferred for the deliberate process, but in a condition that this temperature achieves the requirement of tar concentration.

4. Conclusions

A rate-based model and equilibrium model have been built by applied Aspen Plus software for simulation of tar absorption using soybean oil as a solvent. Both models has been validated against experimental data at different operation points. The experimental data published by Bhoi [19] was used for validation of the models. Comparison between the results predicted by two mathematical models (rate-based and equilibrium stage) and the experimental data shows that the rate-based model has a higher accuracy than the equilibrium model. The deviation of results between the rate-based model and the experimental data increases by increasing the bed height where the conditions will be close to the equilibrium state. An analytical study of tar absorption process by using soybean oil has been presented which reveals the following points:
The removal efficiencies are different between the tar compounds (benzene, toluene, and ethylbenzene). The ethylbenzene has the highest removal efficiency. The removal efficiencies η of these components can be ranked as follows: η-value of ethylbenzene > η-value of toluene > η-value of benzene. The difference of removal efficiencies can be explained because of the different K values for these components: the lower th K value, the higher the removal efficiency, i.e., K-value of ethylbenzene < K-value of toluene < K-value of benzene at specific pressure and temperature [19].
The slope curves of removal efficiency for benzene, toluene, and ethylbenzene between 30 and 50 °C were approximately 0.4, 0.14, and 0.08, respectively which means that decreasing the temperature by 1 °C will enhance the removal efficiency for benzene, toluene, and ethylbenzene approximately by 0.4%, 0.14%, and 0.08%, respectively.
Increasing the solvent volumetric flow rate enhances the removal efficiency. The slopes curve of removal efficiency for benzene, toluene, and ethylbenzene between 53 and 73 mL/min are approximately 0.17, 0.084, and 0.071, respectively. It is essential to consider the energy consumed by increasing the volumetric flow rate of the solvent.
Increasing the height of the packed bed has a significant effect in enhancing the removal efficiency.
A methodology for selecting the optimum (most economical) operation conditions has been presented which it is vital in case scaling lab-scale experiment for the pilot plant.
Finally, it should be mentioned that the built and validated model is an essential tool for studying tar absorption process because of its ability to predict the process performance with changing parameters and hence saving the cost and time.

Author Contributions

A.A. is responsible for preparing the original draft and developing the applied methodology. F.A. supported the writing process with his reviews and edits. The conceptualization was conducted by C.H. B.E. supervised the research progress and the presented work. All authors have read and agreed to the published version of the manuscript.

Funding

The authors received no specific funding for this work. The corresponding author would like to thank the Technical University of Darmstadt, enabling the open-access publication of this paper.

Conflicts of Interest

The authors declare no conflict of interest.

Nomenclatures

L the molar flow rate of liquid [ kmol / s ]
V the molar flow rate of vapor [ kmol / s ]
F the molar flow rate of feed [ kmol / s ]
N molar transfer rate [ kmol / s ]
n ˙ i molar transfer rate per unit of square area [ kmol s . m 2 ]
c Molar concentration [ kmol m 3 ]
K Equilibrium ratio [ ]
P Gas pressure [ atm ]
r Reaction rate [ kmol / s ]
H Enthalpy [ J / kmol ]
Q Heat input to a stage [ J / s ]
q Heat transfer rate [ J / s ]
TTemperature K
x Liquid mole fraction [ ]
y Vapor mole fraction [ ]
k L Binary mass transfer coefficient for the liquid [ m / s ]
k G Binary mass transfer coefficient for the gas [ m / s ]
C L Liquid mass transfer coefficient parameter, characteristic of the shape and structure of the packing [ ]
C V Vapor mass transfer coefficient parameter, characteristic of the shape and structure of the packing [ ]
g Gravitational constant [ m / s 2 ]
ρ L ,   ρ G The density of the liquid, vapor [ kg / m 3 ]
ν L ,   ν G The viscosity of liquid, vapor [ m 2 / s ]
D L , D G Diffusivity of the liquid, vapor [ m 2 / s ]
d h Hydraulic diameter m
U L ,   U G velocity for the liquid, vapor [ m / s ]
ε Void fraction of the packing [ ]
a Specific surface area [ m 2 / m 3 ]
a e f f Effective surface area per unit volume of the column [ m 2 / m 3 ]
d e q Equivalent diameter [ m ]
σ Liquid surface tension [ N / m ]
h L Heat transfer coefficient for liquid [ W / m 2 K ]
h V Heat transfer coefficient for vapor [ W / m 2 K ]
n c The number of components [ ]
C p Specific molar heat capacity [ J / kmol   K ]
λ Thermal conductivity [ W / m   K ]
h L Volumetric liquid holdup [ m 3 ]
f i V Fugacity of component i in the vapor phase [ bar ]
f i L Fugacity of component i in the liquid phase [ bar ]
VTotal volume [ L ]
φ i a Fugacity coefficient of component i [ ]
P Pressure [ bar ]
R Gas constant =0.08314 [ L   bar   K 1 ]
T Temperature [ K ]
n i Mole number of component i [ ]
Z m a Compression factor [ ]
Subscripts
F Feed
f Film
I Interface
L Liquid
V Vapor
a Liquid or Vapor
GGas
i Component
n Number of components
j Stage number
Abbreviations
ASPEN PLUSSimulation software program
GCGas chromatography
NRTLNon-random two-liquid model
ICEInternal combustion engine
MESHEquations of material, energy balances, summation of composition, and equilibrium relation
MERSHQEquations of material, energy balances, rate of mass and heat
transfer, summation of composition, hydraulic equation of pressure
drop, and equilibrium
RBRate-based model
EQEquilibrium-stage model
MAPEThe mean absolute percentage error

References

  1. Van Paasen, S.; Kiel, J. Tar formation in fluidised-bed gasification-impact of gasifier operating conditions. Acknowledgement/Preface 2004, 14, 26. [Google Scholar]
  2. Anis, S.; Zainal, Z. Tar reduction in biomass producer gas via mechanical, catalytic and thermal methods: A review. Renew. Sustain. Energy Rev. 2011, 15, 2355–2377. [Google Scholar] [CrossRef]
  3. Milne, T.A.; Evans, R.J.; Abatzaglou, N. Biomass Gasifier “Tars”: Their Nature, Formation, and Conversion; National Renewable Energy Laboratory: Golden, CO, USA, 1998. [Google Scholar]
  4. Devi, L.; Ptasinski, K.J.; Janssen, F.J.; Van Paasen, S.V.; Bergman, P.C.; Kiel, J.H. Catalytic decomposition of biomass tars: Use of dolomite and untreated olivine. Renew. Energy 2005, 30, 565–587. [Google Scholar] [CrossRef]
  5. Boerrigter, H.; Van Paasen, S.; Bergman, P.; Könemann, J.; Emmen, R.; Wijnands, A. OLGA tar removal technology. Energy Res. Centre Neth. ECN-C--05-009 2005. [Google Scholar]
  6. Unger, C.; Ising, M. Mechanismen und Bedeutung der Teerbildung und Teerbeseitigung bei der termochemischen Umwandlung fester Kohlenstoffträger. DGMK-Tagungsbericht 2002, 2, 131–142. [Google Scholar]
  7. Li, C.; Suzuki, K. Tar property, analysis, reforming mechanism and model for biomass gasification—An overview. Renew. Sustain. Energy Rev. 2009, 13, 594–604. [Google Scholar] [CrossRef]
  8. Neeft, J.; Knoef, H.; Onaji, P. Behaviour of Tar in Biomass Gasification Systems: Tar Related Problems and their Solutions; Novem: Sittard, The Netherlands, 1999. [Google Scholar]
  9. Kübel, M. Teerbildung und Teerkonversion bei der Biomassevergasung-Anwendung der Nasschemischen Teerbestimmung nach CEN-Standard; Cuvillier: Göttingen, Germany, 2007. [Google Scholar]
  10. Wolfesberger, U.; Aigner, I.; Hofbauer, H. Tar content and composition in producer gas of fluidized bed gasification of wood-Influence of temperature and pressure. Environ. Prog. Sustain. Energy 2009, 28, 372–379. [Google Scholar] [CrossRef]
  11. Devi, L.; Ptasinski, K.J.; Janssen, F.J. A review of the primary measures for tar elimination in biomass gasification processes. Biomass Bioenergy 2003, 24, 125–140. [Google Scholar] [CrossRef]
  12. Nakamura, S.; Kitano, S.; Yoshikawa, K. Biomass gasification process with the tar removal technologies utilizing bio-oil scrubber and char bed. Appl. Energy 2016, 170, 186–192. [Google Scholar] [CrossRef]
  13. Dyment, J.; Watanasiri, S. Acid Gas Cleaning Using DEPG Physical Solvents: Validation with Experimental and Plant Data; Aspen Technology Inc.: Bedford, MA, USA, 2015. [Google Scholar]
  14. Pilling, M.; Holden, B.S. Choosing Trays and Packings for Distillation; American Institute of Chemical Engineers CEP: New York, NY, USA, 2009; pp. 44–50. [Google Scholar]
  15. Mudhasakul, S.; Ku, H.-M.; Douglas, P.L. A simulation model of a CO2 absorption process with methyldiethanolamine solvent and piperazine as an activator. Int. J. Greenh. Gas Control. 2013, 15, 134–141. [Google Scholar] [CrossRef]
  16. Phuphuakrat, T.; Namioka, T.; Yoshikawa, K. Absorptive removal of biomass tar using water and oily materials. Bioresour. Technol. 2011, 102, 543–549. [Google Scholar] [CrossRef] [PubMed]
  17. Bergman, P.C.; van Paasen, S.V.; Boerrigter, H. The novel “OLGA” technology for complete tar removal from biomass producer gas. In Pyrolysis and Gasification of Biomass and Waste, Expert Meeting; osti.gov: Strasbourg, France, 2002. [Google Scholar]
  18. Paethanom, A.; Nakahara, S.; Kobayashi, M.; Prawisudha, P.; Yoshikawa, K. Performance of tar removal by absorption and adsorption for biomass gasification. Fuel Process. Technol. 2012, 104, 144–154. [Google Scholar] [CrossRef]
  19. Bhoi, P.R. Wet Scrubbing of Biomass Producer Gas Tars Using Vegetable Oil; Oklahoma State University: Stillwater, OK, USA, 2014. [Google Scholar]
  20. Ozturk, B.; Yilmaz, D. Absorptive Removal of Volatile Organic Compounds from Flue Gas Streams. Process. Saf. Environ. Prot. 2006, 84, 391–398. [Google Scholar] [CrossRef]
  21. Mofarahi, M.; Khojasteh, Y.; Khaledi, H.; Farahnak, A. Design of CO2 absorption plant for recovery of CO2 from flue gases of gas turbine. Energy 2008, 33, 1311–1319. [Google Scholar] [CrossRef]
  22. Pandya, J. Adiabatic gas absorption and stripping with chemical reaction in packed towers. Chem. Eng. Commun. 1983, 19, 343–361. [Google Scholar] [CrossRef]
  23. Tontiwachwuthikul, P.; Meisen, A.; Lim, C. CO2 absorption by NaOH, monoethanolamine and 2-amino-2-methyl-1-propanol solutions in a packed column. Chem. Eng. Sci. 1992, 47, 381–390. [Google Scholar] [CrossRef]
  24. Tobiesen, F.A.; Svendsen, H.F.; Juliussen, O. Experimental validation of a rigorous absorber model for CO2 postcombustion capture. AIChE J. 2007, 53, 846–865. [Google Scholar] [CrossRef]
  25. Mores, P.L.; Scenna, N.; Mussati, S. A rate based model of a packed column for CO2 absorption using aqueous monoethanolamine solution. Int. J. Greenh. Gas Control. 2012, 6, 21–36. [Google Scholar] [CrossRef]
  26. Afkhamipour, M.; Mofarahi, M. Comparison of rate-based and equilibrium-stage models of a packed column for post-combustion CO2 capture using 2-amino-2-methyl-1-propanol (AMP) solution. Int. J. Greenh. Gas Control. 2013, 15, 186–199. [Google Scholar] [CrossRef]
  27. Bhoi, P.; Huhnke, R.L.; Kumar, A.; Payton, M.E.; Patil, K.N.; Whiteley, J.R. Vegetable oil as a solvent for removing producer gas tar compounds. Fuel Process. Technol. 2015, 133, 97–104. [Google Scholar] [CrossRef]
  28. Seader, J.; Henley, E.J.; Roper, D.K. Separation Process Principles: Chemical and Biochemical Operations; John Wiley and Sons, Inc.: Hoboken, NJ, USA, 2011. [Google Scholar]
  29. Ramesh, K.; Aziz, N.; Shukor, S.A.; Ramasamy, M. Dynamic rate-based and equilibrium model approaches for continuous tray distillation column. J. Appl. Sci. Res. 2007, 3, 2030–2041. [Google Scholar]
  30. Billet, R.; Schultes, M. Prediction of Mass Transfer Columns with Dumped and Arranged Packings. Chem. Eng. Res. Des. 1999, 77, 498–504. [Google Scholar] [CrossRef]
  31. Taylor, R.; Krishna, R. Multicomponent Mass Transfer; John Wiley & Sons: Hoboken, NJ, USA, 1993. [Google Scholar]
  32. Whitman, W.G. The two film theory of gas absorption. Int. J. Heat Mass Transf. 1962, 5, 429–433. [Google Scholar] [CrossRef]
  33. Ngo, T.H. Gas Absorption into Emulsions (Doctoral Dissertation Published by Universitätsbibliothek Braunschweig. Available online: https://nbn-resolving.org/urn:nbn:de:gbv:084-13043009095 (accessed on 5 March 2013).
  34. Khan, F.; Krishnamoorthi, V.; Mahmud, T. Modelling reactive absorption of CO2 in packed columns for post-combustion carbon capture applications. Chem. Eng. Res. Des. 2011, 89, 1600–1608. [Google Scholar] [CrossRef]
  35. Simon, L.L.; Elias, Y.; Puxty, G.; Artanto, Y.; Hungerbuhler, K. Rate based modeling and validation of a carbon-dioxide pilot plant absorbtion column operating on monoethanolamine. Chem. Eng. Res. Des. 2011, 89, 1684–1692. [Google Scholar] [CrossRef]
  36. Bhoi, P.; Huhnke, R.L.; Kumar, A.; Patil, K.N.; Whiteley, J.R. Design and development of a bench scale vegetable oil based wet packed bed scrubbing system for removing producer gas tar compounds. Fuel Process. Technol. 2015, 134, 243–250. [Google Scholar] [CrossRef]
  37. Bird, R.B.; Stewart, W.E.; Lightfoot, E.N.; Meredith, R.E. Reviewer Transport Phenomena. J. Electrochem. Soc. 1961, 108, 78C. [Google Scholar] [CrossRef]
  38. Gebreyohannes, S.; Yerramsetty, K.; Neely, B.J.; Gasem, K.A.M. Improved QSPR generalized interaction parameters for the nonrandom two-liquid activity coefficient model. Fluid Phase Equilibria 2013, 339, 20–30. [Google Scholar] [CrossRef]
  39. Renon, H.; Prausnitz, J.M. Local compositions in thermodynamic excess functions for liquid mixtures. AIChE J. 1968, 14, 135–144. [Google Scholar] [CrossRef]
  40. Chilton, T.H.; Colburn, A.P. Mass Transfer (Absorption) Coefficients Prediction from Data on Heat Transfer and Fluid Friction. Ind. Eng. Chem. 1934, 26, 1183–1187. [Google Scholar] [CrossRef]
  41. Plus, A. Aspen Plus Documentation Version V7. 3; Aspen Tech: Cambridge, MA, USA, 2011. [Google Scholar]
  42. Cateni, B.G. Effects of Feed Composition and Gasification Parameters on Product Gas from a Pilot Scale Fluidized Bed Gasifier; Oklahoma State University: Stillwater, OK, USA, 2007. [Google Scholar]
  43. Hlina, M.; Hrabovsky, M.; Kavka, T.; Konrad, M. Tar measurement in synthetic gas produced by plasma gasification by solid phase microextraction (SPME). In Proceedings of the ISPC Conference, Philadelphia, PA, USA, 24–29 July 2011; pp. 24–29. [Google Scholar]
Figure 1. Illustration of the need for primary and secondary measures [2].
Applsci 10 02362 g001
Figure 2. Schematic diagram of a bench-scale wet scrubbing set-up [27].
Applsci 10 02362 g002
Figure 3. Equilibrium stage model [21].
Applsci 10 02362 g003
Figure 4. Rate-based stage model (Reproduced from ASPEN PLUS software manual).
Applsci 10 02362 g004
Figure 5. Concentration profiles based on the two-film model [34], * refers to the conditions at the equilibrium state.
Applsci 10 02362 g005
Figure 6. Flowsheet of process simulation in ASPEN PLUS.
Applsci 10 02362 g006
Figure 7. Effect of solvent temperature on the removal efficiency of tar components at a bed height of 0.5 m and different solvent volumetric flow rates of 53 mL/min (above), 63 mL/min (middle), 73 mL/min (below).
Applsci 10 02362 g007
Figure 8. Effect of solvent temperature on the removal efficiency of tar components at a bed height of 0.8 m and different solvent volumetric flow rates 53 mL/min (above), 63 mL/min (middle), 73 mL/min (below).
Applsci 10 02362 g008
Figure 9. Effect of solvent temperature on the removal efficiency of tar components at a bed height of 1.1 m and different solvent volumetric flow rates of 53 mL/min (above), 63 mL/min (middle), 73 mL/min (below).
Applsci 10 02362 g009
Figure 10. Effect of bed height on the removal efficiency of tar components at solvent volumetric flow rates of 53.63 and 73mL/min, the temperatures are 30 °C (above), 40 °C (middle), and 50 °C (below).
Applsci 10 02362 g010
Figure 11. Heat duty of the heat exchanger.
Applsci 10 02362 g011
Table 1. Absorption efficiencies of tar components by different solvents (%) [16].
AbsorbentWaterDiesel FuelBiodiesel FuelVegetable OilEngine Oil
Benzene24.177.086.177.661.7
Toluene22.563.294.791.182.3
Xylene22.1−730.197.896.490.7
Styrene23.557.798.197.191.1
Phenol92.8−111.199.999.797.7
Indene28.297.997.297.688.7
Naphthalene38.997.490.393.576.2
Table 2. Binary diffusion coefficients (cm2/s) used in Aspen PLUS at conditions of an experiment of 30 °C, flow rates 53 mL/min, and at a bed height of 0.5 m.
ComponentN-HEXADECANOIC-ACIDSTEARIC-ACIDOLEIC-ACIDLINOLEIC-ACIDLINOLENIC-ACIDBENZENETOLUENEETHYLBENZENEAIR
N-HEXADECANOIC-ACID04.31171 × 1074.68659 × 1074.64699 × 1074.49859 × 1071.06954 × 1069.4904 × 1078.58892 × 1072.02164 × 106
STEARIC-ACID4.31171 × 10704.38352 × 1074.38287 × 1074.40934 × 1071.10896 × 1069.96534 × 1079.036 × 1072.07824 × 106
OLEIC-ACID4.68659 × 1074.38352 × 10704.55134 × 1074.54058 × 1071.12982 × 1069.97283 × 1079.01854 × 1072.14434 × 106
LINOLEIC-ACID4.64699 × 1074.38287 × 1074.55134 × 10704.53858 × 1071.12457 × 1069.93516 × 1078.98562 × 1072.13301 × 106
LINOLENIC-ACID4.49859 × 1074.40934 × 1074.54058 × 1074.53858 × 10701.11272 × 1069.88611 × 1078.94878 × 1072.10185 × 106
BENZENE1.06954 × 1061.10896 × 1061.12982 × 1061.12457 × 1061.11272 × 10605.44604 × 1074.90094 × 1076.55351 × 107
TOLUENE9.4904 × 1079.96534 × 1079.97283 × 1079.93516 × 1079.88611 × 1075.44604 × 10705.42316 × 1074.14606 × 107
ETHYLBENZENE8.58892 × 1079.036 × 1079.01854 × 1078.98562 × 1078.94878 × 1074.90094 × 1075.42316 × 10703.32784 × 107
AIR2.02164 × 1062.07824 × 1062.14434 × 1062.13301 × 1062.10185 × 1066.55351 × 1074.14606 × 1073.32784 × 1070
Table 3. Overall binary mass transfer coefficients (kmol/s) used in Aspen PLUS at conditions of an experiment of 30 °C, flow rates 53 mL/min, and at a bed height of 0.5 m.
ComponentN-HEXADECANOIC-ACIDSTEARIC-ACIDOLEIC-ACIDLINOLEIC-ACIDLINOLENIC-ACIDBENZENETOLUENEETHYLBENZENEAIR
N-HEXADECANOIC-ACID04.9358 × 1075.1459 × 1075.12412 × 1075.04163 × 1077.77376 × 1077.32277 × 1076.9663 × 1071.06877 × 106
STEARIC-ACID4.9358 × 10704.97674 × 1074.97636 × 1074.99137 × 1077.91572 × 1077.50376 × 1077.14531 × 1071.08363 × 106
OLEIC-ACID5.1459 × 1074.97674 × 10705.0711 × 1075.06511 × 1077.98982 × 1077.50658 × 1077.13841 × 1071.10073 × 106
LINOLEIC-ACID5.12412 × 1074.97636 × 1075.0711 × 10705.06399 × 1077.97126 × 1077.49239 × 1077.12536 × 1071.09782 × 106
LINOLENIC-ACID5.04163 × 1074.99137 × 1075.06511 × 1075.06399 × 10707.92915 × 1077.47387 × 1077.11074 × 1071.08977 × 106
BENZENE7.77376 × 1077.91572 × 1077.98982 × 1077.97126 × 1077.92915 × 10705.54719 × 1075.26227 × 1076.08513 × 107
TOLUENE7.32277 × 1077.50376 × 1077.50658 × 1077.49239 × 1077.47387 × 1075.54719 × 10705.53553 × 1074.84006 × 107
ETHYLBENZENE6.9663 × 1077.14531 × 1077.13841 × 1077.12536 × 1077.11074 × 1075.26227 × 1075.53553 × 10704.33625 × 107
AIR1.06877 × 1061.08363 × 1061.10073 × 1061.09782 × 1061.08977 × 1066.08513 × 1074.84006 × 1074.33625 × 1070
Table 4. Heat transfer coefficients (Watt/m2 K) used in Aspen PLUS at conditions of an experiment of 30 °C, flow rates 53 mL/min, and at a bed height of 0.5 m.
Heat Transfer Coefficients for Liquid (Watt/m2 K)Heat Transfer Coefficients for Vapor (Watt/m2 K)
4512.39948.685
Table 5. The composition of soybean oil [27].
AcidsSoybean Oil
Palmitic acid (16:0)9%
Steric acid (18:0)4.4%
Oleic acid (18:1)26.4%
Linoleic acid (18:2)51.6%
Linolenic acid (18:3) 6.8%
Table 6. MAPE between the values calculated using the models (rate-based (RB) and equilibrium-stage (EQ)) and those obtained from empirical measurement at a bed height of 0.5 m.
MAPE at Flow Rates of 53 mL/min, and Bed Height of 0.5 m
BenzeneTolueneEthylbenzene
Temperatures °CRBEQRBEQRBEQ
30 °C1.0%6.7%0.1%4.2%1.9%1.9%
40 °C2.4%8.7%0.1%5.5%1.6%3.0%
50 °C6.2%4.3%1.0%6.3%1.6%3.8%
MAPE at flow rates of 63 mL/min, and bed height of 0.5 m
Temperatures °CRBEQRBEQRBEQ
30 °C0.7%4.7%0.2%3.0%1.6%1.3%
40 °C1.3%7.1%0.1%4.1%1.5%2.0%
50 °C2.9%14.6%2.5%8.3%0.2%4.6%
MAPE at flow rates of 73 mL/min, and bed height of 0.5m
Temperatures °CRBEQRBEQRBEQ
30 °C0.1%4.2%0.9%3.4%1.0%1.3%
40 °C2.0%8.4%1.0%4.3%1.1%1.8%
50 °C1.4%11.1%1.5 56.0%0.0%3.5%
Table 7. MAPE between the values calculated using the models (RB and EQ) and those obtained from empirical measurement at a bed height of 0.8 m.
MAPE at Flow Rates of 53 mL/min, and Bed Height of 0.8 m
BenzeneTolueneEthylbenzene
Temperatures °CRBEQRBEQRBEQ
30 °C0.9%1.8%2.9%3.8%1.2%2.0%
40 °C1.5%3.9%3.5%5.0%2.0%3.1%
50 °C6.3%0.8%3.5%6.2%2.8%4.3%
MAPE at flow rates of 63 mL/min, and bed height of 0.8 m
Temperatures °CRBEQRBEQRBEQ
30 °C0.4%1.1%2.4%3.0%0.8%1.3%
40 °C1.0%4.5%3.1%4.1%2.1%2.9%
50 °C1.4%4.4%6.6%8.3%2.8%3.8%
MAPE at flow rates of 73 mL/min, and bed height of 0.8 m
Temperatures °CRBEQRBEQRBEQ
30 °C0.9%1.8%3.4%3.8%1.7%2.0%
40 °C3.5%5.8%4.9%5.6%2.6%3.1%
50 °C1.3%5.9%4.5%5.6%3.1%3.8%
Table 8. MAPE between the values calculated using the models (RB and EQ) and those obtained from empirical measurement at a bed height of 1.1 m.
MAPE at Flow Rates of 53 mL/min, and a 0.5 Bed Height of 1.1 m
BenzeneTolueneEthylbenzene
Temperatures °CRBEQRBEQRBEQ
30 °C0.0%1.0%3.0%3.2%1.3%1.4%
40 °C1.4%1.3%3.3%3.7%1.5%1.7%
50 °C5.5%2.6%5.1%6.0%4.2%4.6%
MAPE at flow rates of 63 mL/min, and bed height of 1.1 m
Temperatures °CRBEQRBEQRBEQ
30 °C0.7%1.1%3.4%3.5%2.1%2.1%
40 °C1.8%3.2%4.7%4.9%2.7%2.9%
50 °C0.9%2.2%5.9%6.4%4.6%4.8%
MAPE at flow rates of 73 mL/min, and bed height of 1.1 m
Temperatures °CRBEQRBEQRBEQ
30 °C1.4%1.6%4.0%4.1%2.1%2.1%
40 °C2.3%3.1%4.9%5.0%3.2%3.3%
50 °C0.5%1.7%3.8%4.1%2.2%2.4%

