Article

Dynamic Range Compression and the Semantic Descriptor Aggressive

Centre for Audio and Psychoacoustic Engineering, School of Computing and Engineering, University of Huddersfield, Huddersfield HD1 3DH, UK
Appl. Sci. 2020, 10(7), 2350; https://doi.org/10.3390/app10072350
Submission received: 29 January 2020 / Revised: 5 March 2020 / Accepted: 12 March 2020 / Published: 30 March 2020
(This article belongs to the Special Issue Musical Instruments: Acoustics and Vibration)

Abstract

:

Featured Application

The current study will be of interest to designers of professional audio software and hardware devices as it will allow them to design their tools to increase or diminish the sonic character discussed in the paper. In addition, it will benefit professional audio engineers due to its potential to speed up their workflow.

Abstract

In popular music productions, the lead vocal is often the main focus of the mix and engineers will work to impart creative colouration onto this source. This paper conducts listening experiments to test if there is a correlation between perceived distortion and the descriptor “aggressive”, which is often used to describe the sonic signature of Universal Audio 1176, a much-used dynamic range compressor in professional music production. The results from this study show compression settings that impart audible distortion are perceived as aggressive by the listener, and there is a strong correlation between the subjective listener scores for distorted and aggressive. Additionally, it was shown there is a strong correlation between compression settings rated with high aggressive scores and the audio feature roughness.

1. Introduction

1.1. Background

In addition to general dynamic range control, it is common for music producers to use dynamic range compression (DRC) for colouration and non-linear signal processing techniques, specifically to impart distortion onto program material. Scholarly work has researched DRC use and has shown the industry has developed standard practices which mix engineers implement in their work [1,2]. One such standard is the use of Universal Audio 1176 (and, under its original name, Urei 1176) as a vocal compressor, particularly when processing vocals in popular music mixes where a specific character or distortion is desirable [3]. Users describe the sound quality of vocals processed in this manner with a number of subjective descriptors. This article investigates one common descriptor, “aggressive” to determine what it means at an objective level and answer empirically how an aggressive sound quality can be achieved when using the Universal Audio 1176 (abbreviated to simply 1176) and, more broadly, DRC in vocal productions. The findings will be of use to developers of software and hardware compressors, intelligent mixing algorithms [4,5] and industry professionals, as the novel results have the potential to change and speed up their workflow. More broadly, the work carried out in this article fills a gap in the research, as little work has been done to get a better understanding of the perceptual effects of dynamic range compression during the mixing stage of music production. Some findings reported in this article were originally presented at an Audio Engineering Society conference [6].
The literature relating to compression in music production has focused mainly on the effects of hyper-compression, often concentrating on whether its artefacts are detrimental to the perceived quality of audio material [7,8,9]. Taylor and Martens [10] claim that achieving loudness is a significant motivation for using compression, particularly in mastering, so one can argue that this is why hyper-compression is well researched.
Ronan et al. [11] investigated the audibility of compression artefacts among professional mastering engineers. For the study, twenty mastering engineers undertook an ABX listening experiment to determine whether they could detect artefacts created by limiting. Two songs were processed using the Massey L2007 digital limiter to achieve −4 dB, −8 dB and −12 dB of gain reduction. The masters (including the uncompressed versions) were then presented to the listeners using the ABX method. The results showed that the mastering engineers found it challenging to discern differences between a number of the audio tracks, particularly those with −8 dB of gain reduction and the unprocessed reference. The same experiment carried out by Ronan et al. [12] used untrained listeners and showed that they were unable to detect up to 12 dB of limiting.
Campbell et al. [13] had participants rate mixes with compression, which had been introduced at various points in the signal chain, namely on discrete tracks, subgroups and the master stereo buss. Their results showed that listeners preferred mixes where compression had been applied to individual tracks rather than to groups or on the stereo buss. However, their test used identical attack and release settings on all stimuli and made use of the same compressor (Pro Tools Compressor/Limiter), which may have played a role in the results. Adjusting the compressor settings so they were more appropriate for mix buss processing, and using a compressor with a suitable character for buss processing could have yielded a different outcome.
Wendl and Lee [14] looked into the effect of perceived loudness when using compression on pink noise split into octave bands. For this study, the authors wanted to observe if playback level and crest factor (a measurement of peak to RMS) affected perceived loudness after varying amounts of limiting had been applied. The results showed that there was a non-linear relationship between the octave bands and changes to the crest factor. Of interest to professionals is the result which shows that modifications to the crest factor in a band centered around 125 Hz does not correlate with perceived loudness at moderate playback levels. Moreover, the perceived loudness could be louder than one might expect. The authors recommended that music engineers should be cautious of compression activities that affect the low end.
Some noteworthy work was conducted by Ronan et al. [15] which sits outside of the hyper compression studies reviewed so far. The authors of this paper investigated the lexicon of words used to describe analogue compression. Ronan et al. conducted a discourse analysis on 51 reviews of analogue mastering compressors to look for common terms used in the texts and created inductive categories to group the words. The categories they created included signal distortion, transient shaping, special dimensions and glue. A qualitative investigation of a similar nature was carried out for the current study, and the results are presented in Chapter 3. Interestingly, a number of the descriptors gathered by both studies are similar, but aggressive was not included in the work by Ronan et al., suggesting that this descriptor is not commonly used to describe the sound of mastering compression.
Other connected work has been carried out by scholars involved with the Semantic Audio Labs and the Semantic Audio Feature Extraction (SAFE) project. SAFE aims to understand the audio features associated with semantic descriptors, which can then be used to create intelligent mixing tools. Stables et al. [16], investigated terms used to describe signal processing on the mix and conducted hierarchical clustering to look for similarities in the terms. The authors presented dendrograms relating to the signal processing techniques, compression, distortion, equalization and reverb. The word aggressive was not included in any dendrogram and, surprisingly, not in the distortion group. The authors do not stipulate which sources the signal processing techniques were applied to. So, the influence of source on the descriptor is not apparent, which is important to consider and will have played a role in the results. Hence, the current study focuses solely on vocal compression.
Bromham et al. [17] looked into compression ballistics (attack and release settings) and how they affected the perception of music mixes in four styles: Rock, Jazz, HipHop and Electronic Dance Music. They asked participants to rate which ballistic setting was the most appropriate for a genre and to select from a list of given words to describe the sound quality of their preferred setting. They discovered that attack played a more significant role on appropriateness than release, with the result applying most strongly to Jazz and Rock. It should be noted that this study made use of a Solid State Logic (SSL) bus compression emulation, which has a much slower attack time than the 1176 compressor used in the current study.
Not directly related to compression, but in the domain of semantic music production, is the work by Fenton and Lee [18], which aims to develop a perceptual model to measure “punch” in music productions. As noted by Fenton and Lee, punch is an attribute that is used by music listeners to describe a sense of power and weight in audio material. Their work uncovered that punch is related to “a short period of significant change in power in a piece of music or performance” as well as dynamic changes to particular frequency bands in the program material. The authors of the work went on to develop a perceptual model of punch for use in a real-time punch meter. The author of the current study advocates the creation of similar meters to measure other perceptual attributes, such as the one in this study, which can be integrated into modern digital audio workstations (DAWS) for use in music production activities.
As can be seen, apart from a small body of work, that there is a gap in the literature relating to the positive effects of compression, particularly during the mixing process. Work by Dewey and Wakefield [19] has shown that compression is one of the most used mixing tools and the present author’s experience as a music production academic and professional suggests that audio engineers and scholars are interested in the character of compression. Therefore, the lack of work in this area is surprising.

1.2. Research Aims

Thus, the work in the current study aims to address several pertinent research questions relating to the use of compression during mixing and the semantic nature of its sonic signature. The following research questions are addressed in this article. Firstly, how do professionals describe the sonic signature of the 1176 compressor when processing a range of sources, but most specifically vocals? Secondly, and derived from the results of the first question, what does the subjective descriptor aggressive mean at an objective level?
To answer these questions, three studies were carried out. Initially, a qualitative study was conducted that asked several experienced users to describe the sound quality of the 1176 when compressing a range of audio sources. Based on their responses, they were then asked to rate the appropriateness of commonly used descriptors in a similarity matrix. The results suggested the descriptor aggressive was a synonym for distortion. Thus, the second stage of testing conducted a subjective listening test using the Audio Perceptual Evaluation (APE) method from the Web Audio Evaluation Tool (WAET) [20]. This tested whether listeners rated mixes with vocals compressed by 1176 hardware and using settings measured to have larger amounts of Total Harmonic Distortion (THD) as the most aggressive. Finally, a subsequent listening test was carried out to ascertain whether distortion, timing behaviour or a mixture of both were the most important factors in creating compressed audio perceived to be aggressive. The reason for this test was due to the 1176′s reputation as a fast-acting compressor (particularly when working with time constant settings, which will be addressed in Section 4). Therefore, it could be that argued its fast timing creates the aggressive sonic signature, rather than distortion. This was examined in the second listening experiment, which had vocals processed with a clean software compressor (measured with 0% THD) and set to mimic the timing behaviour of the 1176 as well as material compressed with 1176 hardware and measured to have 1.58% THD. The Klanghelm DC8C software compressor [21] was used for this test as it allows user control over a range of design traits that can be used to match the behaviour of several compressors. Most importantly, when used in its clean mode, it does not generate any distortion, even at the fastest time constants.

2. Qualitative Studies

2.1. Professional User Questionaire

An online questionnaire was created using the survey tool Qualtrics [22], which asked experts to describe the sound quality of the 1176 when compressing vocals, drum shells (bass and snare drums), room mics (ambient recordings of the drums in a room) and a bass guitar. Judgement sampling (as opposed to random sampling) was used to select experienced engineers and academics to complete the questionnaire. For an expert to be included they had to be knowledgeable in music production and familiar with the 1176. Judgement sampling does, however, have its limitations and is prone to bias [23]. Thirty-five respondents completed the questionnaire.
The results in Table 1 presents the ten most frequently used descriptors to describe the sound quality of the 1176 compressor for all four sound sources. Aggressive is the most popular word and is investigated in the current study. The other descriptors are likely to refer to amplitude modulation effects (pumping), transient reshaping (punch), colouration (forward, full, midrange and presence) and distortion (dirty and gritty). One would expect fast to be a description of the time constant speed, and not necessarily a description of sound quality.
Table 2 shows the most common words used to describe the sound quality of the 1176 when compressing a vocal, which is the main focus of this article. To reduce the number of words in the table, only those recorded more than once have been included. As can be seen, the descriptor aggressive is, again, the most popular, followed by the word gritty, which, as stated previously, is arguably a synonym for distorted. Other descriptors appear to refer to coluration (forward, midrange, presence, full, upfront and sparkly), amplitude modulation (pumping) and potentially the perceptual effect of the attack and release curve (smooth).

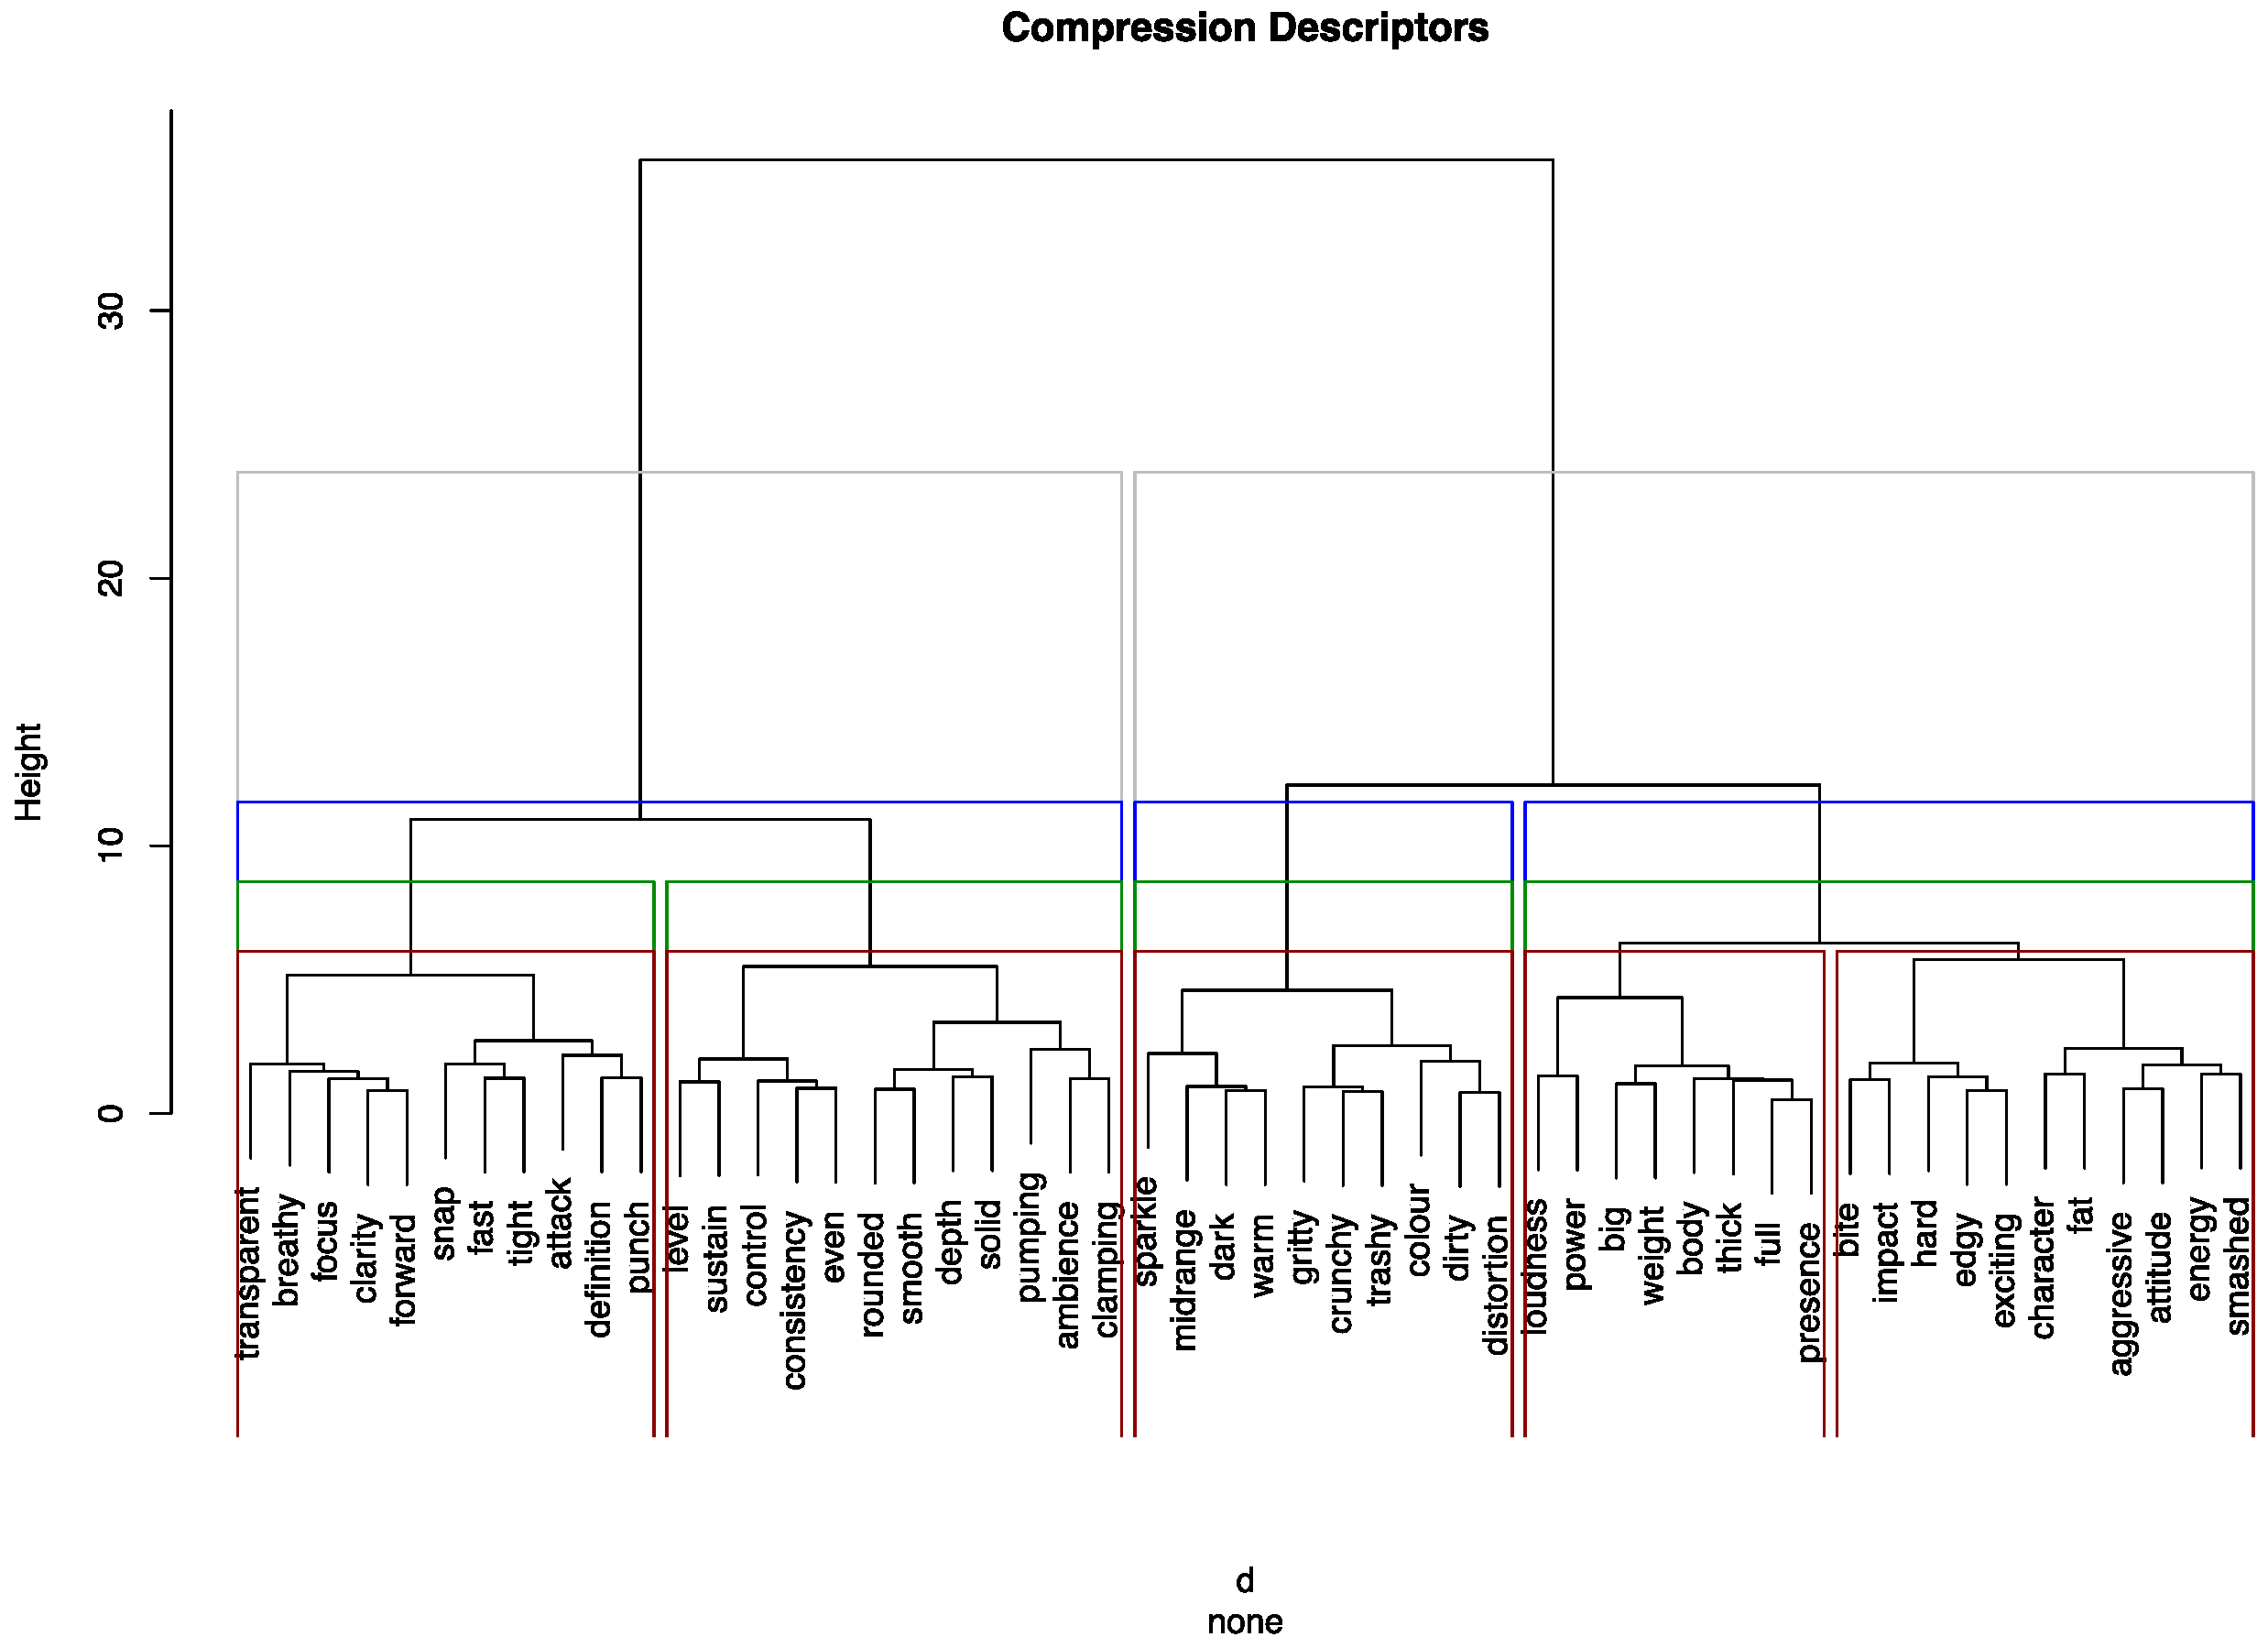
2.2. Similarity Matrix

To help clarify the meaning of the descriptors, a second stage asked respondents to rate the appropriateness of the most popular descriptors in describing the sound quality of a given compression technique. The compression techniques were: linear processing, colouration general, colouration frequency related, distortion, modulation/altering rhythmic feel, general dynamic range control, attenuating transient and accentuating transient. The author selected these techniques based on prior research [24] which indicated these practices were commonly used by industry professionals when applying dynamic range compression. Respondents completed the task online and recorded their scores on a similarity matrix. This was conducted by creating an online spreadsheet that had compression activities on the X-axis and descriptors on the Y-axis. Respondents then allocated each descriptor a score between zero and four to rate its appropriateness (zero being totally inappropriate and four being totally appropriate). As a descriptor could relate to more than one compression technique, the respondents were instructed to rate the descriptor for as many techniques as they felt appropriate. The use of similarity matrices to look for associations between audio descriptors has been used in several previous studies [25,26,27,28].
The similarity matrix was completed by twelve experts, all of which had participated in the previous stage. The results were averaged to take the mean score for each descriptor and clustering was conducted using the Euclidean distance and Ward methods. The statistical software R was used to generate the dendrogram shown in Figure 1. As shown in the dendrogram, there are several subsets, illustrated in brown, green, blue and grey. Inspection of the grey subset highlights descriptors which appear to fall into two main categories, one relating to dynamics and the other pertaining to colouration and distortion (linear and non-linear distortion). Looking at a lower branch in the dendrogram highlights that aggressive is grouped with, among other words, attitude, energy and smashed. All of these words are subjective and have not been defined in any of the previous literature. Moreover, one could argue these descriptors relate to the character of the compressor and are potentially multi-dimensional attributes. Referring back to the descriptors used in Table 1, this shows that contentions made previously regarding the meaning of these words are generally correct. As an example, the terms dirt and gritty are connected to distortion in the brown subset. Pumping is connected to ambience (which is understandable as compression-related amplitude modulation often manifests as quick changes in the amplitude of the ambience present in the program material). Finally, punch is connected to definition and also attack, which would support the notion that this descriptor is related to the manipulation of transient shapes.
To get a better understanding of the descriptor aggressive, the focus of this study, statistical analysis was conducted on the mean scores allocated by the respondents to the compression techniques in relation to the term aggressive. The results show that there was a statistically significant difference between groups (compression techniques), as determined by one-way ANOVA (F (7,88) = 3.854, p = 0.001). A Tukey post-hoc test revealed that the experts considered the descriptor aggressive was statistically significantly lower for the compression techniques “general dynamic range control” (p = 0.027), “modulation” (p = 0.002) and “linear processing” (p = 0.001) compared to the compression technique “distortion”. There was no statistically significant difference between the descriptor aggressive score for the compression techniques “colouration general” (p = 0.229), “colouration frequency related” (p = 0.171), “attenuating transient” (p = 0.088) and “accentuating transient” (p = 0.124) compared to the compression technique “distortion”. The reason for the lack of significance between these techniques is thought to be as a result of distortion reshaping the transient portion of the audio material (particularly true for attenuating the transient) and the introduction of harmonic components, which leads to colouration. Therefore, it appears that, from this study, engineers consider the descriptor aggressive to relate to compression techniques that distort and colour the audio and, to a lesser extent, reshape the transient portion of the program material.

3. Preliminary Objective Tests

3.1. Choice of Compressor Time Constant Settings

In preparation for perceptual listening experiments, work was conducted to ascertain appropriate time constant settings for use in the experiments. The 1176 has continuously variable attack and release controls. Thus, a large amount of possible combinations are available. However, it would not be practical to use all of these in listening experiments as a large number of stimuli is known to cause listener fatigue [29]. Thus, content analysis [30] was conducted on 1176 vocal compression settings, created by professional engineers for the 1176 UAD plugin. This work was conducted to discover the most popular settings, which could then be used in the creation of stimuli for the listening experiments. The results revealed that specific combinations of attack and release settings were regularly used, with release positions between five and seven and attack positions between one and three being most common. Additionally, it was noted that the 4:1 ratio was often implemented for general vocal settings and the all-buttons mode (a popular “special mode” achieved by depressing all ratio buttons simultaneously) was employed for highly coloured processing. Table 3 shows how frequently particular settings are used in the vocal presets. The bottom two rows of the table show that positions between one and four are most common for attack and positions between five and seven most common for release. Anecdotal evidence by the author supports this result as they have observed many professional audio engineers setting the 1176 compressor with these time constant settings.
Based on these findings, the following attack and release combinations were used in the following listening experiment (attack is abbreviated to A and release is abbreviated to R): A3R7, A1R7, A3R5, A1R5. The combinations were used in both the 4:1 and all-buttons ratio modes. More general research of content on the 1176 [31] showed the A3R7 combination to be a popular setting for a range of instrument sources. Therefore, the settings used in the experiment are considered by the author to be representative of real working scenarios. It is also worth bearing in mind the attack control on the 1176 is quoted as ranging between 20–800 microseconds and critical listening by the author revealed very little difference in sound quality between any attack time between positions one and four. Additionally, the reader should consider that the attack and release controls on the 1176 work counterclockwise, meaning attack and release position seven is the fastest and one the slowest.

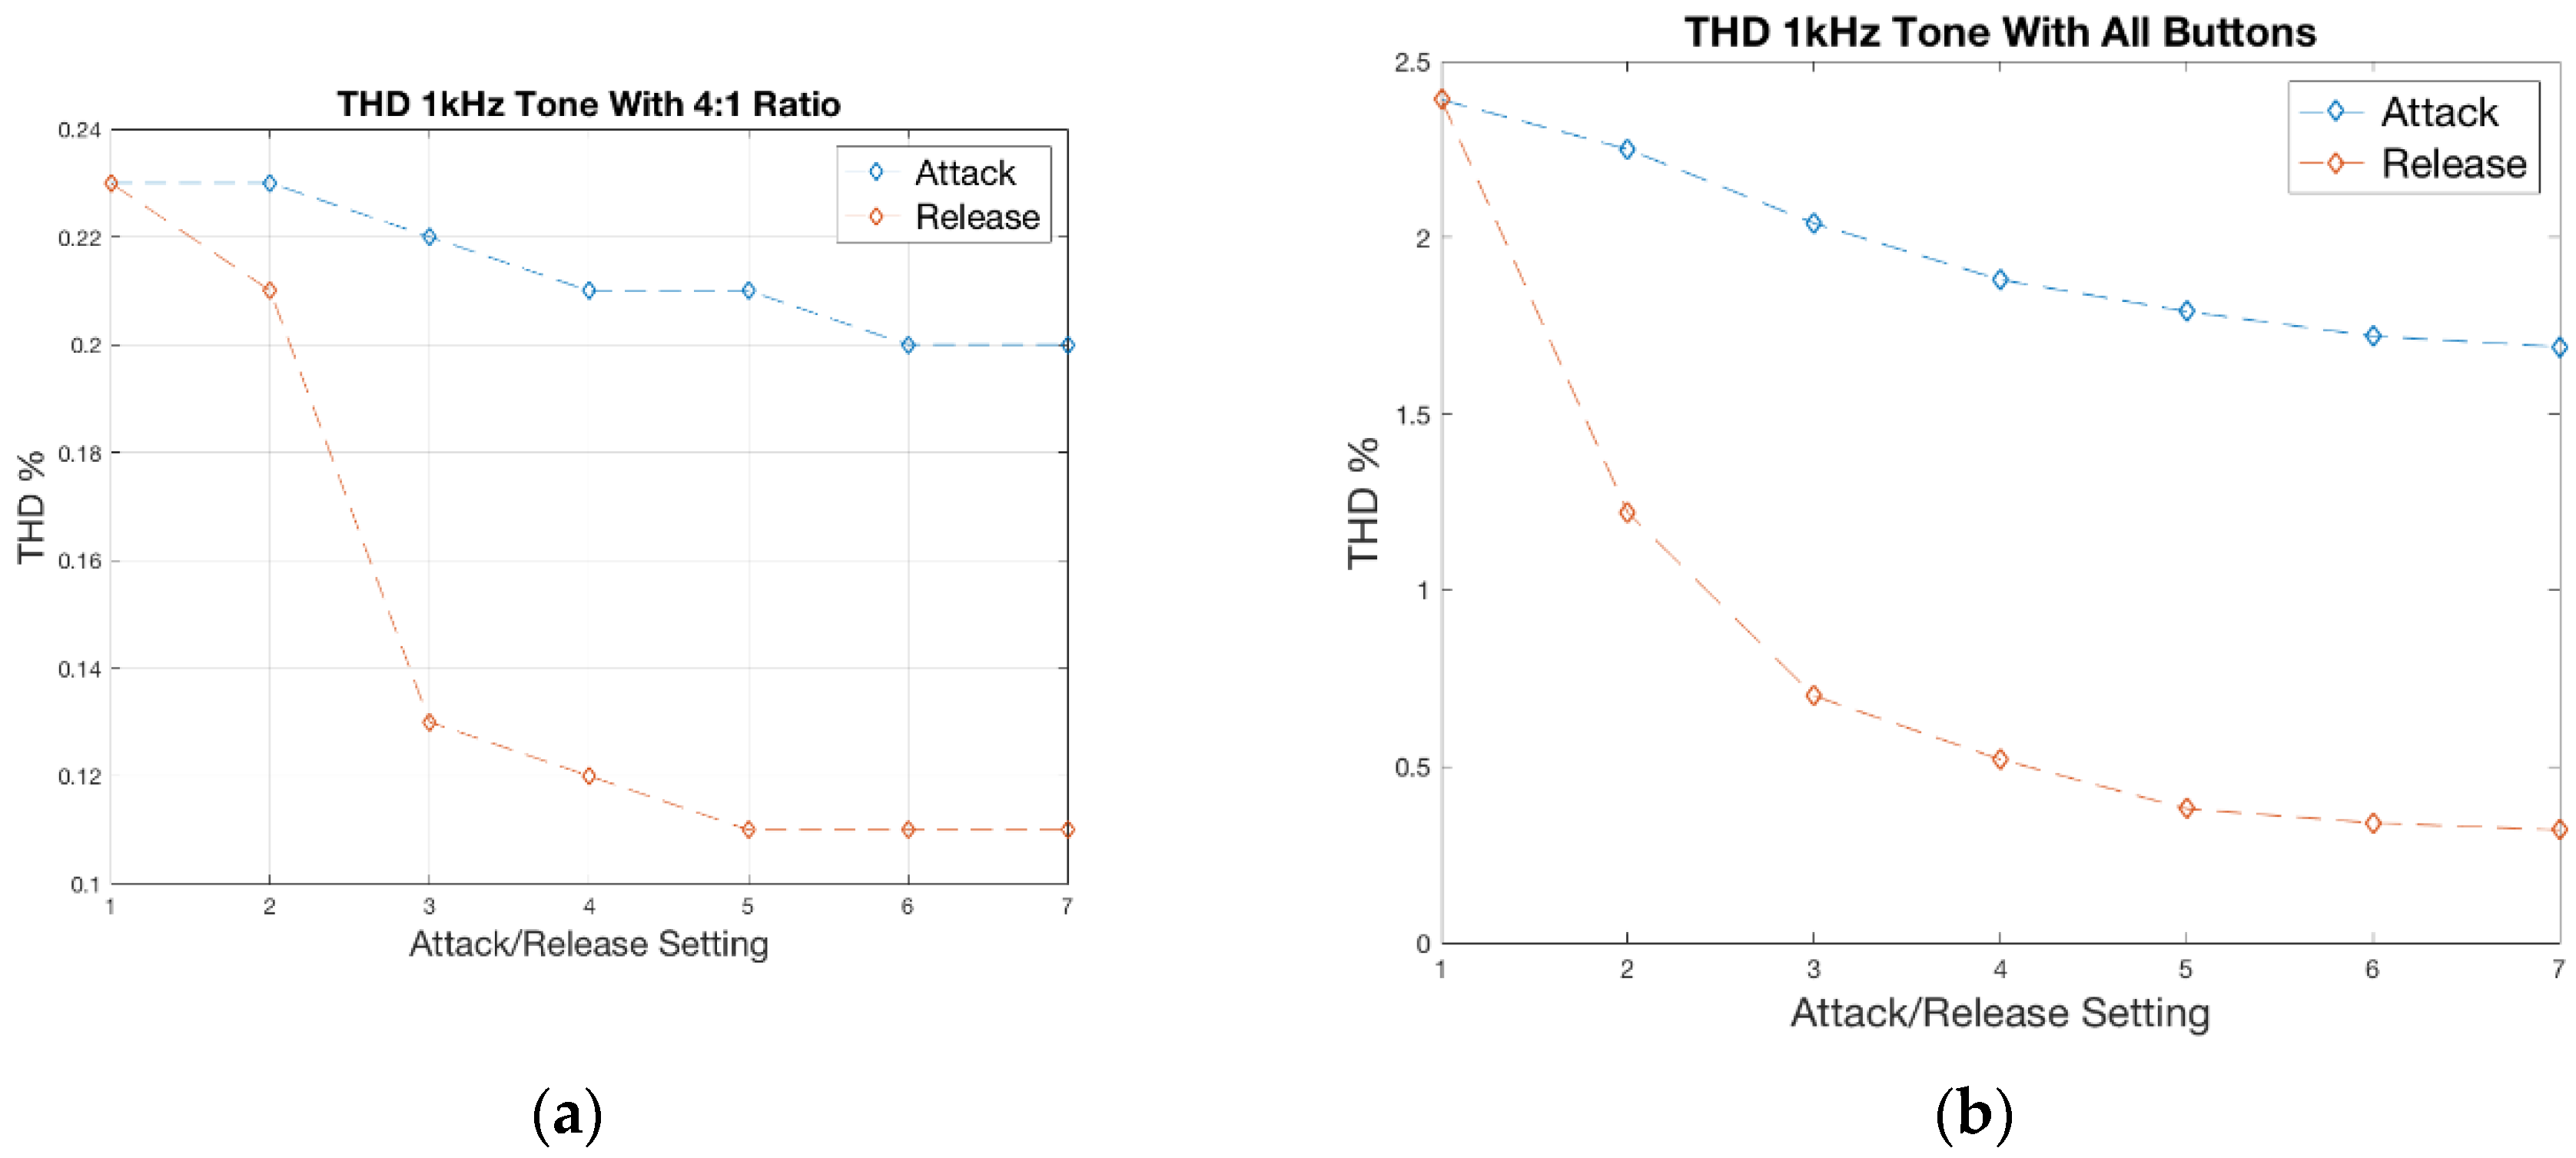
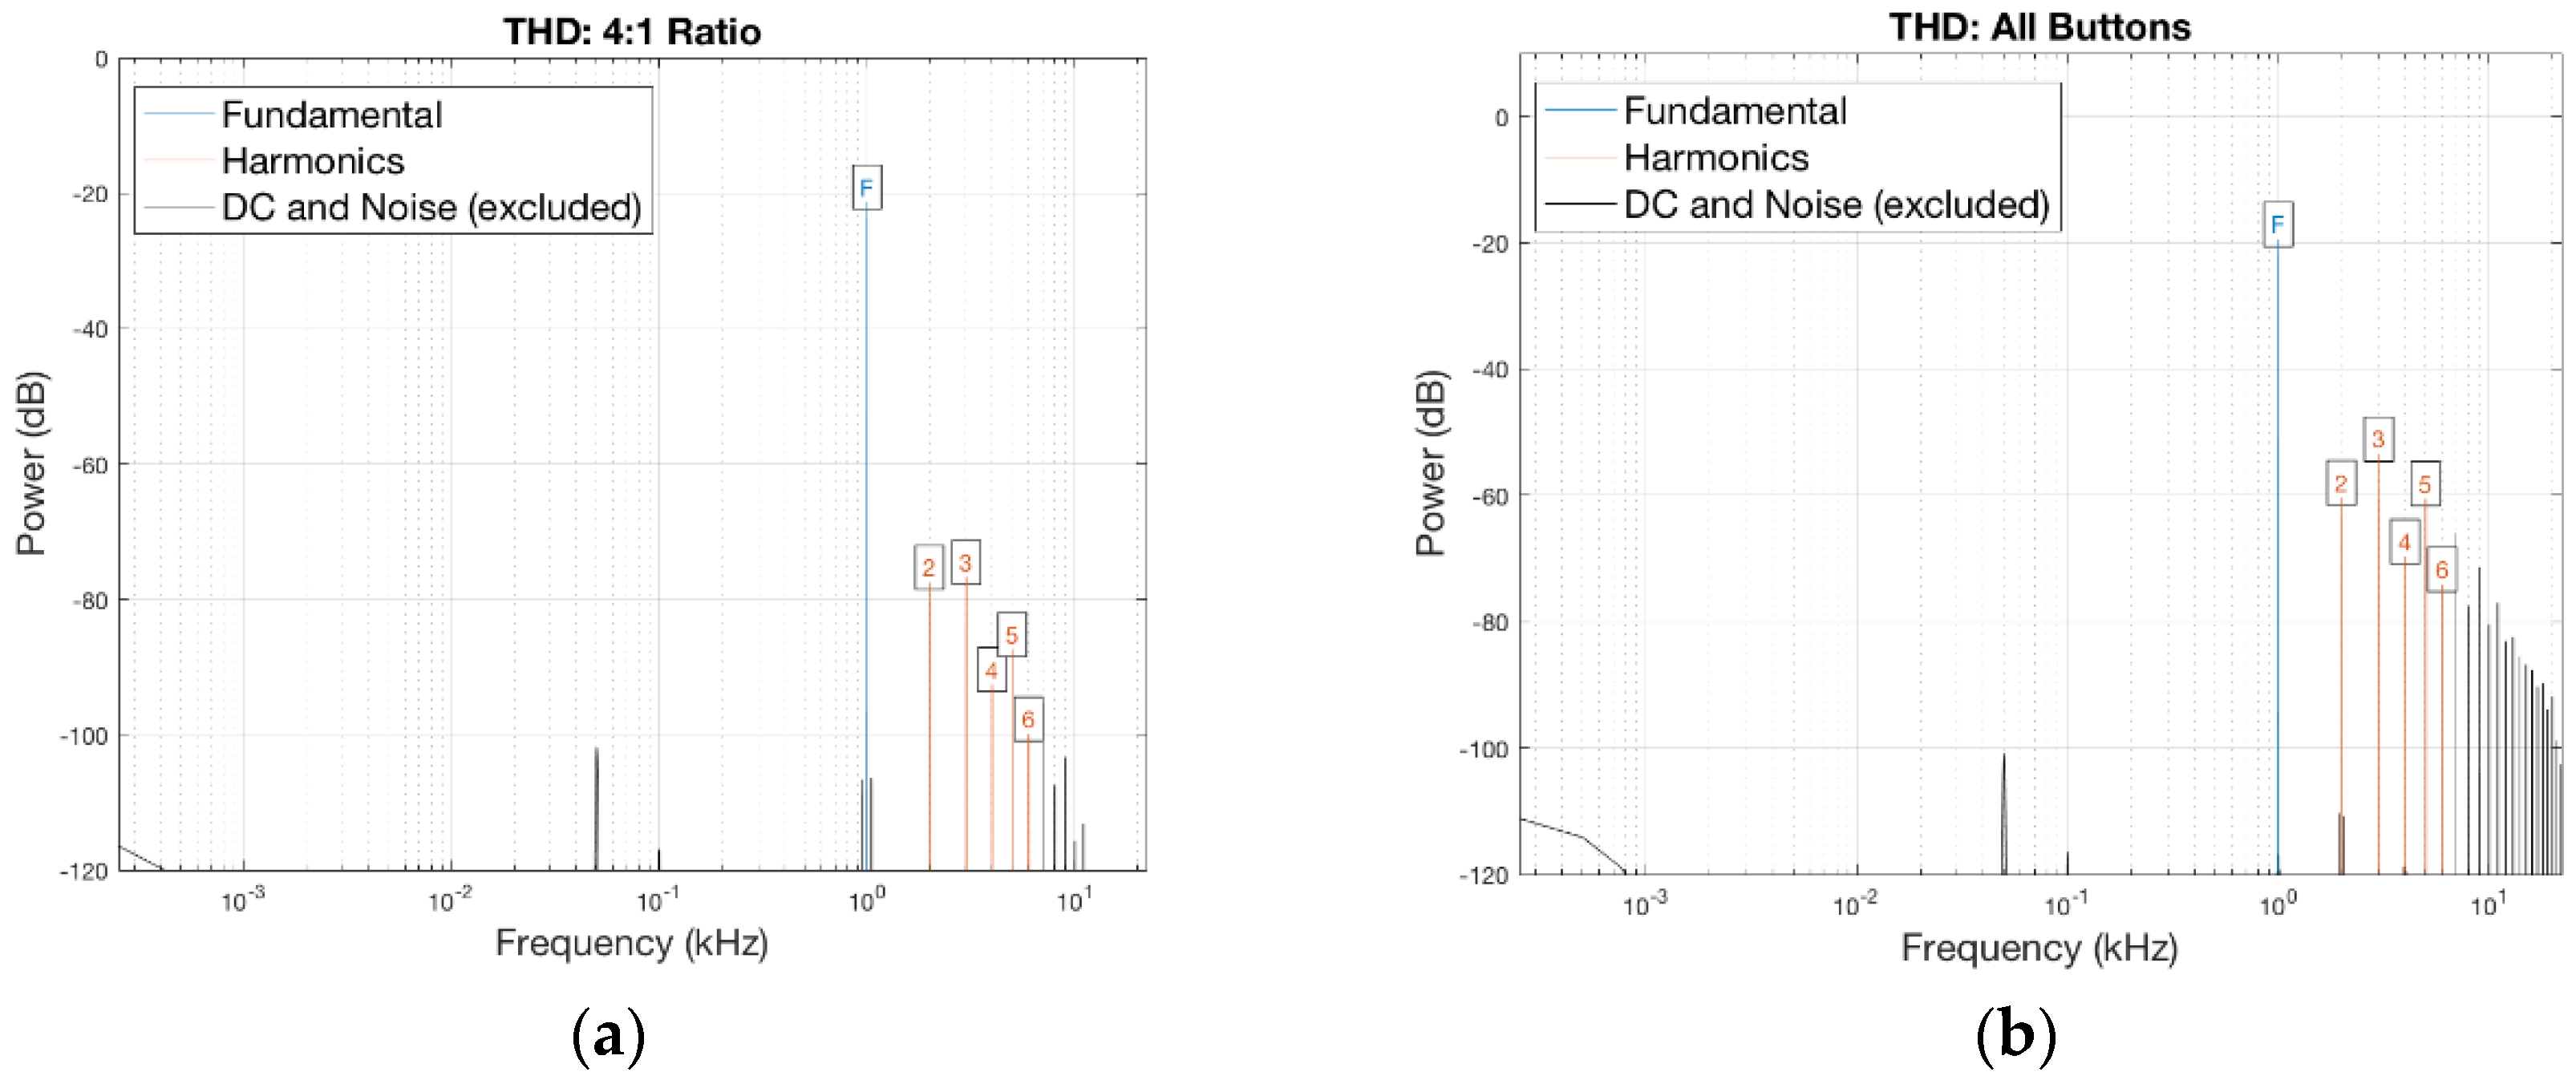
3.2. Distortion Characteristics

A series of total harmonic distortion (THD) measurements were made on the 1176 at various attack and release configurations to observe how time constant settings affected the distortion characteristics of the compressor. The measurements for release were made by keeping the attack time fixed at its fastest setting, seven, and making a measurement at each release position. The measurements for attack were made by restricting the release time to its quickest setting, seven, and making measurements at each attack position. During testing, the compressor was adjusted to achieve −10 dB of gain reduction and a 1 kHz test tone was used as the input signal. The output of the compressor was recorded on a Digital Audio Workstation (DAW) at 24 bit/44.1 kHz. The results showed distortion artefacts reduced significantly when using release times slower than position five and that the attack control had a smaller effect on the reduction of distortion. Furthermore, higher ratios had the effect of increasing non-linearity, with the all-buttons mode increasing non-linearity significantly more than any other ratio. Plot (a) in Figure 2 illustrates the effect of lengthening the attack and release time on THD. As can be seen, there is a sharp drop off in THD up to release position five and a small reduction in THD with attack times slower than position seven. Plot (b) in Figure 2 shows the same measurements made in all-buttons, which is a so-called “special” ratio mode afforded by the 1176 compressor. Although not originally intended for use, it was found by music producers that depressing all the ratio buttons simultaneously produced intriguing sonic behaviour by the compressor. In actual terms, the FET’s bias is set outside of calibration, resulting in a significant increase in distortion. Note the much larger amount of THD in this setting, but similar drop off in amount as the release and attack speeds are reduced.
Figure 3a,b are plots created using Matlab’s THD function. They represent an FFT display which illustrates the nature of the harmonic distortion. To create the plots, a 1 kHz tone was input to the compressor to achieve −10 dB of gain reduction, with the time constants set for attack at three and release at seven. The output of the compressor using a 4:1 ratio and the all-buttons mode was then recorded into a DAW at 22 bit/44.1 kHz. The figures make clear the differences in distortion characteristics between the 4:1 ratio and the all-buttons mode. As one might expect, the distortion components are integers of the 1 kHz test tone and consist of a mixture of odd and even order harmonics. In Figure 3b, it is worth noting the significant increase in the amplitude of all components and also an increase in higher-level harmonics. Critical listening to an audio example of the compressed test tone reveals the all-buttons mode is highly distorted with increased brightness as a result of the additional high-level and high-order distortion components.
The attack and release settings, which were shown to be commonly used in Table 3, are the settings that generate the most distortion. Thus, it appears that professional mix engineers are, perhaps albeit unbeknown to themselves, actively seeking out distortion from the 1176 in their workflow. Therefore, the aggressive sound quality once again appears to pertain to distortion. However, additional perceptual testing was required to substantiate this hypothesis. THD measurements made on the settings used in Listening Experiment 1 can be seen in Table 4, where the effect that both the attack and release and the all-buttons mode have on non-linearity can be observed.

4. Perceptual Listening Experiments

4.1. Listening Experiment 1 Method

To test the hypothesis, a subjective listening test was devised using the Web Audio Evaluation Tool (WEAT), which made use of the Audio Perceptual Evaluation (APE) method. Stimuli were created by processing the vocal from two separate rock songs with, 1176 hardware, using the attack/release combinations mentioned previously. To restrict the number of stimuli, the amount of compression was limited to one setting, which was −10 dB of gain reduction. Ciletti et al. note that to best assess the sonic signature of a compressor, it is advisable to use the device in a heavy state of compression [32]. The amount of gain reduction was measured to show an average of −10 VU on the gain reduction meter. The compressed vocals were then mixed back into the audio tracks, which were level matched to −23 LUFS. In addition, a mix making use of the uncompressed vocal was used to create a total of nine stimuli per song. All audio was recorded and processed at 24 bit/44.1 kHz.
Listeners were presented the stimuli on four separate screens of the listening test (two per song), where they were asked to rate the amount of perceived distortion on two screens and the amount of perceived aggression on the remainder. Scales on the interfaces were labelled from least distorted to most distorted and least aggressive to most aggressive and were measured on a scale from zero to one. Participants were not instructed explicitly what aggressive meant, as the author wished to avoid training the listeners with their interpretation of the descriptor. The order of the audio and screens were randomized to prevent bias, and the test was carried out by 17 expert listeners in a university music laboratory environment using Sennhiesier HD650 headphones on iMac computers. The sample size was considered to be appropriate for a test of this nature and is commensurate with ITU recommendations [33].

4.1.1. Listening Experiment 1 Results and Discussion

The results from the listening test can be seen in Figure 4, where (a) shows the mean result for the descriptor aggressive with a 95% confidence interval for both songs and all time constant settings tested. As can be seen, there is little difference between the time constant settings for both the ratios tested, but there is a difference between the uncompressed material, the 4:1 ratio and the all-buttons mode. It is worth noting that the two all-buttons modes that measured highest for THD (see Table 3 for THD results) are not rated any higher than the other two all-buttons settings. An inspection of the FFT plots suggests this is a result of the even-order harmonics remaining at fairly consistent levels across the four settings, while the odd-order harmonics are attenuated as attack and release are slowed. This results in a lower THD measurement, which evidently does not result in a perceptually less aggressive sonic signature. It should be noted that many of the participants reported that the difference between some of the stimuli was small, and they found the test to be challenging. Therefore, the effect of listener fatigue should be kept in mind. The ratings for distortion are illustrated in Figure 4b where a similar trend is visible. Once again, there is a difference between the ratios and the uncompressed material, but no difference between the different time constant settings for the two ratio settings. Thus, it appears that there is little perceptual difference between the time constant settings used in the current study, but the additional harmonic distortion created in the all-buttons mode is noticeable to the participants of the experiment.
Audio features pertaining to the noise-like properties of sound (Roughness and Zero Crossing Rate) were extracted from the vocal tracks using MIRtoolbox for Matlab [34] and are presented in Table 5. The results for roughness show that the feature increases in value between the uncompressed audio and both ratio settings, and also between 4:1 and all-buttons mode. Within the time constant settings for each ratio, the results with the release time set to seven are the highest and this is largely comparable with the THD results shown in Table 4. However, the A1R7 combination for both ratio settings has slightly larger roughness values than the A3R7 combination, while the THD results highlight the A3R7 combination as having the largest amount of THD. The similarity in results within the ratio settings for roughness may be another reason why listeners rated the time constant settings comparably, despite the variation in THD. The values for zero crossing rate (ZCR) are less revealing, with no clear pattern in the results emerging, apart from an increase in ZCR when using compression.

4.1.2. Statistical Analysis of Experiment 1 Results

A two-way repeated measures ANOVA was run to determine the effect of compression settings and the interaction effect and compression settings of the two songs on perceived distortion. Mauchly’s test of sphericity indicated that the assumptions of sphericity had been violated for the two-way interaction between the song and settings χ2(2) = 73.13, p = 0.001. Therefore, a Greenhouse–Geisser correction was applied (ε = 0.580). Mauchly’s test of sphericity indicated that the assumptions of sphericity had not been violated for the effect of the settings χ2(2) = 48.45, p = 0.081.
Simple main effects were run and showed that there was no statistically significant two-way interaction between the songs and settings on perceived distortion., F (8,128) = 0.648, p = 0.653. There was, however, a statistically significant effect of the settings on perceived distortion, F (8,128) = 50.97, p < 0.001. Post-hoc analysis with a Bonferroni adjustment showed the mean distortion scores for the 4:1 and all-buttons settings were statistically significantly higher than the scores for no compression (p < 0.001). In addition, the mean distortion scores for the all-buttons settings were statistically significantly higher than the scores for the 4:1 ratio settings (p < 0.001). Within the four different time constant settings used for both 4:1 and all-buttons, there was no statistical significance.
A second two-way repeated measures ANOVA was run to determine the effect of the compression settings and the interaction and compression settings of the two songs on perceived aggression. Again, Mauchly’s test of sphericity indicated that the assumptions of sphericity had been violated for the two-way interaction between the song and settings χ2(2) = 53.99, p = 0.028; thus, a Greenhouse–Geisser correction was applied (ε = 0.531). Mauchly’s test of sphericity indicated that the assumptions of sphericity had not been violated for the effect of settings χ2(2) = 27.98, p = 0.081.
Simple main effects were run and showed that there was no statistically significant two-way interaction between the songs and settings on aggressive sound quality, F (8,128) = 0.301, p = 0.886. There was, however, a statistically significant effect of settings on aggressive sound quality, F (8,128) = 69.26, p < 0.001, suggesting that settings have a statistically significant effect on aggressive sound quality. Post-hoc analysis with a Bonferroni adjustment showed the same statistical significance between no compression and the two ratio settings as reported previously for distortion. Again, there was no statistical significance within the four different time constant settings used for either 4:1 or all-buttons, meaning that, in the current study, different time constant settings have no significant effect on the perception of distortion or an aggressive sound quality.
The mean scores for aggressive and distortion were analyzed to assess if there was a statistically significant correlation between the scores. Both variables (aggressive and distortion) for both songs were normally distributed, as assessed by a Shapiro–Wilk test (p > 0.05); thus, the variables were investigated for correlation. Pearson’s product–moment correlation was run to determine the relationship between perceived aggressive and distortion scores and the results show that there is a strong correlation between the mean scores for aggressive and distortion, which is statistically significant for song one (r = 0.960, n = 9, p = 0.001) and song two (r = 0.983, n = 9, p = 0.001). A scatter plot of the mean scores for aggressive and distortion for both songs is illustrated in Figure 5, where the correlation between the two can be clearly observed.
Correlation between the aggressive scores and the roughness features extracted from the vocal files was investigated by running Pearson’s product–moment correlation. The results show a strong correlation between roughness and aggressive, which is statistically significant for song one (r = 0.968, n = 9, p = 0.001) and song two (r = 0.962, n = 9, p = 0.001).

4.2. Listening Experiment 2 Method

The previous test demonstrated that vocals compressed with settings measured to have greater than or equal to 0.5% THD were rated as being the most aggressive. However, it could be argued the timing behavior of the 1176, particularly when working in all-buttons mode, plays a role in the result. Therefore, a second test was devised, which aimed to decouple distortion and timing behavior and answer whether distortion, timing behavior or a mixture of both were the key components in the creation of an aggressive sound quality. The experiment made use of the APE listening test interface and had participants rate the vocal tracks of three separate songs on the aggressive quality of the vocals. The two songs used in the previous experiment were utilized again, as well as a third new rock song, which was added to give the results more validity over a wider range of test scenarios. Participants were also asked to comment on the audio they were hearing using up to three descriptors.
During the previous experiment, it was found the time constant settings had no significant effect on an aggressive sound quality; therefore, the vocal tracks were compressed with the hardware 1176 using only the A3R7 time constant (which measured highest for THD) and in 4:1 and all-buttons ratio modes. In addition, the vocals were compressed with the Klanghelm DC8C software compressor, using settings that emulated the timing behaviour of the 1176 in both ratios, and set to measure 0% THD. The timing behaviour was emulated by feeding the hardware 1176 and the software compressor a tone burst and adjusting the parameters of the software compressor until the software closely resembled the timing curve of the 1176 in both settings (see previous work by the author where the tone burst method is used and discussed in detail [31]). While this method did not allow for the exact matching of the 1176′s timing curve, it did create very similar results. A more robust method could make use of a specifically designed software compressor algorithm that allows the experimenter to simply turn distortion on and off, but this would require close modelling of the 1176, which was beyond the scope of the current study. Finally, all audio used in Experiment 2 was recorded and processed at 24 bit/44.1 kHz.

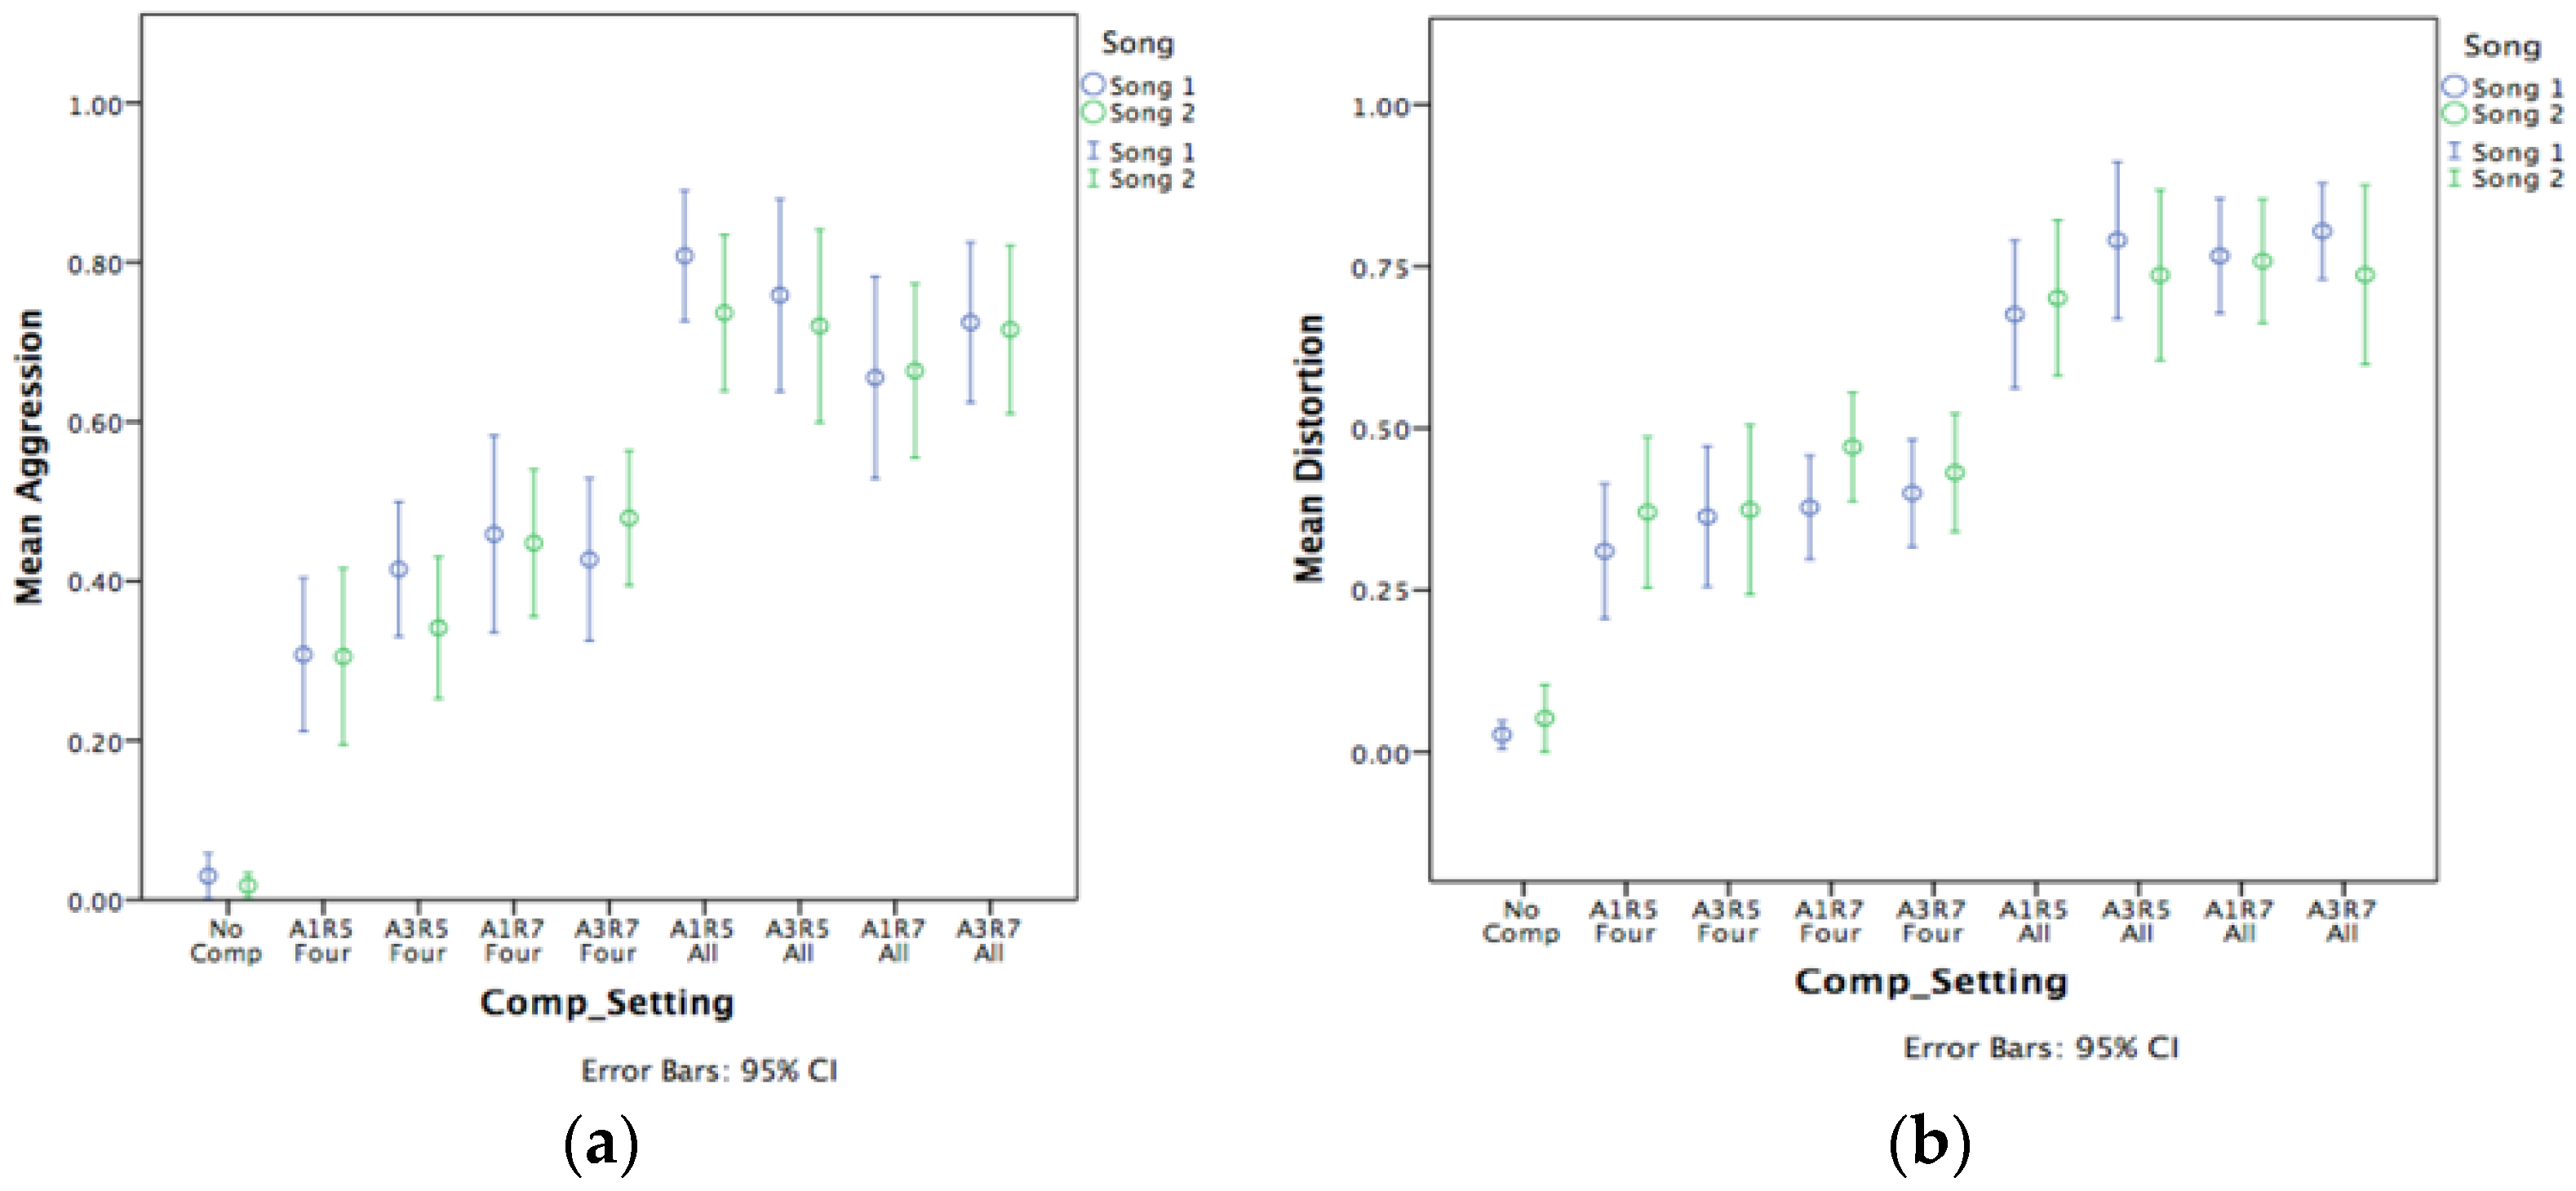
4.2.1. Listening Experiment 2 Results and Discussion

The results from the second listening experiment are depicted in Figure 6, which represents the mean result for the descriptor aggressive with a 95% confidence interval for all three songs and all time constant settings tested.
Looking at the plot, there is an overlap between the scores for SW 4:1 and SW All for songs one and three and an overlap between SW All and 1176 4:1 for song two. However, it is apparent the 1176 all-buttons setting has been rated as the most aggressive for all three songs and the clean software emulation measured to have 0% THD does not score as high as the 1176 all-buttons mode. Thus, the results suggest compression activities that generate audible distortion are needed for the most aggressive vocal sonic signatures.

4.2.2. Statistical Analysis of Experiment 2 Results

A two-way repeated measures ANOVA was run to determine the effect of compression settings measured to have or not have distortion and the interaction effect of the three songs and compression settings on an aggressive sound quality. Mauchly’s test of sphericity indicated that the assumptions of sphericity had been violated for the two-way interaction between the song and settings χ2(2) = 71.82, p = 0.001. Therefore, a Greenhouse–Geisser correction was applied (ε = 0.578). Mauchly’s test of sphericity indicated that the assumptions of sphericity had not been violated for the effect of the settings χ2(2) = 7.45, p = 0.593.
Simple main effects were run and showed, again, that there was no statistically significant two-way interaction between the songs and settings on aggressive sound quality F (8,136) = 0.208, p = 0.081. There was, however, a statistically significant effect of settings on an aggressive sound quality, F (4,68) = 181.722, p < 0.001, suggesting that the settings used have a statistically significant effect. Post-hoc analysis with a Bonferroni adjustment showed the mean aggressive scores for all compressed settings were statistically significantly higher than the scores for no compression (p < 0.001). The scores for both the 1176 settings were statistically different from one another (p < 0.001), but the scores for both the software settings were not statistically different (p = 0.57). This indicates that the faster timing behaviour of the SW All setting, which was emulating the timing curve of the 1176 in all-buttons, has little additional effect over the SW 4:1 setting in the creation of an aggressive vocal sonic signature. The scores for both the 1176 settings were statistically higher than the scores for both the software settings (p < 0.001). This indicates that while a clean, fast-acting compressor can give a vocal a more aggressive sound quality than the uncompressed audio, compression settings that impart audible distortion are required for the most significant effect.

4.2.3. Textural Analysis of Descriptors Used by the Participants

Participants of the second listening experiment were encouraged to write descriptors to describe the sound of the vocal in the stimuli they had heard. WAET allows the test designer to include text boxes in the listening test’s interface. Thus, participants recorded descriptors into these boxes during listening. A total of 88% of the participants noted descriptors and Figure 7 shows word frequency plots of the twenty most frequently used descriptors for each compressor.
The word distorted is the most frequently used descriptor for the 1176 compressor. Moreover, descriptors which were shown to relate to distortion in Figure 1, namely gritty, crunchy and dirty also appear often for the 1176. Harsh is also a popular term for this compressor and may be related to distortion. However, one could argue it is a hedonic judgement of preference. Present and bright are two prevalent terms for the 1176, and this is commensurate with the long-term average spectrum (LTAS) plot shown in Figure 8. The LTAS measurements were plotted with a Matlab function [35] using 1/16th octave smoothing. Only one of the songs used in the listening experiments is presented in Figure 8. However, all songs show a similar result, which is that the 1176 has more energy in the high end of the frequency spectrum compared with the uncompressed material and the clean software compressor output. In Figure 8, the increased energy occurs from 4 kHz onwards. Furthermore, the brightness, presence and harshness noted by the participants when listening to 1176 audio, may be related to the descriptor sibilance. Further work should investigate the association between these descriptors by conducting perceptual listening experiments in which the researcher controls these attributes.
Figure 7b illustrates the descriptors used to elucidate the sound quality of the clean software compressor. The most common term is soft, and one can argue that this word is being used as an antonym for aggressive. Natural, smooth, compressed, round, weak and bright are also used by the participants to describe this compressor. Except for bright, they also appear to be terms used to describe the antithesis of an aggressive sound quality. A study carried out by Bernays and Traube [36], which investigated descriptors used to describe piano timbre, found the terms soft, velvety, round and full-bodied were connected. It is worth noting that rounded and smooth are also connected terms in Figure 1. However, further work by the author aims to obtain a better understanding of the most popular descriptors shown in Figure 7 and how they relate to the timbre of DRC.

5. Conclusions

This paper has shown that professional engineers use the descriptor “aggressive” when describing the sound quality of compression techniques that distort the signal. The first listening experiment demonstrated that there is a strong positive correlation between the listeners’ scores for distorted and aggressive when rating the same audio stimuli in a controlled listening experiment. It was also shown that compression settings measured to have 0.5% THD and above were rated as both the most distorted and the most aggressive, but there was no significant difference between settings measured to have more than 0.5% THD. Meaning, in this current study, that listeners could not discern any noticeable difference in perceived distortion or aggression amongst audio measured between 0.5% and 1.58% THD. The various time constant settings used in the experiment, which were gleaned from common settings used in the industry, had no significant effect on the perception of distortion or aggressive sonic signatures. Finally, the experiment revealed a strong correlation between settings rated as aggressive and the audio feature roughness, suggesting that this plays a role in the perception of aggressive sounding audio.
The second listening experiment revealed that compression, which imparts distortion onto the program material, is needed to achieve the most aggressive sound qualities. It appears that fast compression with no distortion (as emulated with the clean software compressor) can affect aggressive sound qualities. Still, the effect is not nearly as significant as using fast-acting compression and distorted artefacts. Both experiments indicated there was no interaction effect between the songs used and the compression settings. Thus, it appears that the songs had little bearing on the results, and the findings from these two experiments should translate to other songs in similar genres.
Finally, a textual analysis conducted on descriptors gathered during the second experiment highlighted the use of descriptors which relate to distortion. The author plans to carry out a new study which will investigate the lexicon of distortion, looking for the similarities between these terms. The results of this study will afford the academic and professional community with a better understanding of how music producers describe and implement distortion in music production.

Funding

This research received no external funding.

Acknowledgments

The author would like to thank Jonathan Wakefield for his help and advice on experimental design.

Conflicts of Interest

The authors declare no conflict of interest.

References

  1. De Man, B. Towards a Better Understanding of Mix Engineering; Queen Mary University of London: London, UK, 2017. [Google Scholar]
  2. Pestana, P. Automatic Mixing Systems Using Adaptive Audio Effects. Ph.D. Thesis, Universidade Católica Portuguesa, Lisbon, Portugal, 2013. [Google Scholar]
  3. Moore, A. All Buttons in: An investigation into the use of the 1176 FET compressor in popular music production. J. Art Rec. Prod. 2012, 6. [Google Scholar]
  4. Ma, Z.; De Man, B.; Pestana, P.D.; Black, D.A.; Reiss, J.D. Intelligent multitrack dynamic range compression. J. Audio Eng. Soc. 2015, 63, 412–426. [Google Scholar] [CrossRef]
  5. Moffat, D.; Sandler, M. Adaptive ballistics control of dynamic range compression for percussive tracks. In Proceedings of the Audio Engineering Society Convention 145, New York, NY, USA, 17–20 October 2018. [Google Scholar]
  6. Moore, A.; Wakefield, J. An Investigation into the Relationship between the Subjective Descriptor Aggressive and the Universal Audio of the 1176 FET Compressor. In Proceedings of the Audio Engineering Society Convention 142, Berlin, Germany, 20–23 May 2017. [Google Scholar]
  7. Nielsen, S.H.; Lund, T. Level control in digital mastering. In Proceedings of the Audio Engineering Society Convention 107, Munich, Germany, 8–11 May 1999. [Google Scholar]
  8. Nielsen, S.H.; Lund, T. 0 dB FS+ Levels in Digital Mastering. In Proceedings of the Audio Engineering Society Convention 109, Los Angeles, CA, USA, 22–25 September 2000. [Google Scholar]
  9. Hjortkjær, J.; Walther-Hansen, M. Perceptual effects of dynamic range compression in popular music recordings. J. Audio Eng. Soc. 2014, 62, 37–41. [Google Scholar] [CrossRef]
  10. Taylor, R.W.; Martens, W.L. Hyper-compression in music production: Listener preferences on dynamic range reduction. In Proceedings of the Audio Engineering Society Convention 136, Berlin, Germany, 26–29 April 2014. [Google Scholar]
  11. Ronan, M.; Ward, N.; Sazdov, R.; Lee, H. The Perception of Hyper-Compression by Mastering Engineers. J. Audio Eng. Soc. 2017, 65, 613–621. [Google Scholar]
  12. Ronan, M.; Ward, N.; Sazdov, R. The Perception of Hyper-Compression by Untrained Listeners. In Proceedings of the Audio Engineering Society Conference: 60th International Conference: DREAMS (Dereverberation and Reverberation of Audio, Music, and Speech), Leuven, Belgium, 3–5 February 2016. [Google Scholar]
  13. Campbell, W.; Paterson, J.; van der Linde, I. Listener Preferences for Alternative Dynamic-Range-Compressed Audio Configurations. J. Audio Eng. Soc. 2017, 65, 540–551. [Google Scholar] [CrossRef]
  14. Wendl, M.; Lee, H. The Effect of Dynamic Range Compression on Perceived Loudness for Octave Bands of Pink Noise in Relation to Crest Factor. In Proceedings of the Audio Engineering Society Convention 138, Warsaw, Poland, 7–10 May 2015. [Google Scholar]
  15. Ronan, M.; Ward, N.; Sazdov, R. Investigating the Sound Quality Lexicon of Analogue Compression Using Category Analysis. In Proceedings of the Audio Engineering Society Convention 138, Warsaw, Poland, 7–10 May 2015. [Google Scholar]
  16. Stables, R.; De Man, B.; Enderby, S.; Reiss, J.D.; Fazekas, G.; Wilmering, T. Semantic description of timbral transformations in music production. In Proceedings of the 24th ACM international conference on Multimedia, Amsterdam, The Netherlands, 15–19 October 2016; pp. 337–341. [Google Scholar]
  17. Bromham, G.; Moffat, D.; Barthet, M.; Fazekas, G. The impact of compressor ballistics on the perceived style of music. In Proceedings of the Audio Engineering Society Convention 145, New York, NY, USA, 17–20 October 2018. [Google Scholar]
  18. Fenton, S.; Lee, H. A Perceptual Model of “Punch” Based on Weighted Transient Loudness. J. Audio Eng. Soc. 2019, 67, 429–439. [Google Scholar] [CrossRef]
  19. Dewey, C.; Wakefield, J. Elicitation and Quantitative Analysis of User Requirements for Audio Mixing Interface. In Proceedings of the Audio Engineering Society Convention 144, New York, NY, USA, 17–20 October 2018. [Google Scholar]
  20. Jillings, N.; Man, B.D.; Moffat, D.; Reiss, J.D. Web Audio Evaluation Tool: A Browser-Based Listening Test Environment; Queen Mary University of London: London, UK, 2015. [Google Scholar]
  21. DC8C Overview. Available online: https://klanghelm.com/contents/products/DC8C/DC8C.php (accessed on 10 January 2020).
  22. Snow, J.; Mann, M. Qualtrics Survey Software: Handbook for Research Professionals; Qualtrics Labs, Inc.: Provo, UT, USA, 2013. [Google Scholar]
  23. Ponemon, L.A.; Wendell, J.P. Judgmental versus random sampling in auditing: An experimental investigation. Auditing 1995, 14, 17. [Google Scholar]
  24. Moore, A. An Investigation into Non-Linear Sonic Signatures with a Focus on Dynamic Range Compression and the 1176 Fet Compressor; University of Huddersfield: Huddersfield, UK, 2017. [Google Scholar]
  25. Woodcock, J.S.; Davies, W.J.; Cox, T.J.; Melchior, F. Categorization of broadcast audio objects in complex auditory scenes. J. Audio Eng. Soc. 2016, 64, 380–394. [Google Scholar] [CrossRef]
  26. Berg, J.; Rumsey, F. Verification and Correlation of Attributes Used for Describing the Spatial Quality of Reproduced Sound. 2001. Available online: http://epubs.surrey.ac.uk/542/1/fulltext.pdf (accessed on 10 January 2020).
  27. Simurra Sr, I.; Queiroz, M. Pilot experiment on verbal attributes classification of orchestral timbres. In Proceedings of the Audio Engineering Society Convention 143, Berlin, Germany, 20–23 May 2017. [Google Scholar]
  28. Pearce, A.; Brookes, T.; Dewhirst, M.; Mason, R. Eliciting the most prominent perceived differences between microphones. J. Acoust. Soc. Am. 2016, 139, 2970–2981. [Google Scholar] [CrossRef] [PubMed] [Green Version]
  29. Zielinski, S.; Rumsey, F.; Bech, S. On Some Biases Encountered in Modern Audio Quality Listening Tests—A Review. J. Audio Eng. Soc. 2008, 56, 427–451. [Google Scholar]
  30. Bos, W.; Tarnai, C. Content analysis in empirical social research. Int. J. Educ. Res. 1999, 31, 659–671. [Google Scholar] [CrossRef]
  31. Waves Audio CLA Live at Mix LA Part 1/2—YouTube. Available online: https://www.youtube.com/watch?v=7heuq2lV3h4 (accessed on 10 January 2020).
  32. Ciletti, E.; Hill, D.; Wolff, P. Gain Control Devices, Side Chains, Audio Amplifiers. Available online: https://www.tangible-technology.com/dynamics/comp_lim_ec_dh_pw2.html (accessed on 10 January 2020).
  33. Union, I.T. Recommendation ITU-R BS. 1116-1; International Telecommunication Union: Geneva, Switzerland, 1997. [Google Scholar]
  34. Lartillot, O.; Toiviainen, P.; Eerola, T. MIRtoolbox 1.1 User’s Manual; Finnish Center of Excellence in interdisciplinary Music Research, University of Jyvaskyla: Jyvaskyla, Finland, 2008. [Google Scholar]
  35. Hummersone, C. Long Term Average Spectrum—File Exchange—MATLAB Central. Available online: https://uk.mathworks.com/matlabcentral/fileexchange/55212-long-term-average-spectrum (accessed on 10 January 2020).
  36. Bernays, M.; Traube, C. Verbal expression of piano timbre: Multidimensional semantic space of adjectival descriptors. In Proceedings of the Proceedings of the International Symposium on Performance Science (ISPS2011), Toronto, ON, Canada, 24–27 August 2011; European Association of Conservatoires (AEC): Utrecht, The Netherlands, 2011; pp. 299–304. [Google Scholar]
Figure 1. Results of clustering using the Ward method. The descriptors are split into five subsets (brown), four subsets (green), three subsets (blue) and two subsets (grey).
Applsci 10 02350 g001
Figure 2. (a) Total Harmonic Distortion (THD) as a function of attack and release using a 4:1 compression ratio and a 1 kHz test tone; (b) THD as a function of attack and release using the “all-buttons” compression ratio and a 1 kHz test tone.
Applsci 10 02350 g002
Figure 3. (a) Distortion components created using a 4:1 ratio and attack at three and release at seven; (b) distortion components created using the all-buttons ratio and attack at three and release at seven.
Applsci 10 02350 g003
Figure 4. (a) Results for the descriptor aggressive from listening experiment 1; (b) results for the distortion from listening experiment 1. Note, no significance was found between time constant settings, but significance was found between ratio settings.
Applsci 10 02350 g004
Figure 5. Scatter plot for aggression and distortion mean scores.
Applsci 10 02350 g005
Figure 6. Aggressive results from the second listening experiment.
Applsci 10 02350 g006
Figure 7. (a) Descriptors used for the Universal Audio 1176 (1176) compressor; (b) descriptors used for the clean software compressor measured to have 0% THD. Descriptors for both ratios and all three songs have been combined for both compressors.
Applsci 10 02350 g007
Figure 8. Long-term average spectrum (LTAS) measurement from the uncompressed audio (green), the clean software compressor (blue) and the 1176 compressor in all-buttons mode (red).
Applsci 10 02350 g008
Table 1. The top ten most frequently used descriptors to describe the sound of the 1176 compression.
Descriptor Frequency of Occurrence
Aggressive21
Pumping11
Forward10
Punch8
Full8
Midrange8
Fast7
Presence7
Dirty6
Gritty6
Table 2. Descriptors used for 1176 vocal compression.
Descriptor Frequency of Occurrence
Aggressive6
Gritty5
Forward4
Midrange4
Presence4
Full3
Sparkly2
Up Front2
Pumping2
Smooth2
Table 3. Popularity of 1176 time constant settings. The table illustrates how often a setting was used by professionals.
Setting Release Setting Used Attack Setting Used
10%46.67%
20%20%
30%20%
418.18%6.67%
518.18%6.67%
663.64%0%
70%0%
1–40%93.33%
5–7100%6.67%
Table 4. THD measurements made using a 1 kHz tone and the time constants and ratios used in Listening Experiment 1.
SettingTHD
A3R7 All1.58%
A1R7 All1.51%
A3R5 All0.54%
A1R5 All0.50%
A3R7 4:10.25%
A1R7 4:10.24%
A3R5 4:10.17%
A1R5 4:10.16%
Table 5. Roughness and zero crossing rate (ZCR) features extracted from the vocal material used in test one.
RoughnessZero Crossing Rate
SettingSong 1Song 2Song 1Song 2
No Comp33.7326.841887.921676.40
A1R5 4:199.12105.582909.152155.41
A1R7 4:1129.12130.462915.282123.67
A3R5 4:198.97102.172579.372166.41
A3R7 4:1128.7130.652484.852125.73
A1R5All202.85236.182966.412053.57
A1R7All212.88241.842850.032055.71
A3R5All199.26232.142881.212083.53
A3R7All209.87247.172953.822067.16

