1. Introduction
Excessive emissions of greenhouse gas exacerbating climate change have received international attention [
1,
2,
3,
4]. The construction industry consumes 40% of the world’s energy each year and emits about 33% of the world’s greenhouse gases [
5], which is an important factor that causes the greenhouse effect [
6,
7]. It also has a huge potential in terms of low energy consumption and greenhouse gas emission reduction [
8]. Therefore, carbon emissions must be strategically controlled in the construction industry to mitigate the impact of global climate change [
9]. With the rapid development of high-rise buildings, the widespread application of prefabricated forms of new building technologies is a popular trend, and is also considered a countermeasure against climate change [
10]. Compared with traditional construction methods, prefabricated buildings are not only highly efficient [
11], high quality [
12], and low cost [
13], but they also effectively promote the minimization of construction waste [
14,
15,
16,
17]. Jaillon et al. [
18] reported that compared with traditional buildings, prefabricated structures can reduce construction waste by 52% and save 70% of the wood formwork. Many scholars studied the carbon emissions of buildings: Hong et al. [
19] divided carbon emissions into indirect and direct emissions based on detailed field construction data and the process-based life cycle assessment (PLCA) method, and studied the carbon emissions in the construction stage. Wong et al. [
20] stated that prefabrication is a low-carbon emission and high-use technology that could be further improved to reduce the carbon emissions generated in the transportation stage. Dong et al. [
21] proposed a life cycle assessment (LCA) method for prefabricated temporary housing that promoted the sustainable development of prefabricated temporary housing. The calculation results of these studies on carbon emissions calculations are biased against the actual situation. To obtain more accurate calculation results, prefabricated components must be considered as separate research objects [
22].
Energy conservation and emission reduction have gradually become the main design concepts of sustainable construction development. For prefabricated buildings, the green degree in the construction period is closely related to the degree of energy conservation and emission reduction, which are also key for the prefabricated buildings to display advantages in sustainable development. However, how the green degree of construction should be expressed is not clear. Therefore, the sustainable development of prefabricated buildings should be evaluated and measured by studying their carbon emissions and expressing their green degree reasonably.
In this study, the whole prefabricated floor slab (PFS) construction process was taken as the research object, which was divided into three stages: production, transportation, and construction. The LCA method was introduced to calculate the carbon emissions in each stage. Based on the PFS construction case in Shaoxing city, China, the carbon emissions during the whole construction process were evaluated.
2. Research Methods
2.1. Life Cycle Framework of the Whole Construction Process of Prefabricated Buildings
As a comprehensive environmental impact assessment method, the LCA method is widely used to evaluate the effect of energy consumption reduction in the construction industry [
23,
24,
25]. The specific assessment method involves evaluating the potential environmental impact by compiling an inventory of inputs and outputs related to the product system, and then the results of the inventory analysis and impact assessment are evaluated [
26]. The evaluation process can be summarized into four stages: (1) goal definition and scope, (2) inventory analysis, (3) impact assessment, and (4) interpretation. Due to the various scopes and theories of different product systems, LCA can be divided into three parts: process LCA, input–output LCA, and mixed LCA [
27]. The life cycle of the building is a process from cradle to demolition [
28], and its specific details are shown in
Table 1.
As can be seen from
Table 1, the whole process of the life cycle of a building goes through four phases, namely building materials production phase, construction phase, use phase, as well as end of life phase. Among them, the use phase is the main part of the building life cycle, lasting 50 years. Thus, the study of carbon emissions in building life cycle is a long-term issue involving complex uncontrollable factors. However, the construction life cycle of building materials production phase and construction phase usually lasts relatively short time span, involving simple factors controlled by the professional construction production team management. Therefore, this paper take the material production phase and construction phase as example to study the carbon emission in the whole construction process of PFS.
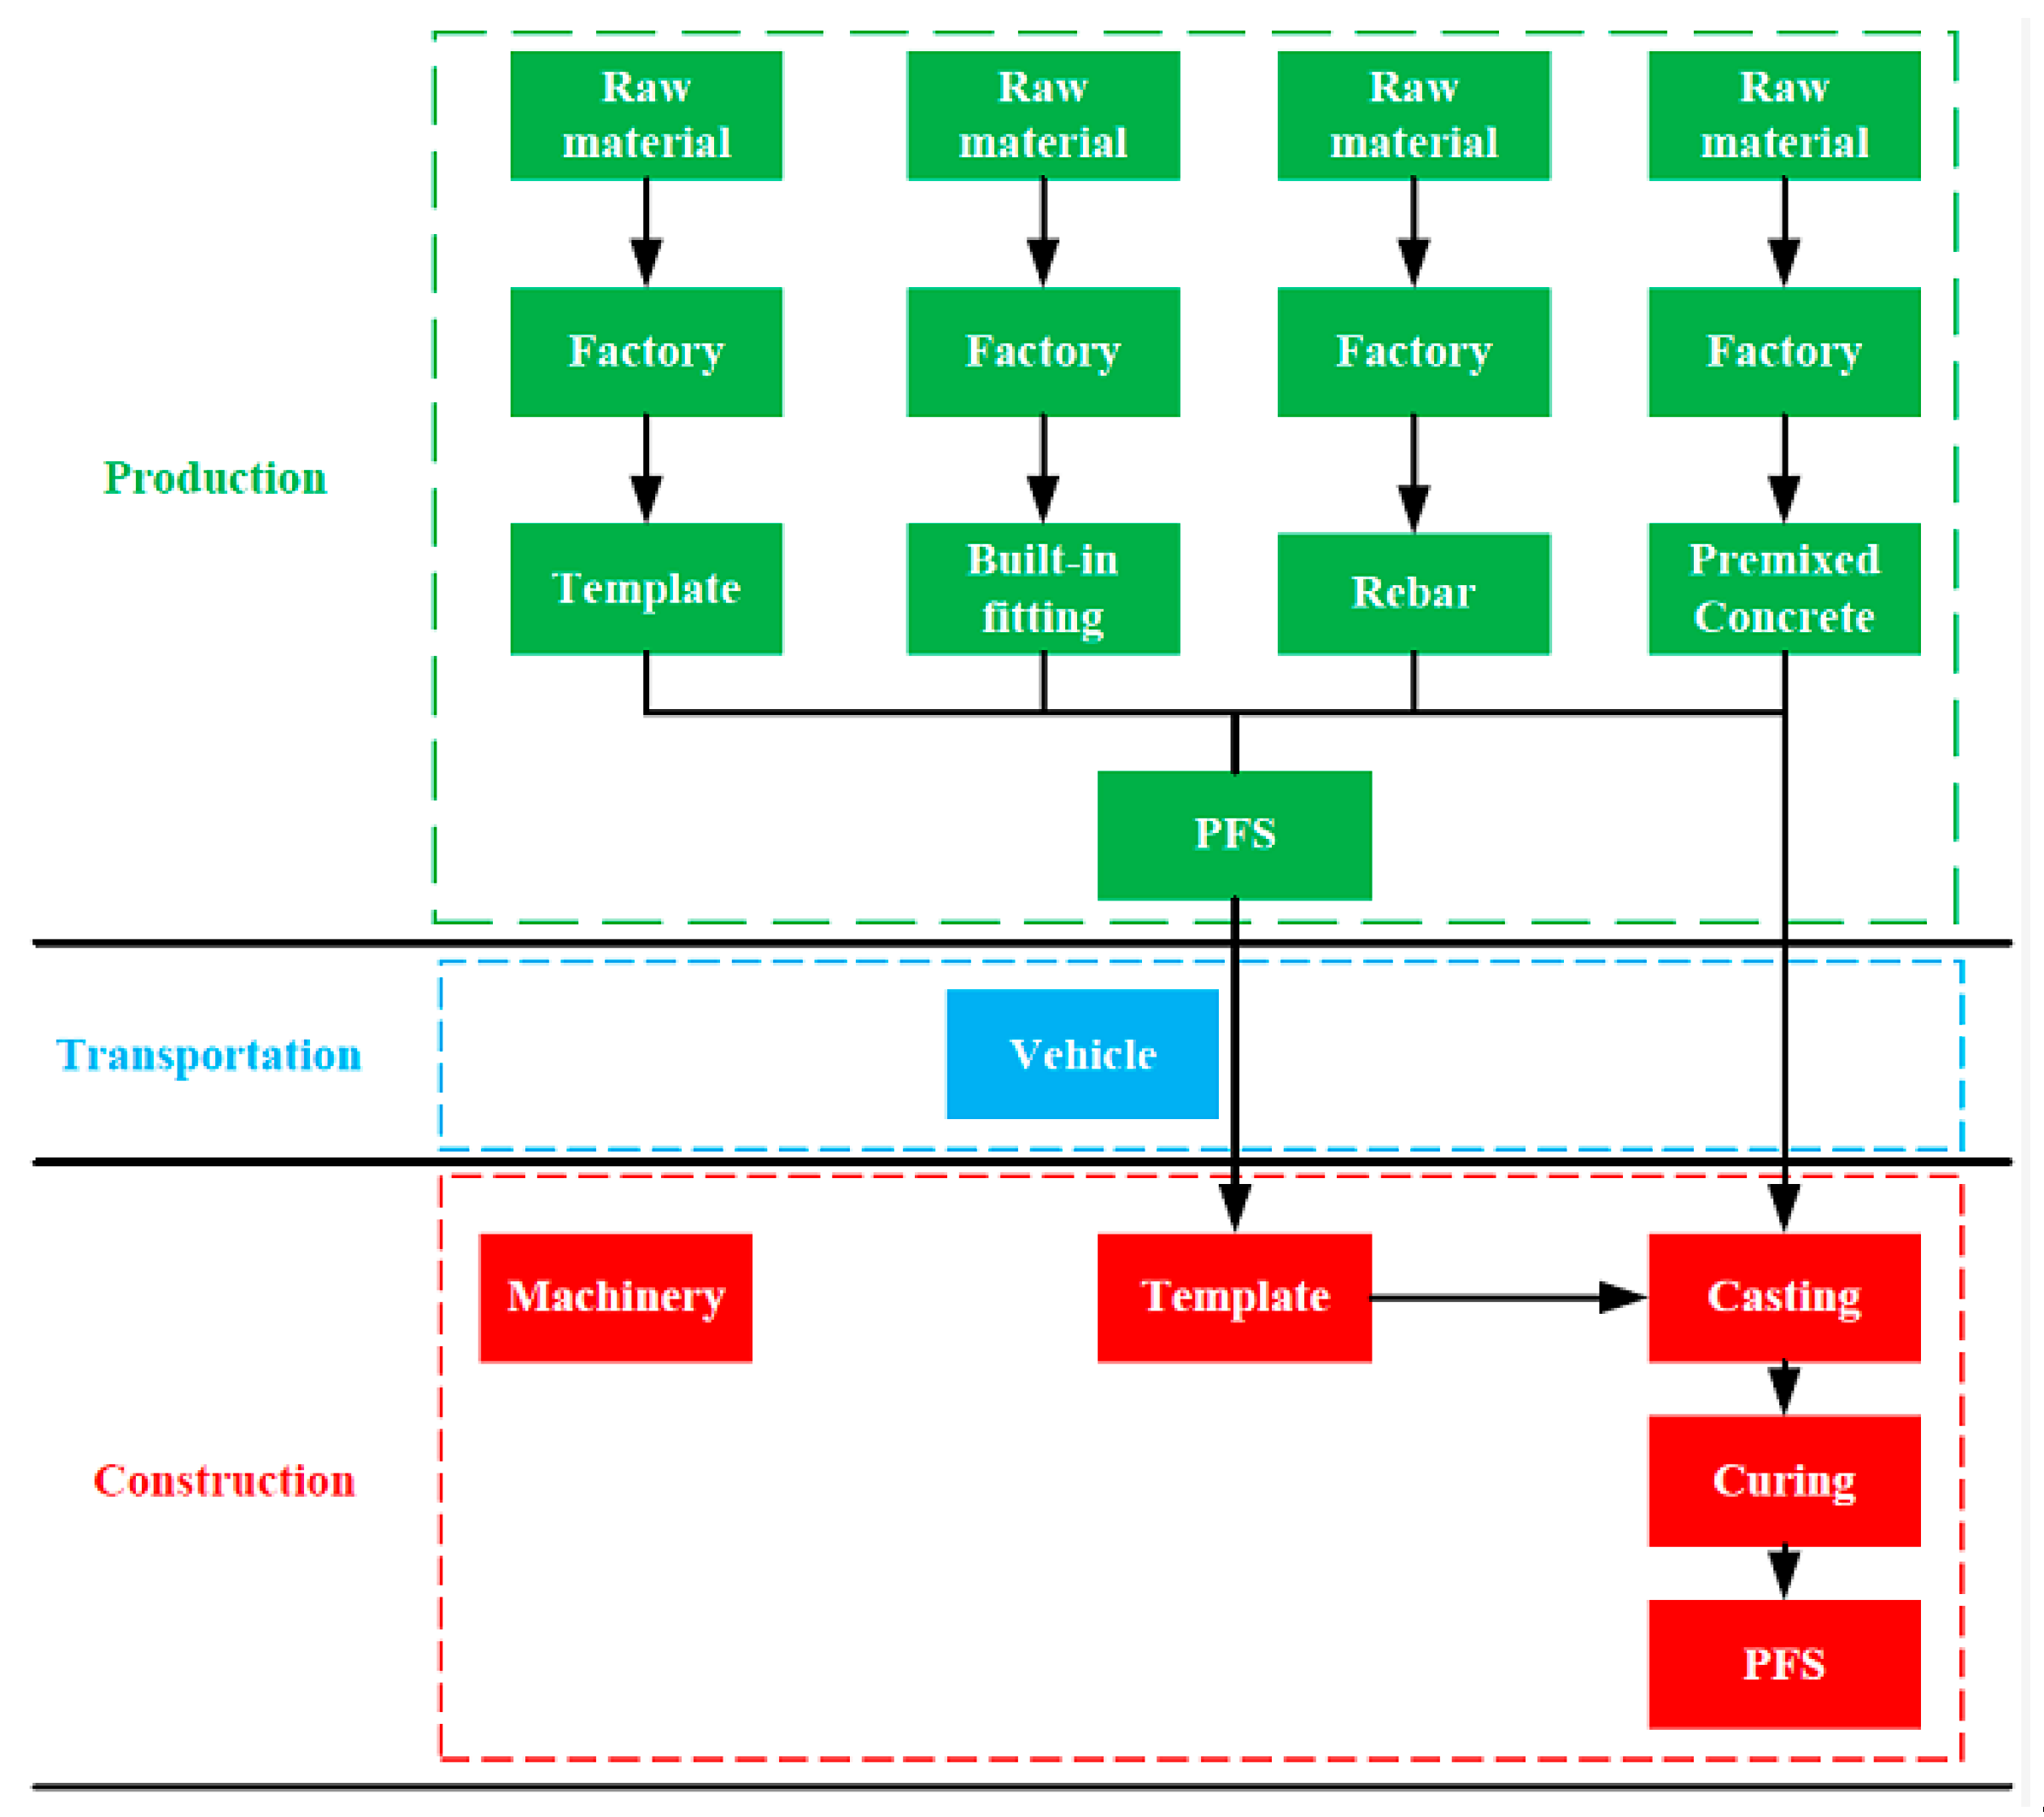
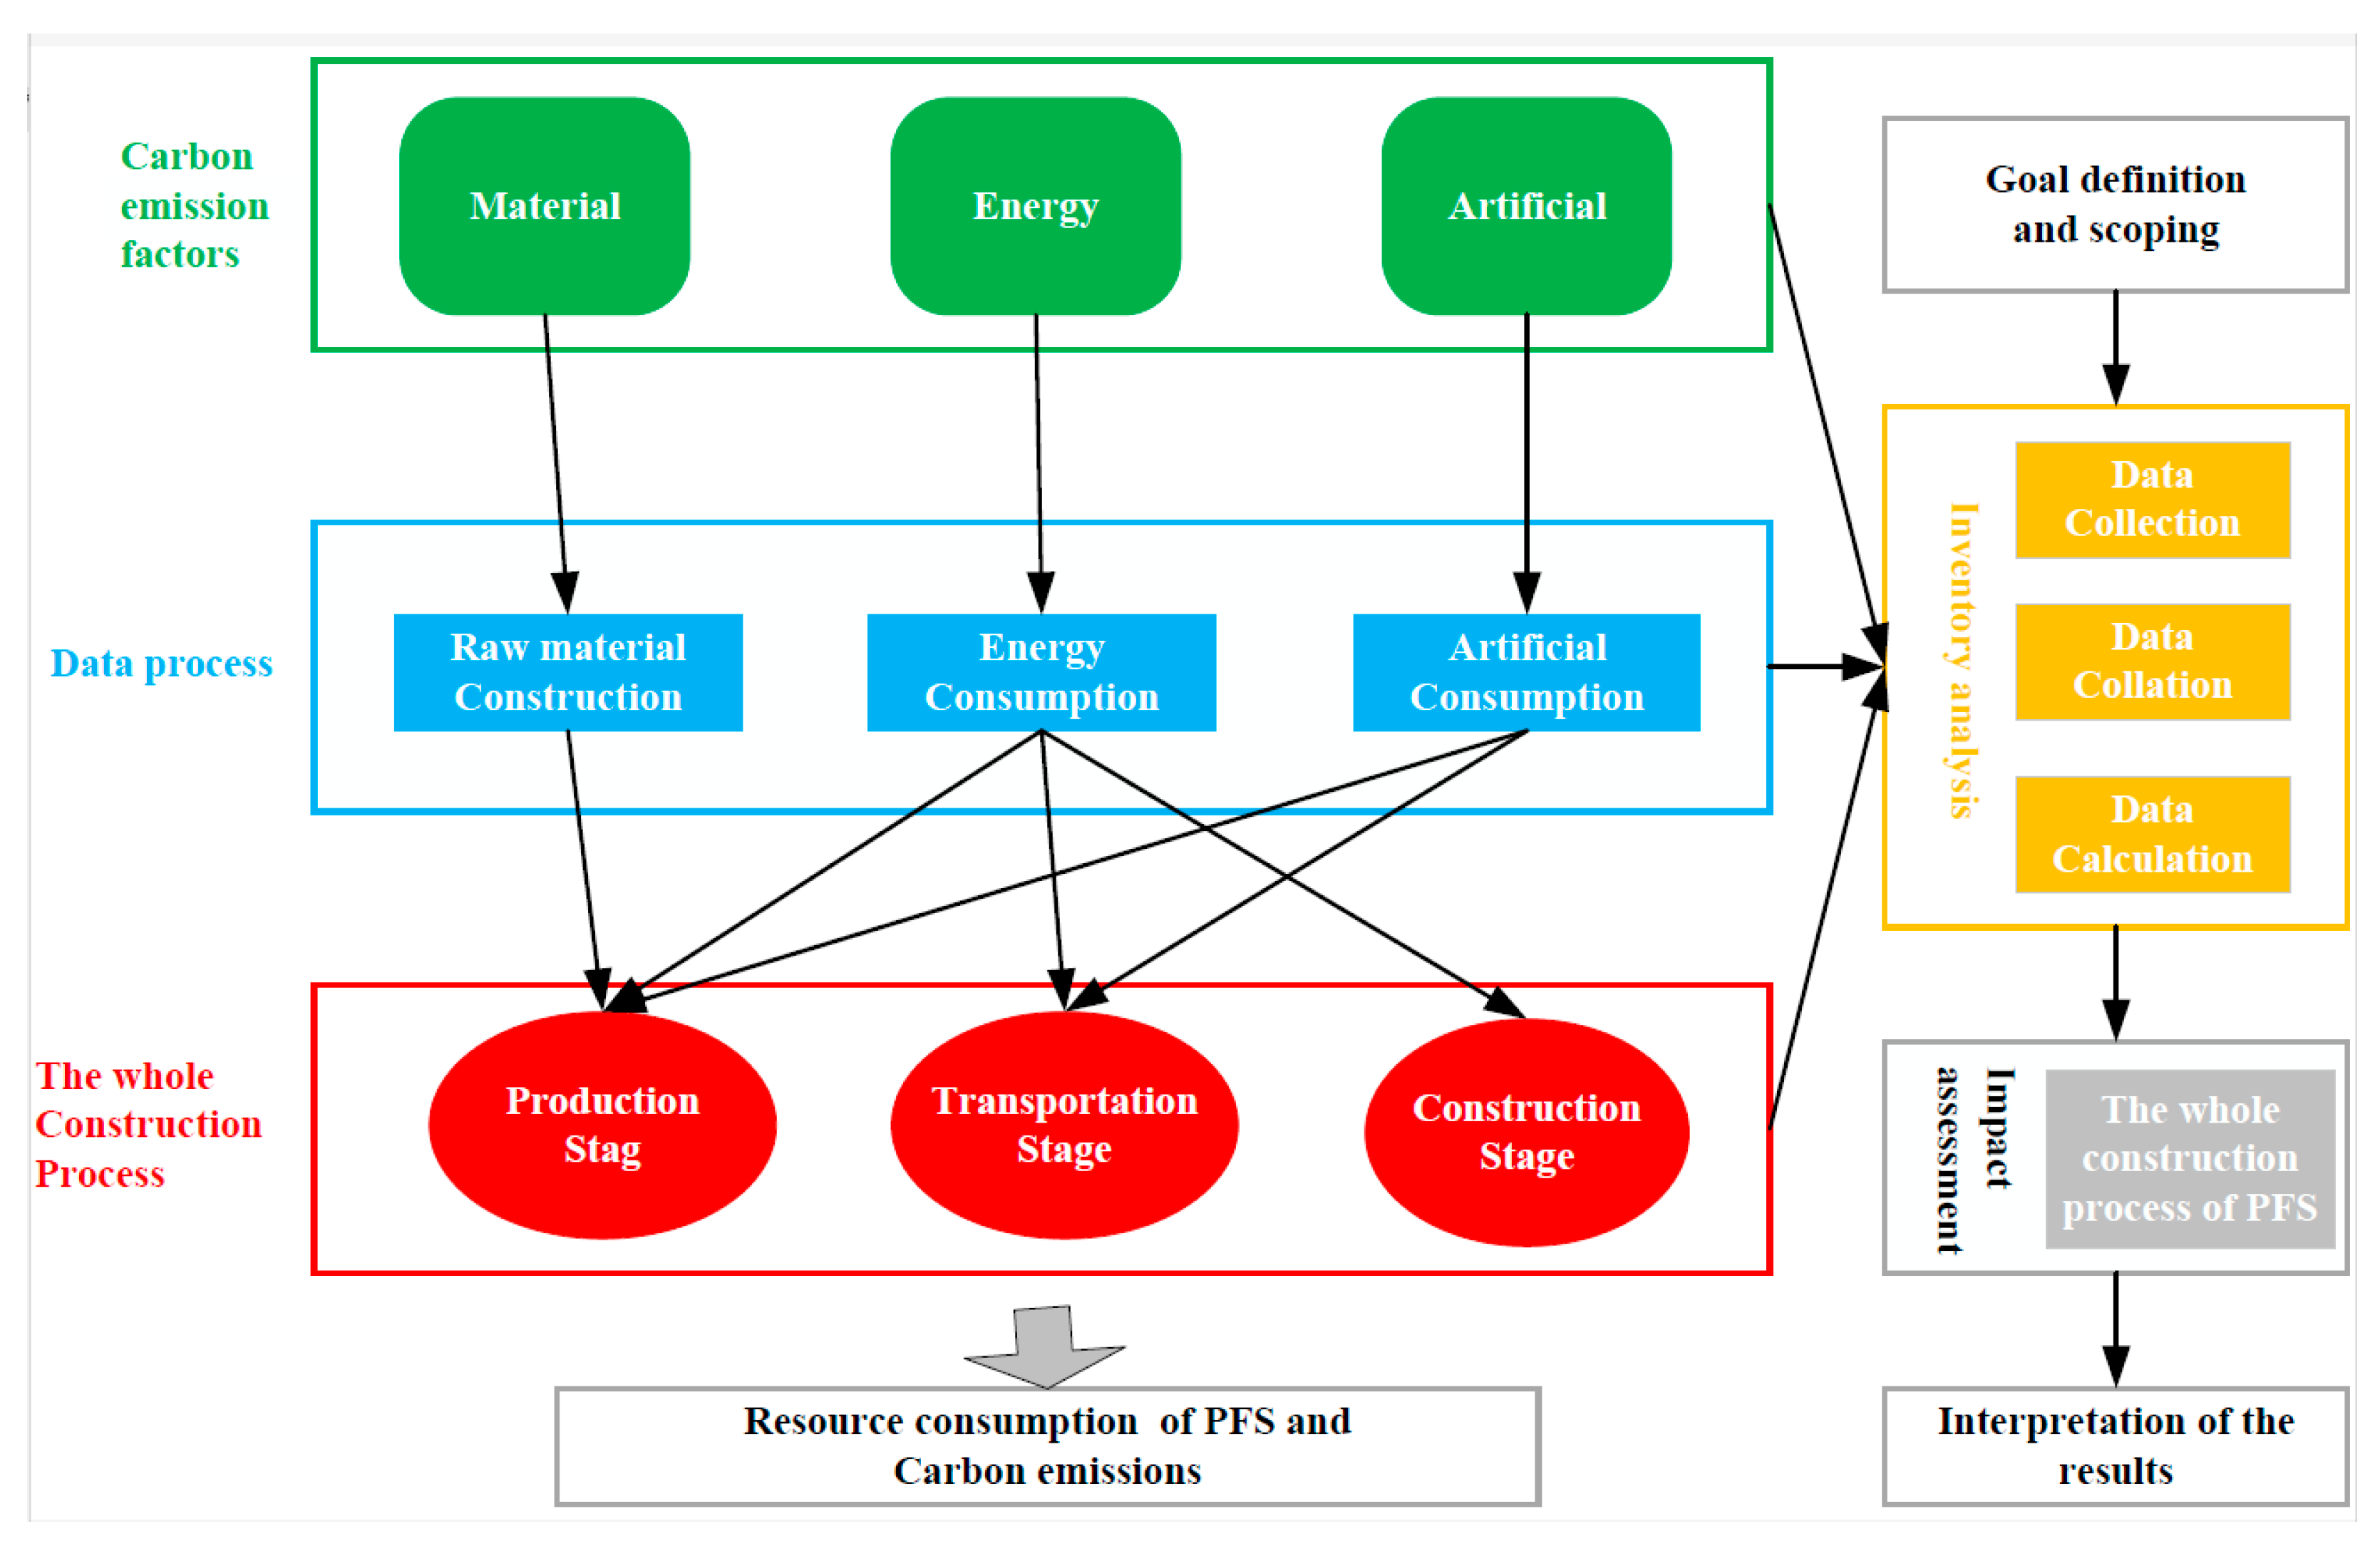
The whole PFS construction process is the beginning of the life cycle of the building, and its LCA framework is shown in
Figure 1. The materials required for the production stage are obtained by collecting raw materials and processing them in the corresponding factories.
The LCA framework of PFS in the construction stage is shown in
Figure 1. The production stage includes: (1) preparation of building materials, converting raw materials (stone, metal ore, and wood) into building materials, including rebar, concrete, embedded parts, etc. and (2) the prefabrication of floor slabs, where the manufactured building materials are used to prefabricate specific components of each floor slab. The transportation stage refers to the transportation of PFS and premixed concrete to the construction site by a transport vehicle. The construction stages include the installation of PFS and concrete pouring on-site for connecting PFS with other prefabricated components.
2.2. Goal Definition and Scoping
Goal definition and scoping are the first and most important steps of LCA, which play the critical role of orientation and provide correct guidance for subsequent detailed assessment. The specific research object of LCA can determine the goal of LCA, and then be used to delineate the scope of the study. The assessment study of carbon emissions forms a closed loop between the goal definition and scope. The scope defined by the carbon emissions assessment focuses on three factors: space, time, and data to be collected and used in the closed loop, which are the time span, system boundary, and inventory data, respectively.
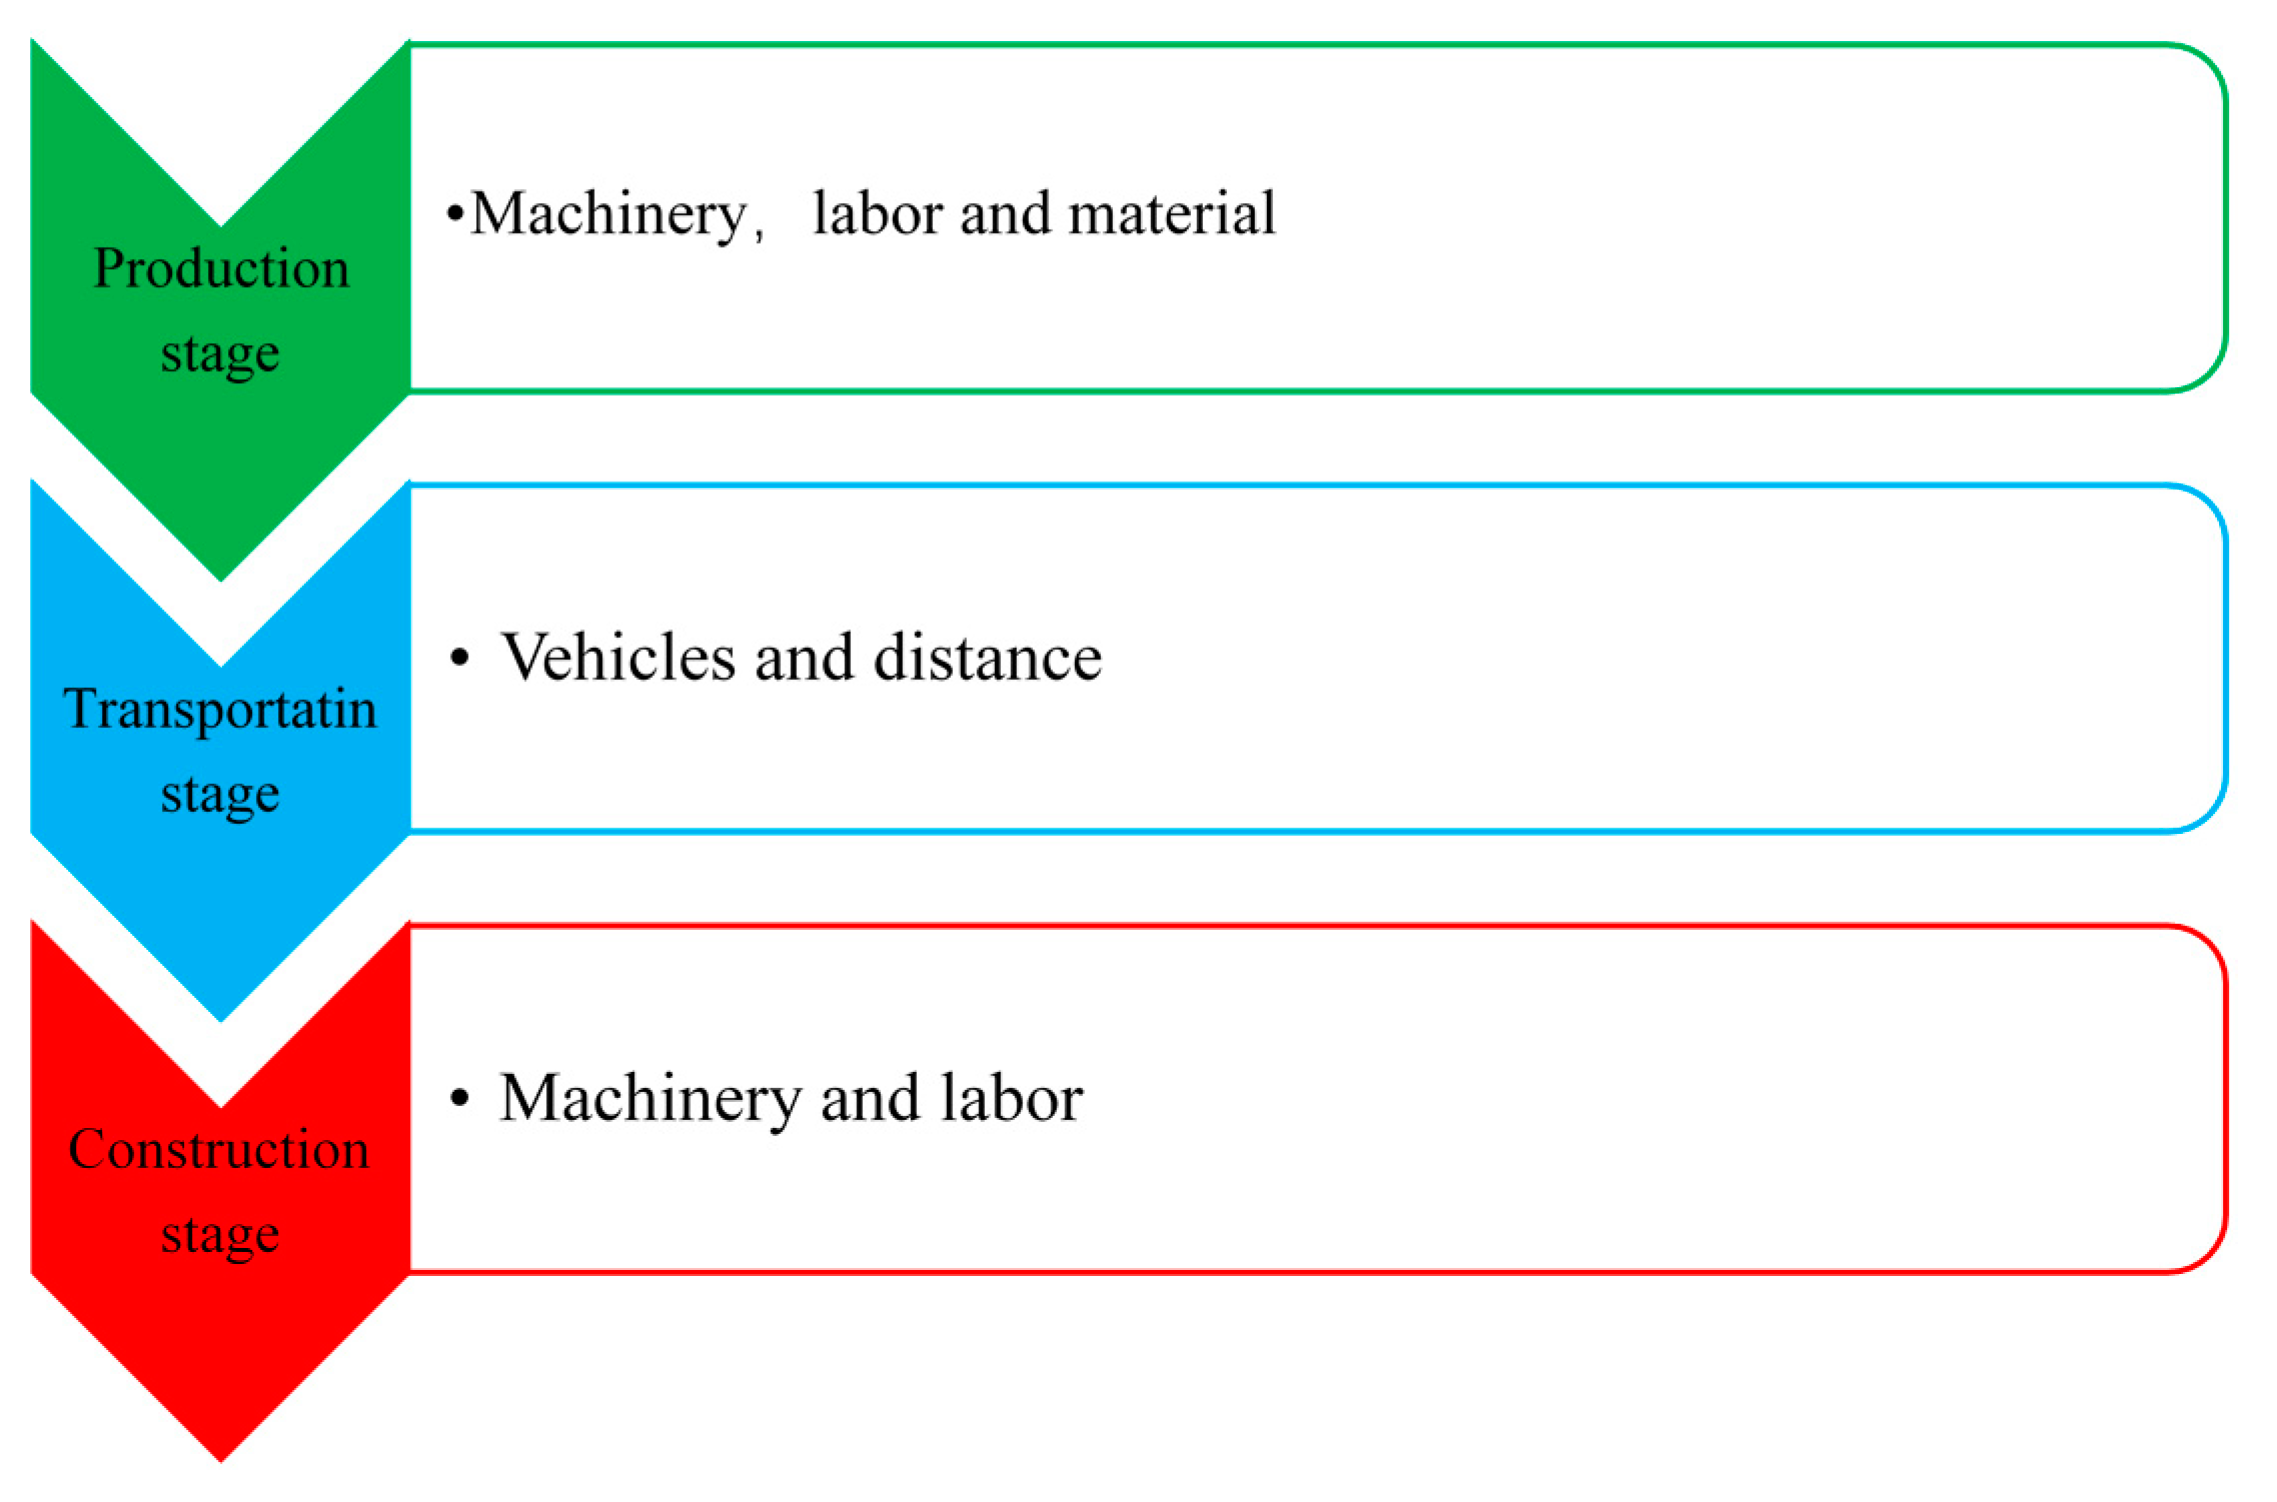
We aimed to calculate and compare the carbon emissions of PFS at various stages during the construction process, and to explore the carbon source and the carbon emission factors. To facilitate the comparison between each stage, PFS with a 1 m
3 unit volume is generally selected as the evaluation object. The system boundary and the source of carbon emissions at each stage were obtained through analysis, as shown in
Figure 2.
It can be seen from
Figure 2 that the main factors affecting the carbon emission during the whole construction process of prefabricated buildings are: machinery, labor, transportation vehicles, and transportation distance. Among them, the labor factor is often ignored in the previous studies because of the difficulty of statistics and the lack of relevant statistical standards. However, as the main body of construction and production control, it covers the whole process of construction. The carbon emission caused by its production activities is the most important factor in the carbon emission source. Therefore, in order to make the research results closer to the reality, it is necessary to include labor carbon emission sources during the whole PFS construction process.
2.3. Inventory Analysis
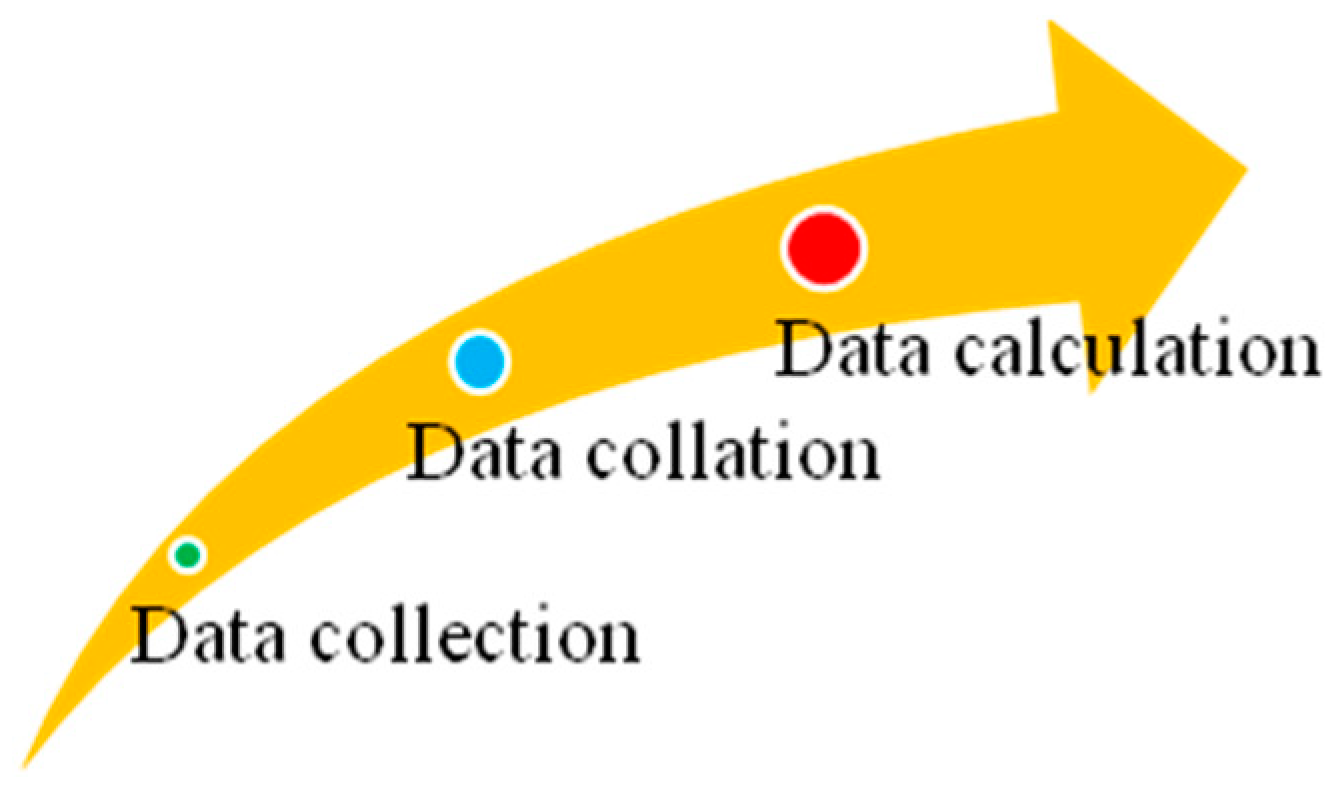
Inventory analysis is the basis of the LCA method. Complete inventory analysis is mainly performed through the three processes of data collection, data collation, and data calculation to obtain the input–output inventory related to the research objectives, thus to quantify the level of environmental impact, as shown in
Figure 3.
The inventory analysis of the whole PFS construction process in this study is a detailed quantitative analysis of carbon emissions at each stage during the construction process. The core includes the classification, statistics, and final calculation of all the carbon emissions related to the energy consumed by people, materials, and machines in the input–output of the system. The statistics included the input of materials, the input of energy, and corresponding carbon emission factors. The specific calculation was completed through the following three steps: firstly, basic data were collected, including the dimensions of PFS components and the resource consumption of raw materials (labor, materials, and machinery) during construction; then, various carbon emission factor values in the database were selected and input into the inventory calculation form; and finally, corresponding calculation formulas were used to calculate the carbon emission value of the whole PFS construction process. In the LCA of the whole PFS construction process, to align the data as much as possible with the actual situation, the data source used in the inventory analysis was a combination of site-specific data and database data, as shown in
Table 2.
2.4. Impact Assessment
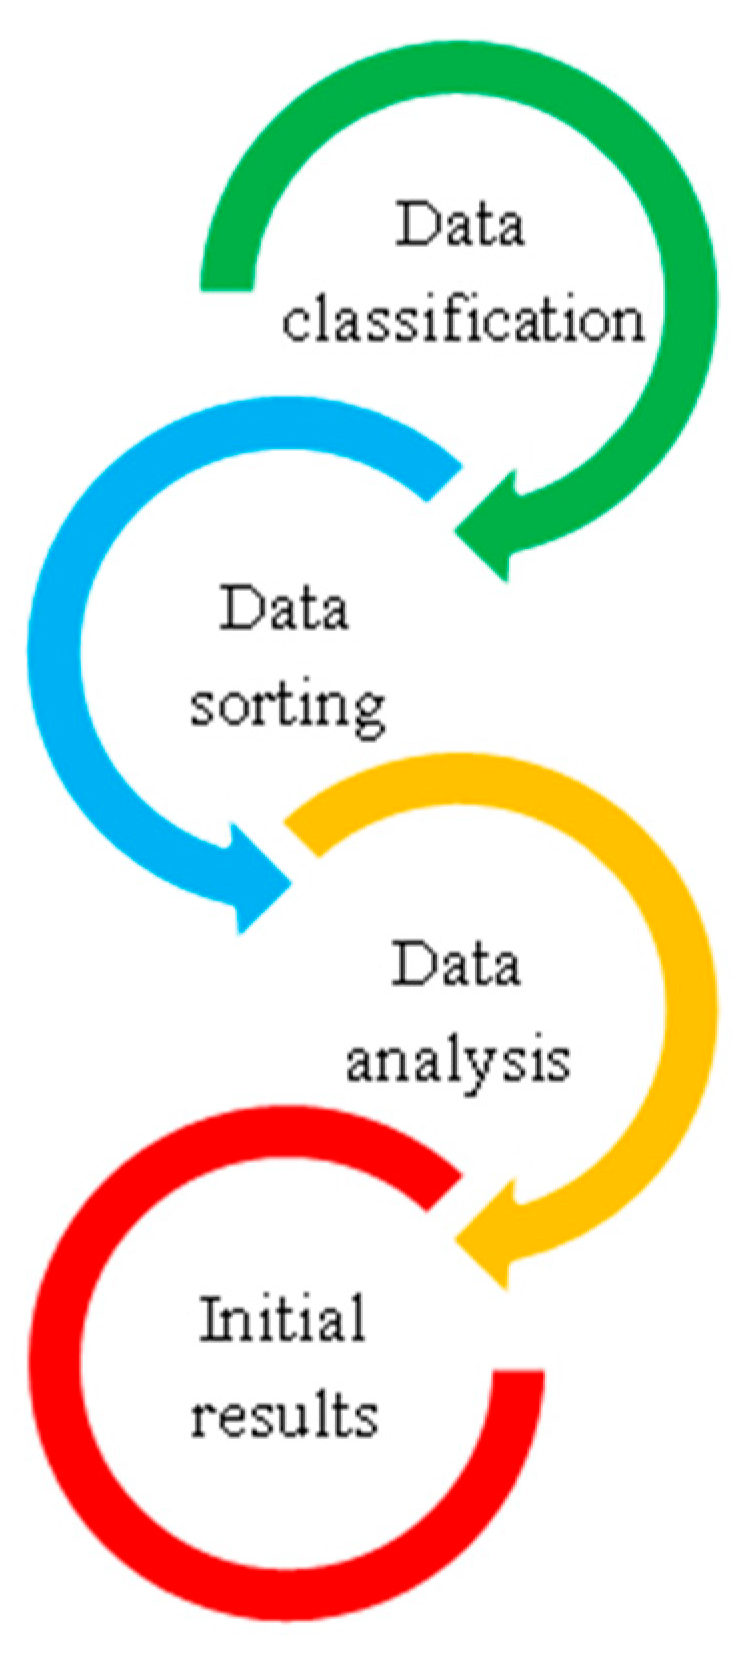
Impact assessment is a process of improving the analysis and assessing the inventory, which aims to analyze and quantify environmental impacts and finally transform them into environmental indicators. After inventory analysis, many data were obtained that indicated that the results corresponding to these data do not all have a large impact on the environment, and some showed a small impact. Therefore, by analyzing the data obtained from the inventory analysis, the potential factors that mostly affect the environment were evaluated to obtain a preliminary conclusion on the environmental impact factors. The basic steps of the impact assessment are shown in
Figure 4.
The International Standards Organization (ISO) simplifies the impact assessment into three steps: firstly, the data in inventory analysis are classified according to the research purpose; secondly, each type of data is sorted in a certain order; and finally, the factor most impacting the environment is analyzed. The preliminary results can be obtained through the processing of these data.
In this study, the carbon emission values of PFS at different construction stages were obtained through inventory analysis. Based on these values, the whole PFS construction process was classified into production, transportation, and construction stages, followed by quantification of artificial carbon emissions, energy carbon emissions, and raw material carbon emissions. Finally, the main factors affecting the carbon emissions were obtained through a detailed comparative analysis.
2.5. Interpretation
The interpretation of the results is the last stage of a LCA. This stage is based on the goal definition and scope combined with the problems found during inventory analysis and impact assessment to interpret the results, draw the conclusions, and formulate corresponding recommendations.
After determining the contribution of carbon source emission in each stage of the whole PFS construction process and the total amount of carbon emissions, the results need to be interpreted, which involves two aspects: determining the key stage and factor that affect the total carbon emissions during the construction process, and comparing carbon emissions between PFS and traditional cast-in-place floor slabs. The obtained results provide relevant basic data for the emission reduction of PFS, as well as reference and suggestions for energy conservation in the future floor slab construction process.
3. Calculation Model of Carbon Emissions in the Whole PFS Construction Process
3.1. Selection of Carbon Emission Factors
The carbon emission factors refer to the carbon emissions associated with the consumption of energy resources per unit mass. The selection of carbon emission factors has a direct impact on the calculation results of carbon emissions [
21]. However, the values of the carbon emission factors of different raw materials in specific buildings vary depending on the measurement method or data source [
22]. Therefore, to ensure the accuracy of the calculation results of the calculation model, the data of the carbon emission factor in this paper refer to the Chinese Life Cycle Database (CLCD) developed by Sichuan University, which are shown in
Table 3.
3.2. Calculation Model and Accounting Process of Total Carbon Emissions
In this paper, the carbon emissions of the three stages are calculated separately, and they make up the total carbon emissions. Thus, the calculation model of carbon emissions during the whole PFS construction process is shown in Equation (1):
where
E represents the total carbon emissions of the whole PFS construction process, and
Ep,
Et, and
Ec represent the carbon emissions generated during the production stage, transportation stage, and construction stage, respectively.
In summary, taking the carbon emission factors as the main data, and combining the records of energy consumption of labor, materials, and machines in the construction inventory list, the calculation range and accounting process for carbon emissions can be shown in
Figure 5.
3.3. Calculation of Carbon Emissions in the Production Stage
The carbon emissions during the production process include not only the carbon emissions generated by the raw materials but also a certain amount of artificial emissions that are generated by people who operate the mechanical equipment. Therefore, the carbon emission calculation in the production stage can be divided into two parts: carbon emissions generated by the operation of various machines on the production line in the production stage and the amount of carbon dioxide consumed by artificial respiration. The specific calculation formula is as follows:
where
Ep represents the total carbon emissions in the production stage;
Cpm,
Cpf, and
Cpe represent the raw material consumption, fuel oil, and electricity consumed during the production process, respectively;
Fm,
Ff, and
Fe represent the carbon emission factors of raw materials, fuel oil, and electric power, respectively,
Tm represents the total working hours of artificial work; and
Fp represents the carbon emission factor consumed by artificial respiration.
3.4. Calculation of Carbon Emissions in the Transportation Stage
The transportation stage refers to the process from the prefabrication plant to the construction site after the PFS production is completed. The transport vehicles consume a certain amount of fuel oil, which releases greenhouse gases like carbon dioxide. Since there are often one–two people on the transport vehicle and the transportation time is longer depending on the distance and road restrictions, artificial carbon emissions cannot be completely ignored. In the calculation, the vehicle load, the transport distance, and the no-load data must be considered when the vehicle returns from the construction site. The specific carbon emissions are calculated as follows:
where
i represents the
ith transport vehicle, with a total of
n vehicles; 2
n indicates that the vehicle is considered to go back and forth;
Et represents the total carbon emissions in the transportation stage;
Tt represents the total working hours of each person on the vehicle;
Fp indicates the carbon emission factor consumed by artificial respiration;
Fq represents the carbon emission factor of energy consumption of vehicles;
Cf represents the fuel consumption when the transport vehicle is fully loaded, in L/100km;
D represents the distance from the prefabricated plant to the construction site; and
Ce represents the empty car return coefficient. In fact, the last vehicle is often not fully loaded, but in order to simplify the calculation process, we assume that the vehicles from the prefabrication plant are all fully loaded to the construction site with
Ce=1.0 and empty when returned with
Ce = 0.67.
3.5. Calculation of Carbon Emissions in the Construction Stage
The fuel and electricity consumed by each construction machinery during PFS installation give rise to carbon emissions. The total carbon emission from energy consumption can be calculated by multiplying the number of mechanical shifts by the construction energy consumption and then multiplying it by the corresponding energy carbon emission factor in the construction stage. In practical engineering, the labor and time required for floor assembly are relatively small. Therefore, artificial carbon emissions of these two parts are not considered in this stage. Then, the carbon emissions generated by energy consumption are approximately equal to the total carbon emissions in the construction stage:
where
Ec represents the total carbon emission in the construction stage;
Ccf and
Cce represent the consumption of fuel and electricity, respectively; and
Ff and
Fe represent the corresponding carbon emission factors, respectively.
4. Case Study
4.1. Overview
The prefabricated building project in Shaoxing city, China, with a floor area of about 50,000 m2 was selected as a case to calculate and evaluate the carbon emissions in the whole PFS construction process. The PFS adopted in this case was HB2022-1 prestressed laminated slab with a size of 3.30 (length) × 2.00 (width) × 0.05 m (height). The concrete used in the raw materials was C40. The transport vehicle was provided by the prefabrication plant. The model was a special flatbed trailer with a load of 30 t, consuming 45 L/100km of fuel. The project site was about 20 km away from the prefabricated plant.
4.2. Production Stage
Five main types of mechanical equipment are used in this stage: electric trucks for cleaning and installation of main bars and distribution bars in the pedestal, sprayer, and plug-in vibrators for concrete pouring, tower crane for hoisting and stacking, grinders for cutting the bars and removing the mold, and oil-burning boiler for steam maintenance. This mechanical equipment consumes energy such as electricity, coal, and fuel oil. The raw materials consumed during the production process are mainly rebar, C40 concrete, and wood. According to the inventory statistics, the total labor consumption is 2.07 hours. By referring to Equation (2), the consumption of labor, materials, and machines and the corresponding carbon emissions calculated by the classification are shown in
Table 4,
Table 5,
Table 6 and
Table 7.
The PFS is 3.30 × 2.00 × 0.05 m, that is, the total carbon emission of a 0.33 m³ PFS component in the production stage is 186.16 kg. That is, the carbon emission of HB2022-1 prestressed laminated slab is 564.12 kg/m³ in the production stage.
4.3. Transportation Stage
The density of the slab is 2500 kg/m³. Considering the possible losses in the transportation process, the number of PFS required in this case was estimated as 7600. Based on above parameters, the total volume, total mass, and required transport vehicles were calculated. The vehicles are required to be provided by the prefabrication plant. The basic data of carbon emissions such as fuel consumption are shown in
Table 8.
Table 8 shows that in the transportation stage, we only considered the full load and no-load situation. Therefore, in the calculation of specific carbon emissions, the values of C
e in Equation (3) can only be 1 and 0.67. The fuel carbon emission factor is 2.73, and the final calculation result is shown in
Table 9.
In terms of artificial consumption, we assumed that two transportation personnel travel in the vehicle, the average speed of the vehicle is 60 km/h, and the total working time is 278.67 h. The basic data and the calculated carbon emissions are shown in
Table 10 and
Table 11, respectively.
As such, we calculated the total PFS carbon emission in the transportation stage as (3.42 + 179.74)/2508 = 3.49 kg/m3 by using Equation (3).
4.4. Construction Stage
Tower cranes are used for hoisting the PFS in the field assembly stage. An electric secondary structure pouring pump is used for concrete pouring. According to the bill of quantities and mechanical energy consumption meter, the calculation of carbon emissions in the construction stage is shown in
Table 12.
The carbon emission of PFS in the construction stage was calculated as 11.136 kg/m3.
5. Analysis of the Results
5.1. Comparative Analysis and Evaluation of Three-Stage Carbon Emissions
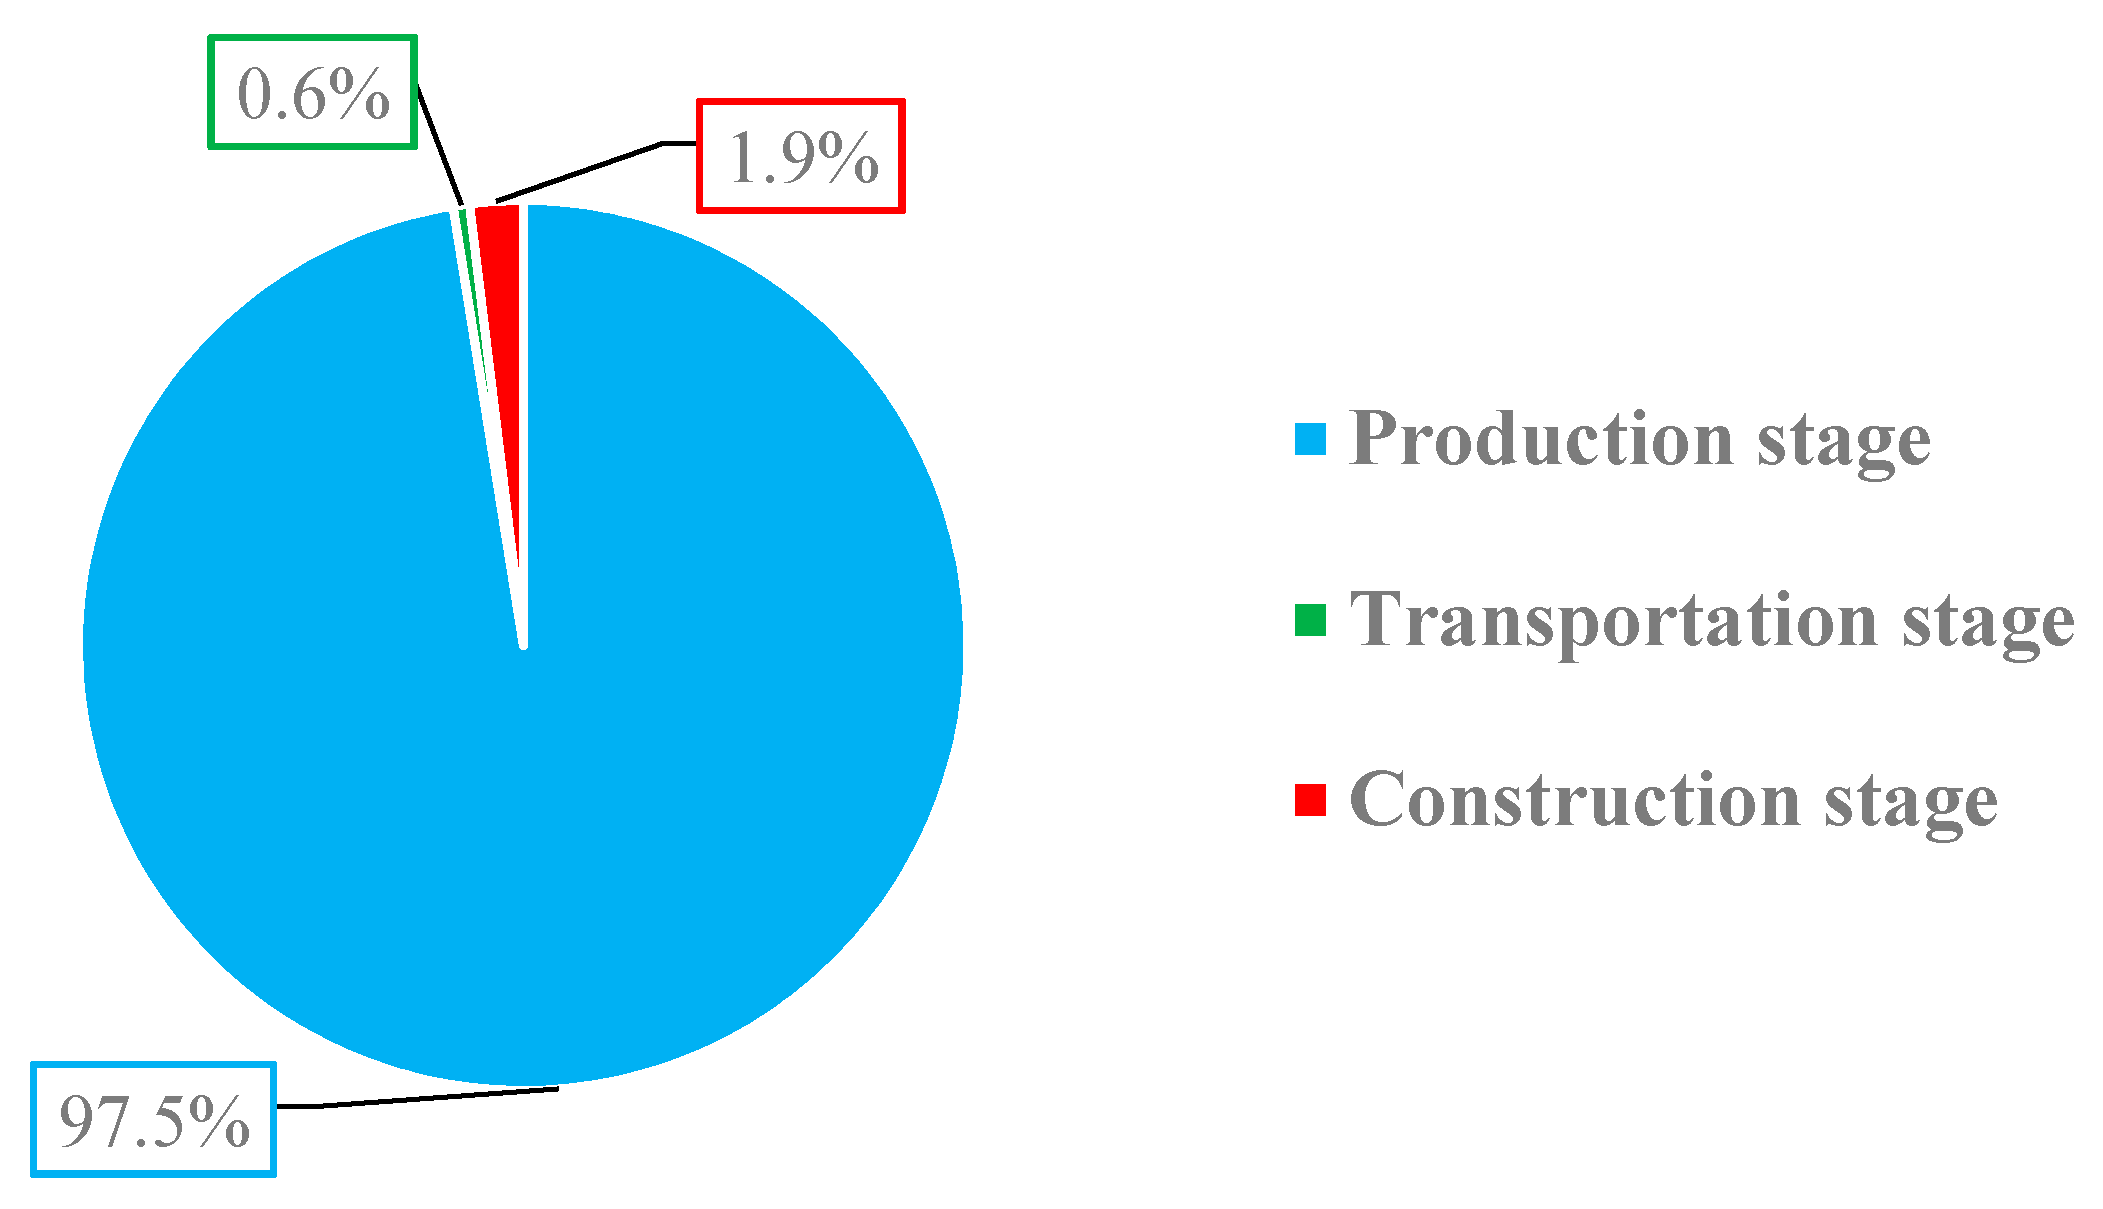
Based on the LCA method, the whole PFS construction process is used to analyze the previous case, and the total carbon emissions are 564.12+3.49+11.136 = 578.746 kg/m
3. As shown in
Figure 6, the carbon emissions during the three stages of production, transportation, and construction accounted for 97.5%, 0.6%, and 1.9% of the total carbon emissions, respectively. According to the Activity Based Classification analysis method, carbon emissions in the production stage are the main factors affecting the total carbon emissions.
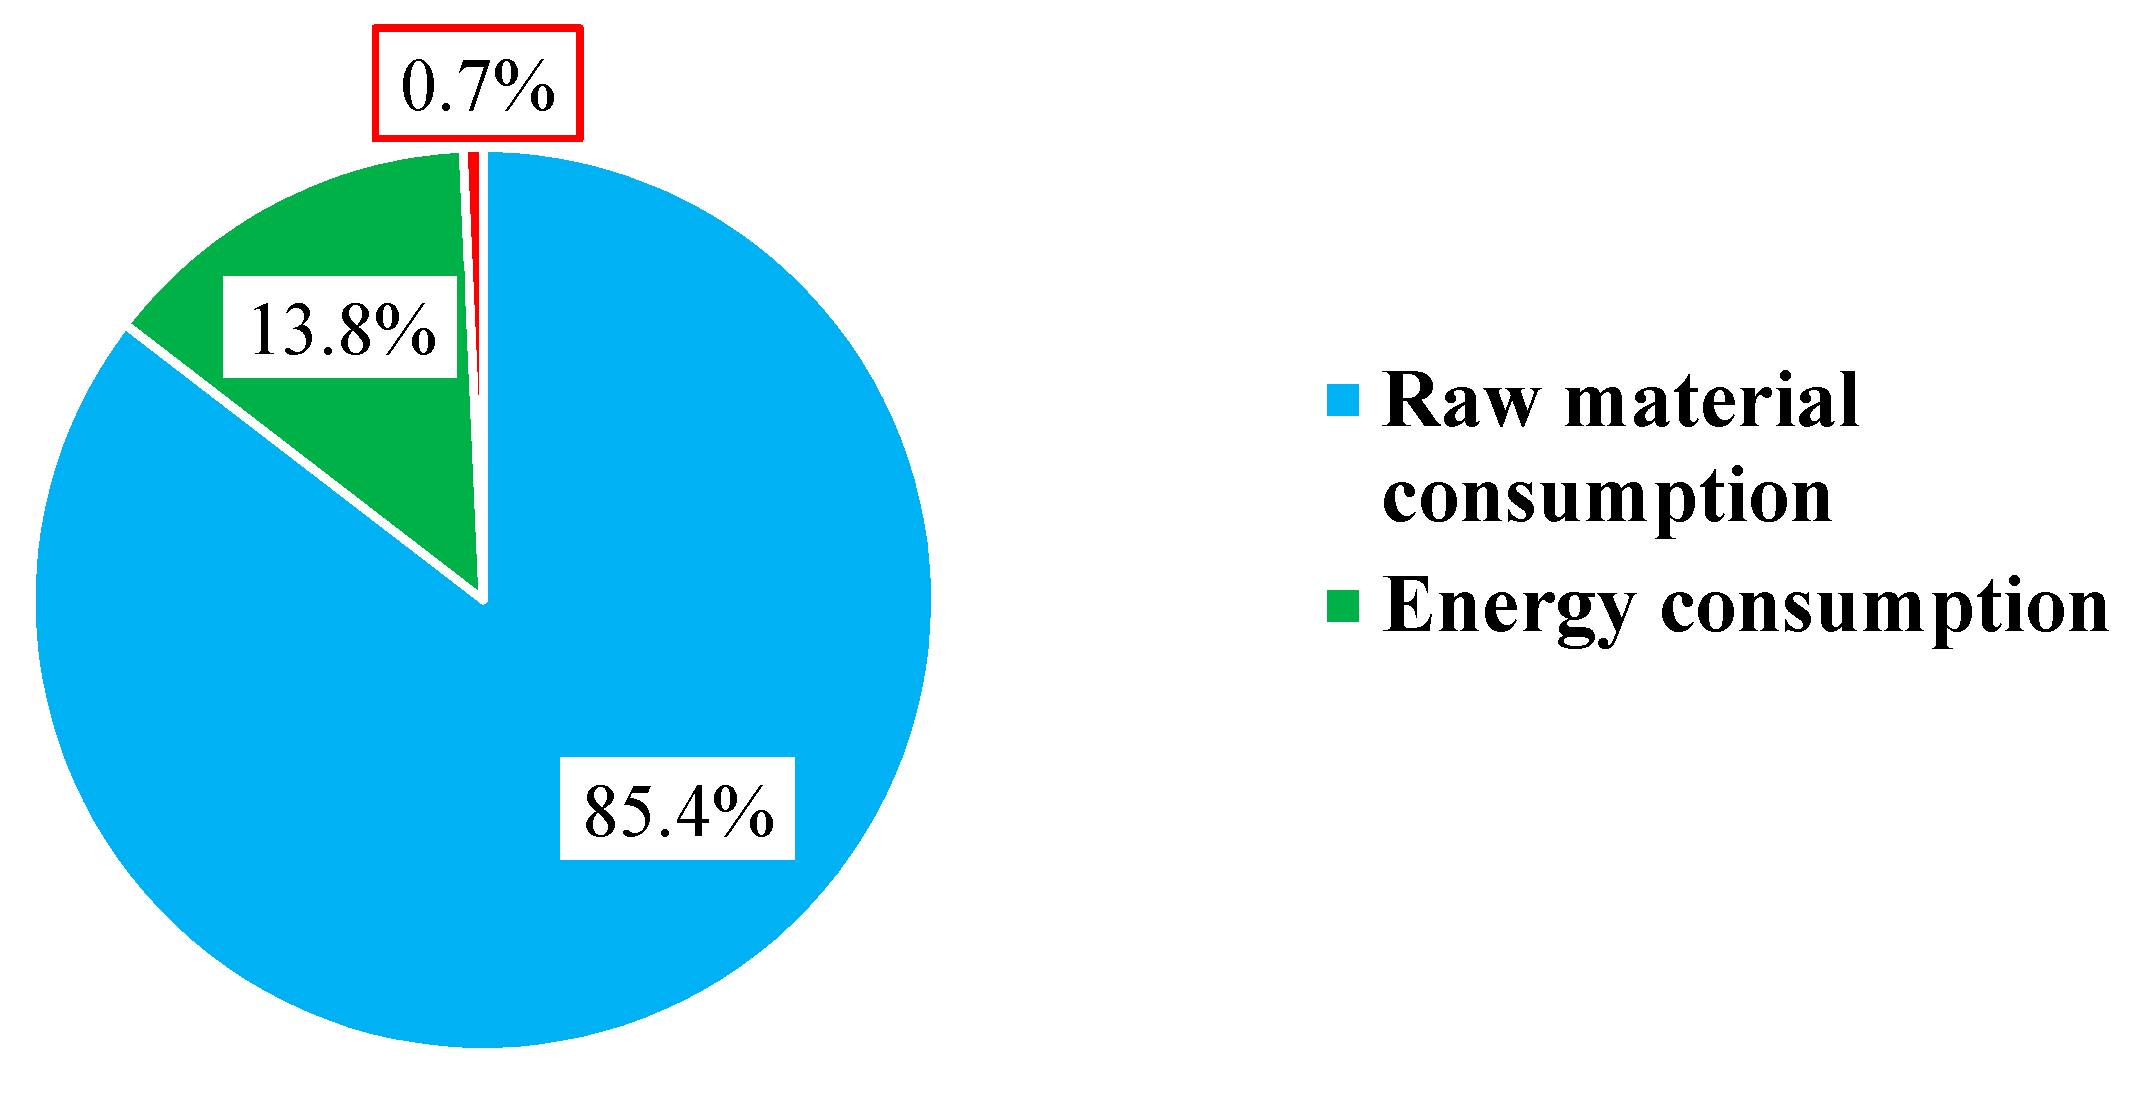
In the production stage, the carbon emissions are 564.12 kg/m
3, and the emissions of raw materials, energy consumption, and artificial consumption are 481.97, 78.09, and 4.06 kg/m
3, respectively, which account for 85.4%, 13.8%, and 0.7% of the total, respectively, as shown in
Figure 7. By comparison, the use of raw materials is the main factor that generates a large amount of carbon emissions in the production stage. After further detailed analysis of the consumption of raw materials, the production of 1 m³ of HB2022-1 prestressed laminated slab requires 34.76 kg of hot-rolled rebar and 1 kg of C40 concrete. The produced carbon emissions are 90.97 and 391 kg, respectively.
In this study, in terms of reducing carbon emissions of PFS, waste of raw materials should be avoided in the production stage, especially concrete and rebar. The materials with lower carbon emission factors should be selected and used for the production of similar floor slabs. At the same time, we should also pay attention to the recycling of templates in the production stage.
5.2. Comparative Analysis and Evaluation with Traditional Concrete Cast-in-Place Floor Slabs
Different from the PFS construction process, the raw materials consumed by cast-in-place floor slabs are mainly rebar, cement, wood, and stones. Transport vehicles are mainly used to transport raw materials for concrete pouring. The main machinery used in construction includes concrete mixing trucks and concrete pumps. The production stage mainly occurs on the construction site.
In the calculation of carbon emissions of traditional cast-in-place floor slabs, after uniforming the carbon emission factor and the transport distance of raw materials (the same transport distance as the prefabricated floor slabs), the carbon emissions of cast-in-place floor slab were calculated as 825.05 kg/m3 in the production stage, 10.02 kg/m3 in the transportation stage, and 54.97 kg/m3 in the construction stage.
5.3. Comparison of Total Carbon Emissions in the Whole Construction Process
We comparatively analyzed the total PFS carbon emissions and the cast-in-place floor slab in the whole construction process. Under the conditions of fixed transportation distance and carbon emission factors, the PFS carbon emission is 578.746 kg/m³, whereas, that of the cast-in-place floor slabs is 890.04 kg/m³. The use of PFS during the whole construction process can reduce the amount of carbon emissions by 35%. From this angle, it is an efficient way to reduce carbon emissions and promote the development of low-carbon buildings by increasing the use of PFS in buildings.
Due to the rough construction management of cast-in-place floor slabs in the construction site, more energy is consumed due to construction with more machinery than PFS and a greater waste of materials due to on-site processing of raw materials, thus increasing the carbon emissions during the construction process.
5.4. Prospect of Emission Reduction in the Whole Construction Process of PFS
Although PFS is a new construction method in the building, the transportation and energy used in the whole process of its construction are relatively traditional, such as fuel-dependent transport vehicles and coal power generation technology, which will cause a large amount of carbon emissions. Therefore, to reduce carbon emissions in the construction process in a comprehensive way, the use of lower-carbon transport and energy is a considerable concept.
In the transportation stage of the whole construction process of PFS, the traditional means of transportation are fuel-powered cars with large carbon emissions. Therefore, changing transportation tools to reduce the whole construction process of PFS carbon emissions is a great potential way. Electric cars are a better solution, although electric consuming also produces carbon emissions, it has a broader source with smaller carbon emissions than fuel. With the popularity of electric vehicles from small scooters to the development of cars and buses, it can be expected that the application of electric vehicles in the construction and production industry is the trend.
In the future, clean renewable energy such as solar energy, wind energy, and nuclear energy may be widely used by engineers, and may also be used in construction production to further reduce carbon emissions in the whole construction process of PFS.
6. Conclusions
Based on the LCA framework of the whole PFS construction process, the concept of the evaluation system of carbon emissions were expanded, the calculation scope was divided, and the calculation formula was established. Combined with a case study of the whole construction process of HB2022-1 prestressed laminated slab, the carbon emissions in each stage with the same engineering unit volume were analyzed, and the carbon emissions of PFS and cast-in-place floor slab were compared. The following conclusions are drawn:
(1) The production stage has the largest carbon emissions in the whole PFS construction process. According to the empirical research in this paper, the carbon emissions in the production stage account for 97.5% of the total carbon emissions of the whole construction process, whereas the transportation stage and construction stage account for less than 3%. Therefore, measures to reduce PFS carbon emissions should first consider the production stage.
(2) Emission reduction measures should be considered from raw materials. The carbon emissions of raw materials account for 85.4% of the whole production stage and nearly 83% of the whole construction process. The two types of materials that produce the most emissions are rebar and concrete. Therefore, the optimization of raw materials to reduce carbon emissions in the production stage should be considered; materials with low carbon emission factors should be used to ensure floor components meet mechanics and thermodynamics requirements. It is also necessary to strengthen the management of the production stage to reduce material waste in production.
(3) Increasing the use of PFS will help reduce carbon emissions. The carbon emitted by the whole PFS construction process is 578.746 kg/m3, which is about 35% less than that of cast-in-place floor slabs, which is 890.04 kg/m3. Therefore, under the strengthened scientific management, the use of PFS in buildings can significantly reduce the total carbon emissions and promote the development of low-carbon buildings.
It should be noted that the building construction engineering includes three main parts: foundation engineering, structural engineering, and decoration engineering [
29,
30,
31], which together constitute the carbon emission system of the whole building. This paper only studies the carbon emission system of PFS in structural engineering. At the same time, cement is a main component of carbon emission materials, and reducing cement consumption can reduce the carbon emission of buildings in essence. In the future, optimizing the whole architectural design system based on the application of new renewable materials and nano materials is a major research topic to reduce the carbon emission of the architectural system [
25,
32,
33].


