The Effect of Unsupported Sleepers/Bearers on Dynamic Phenomena of a Railway Turnout System under Impact Loads


Abstract
Featured Application
Abstract
1. Introduction
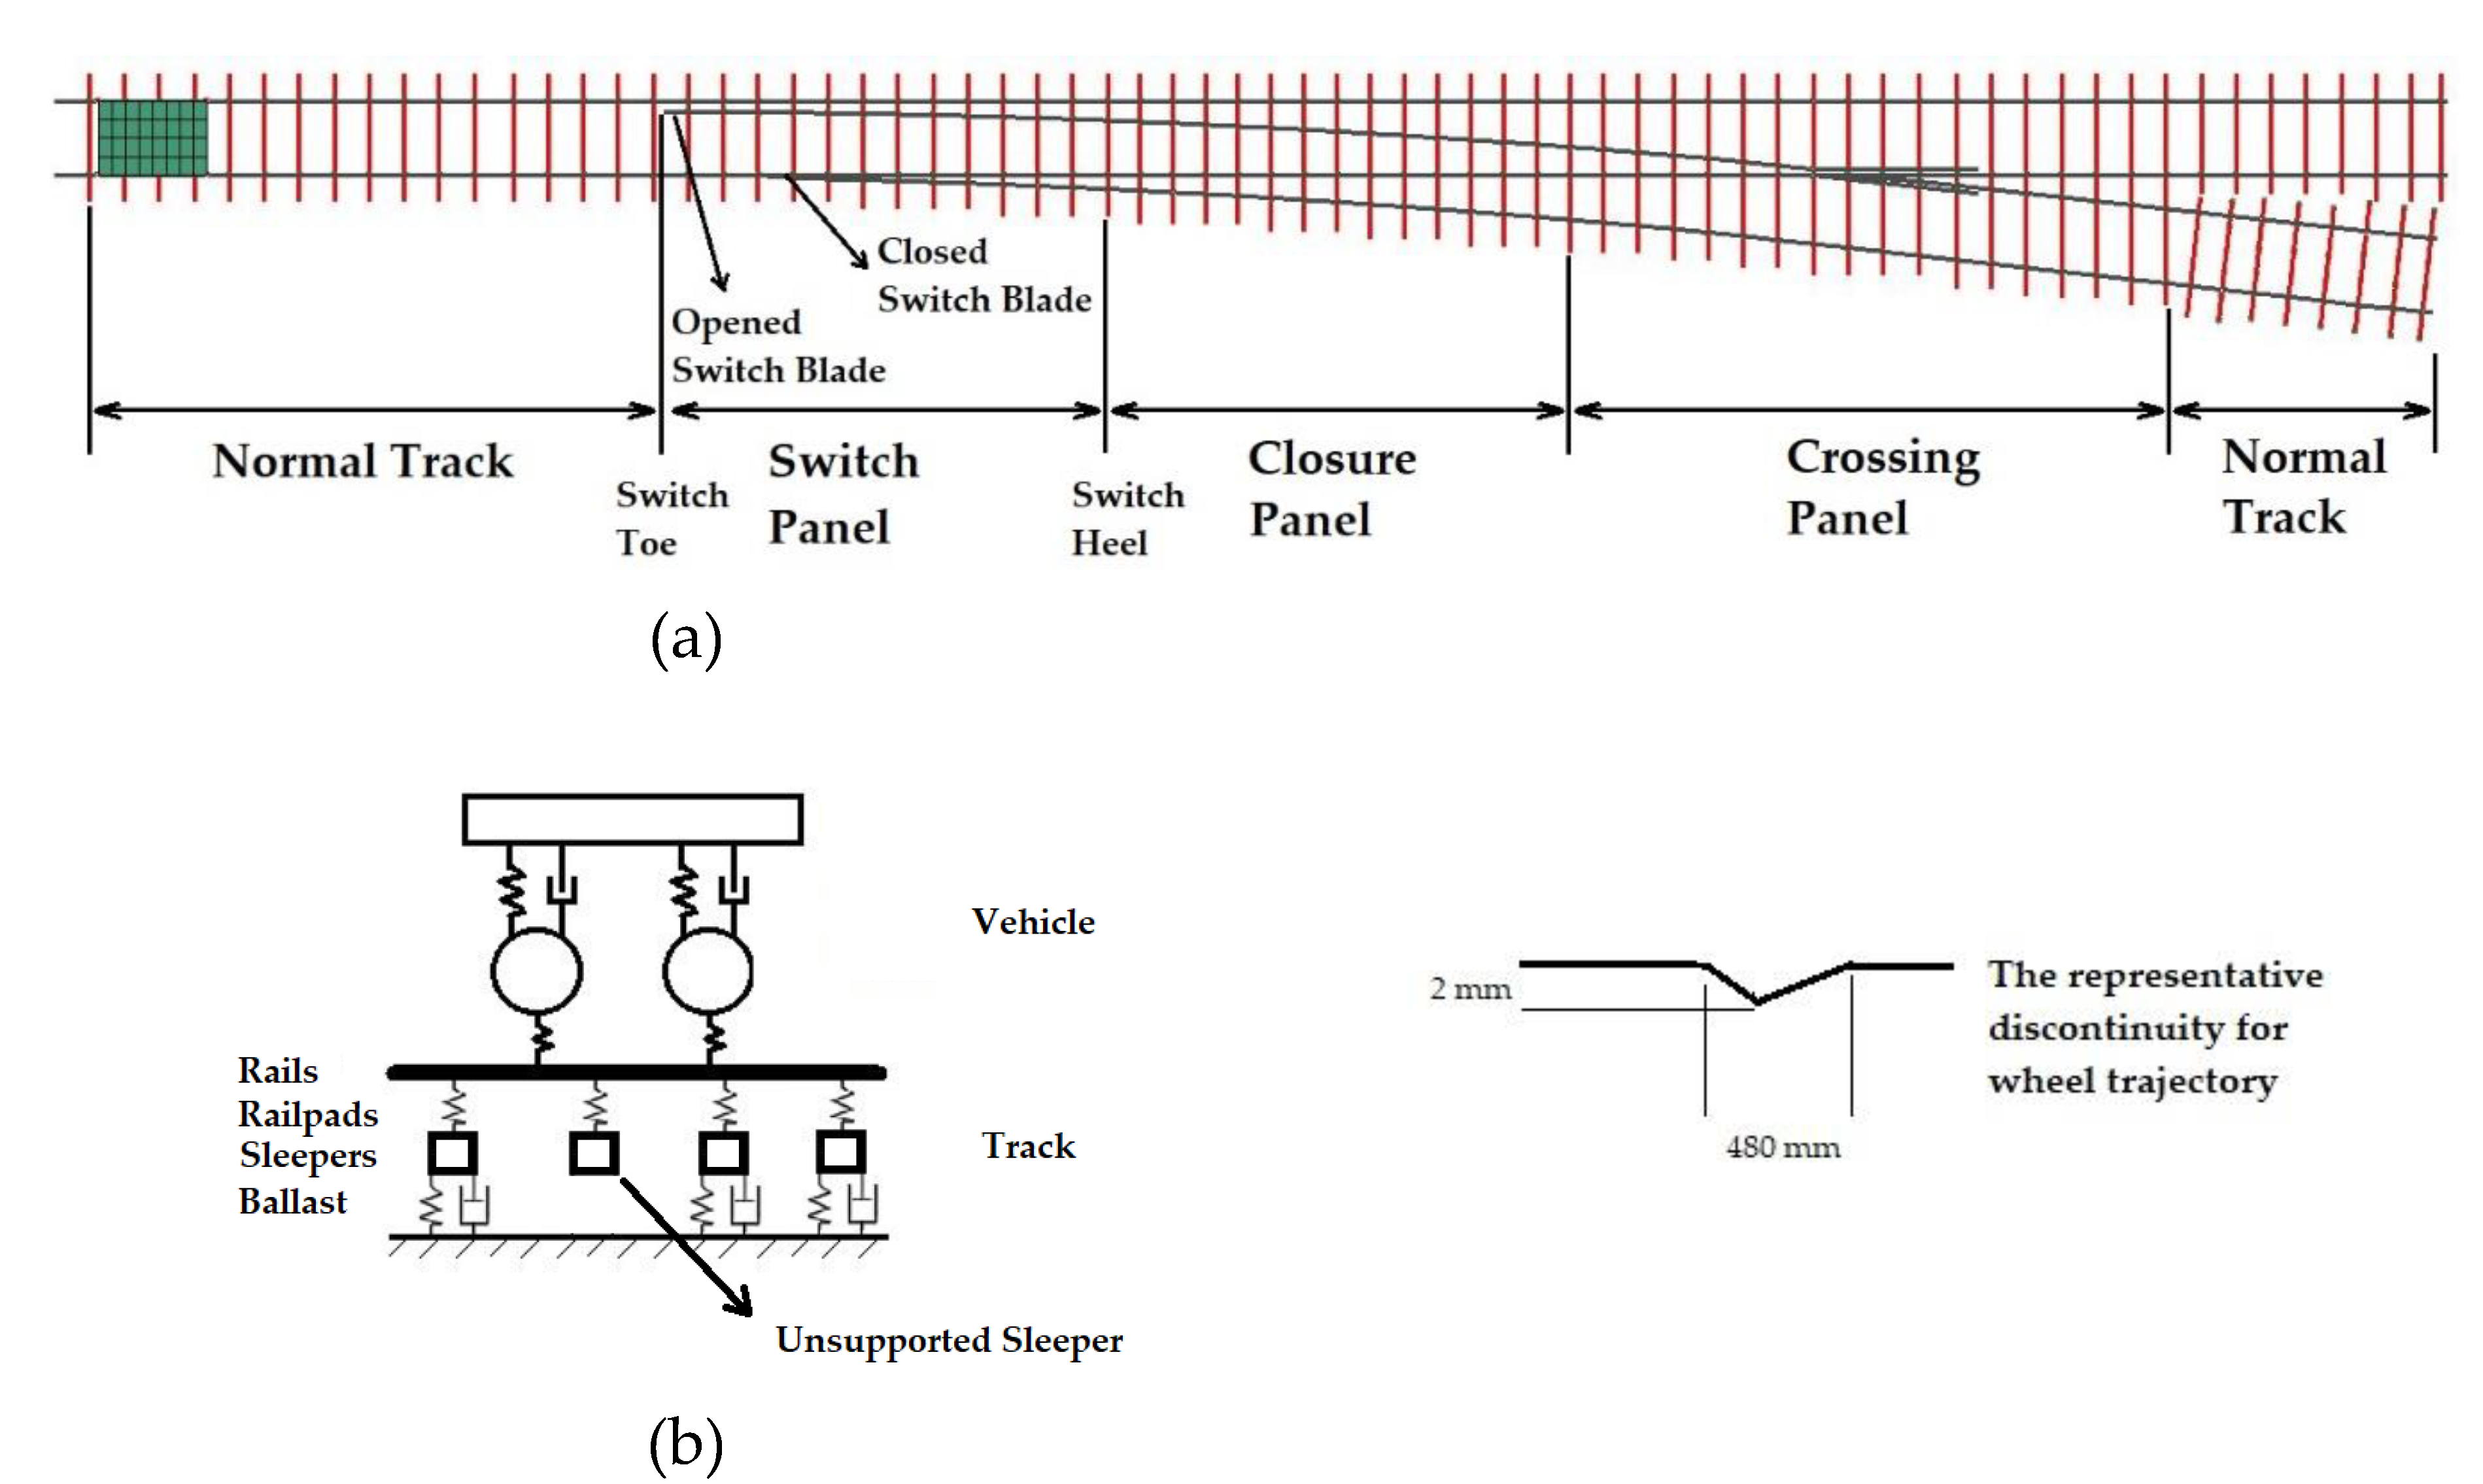
2. Numerical Model
3. Results and Discussion
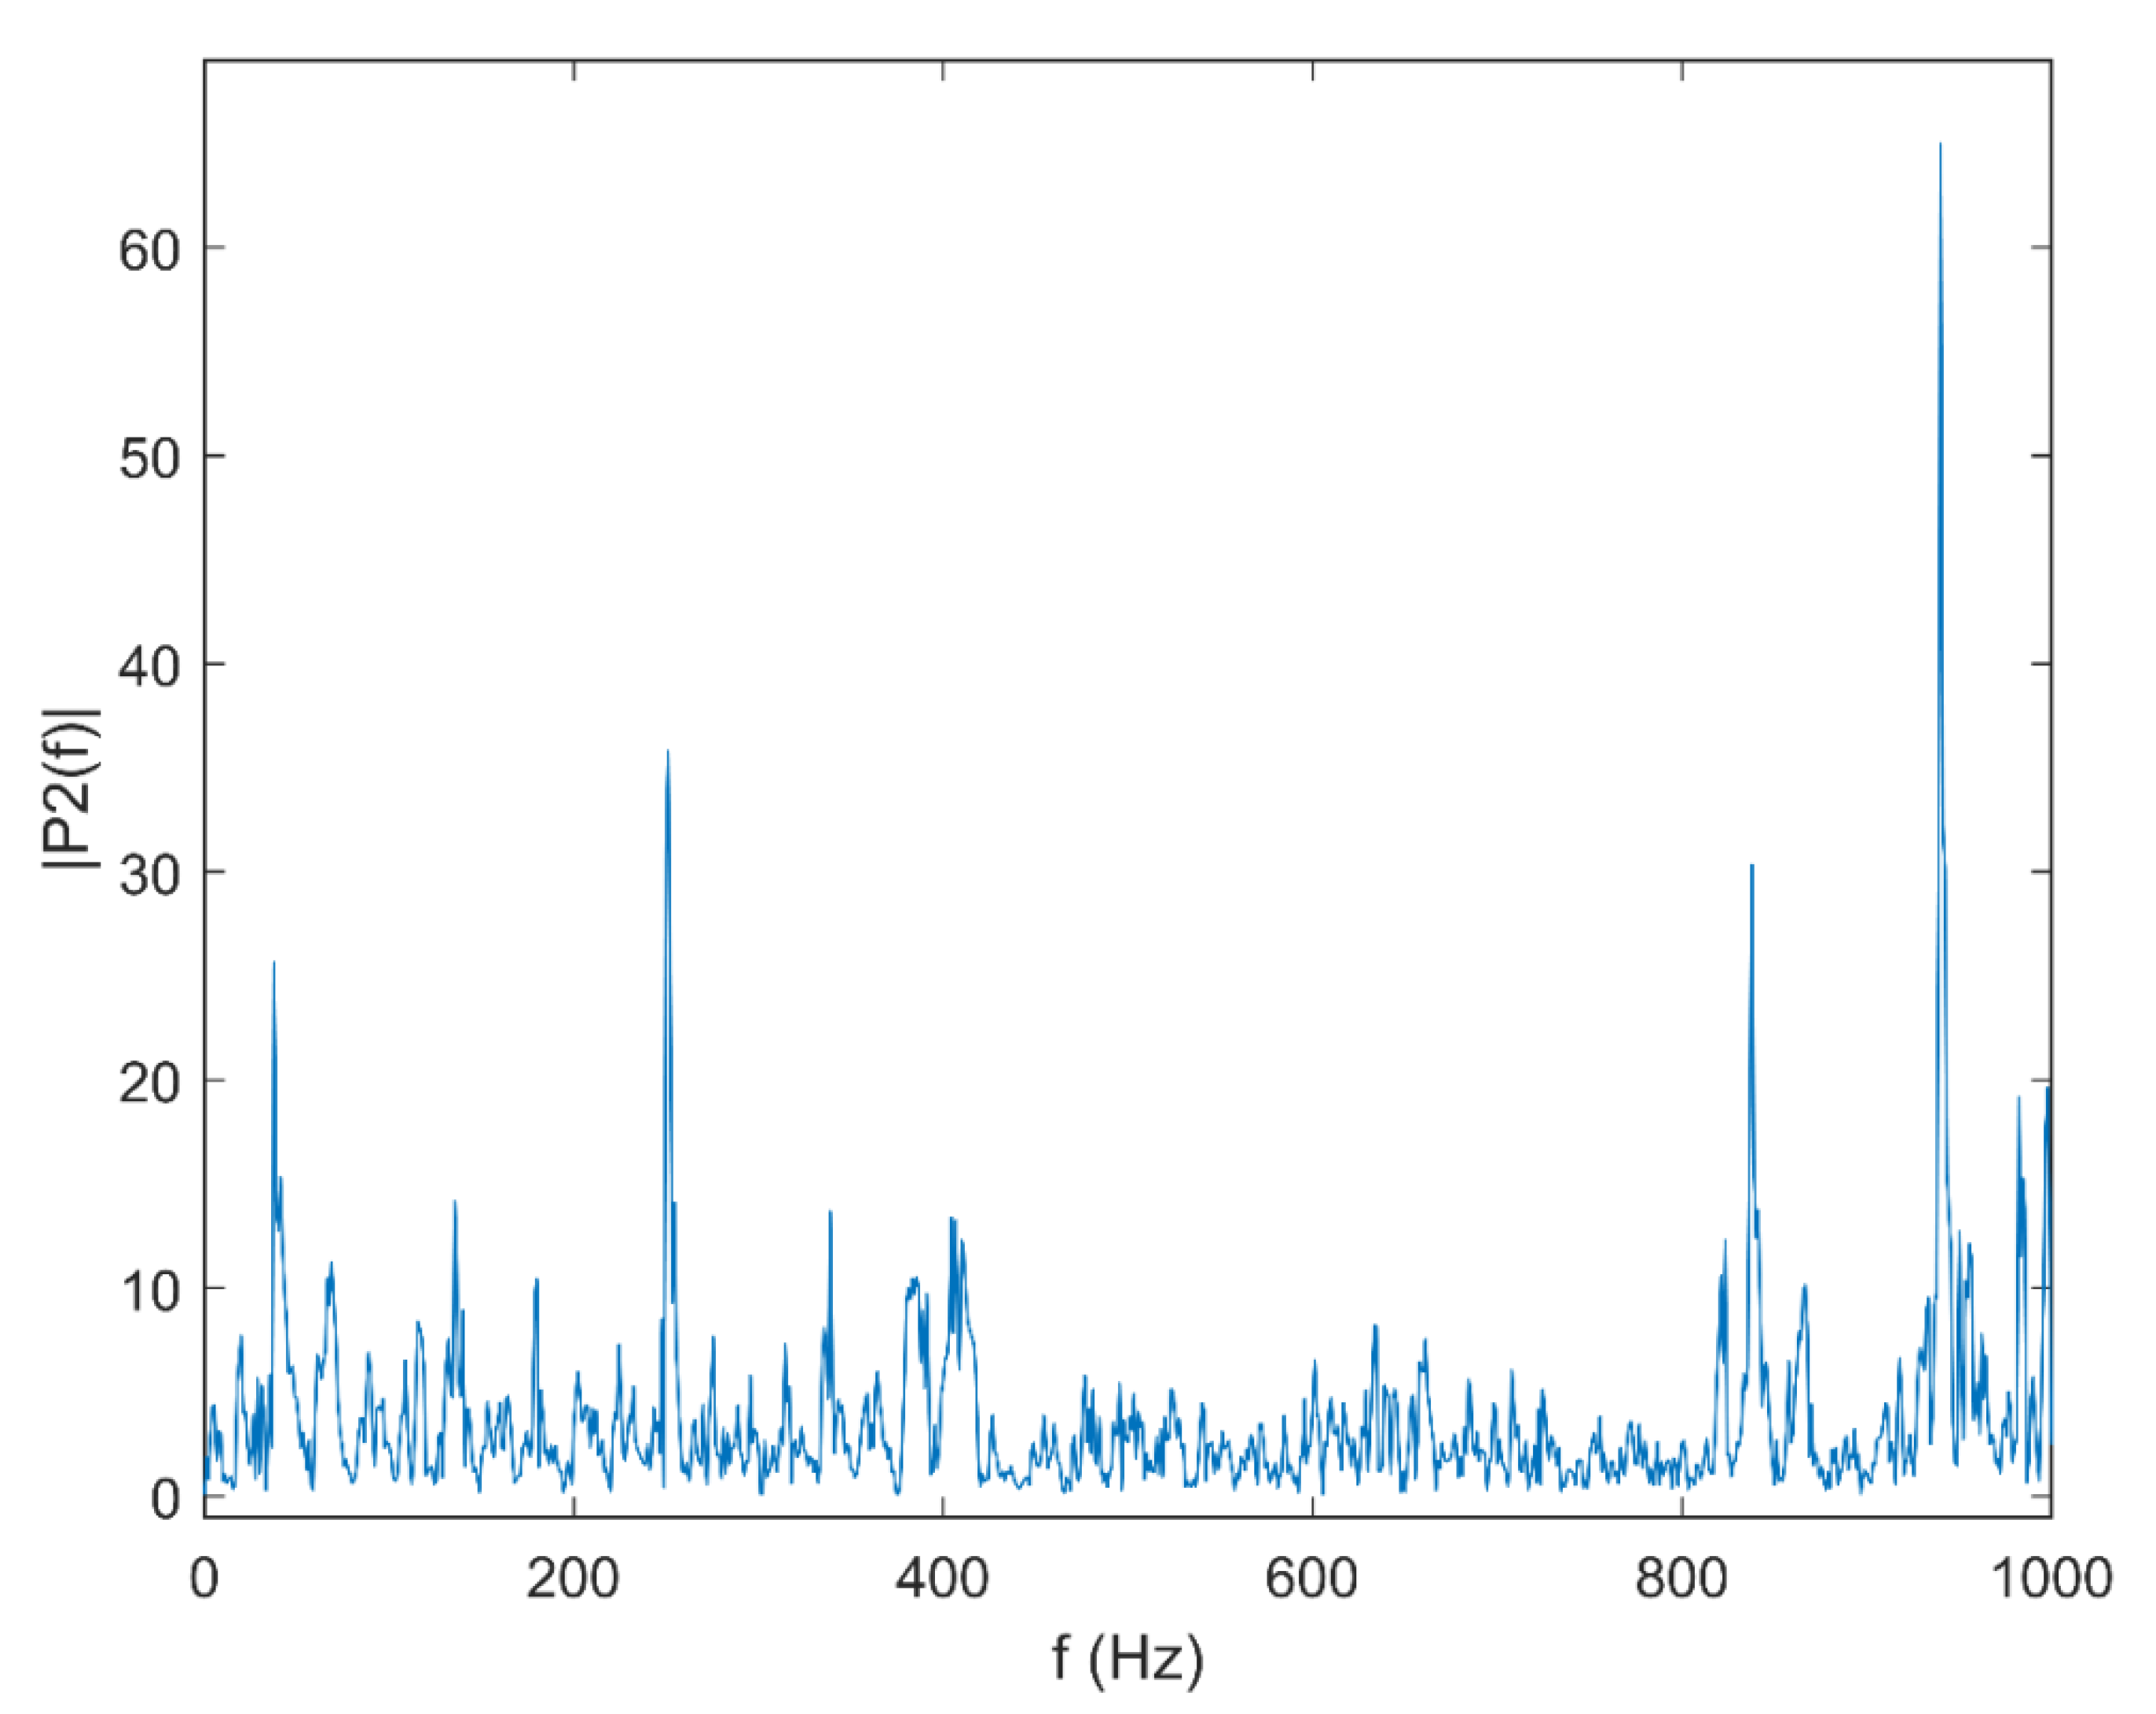
3.1. Vibration Response of the Bearers
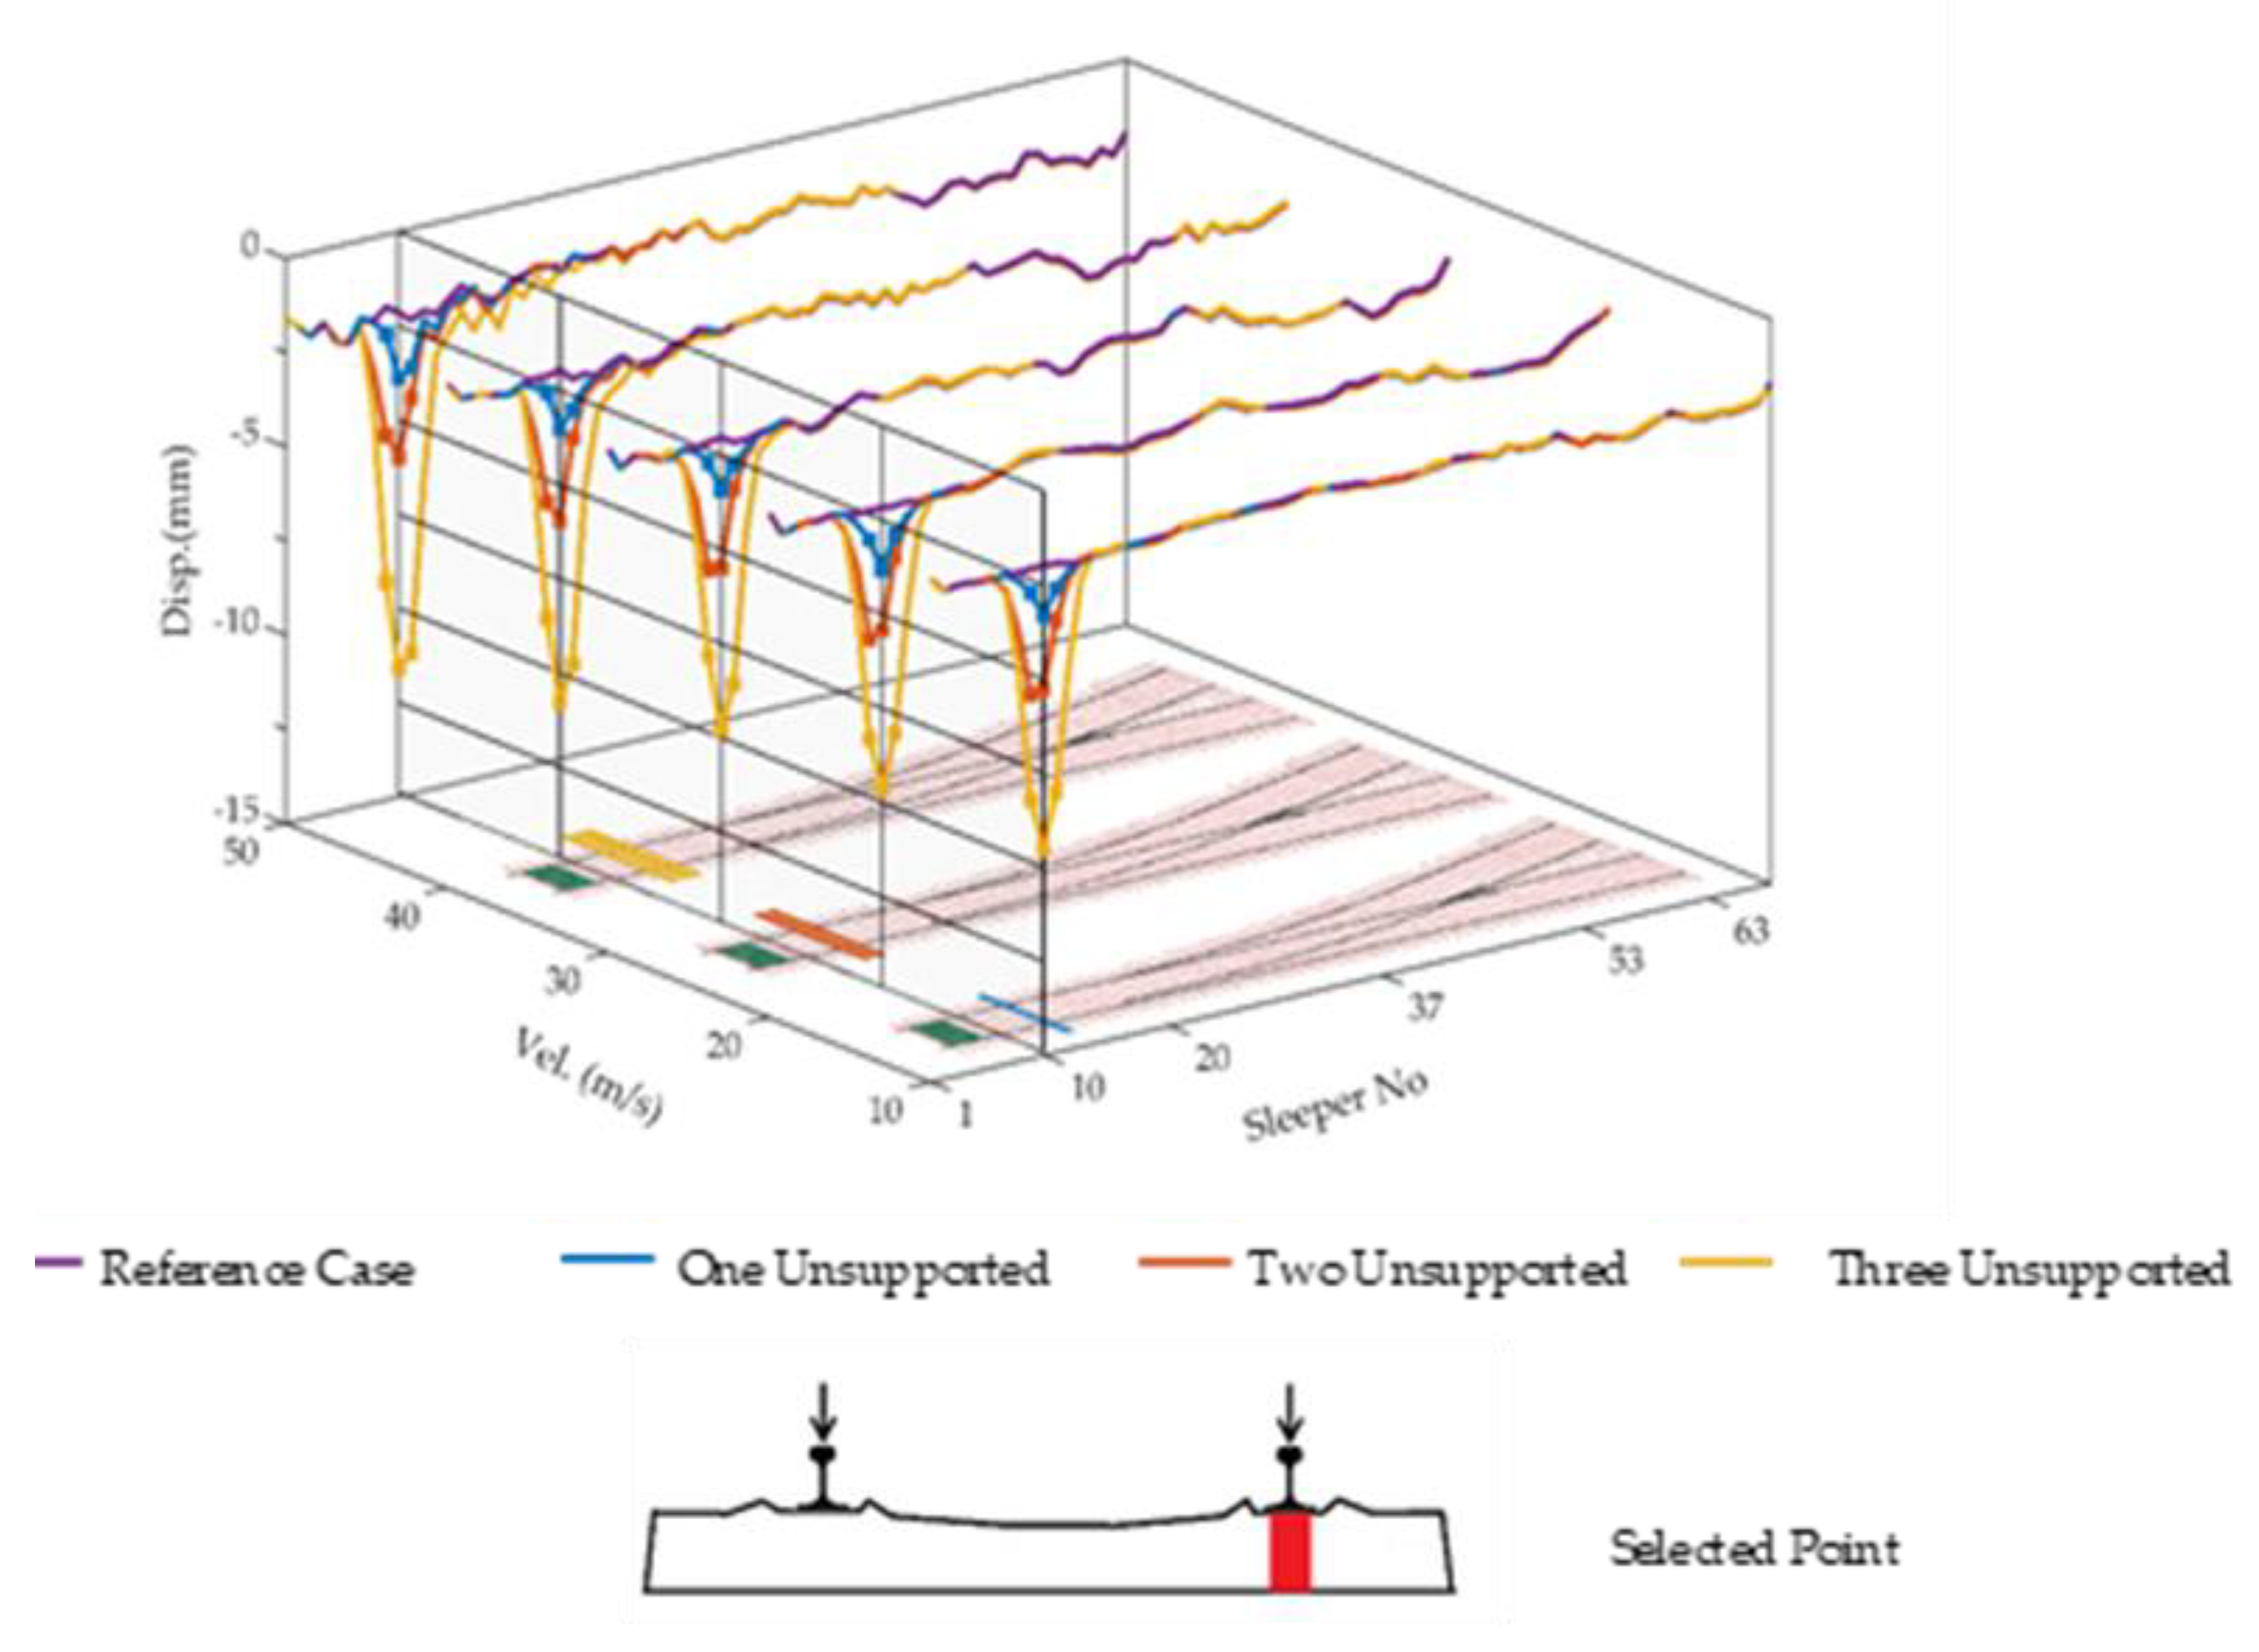
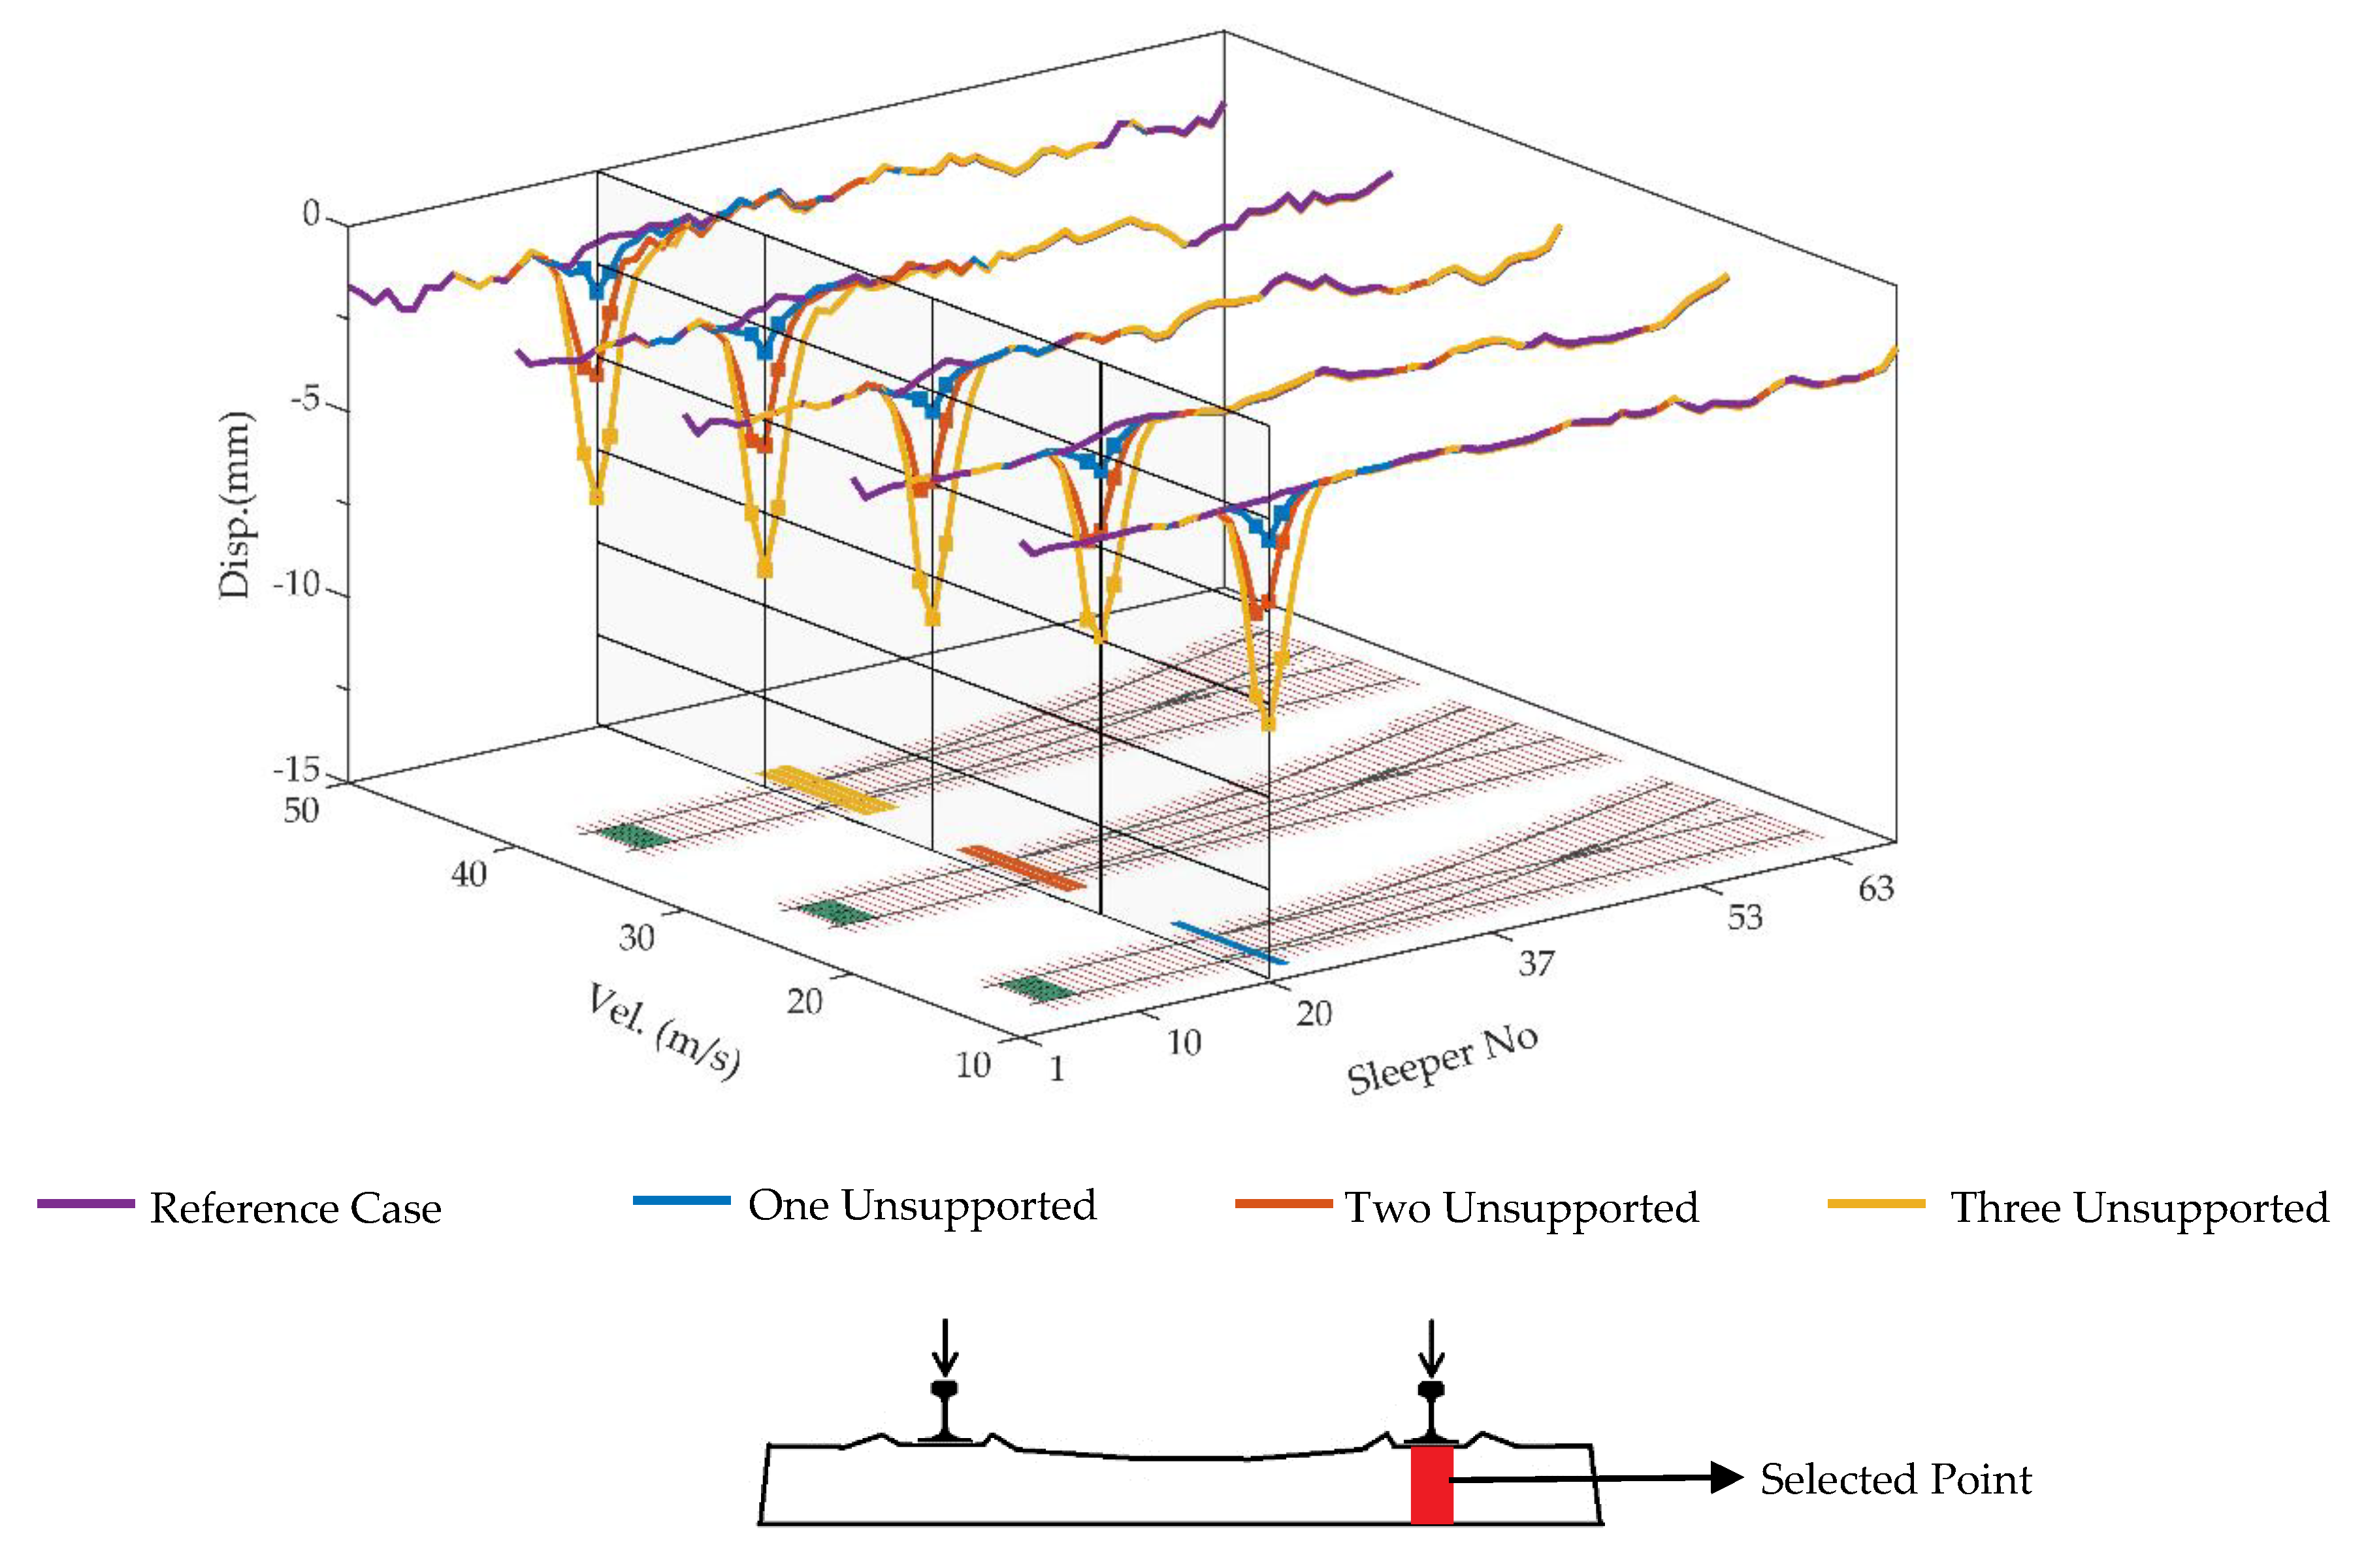
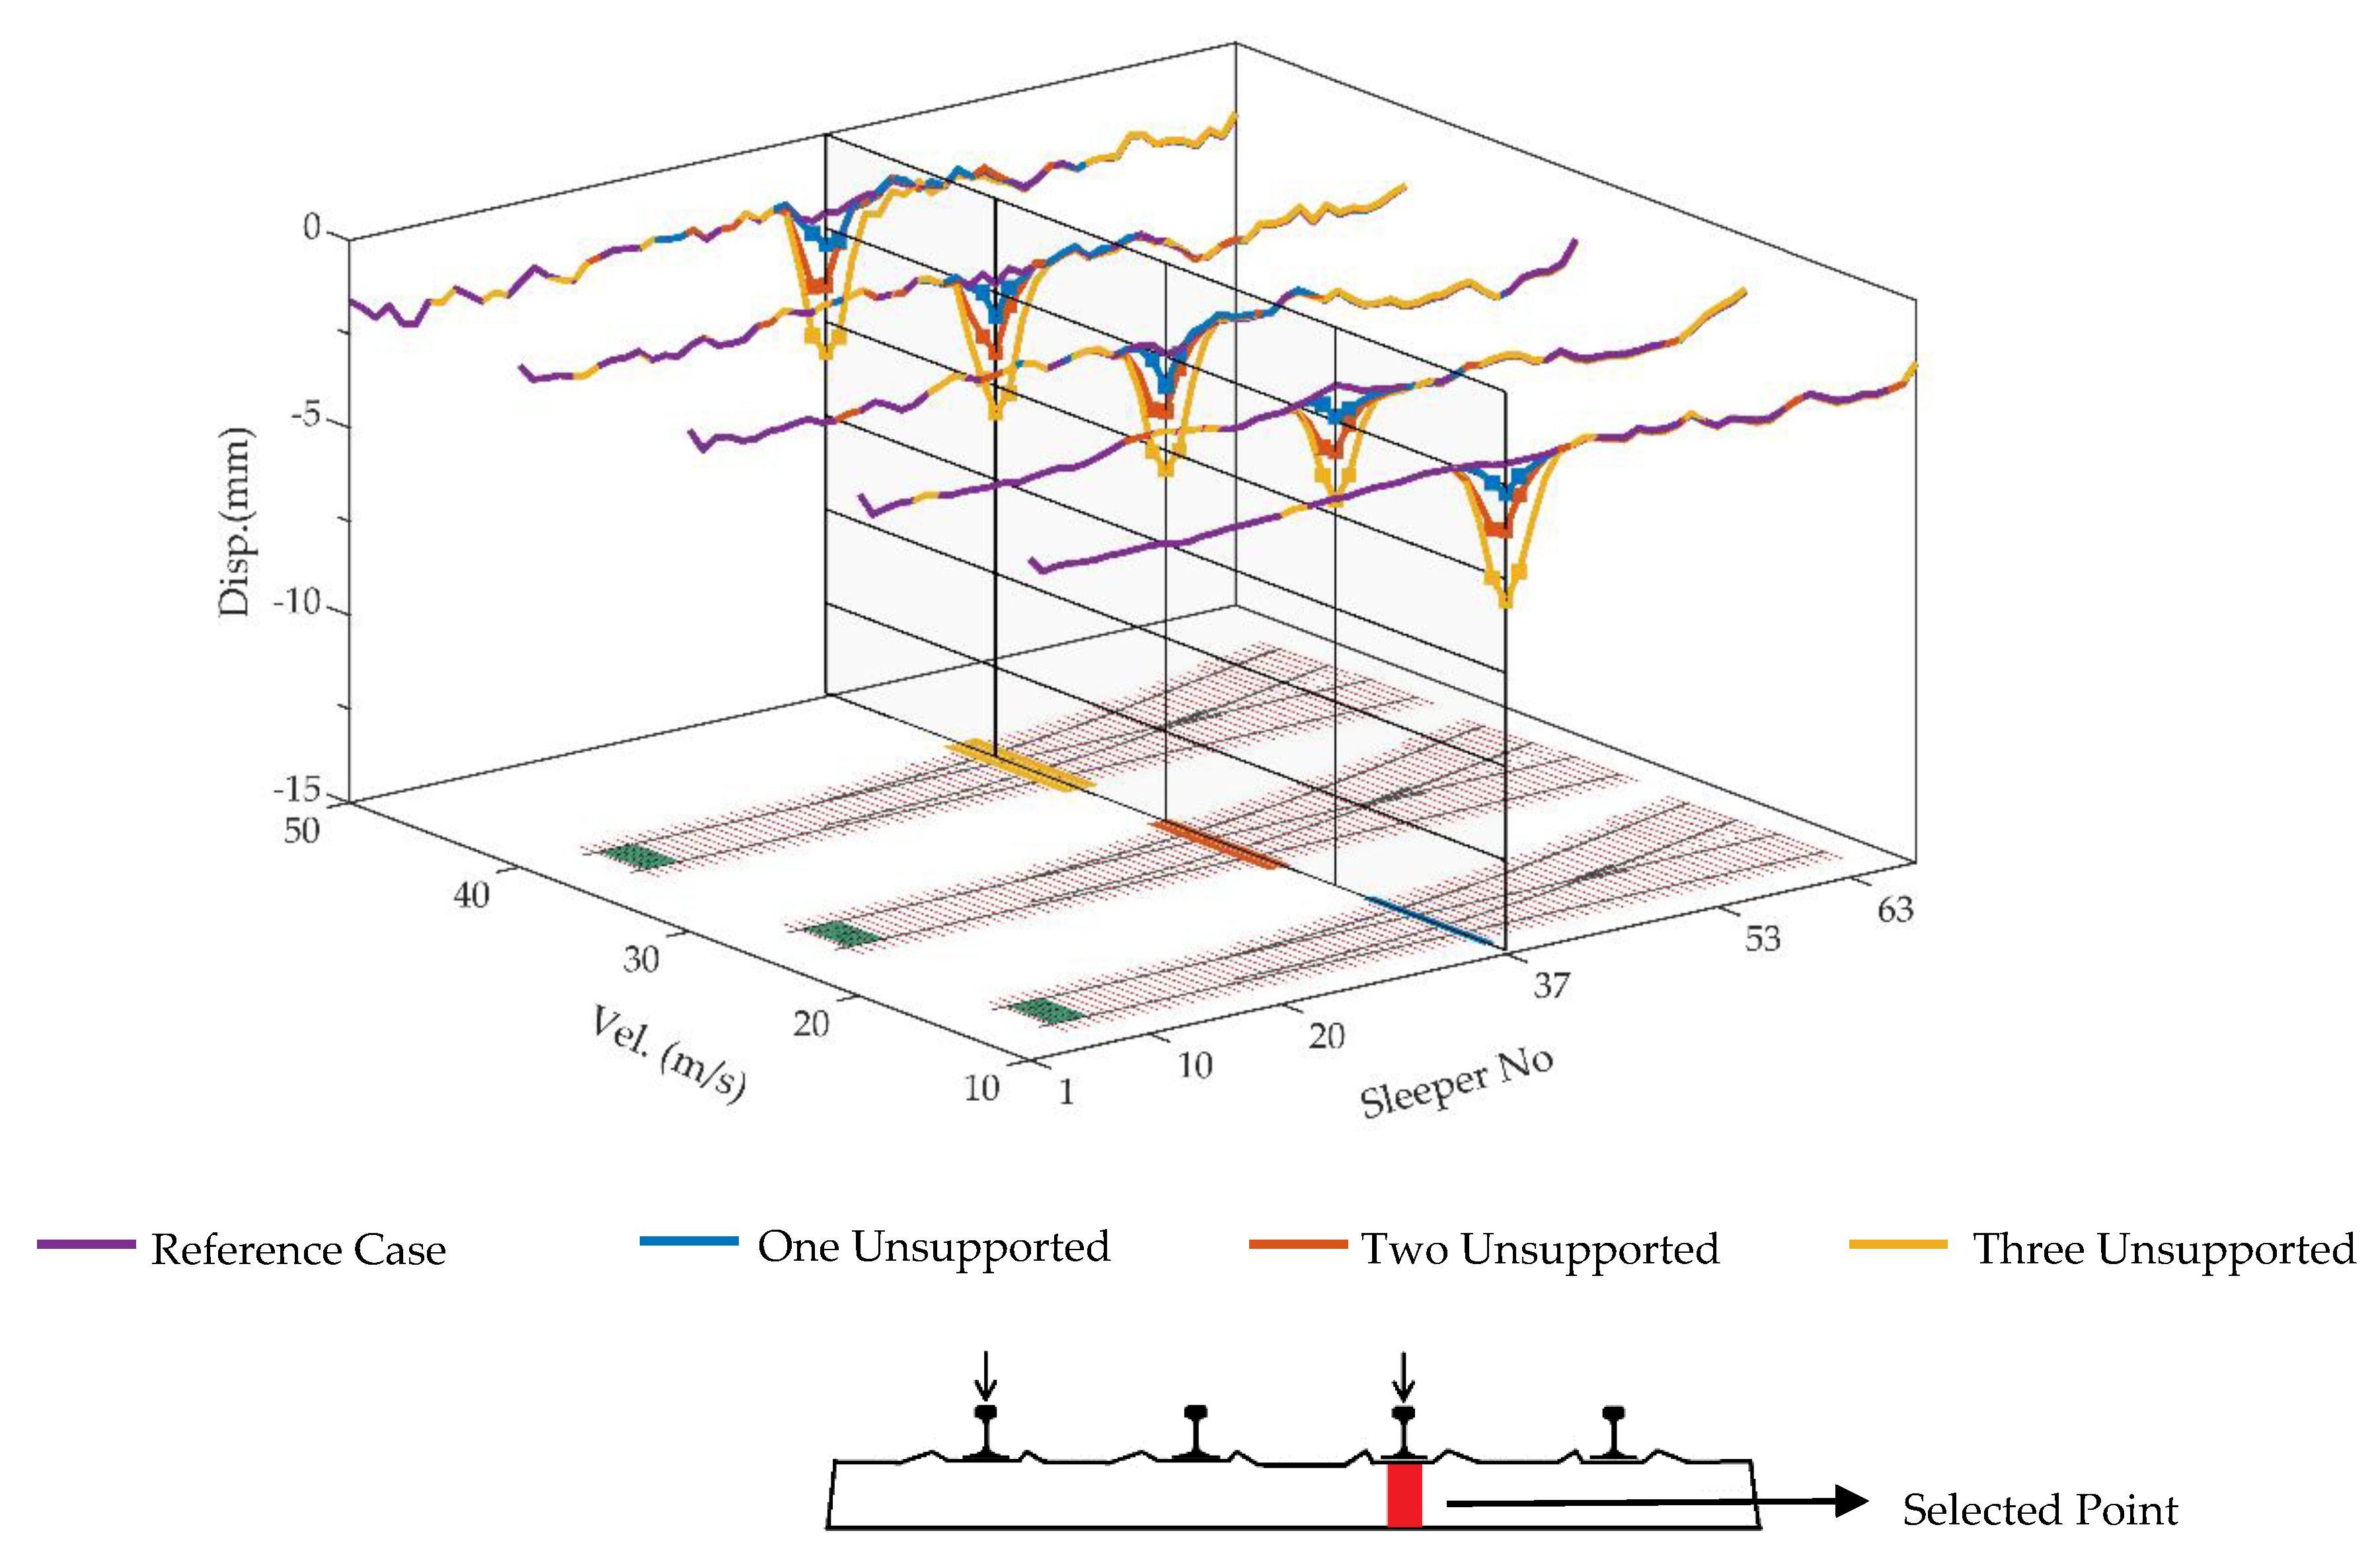
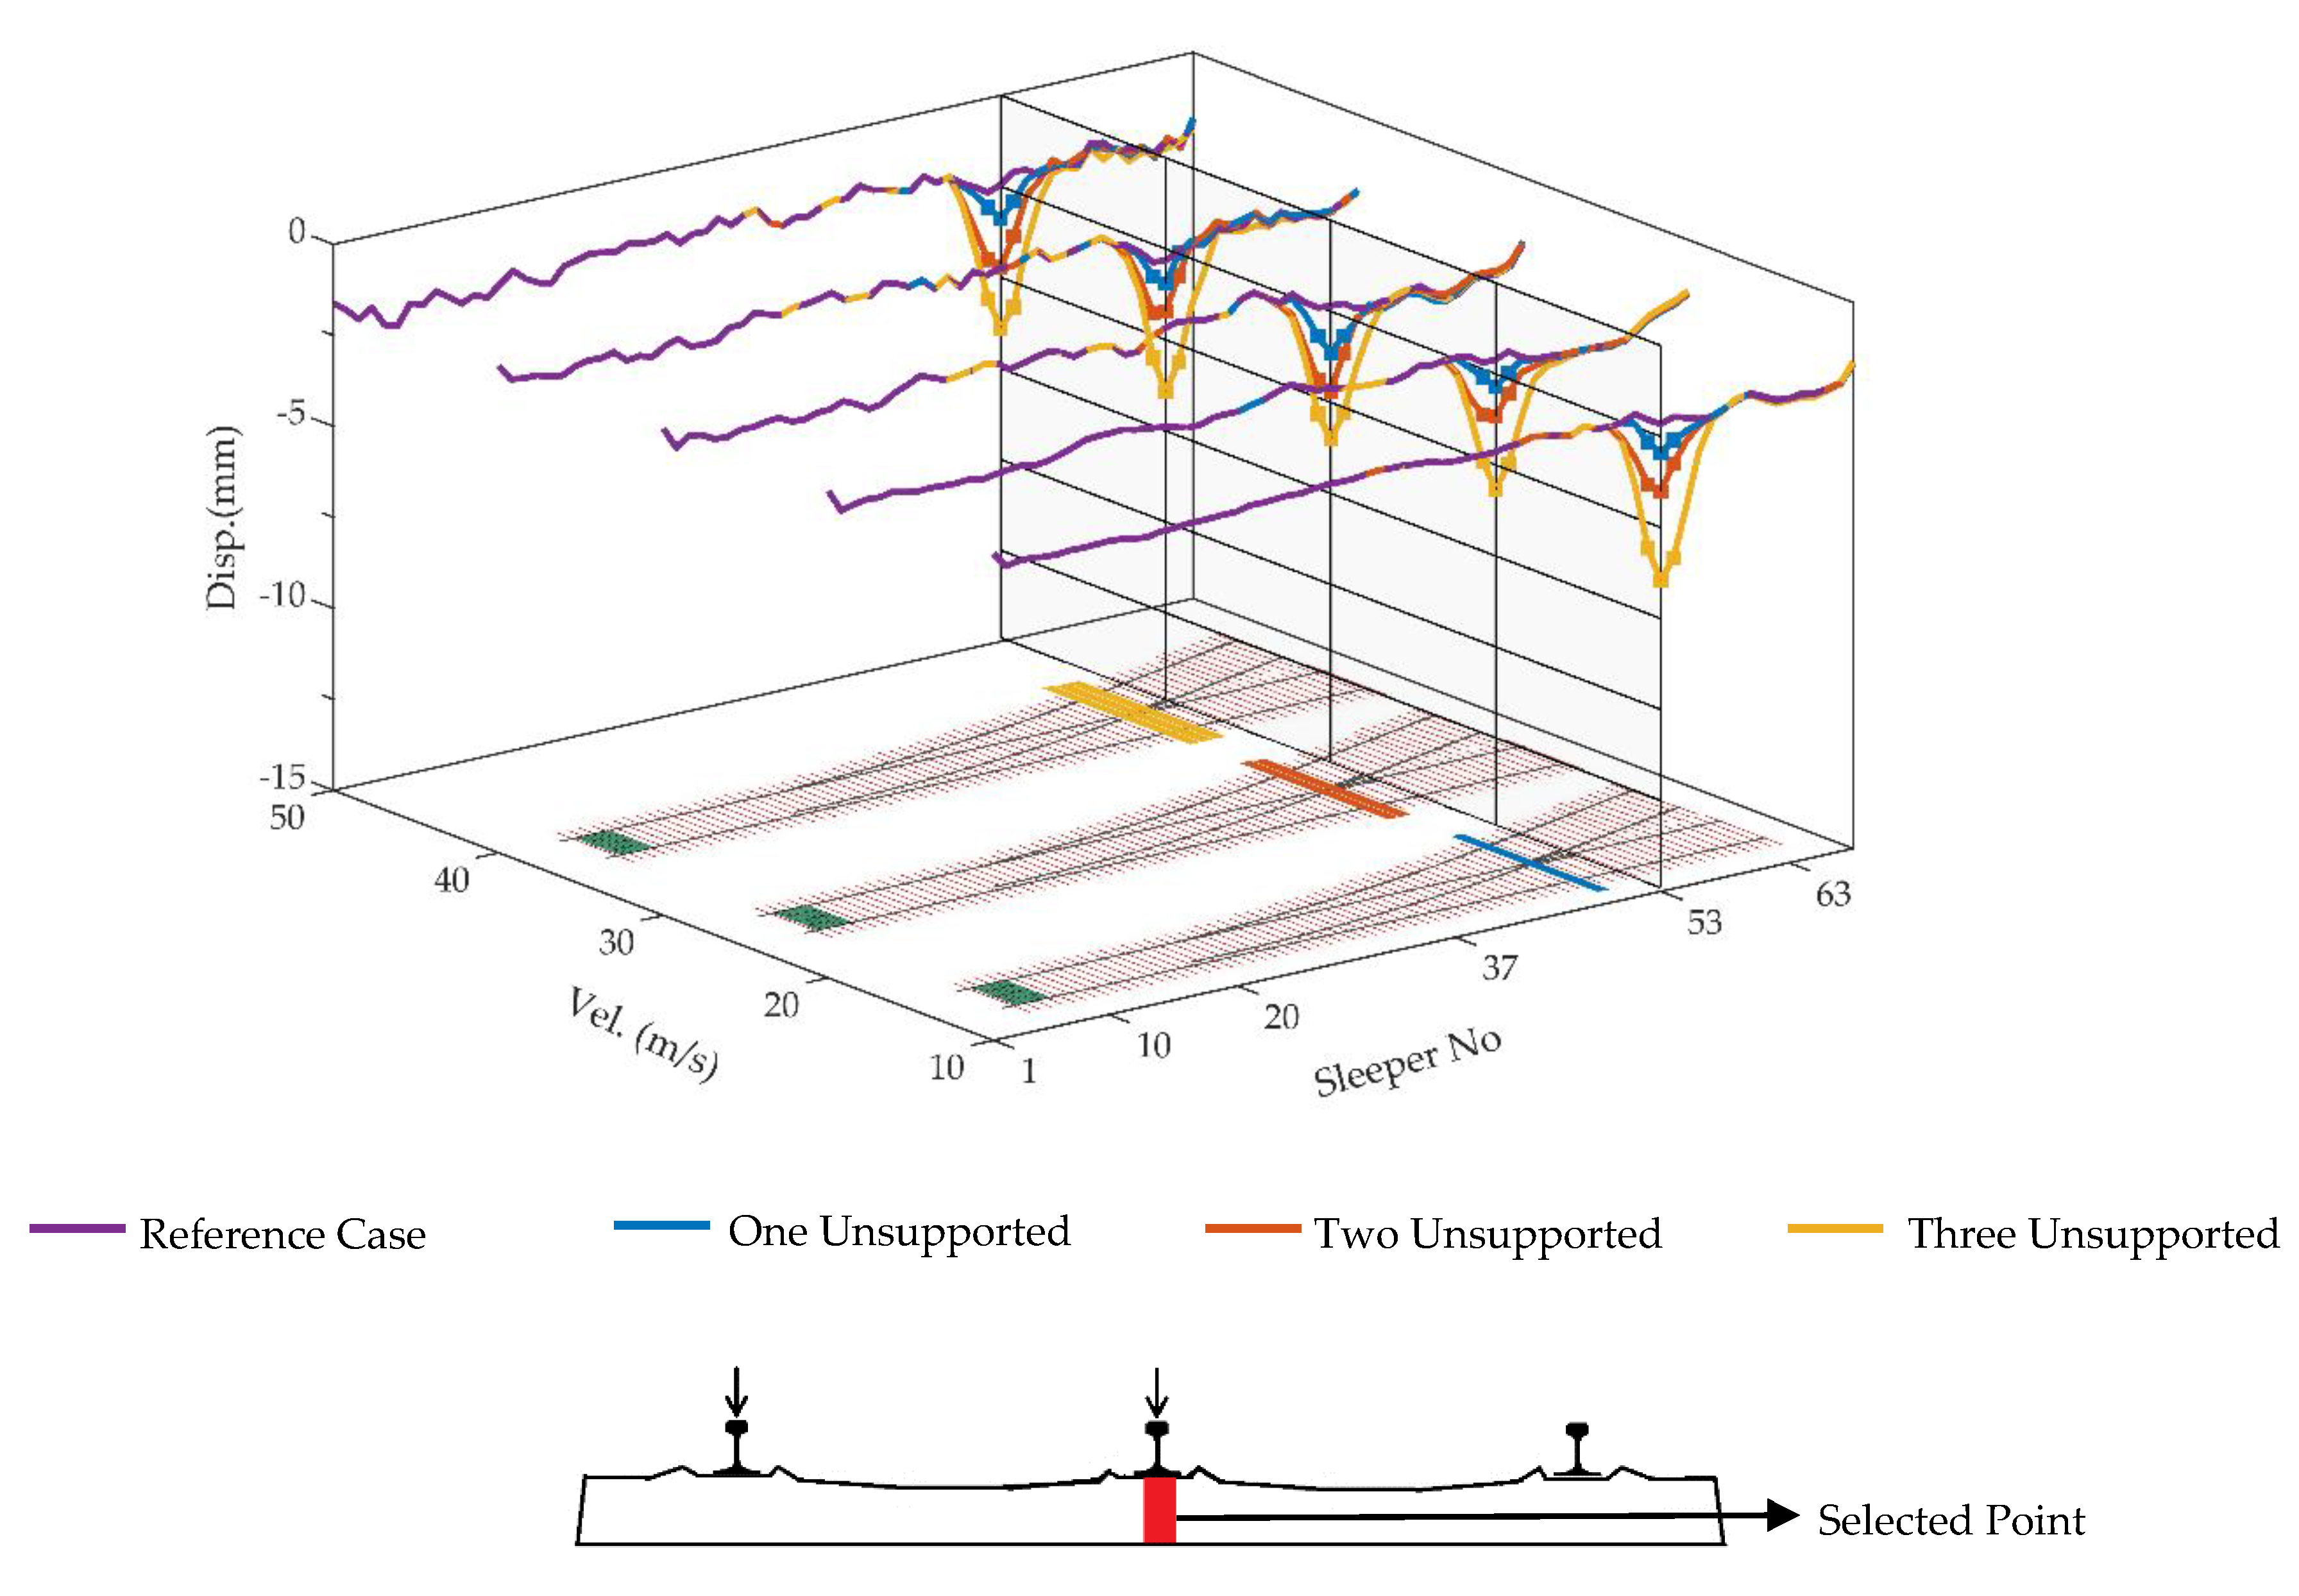
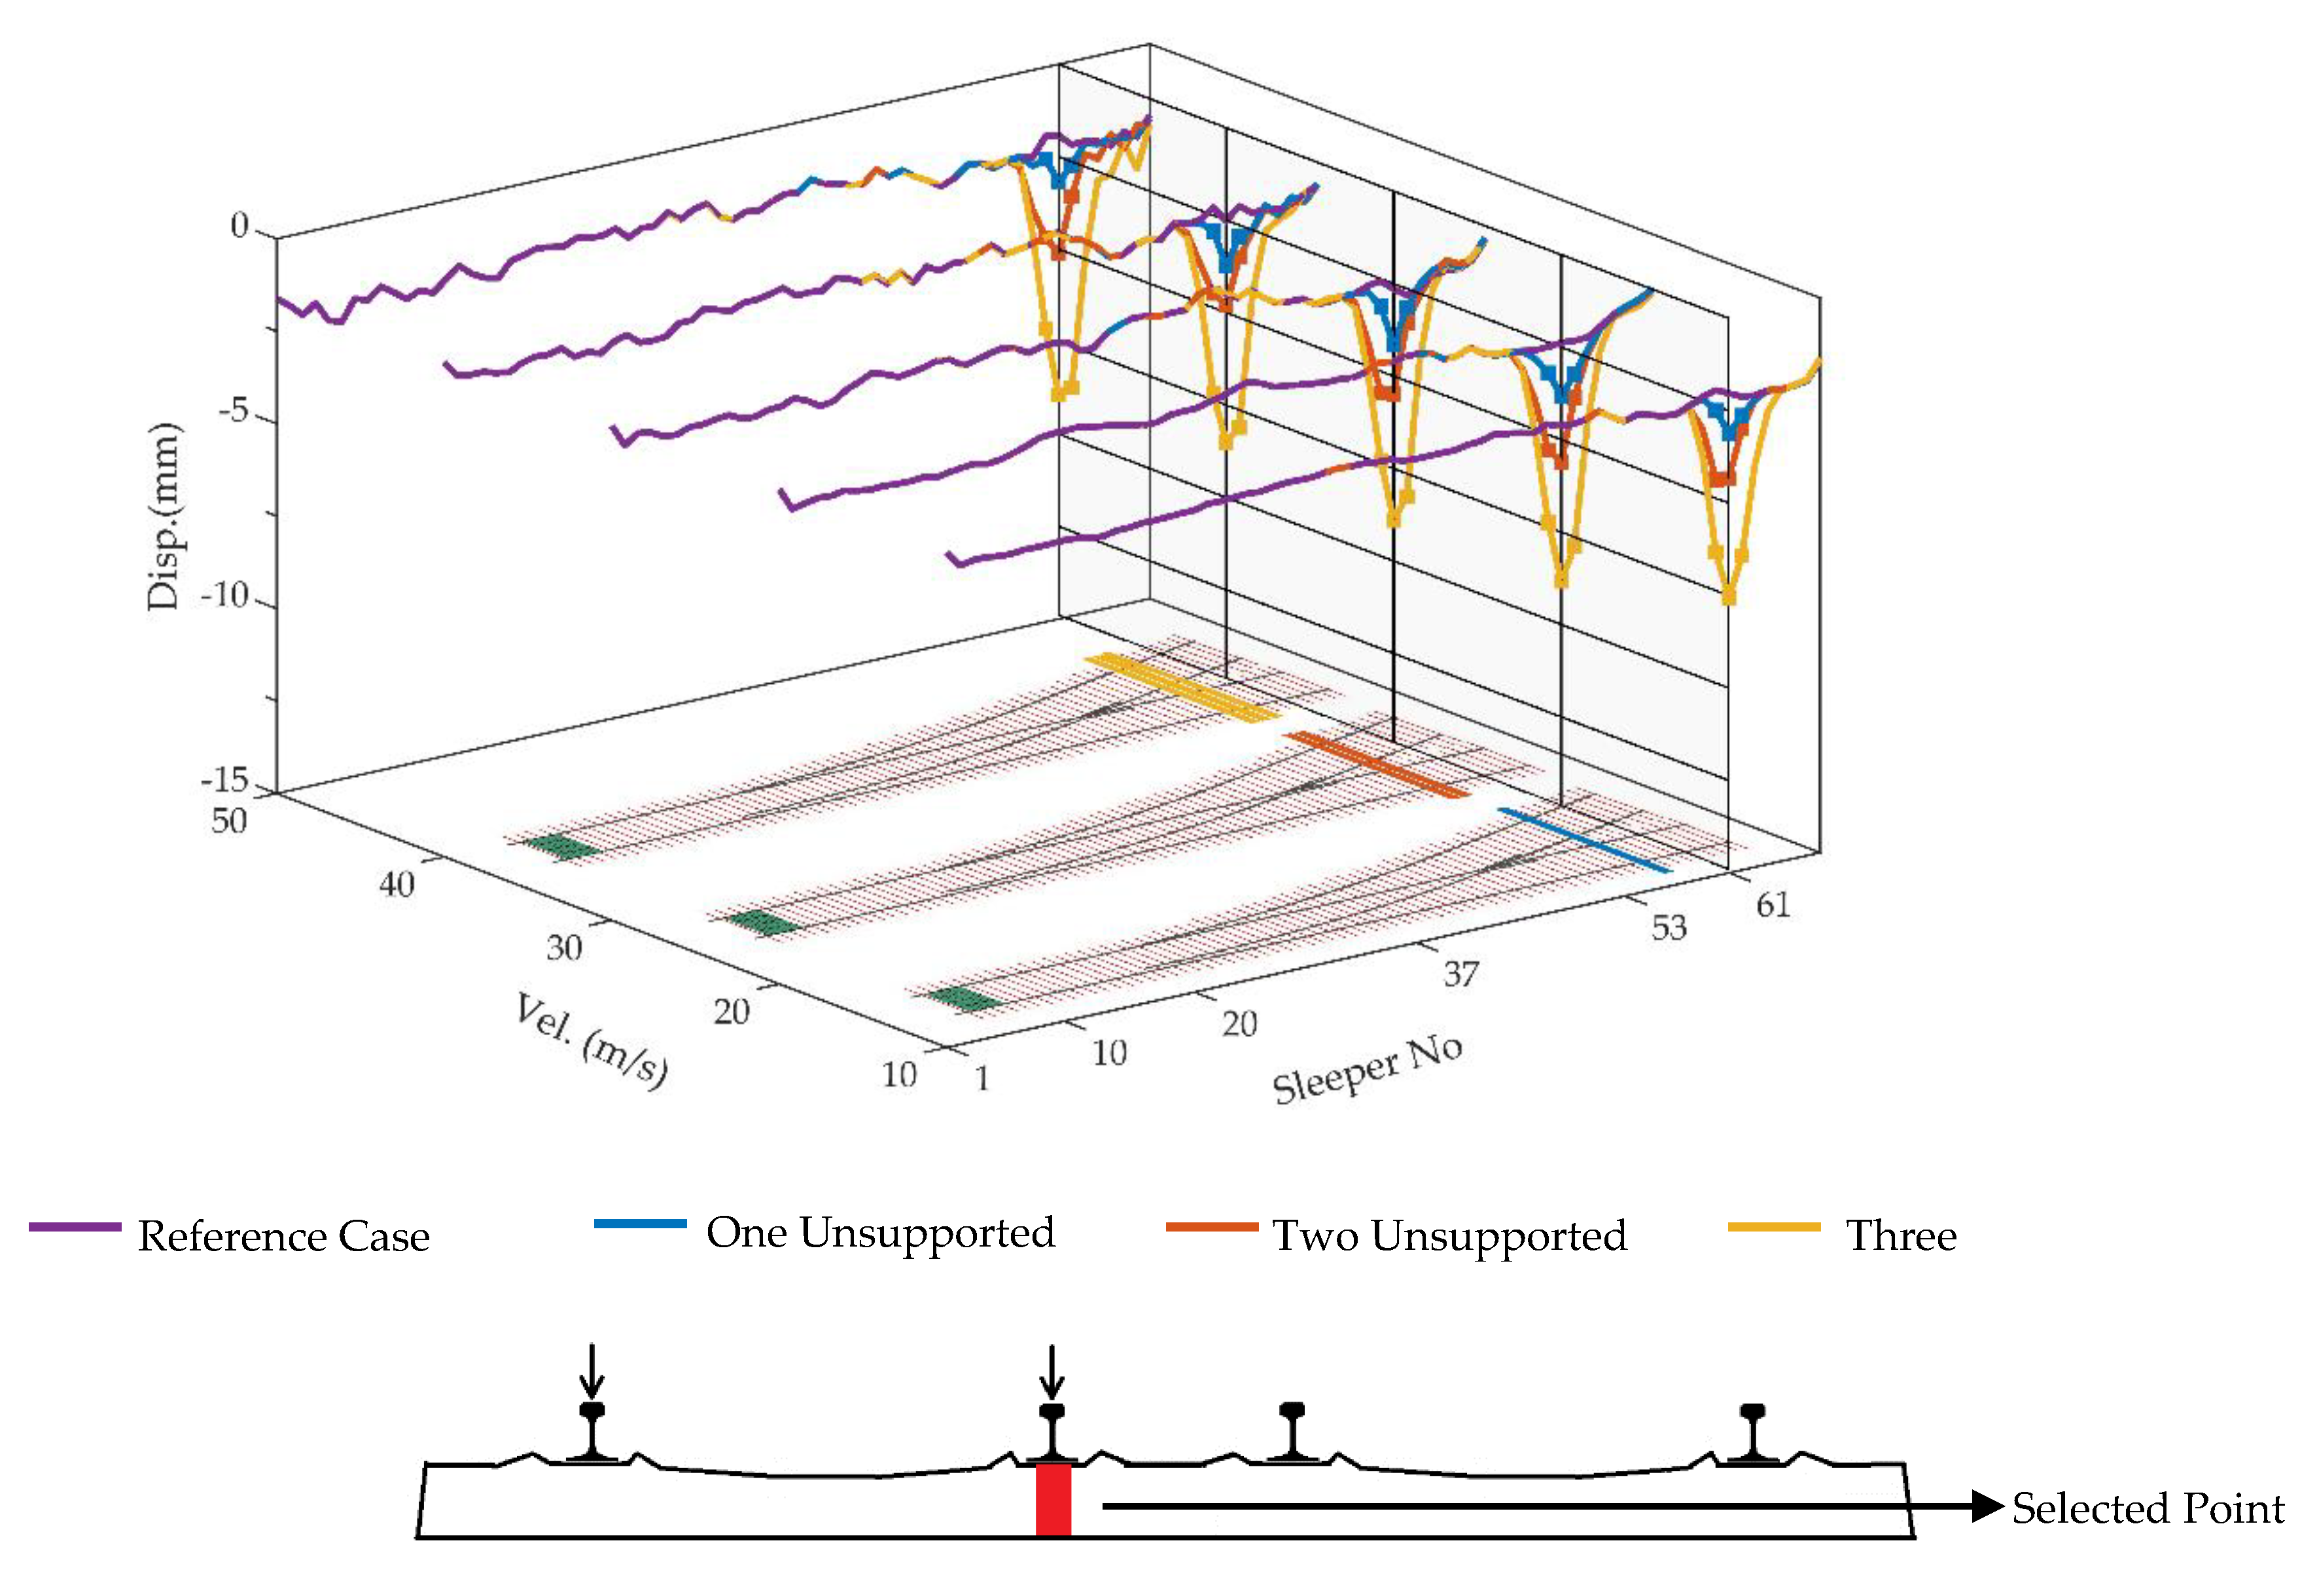
3.2. Bearer Displacement at Rail Seats
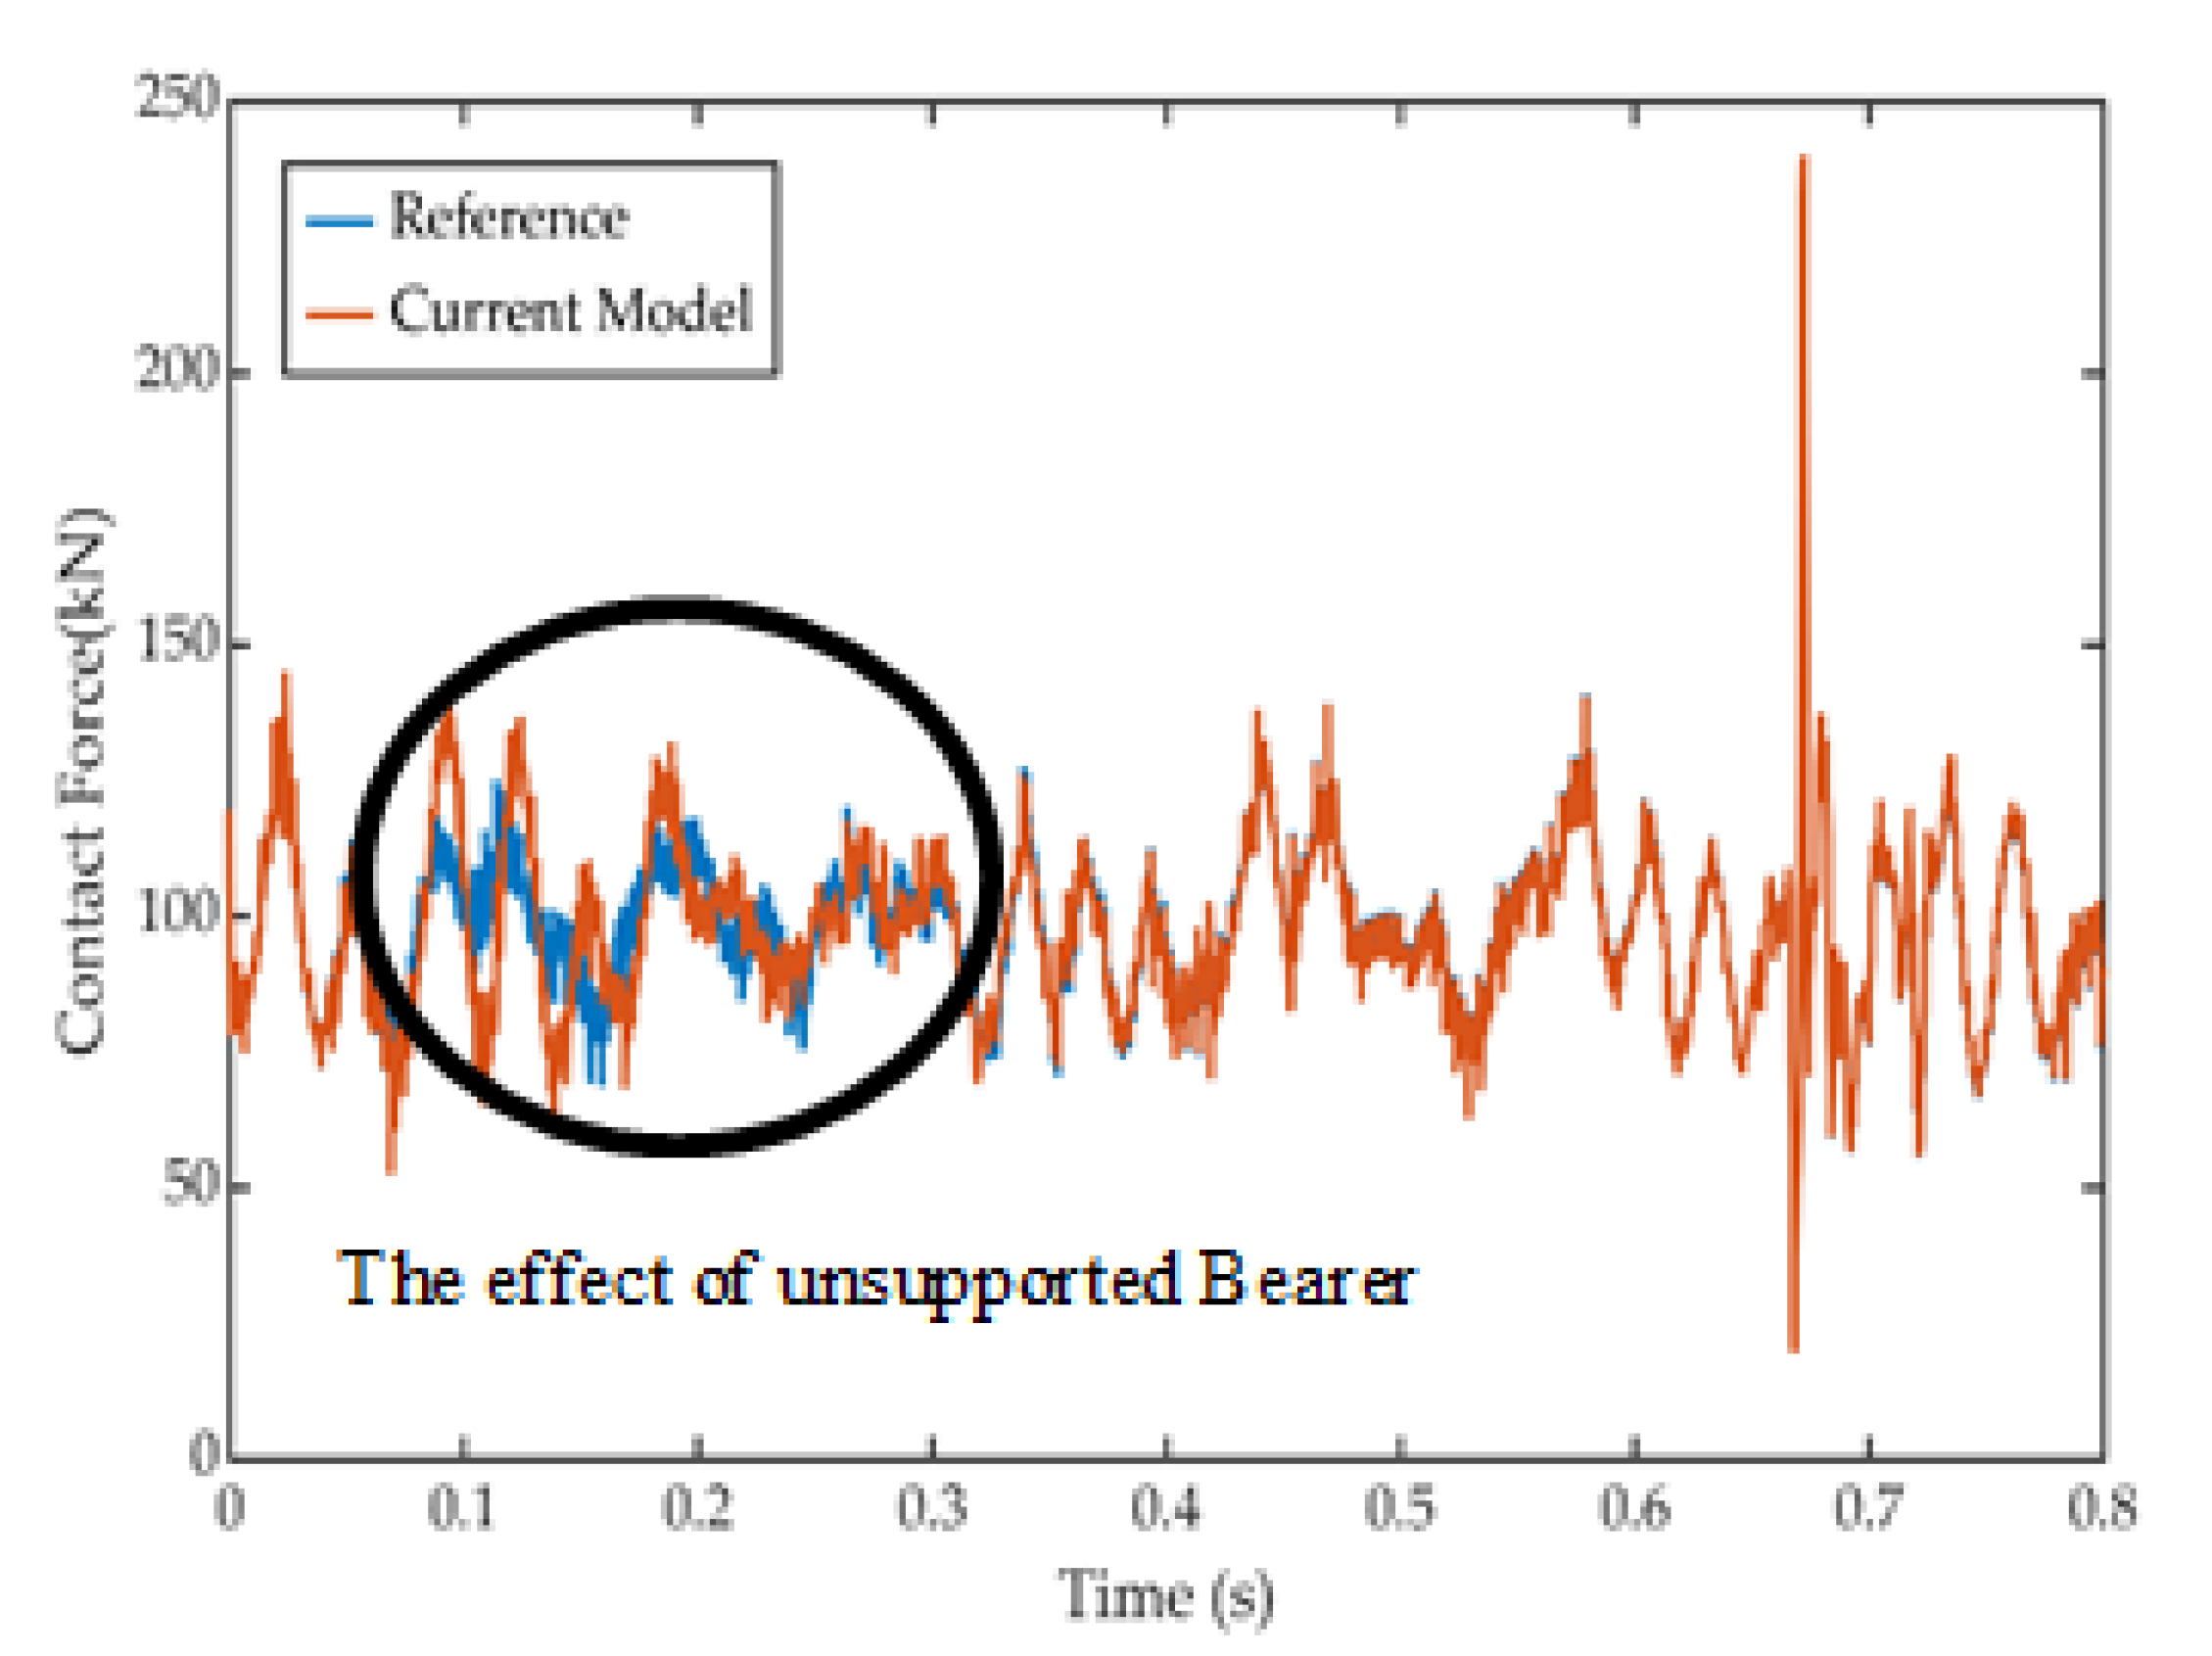
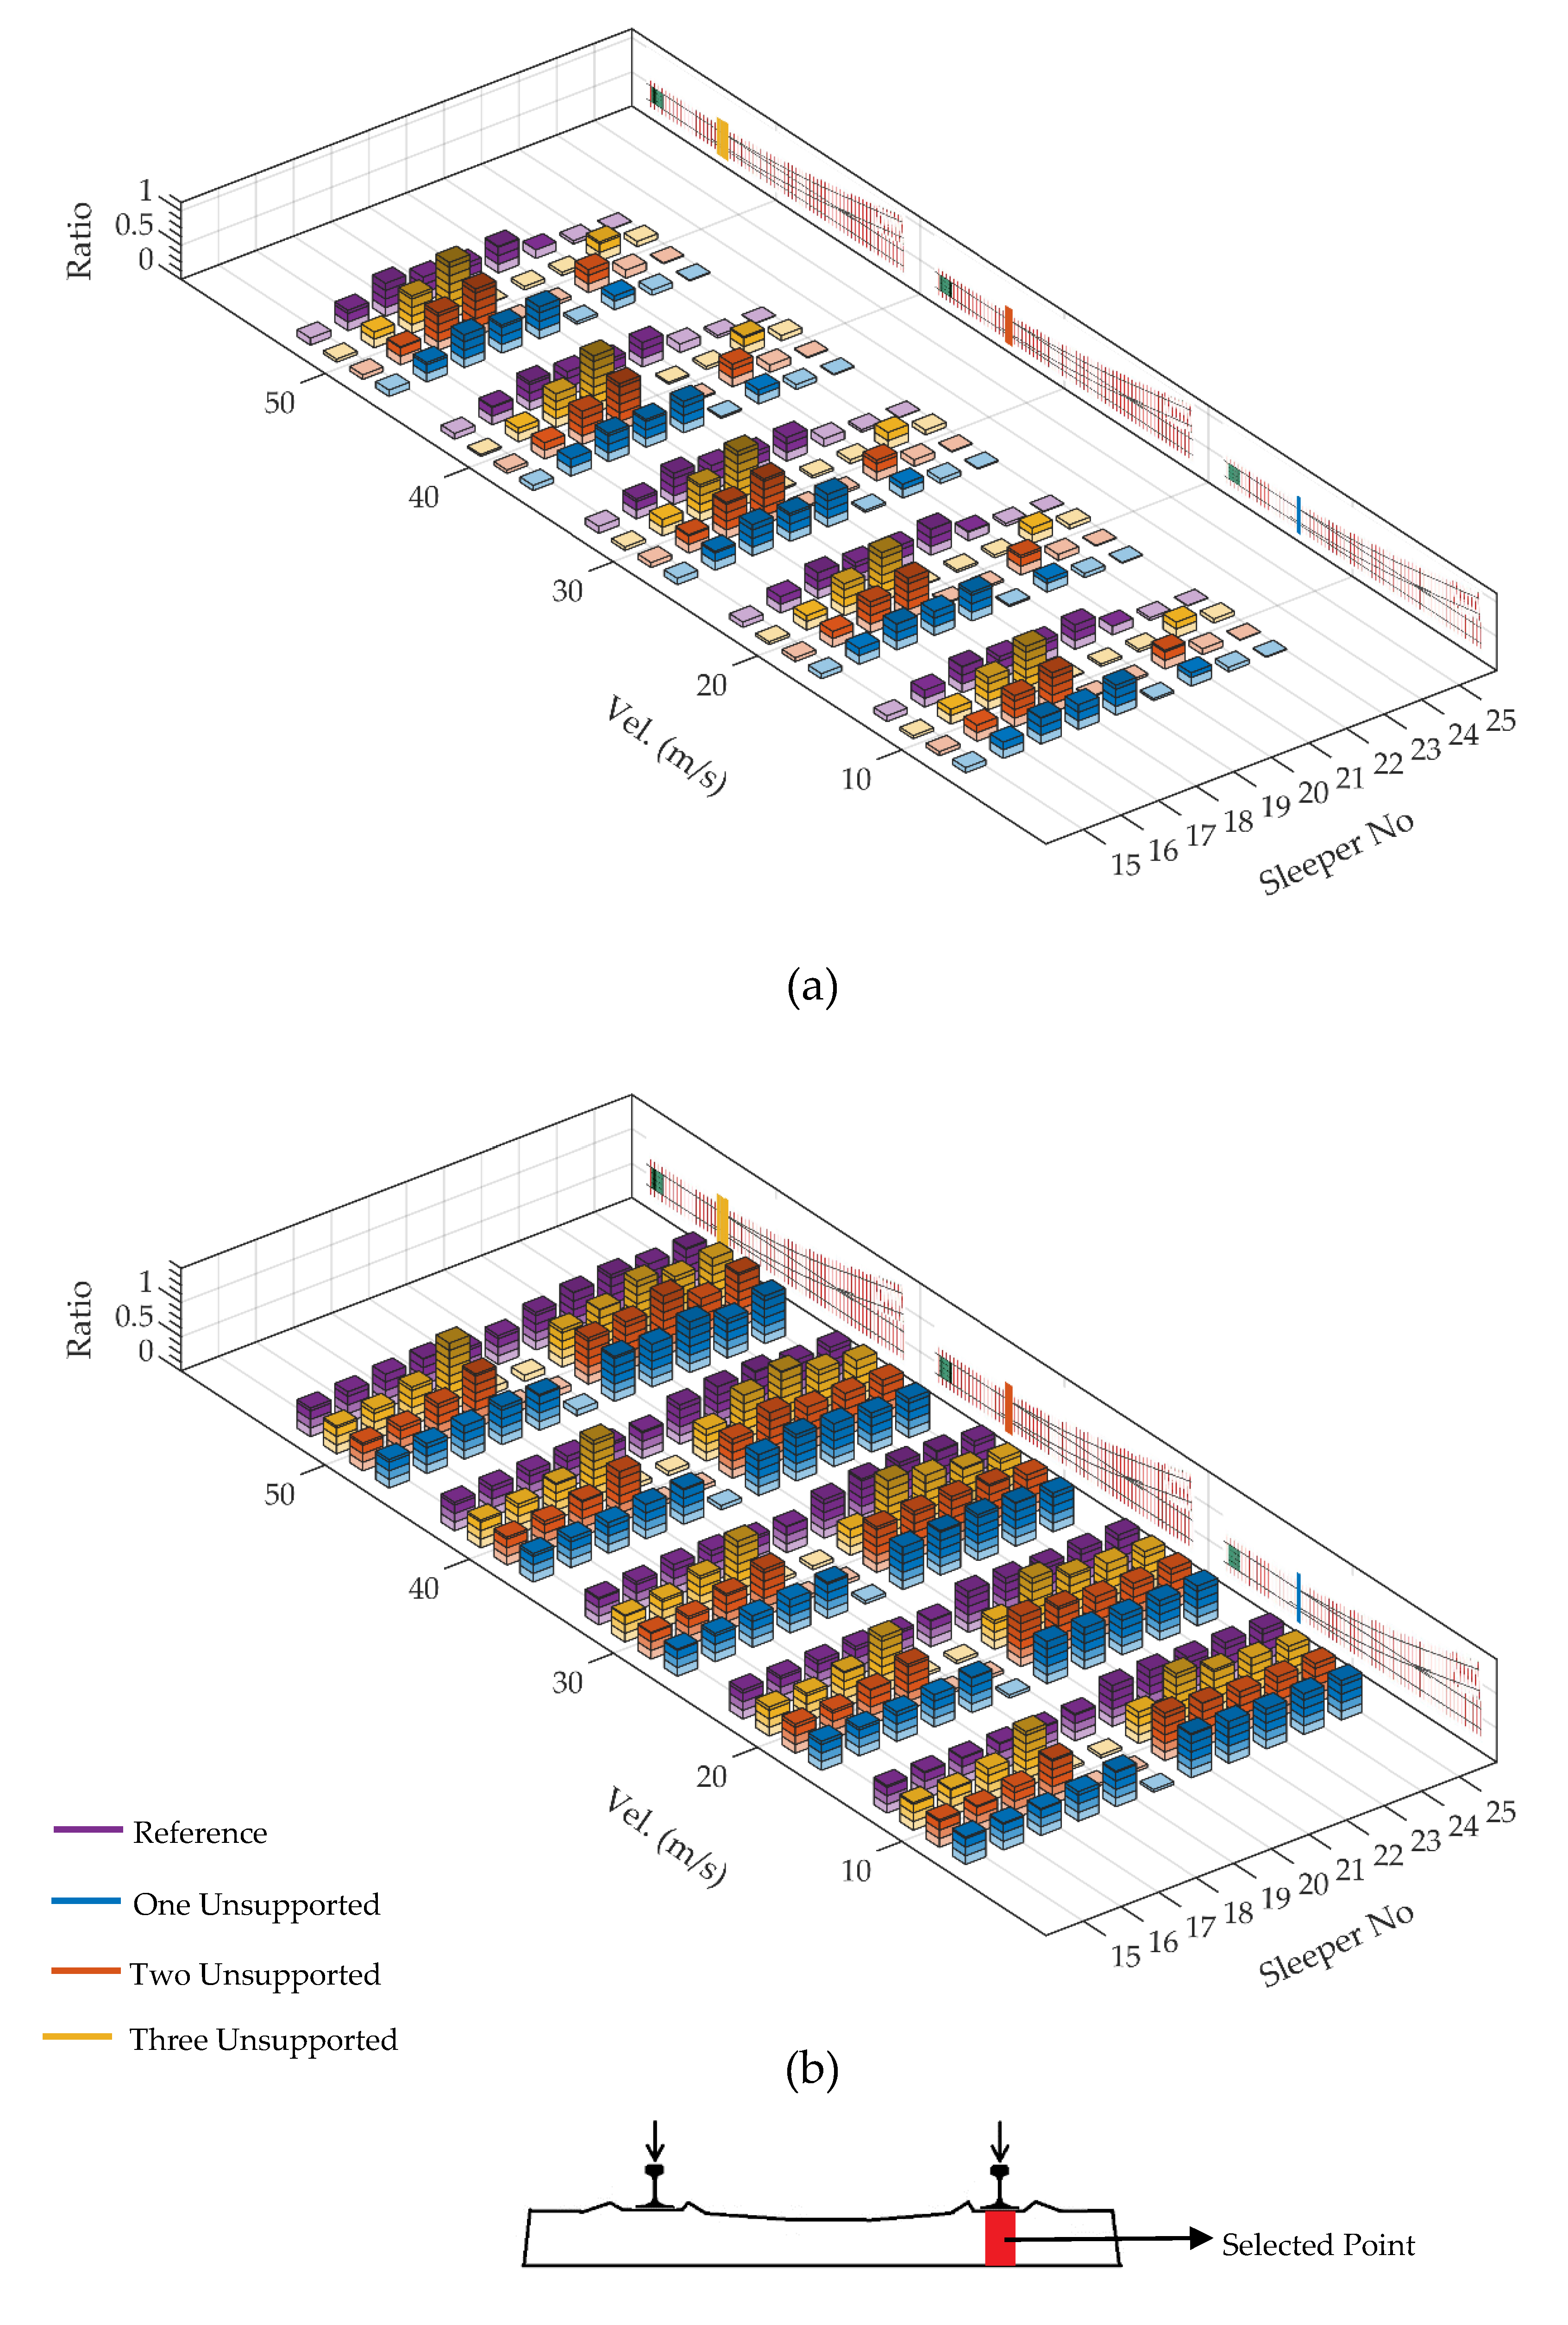
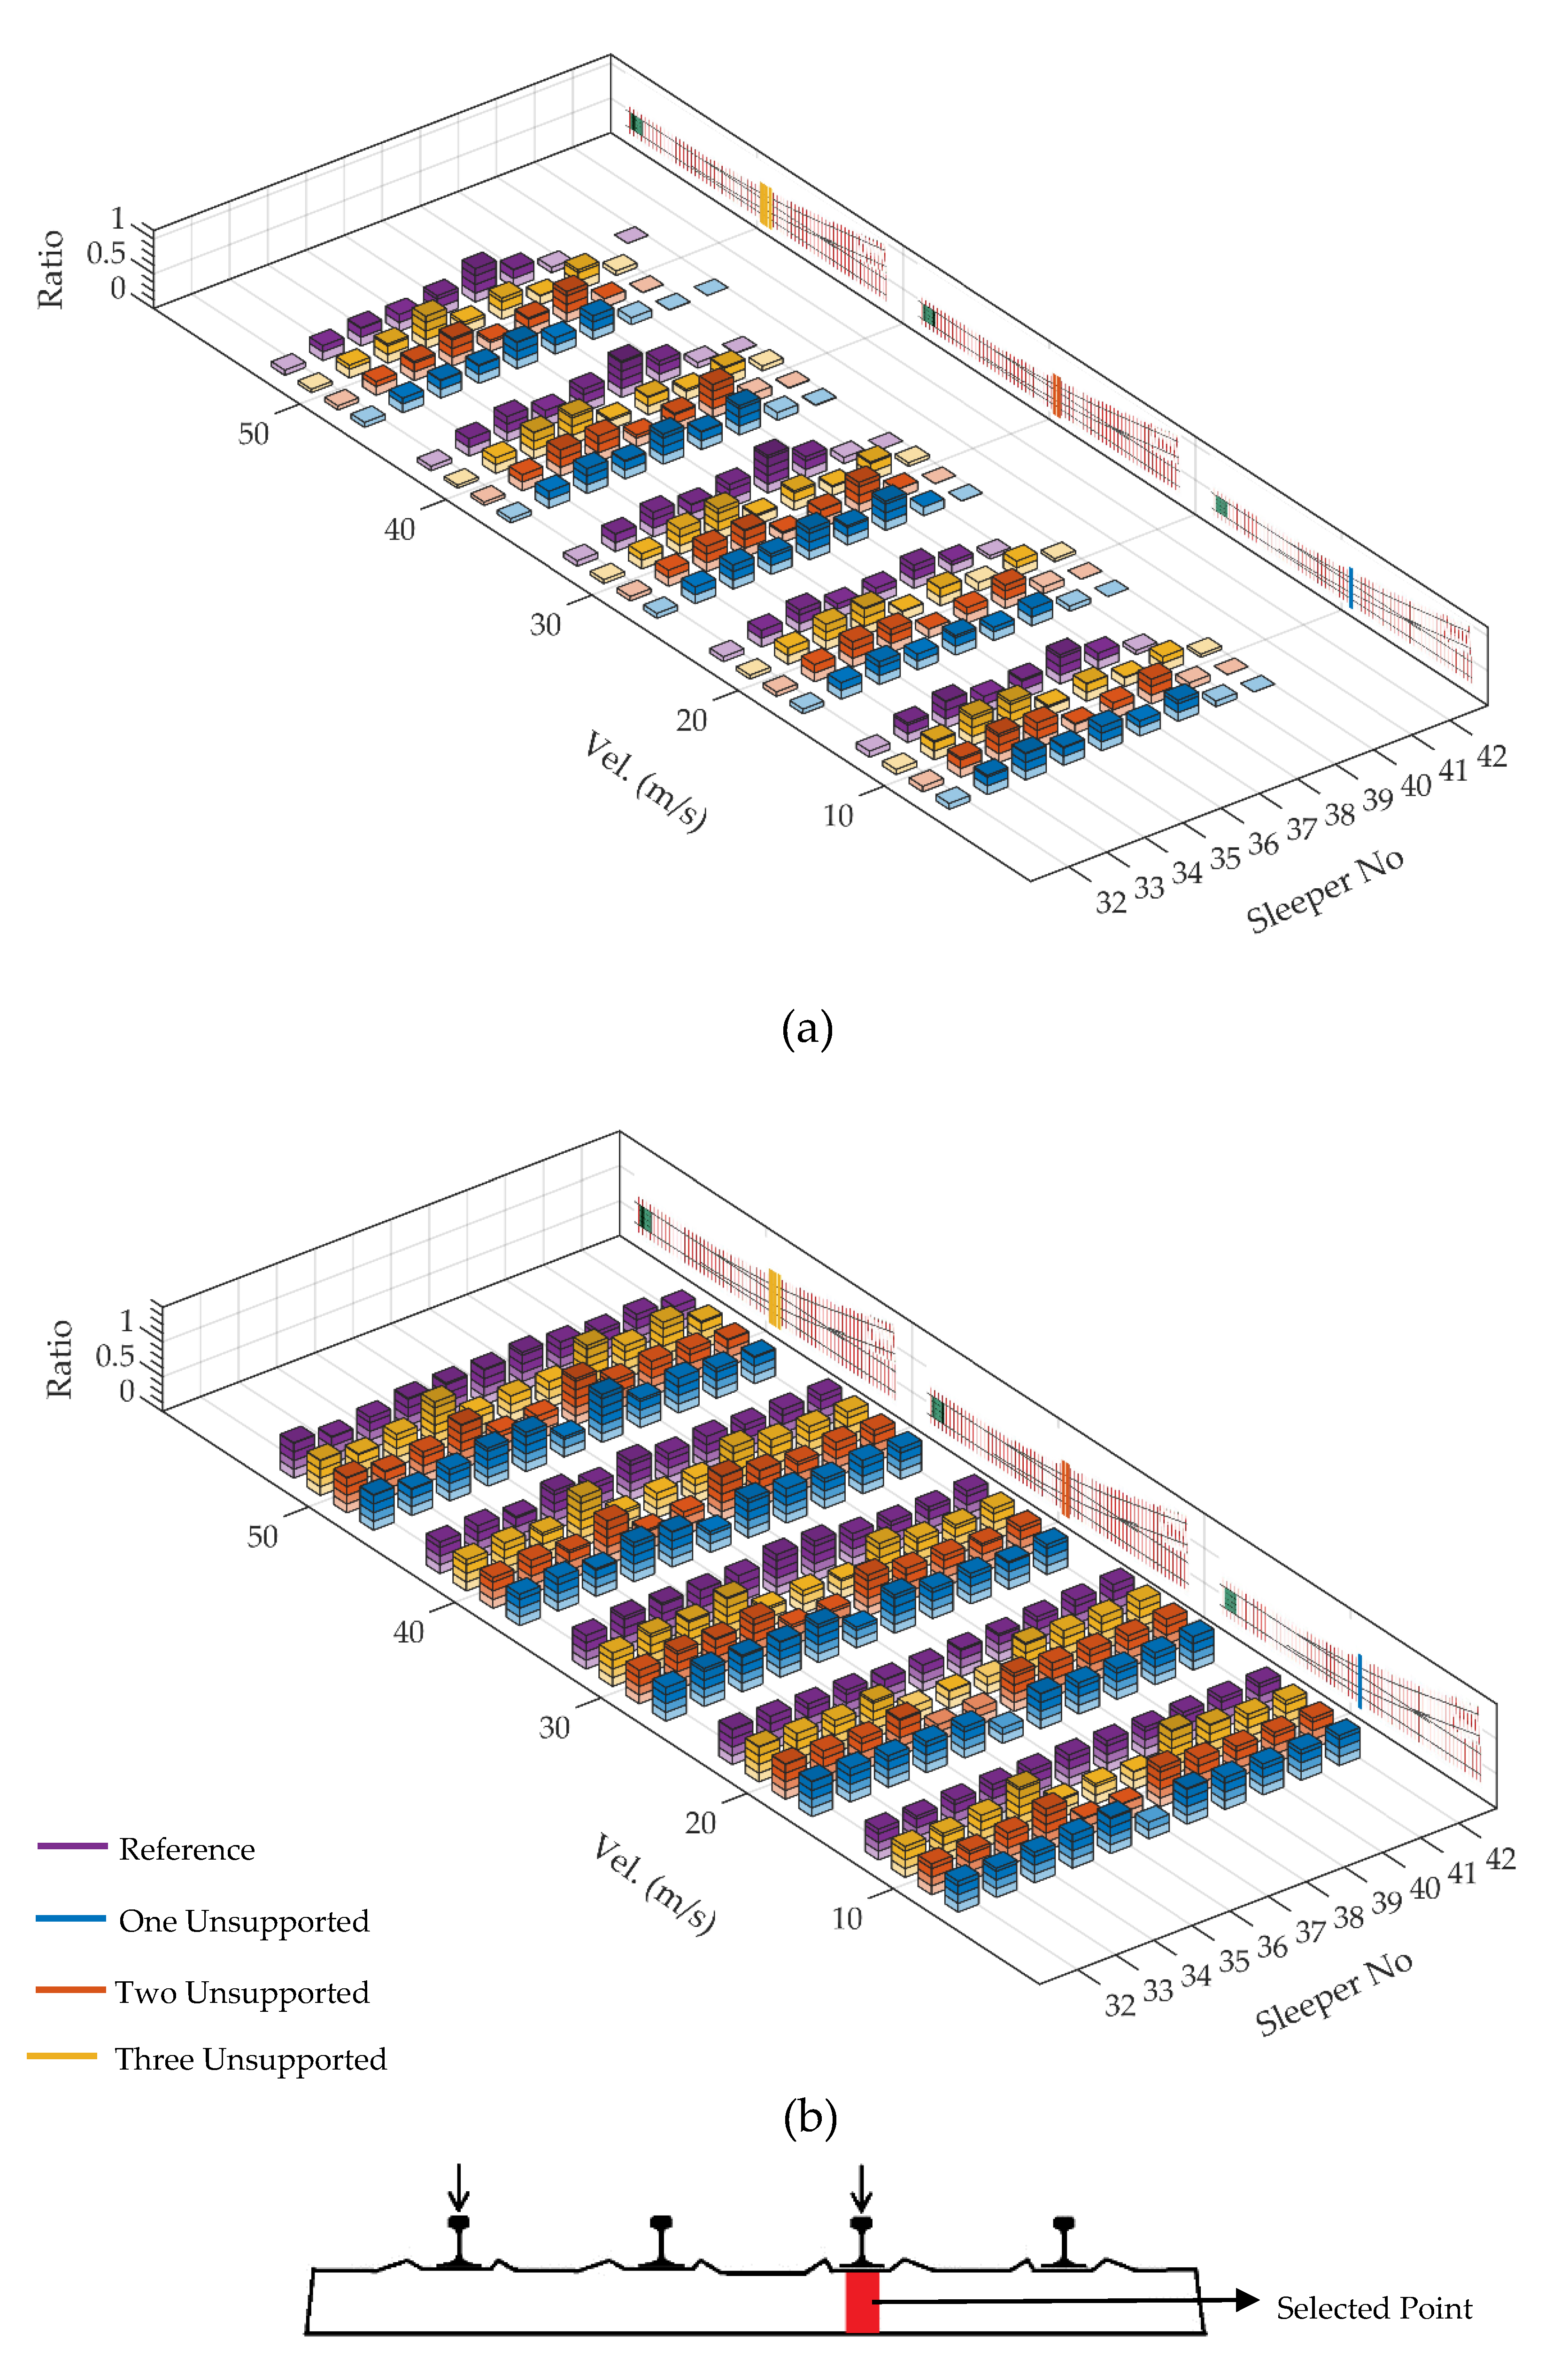
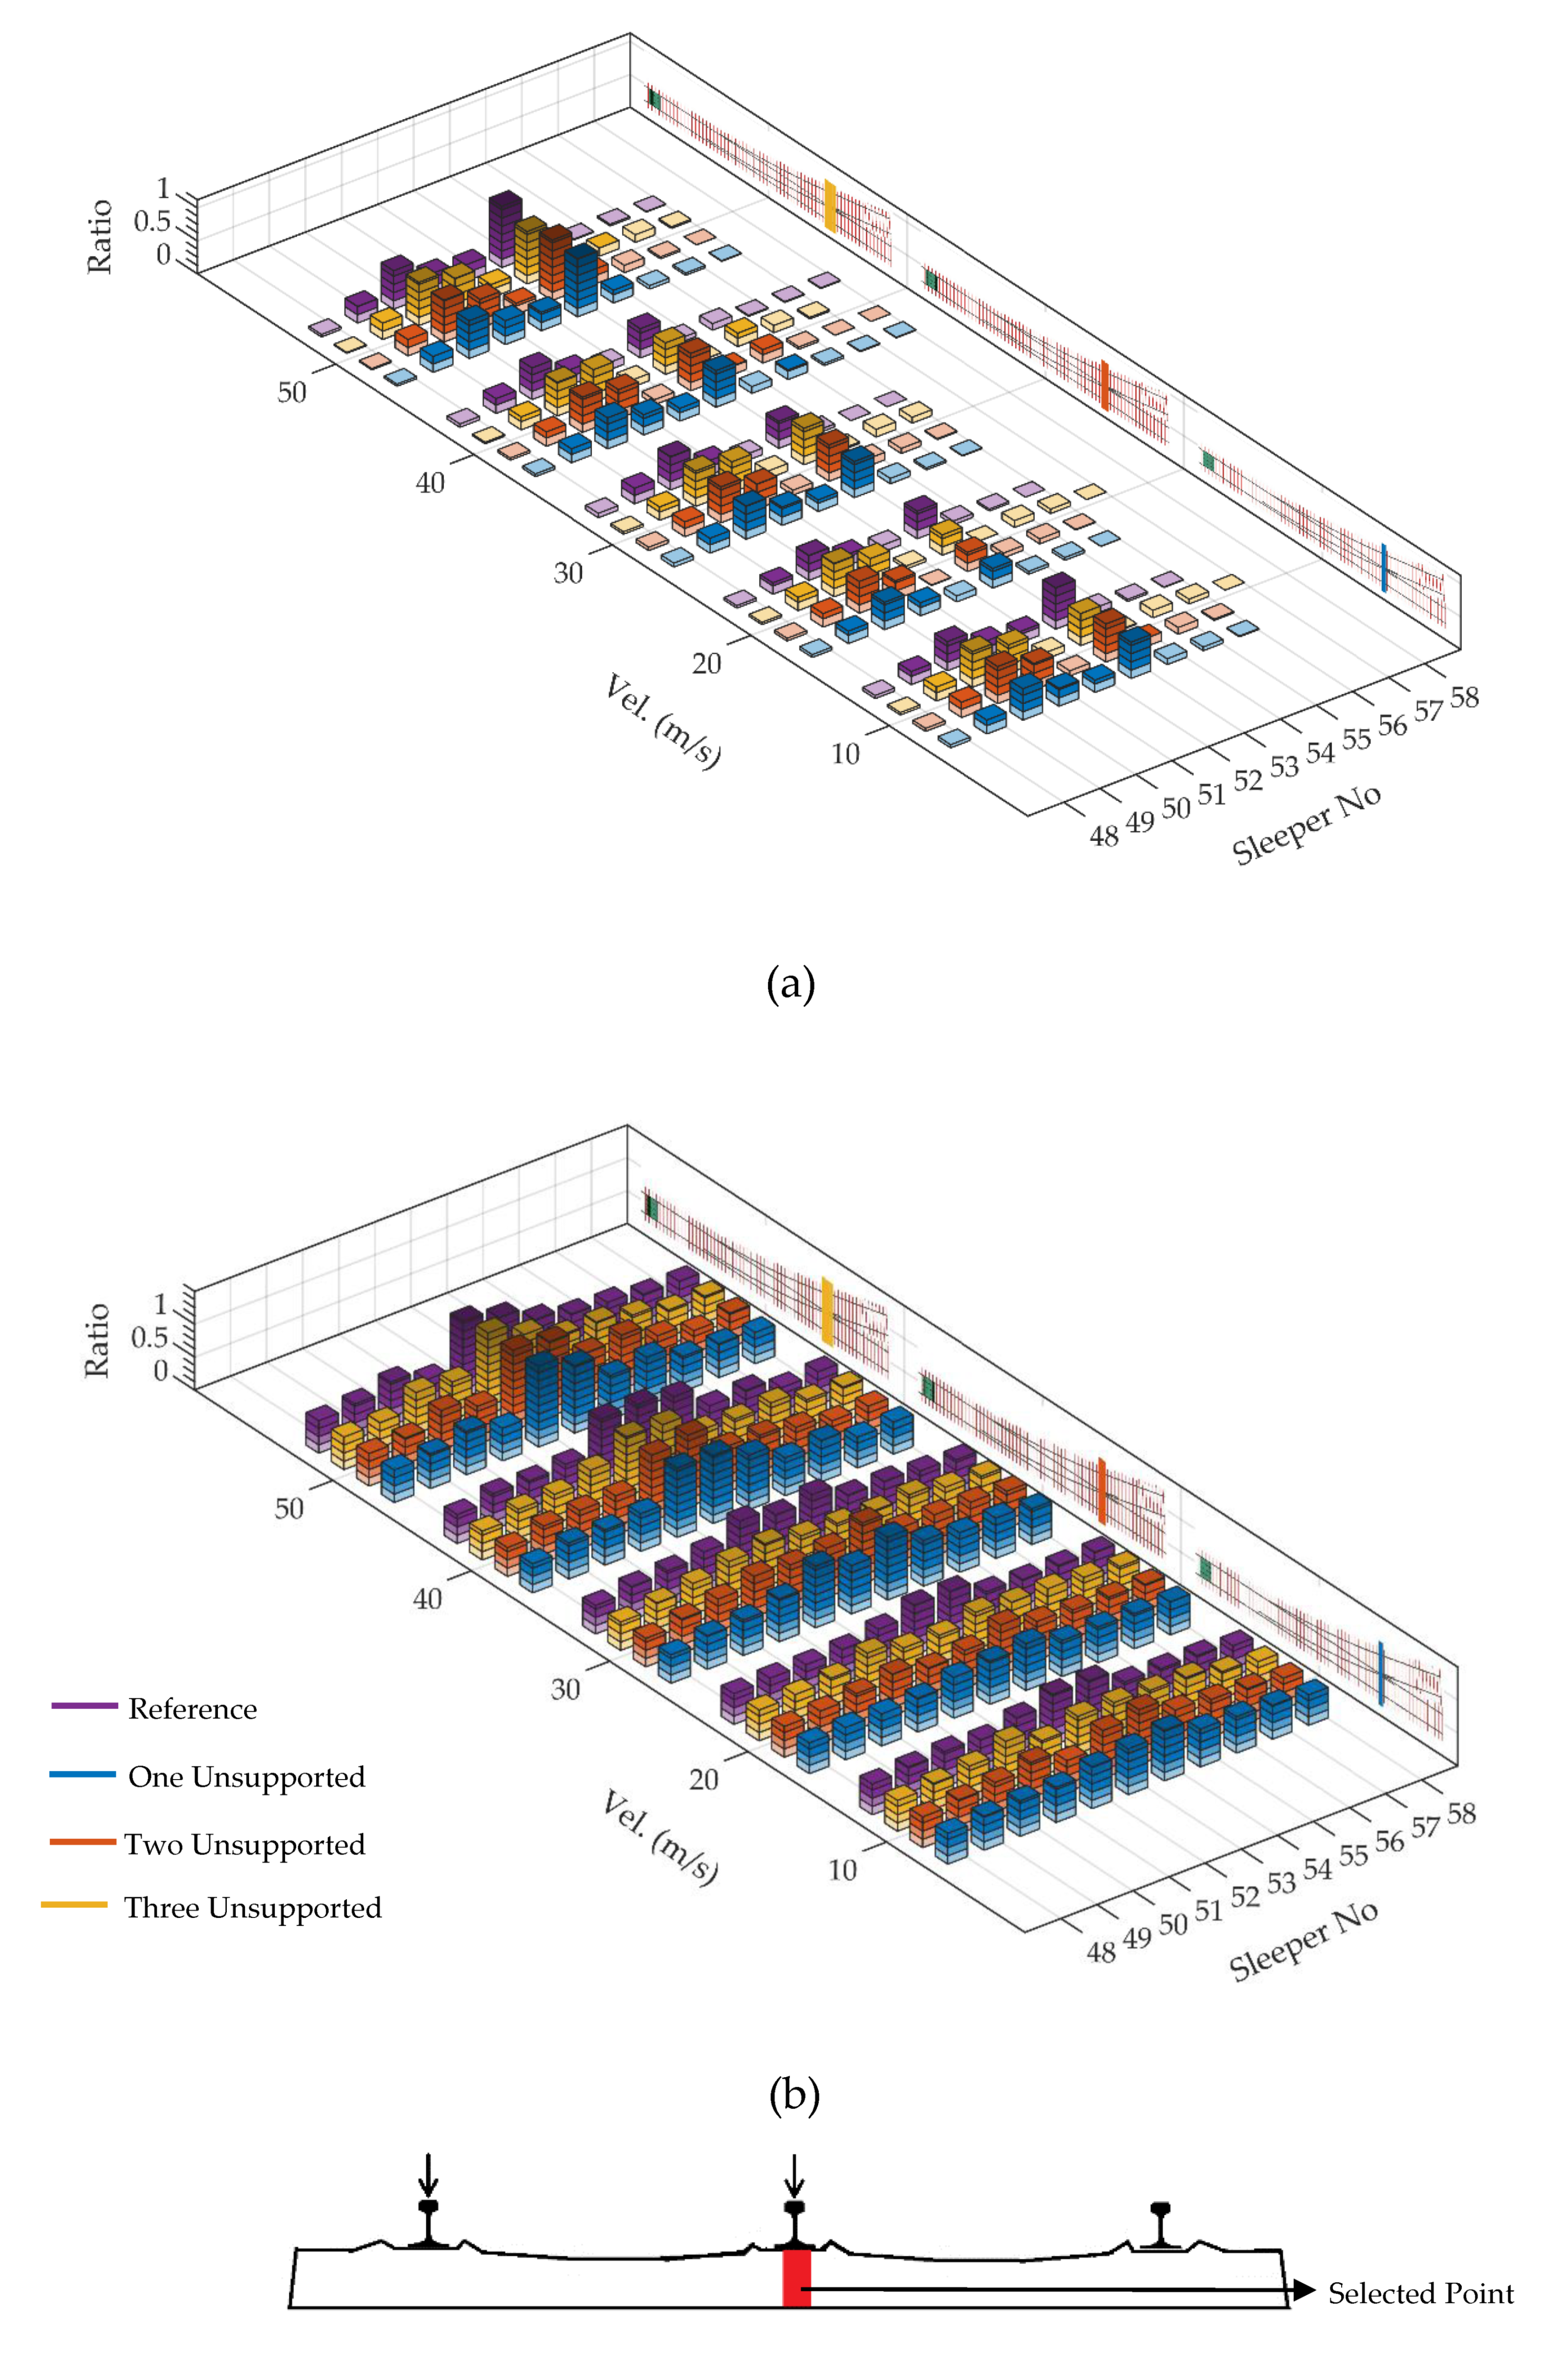
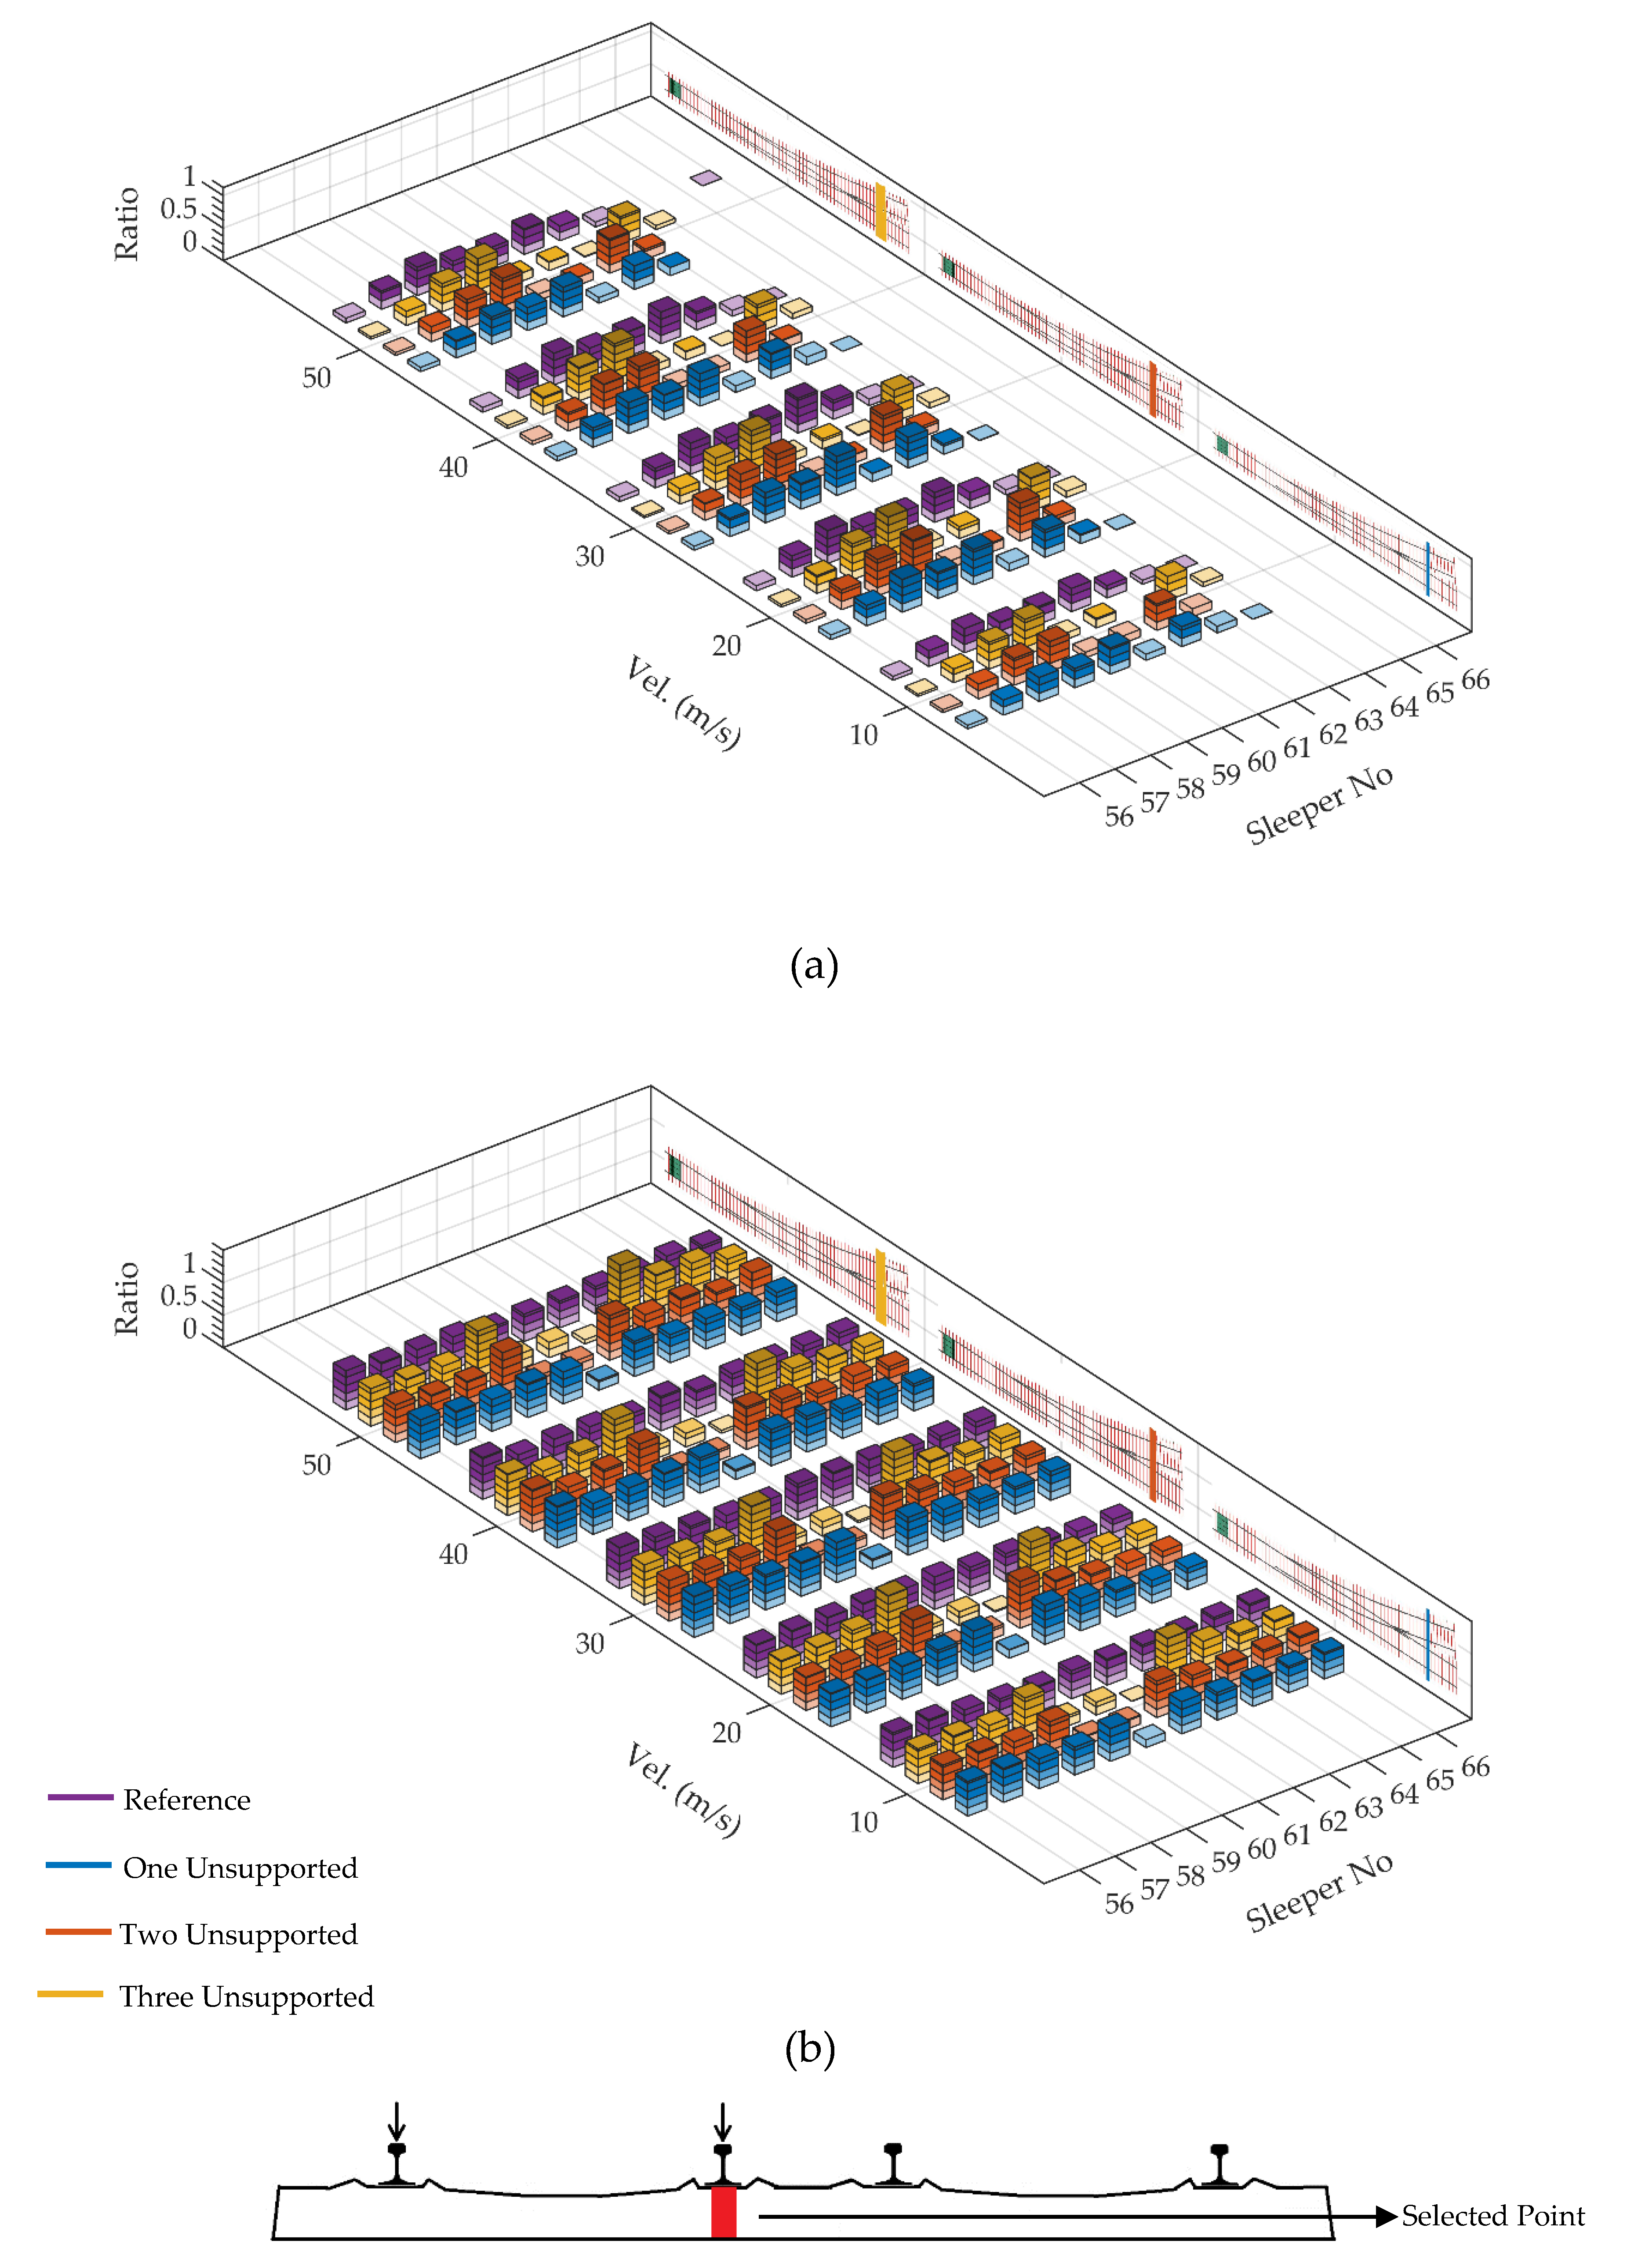
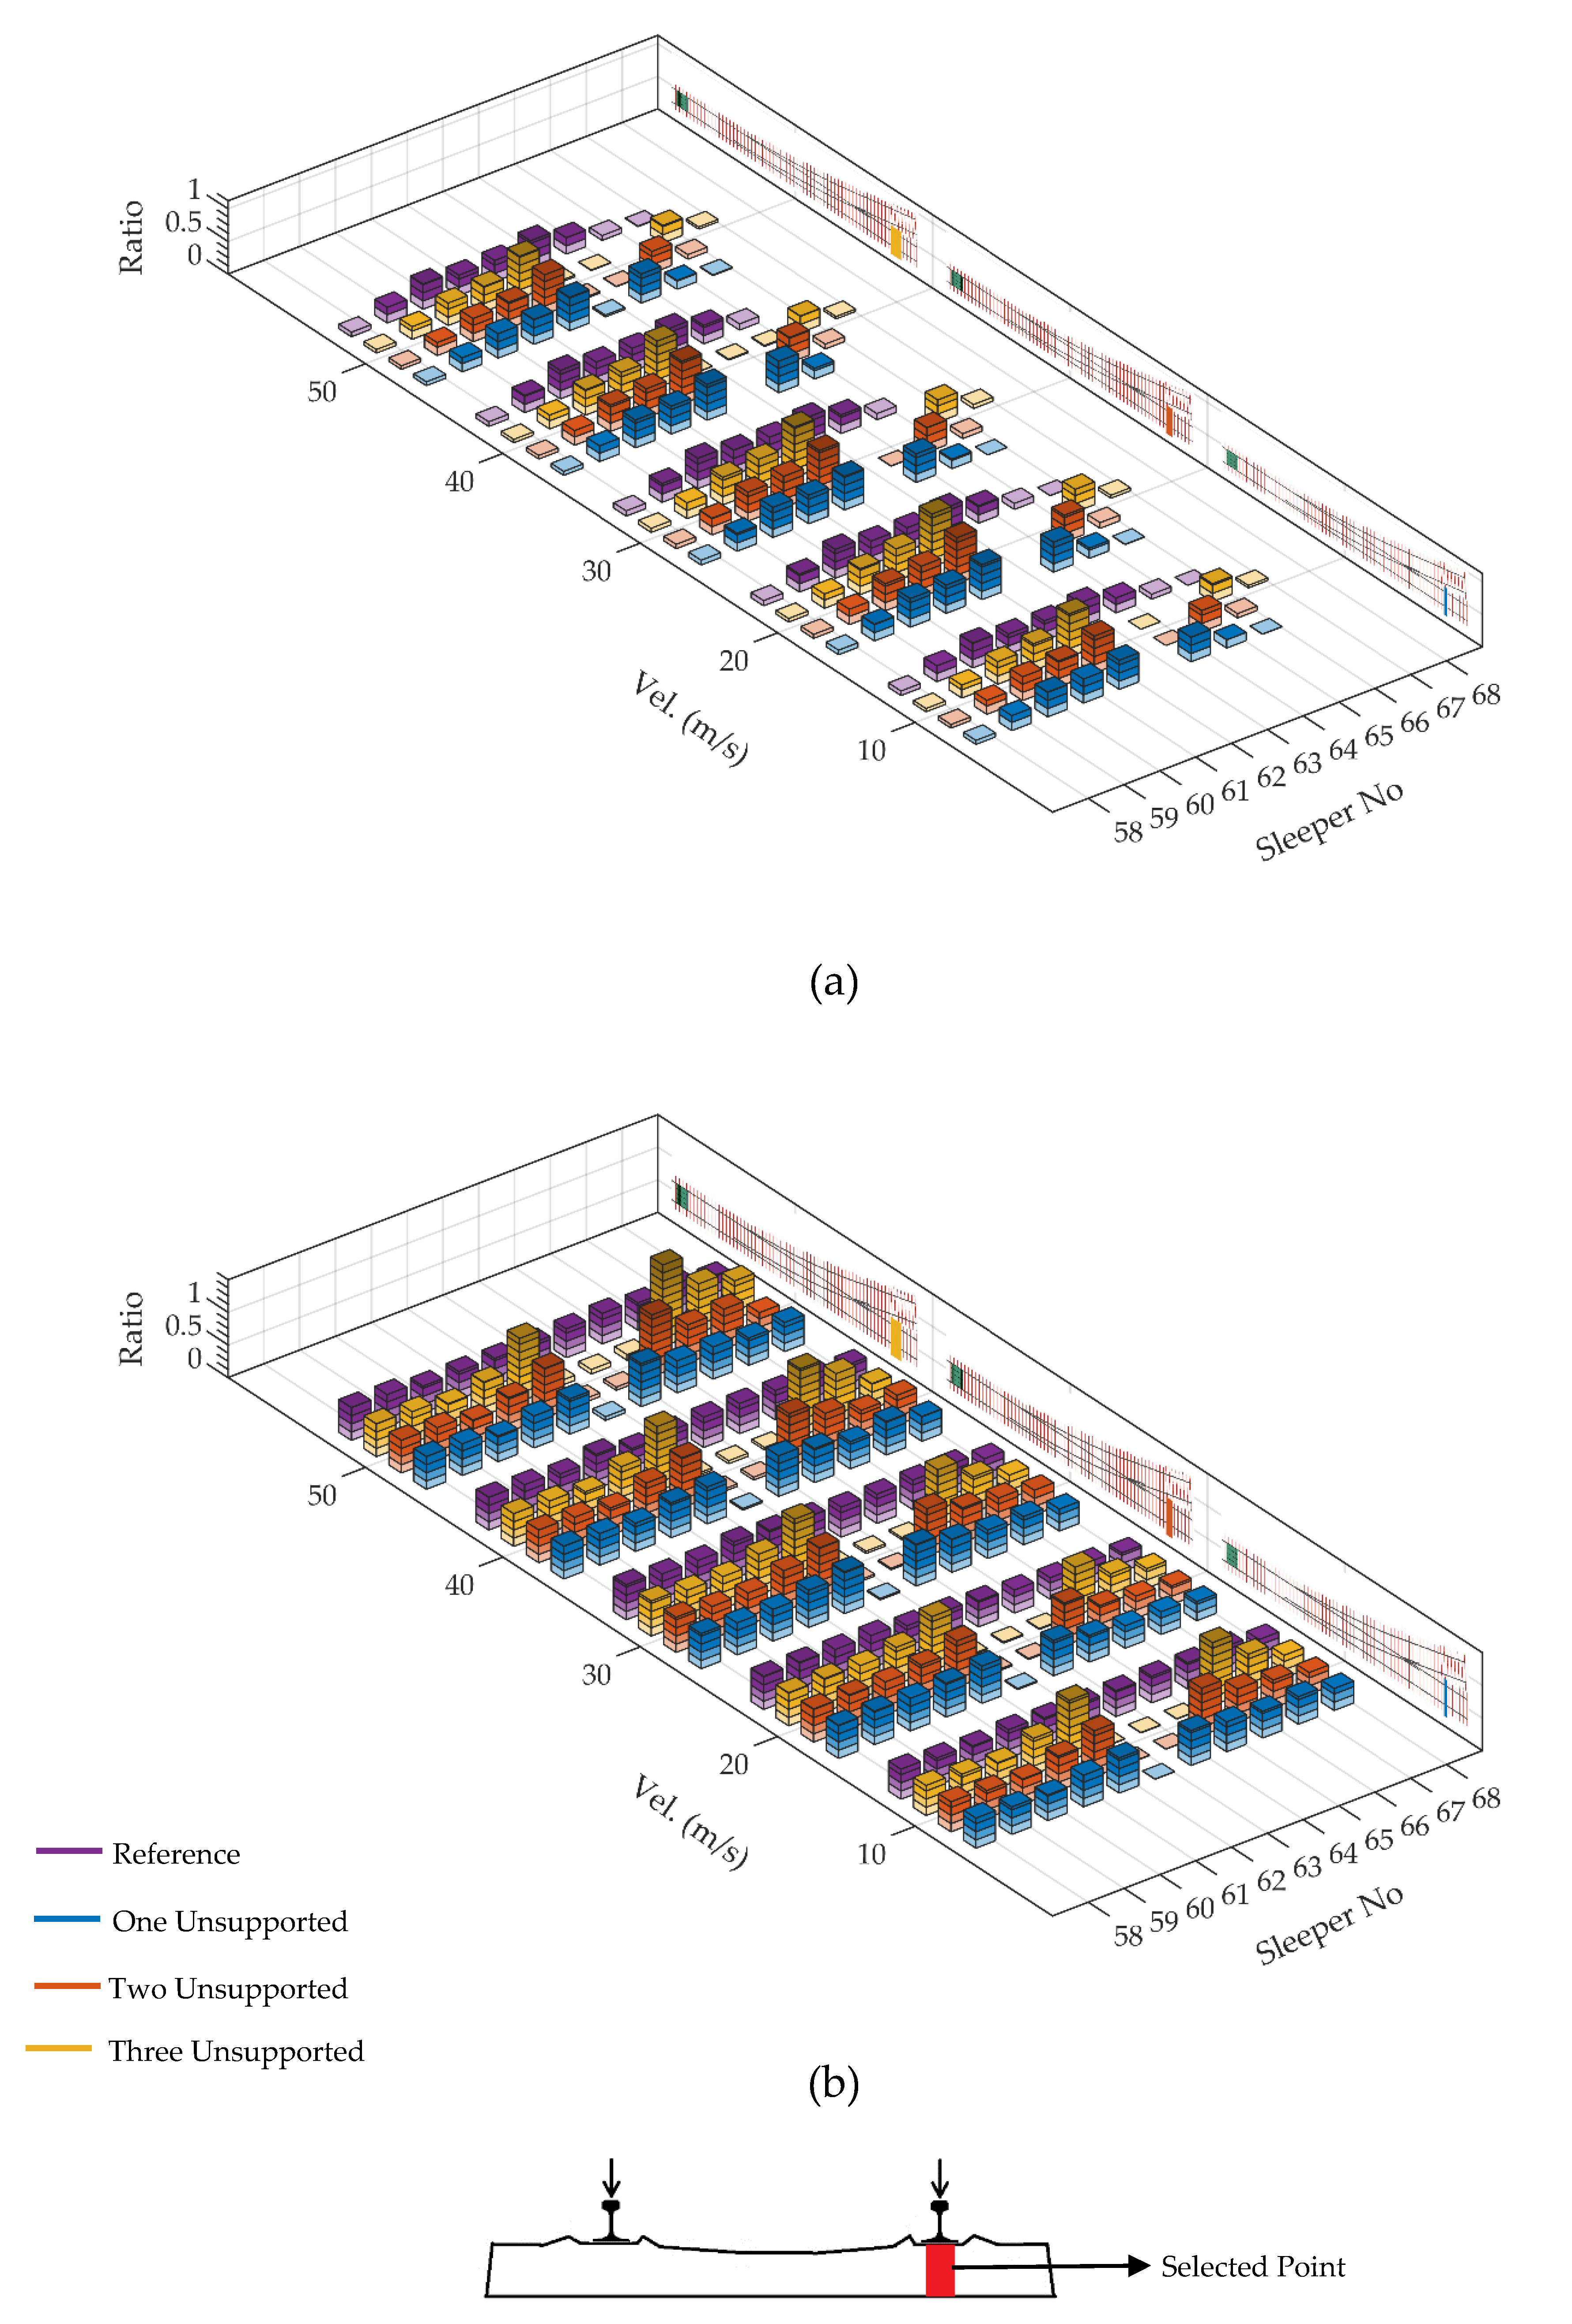
3.3. Rail Seat Forces
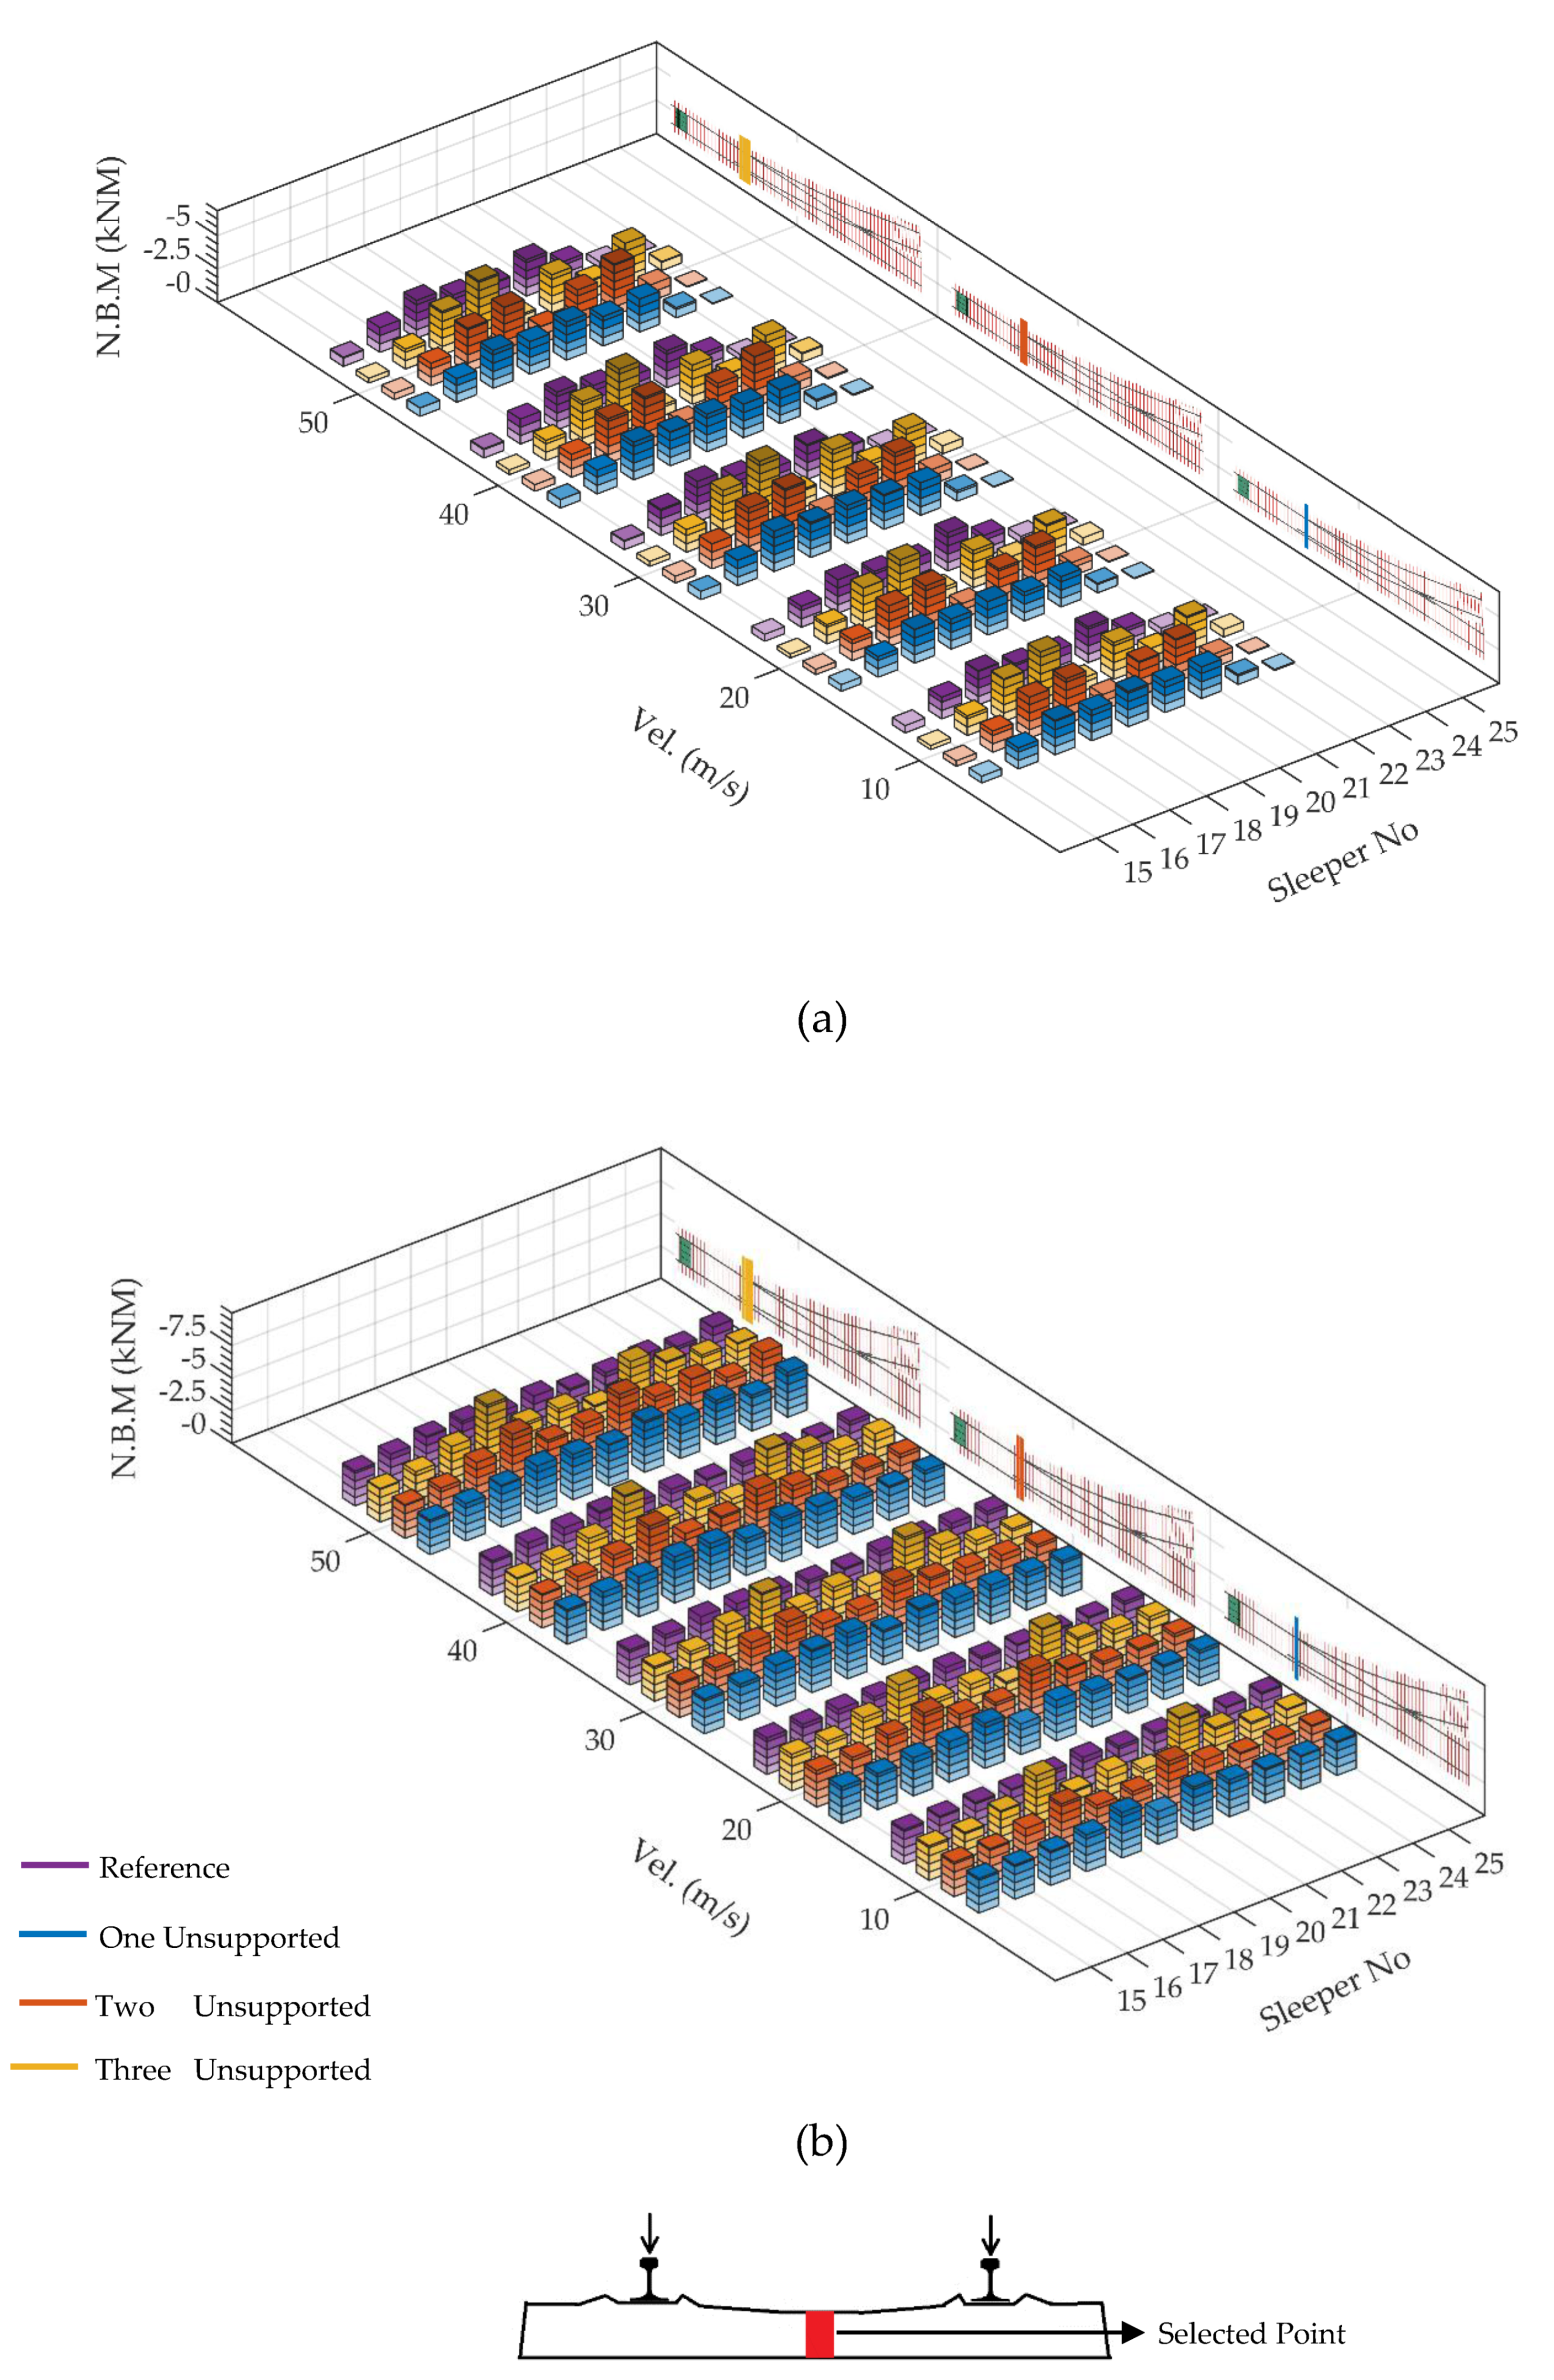
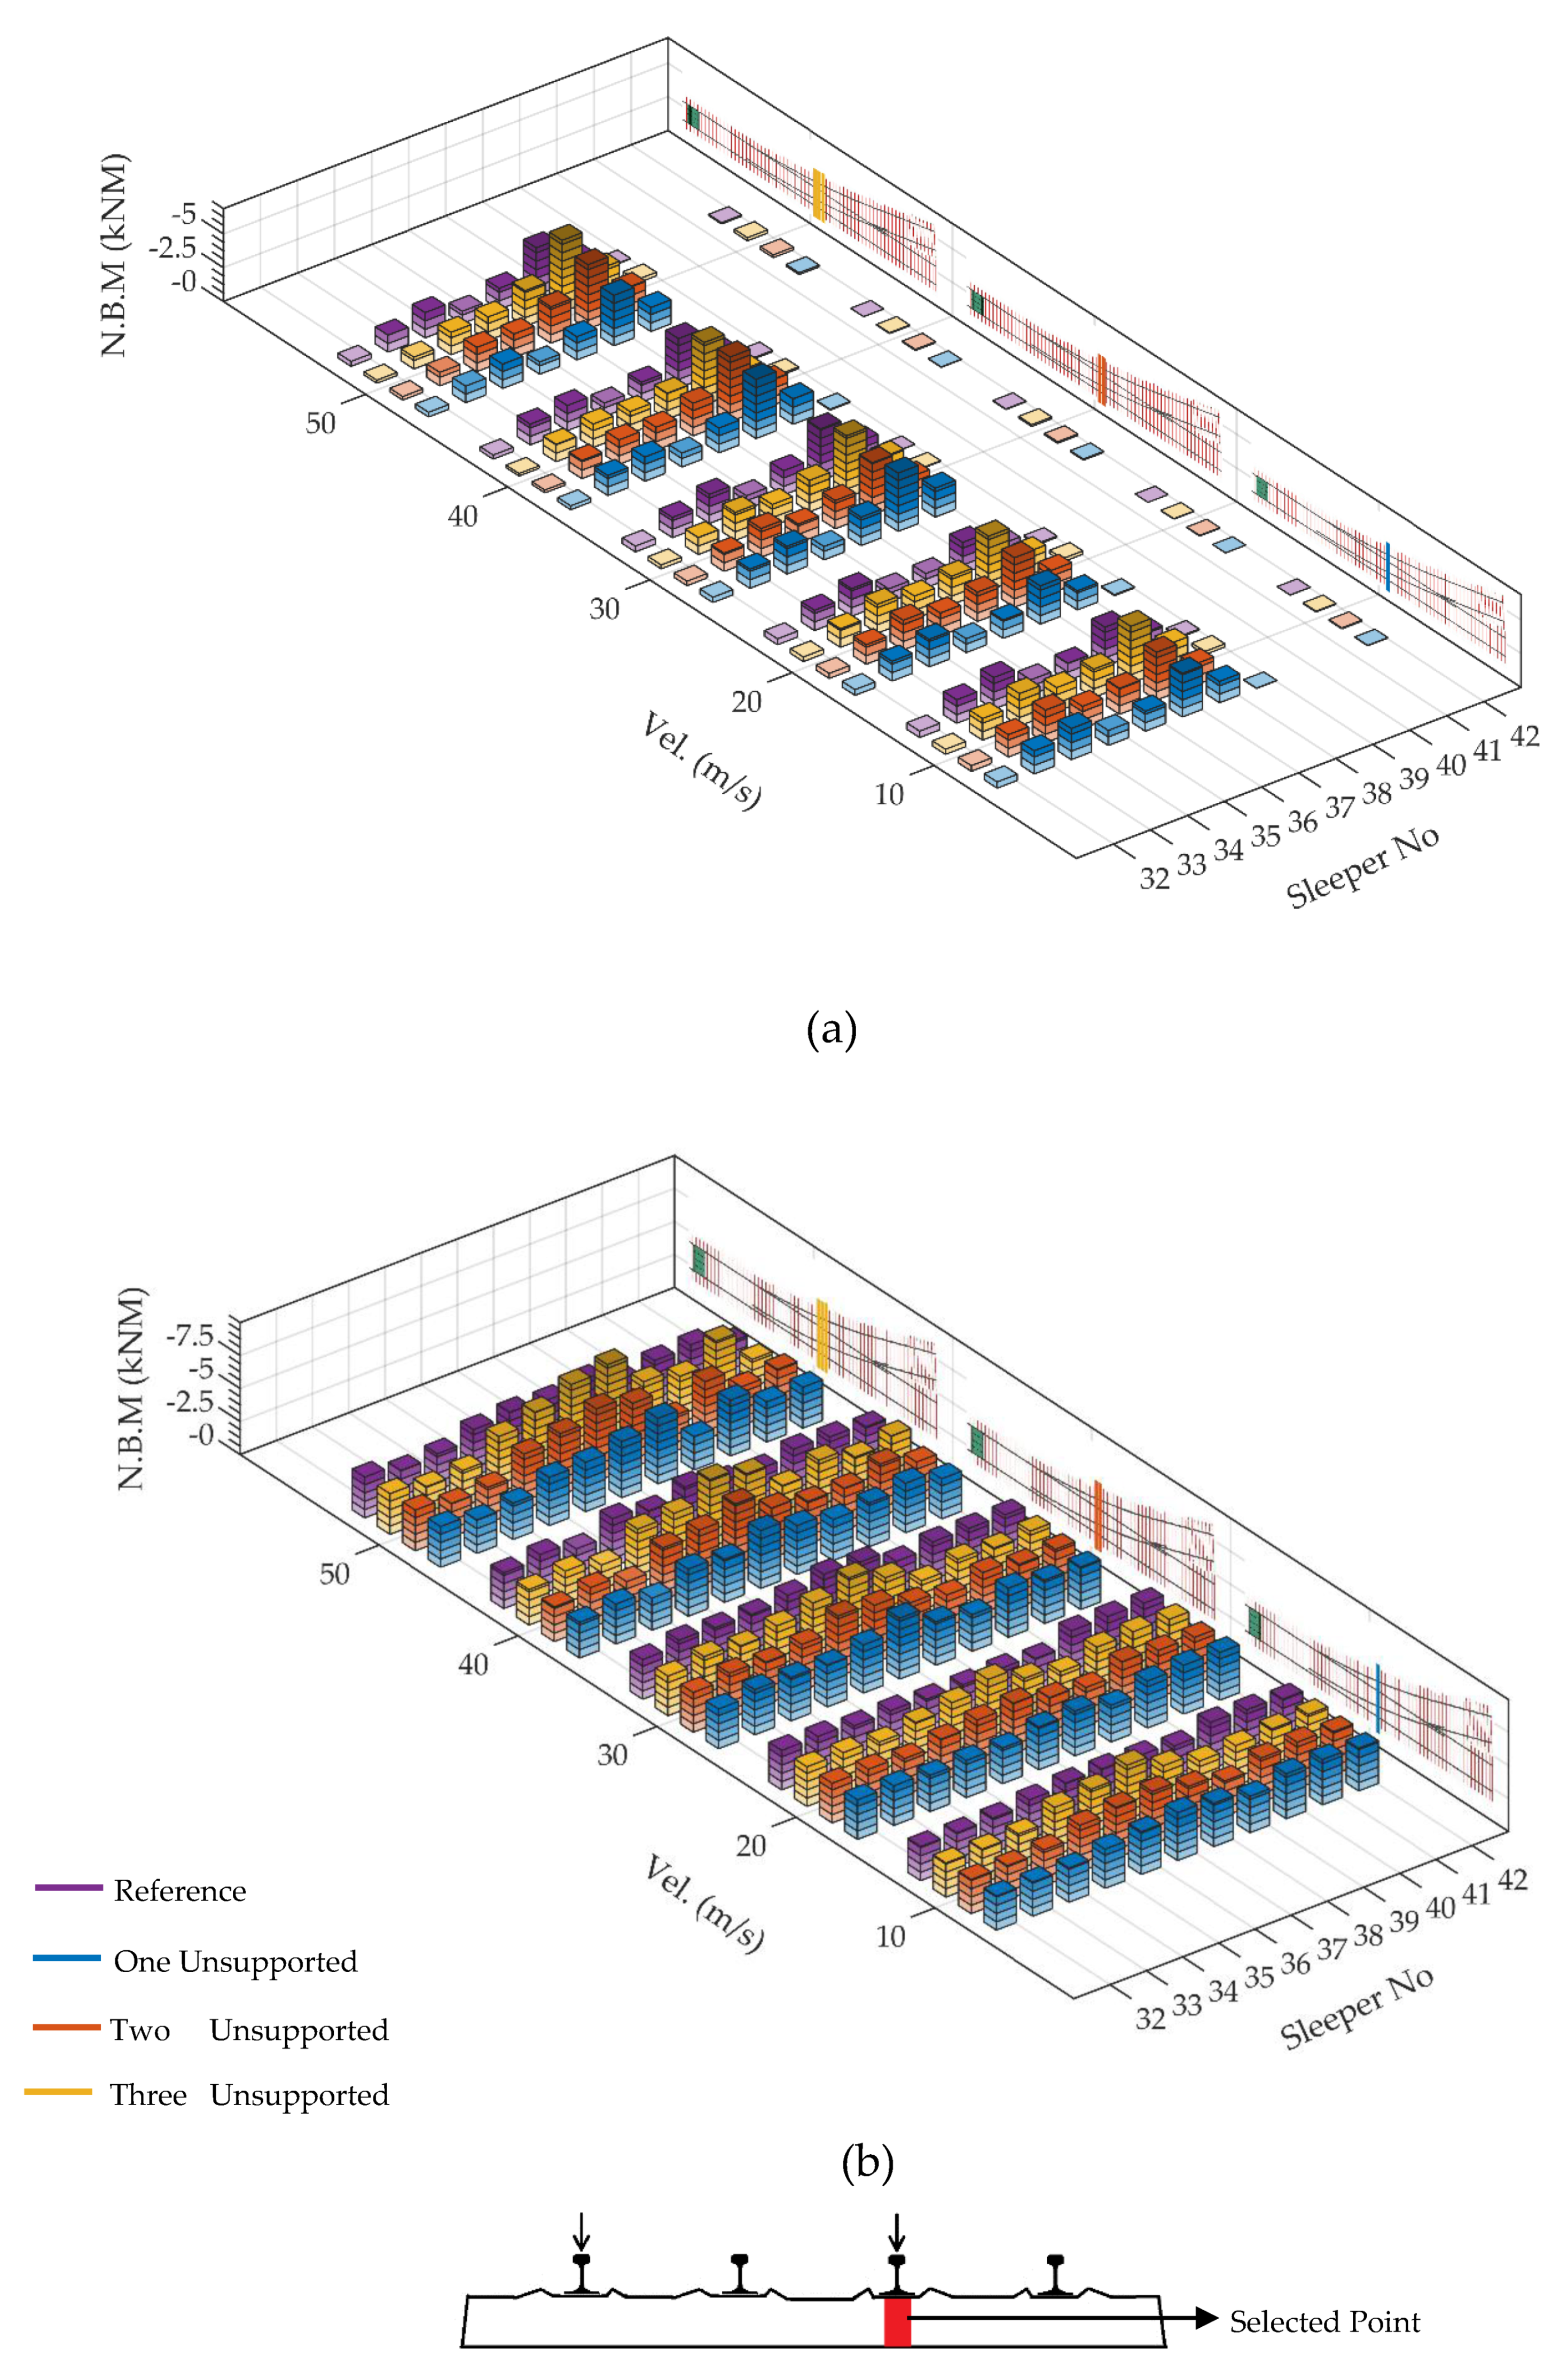
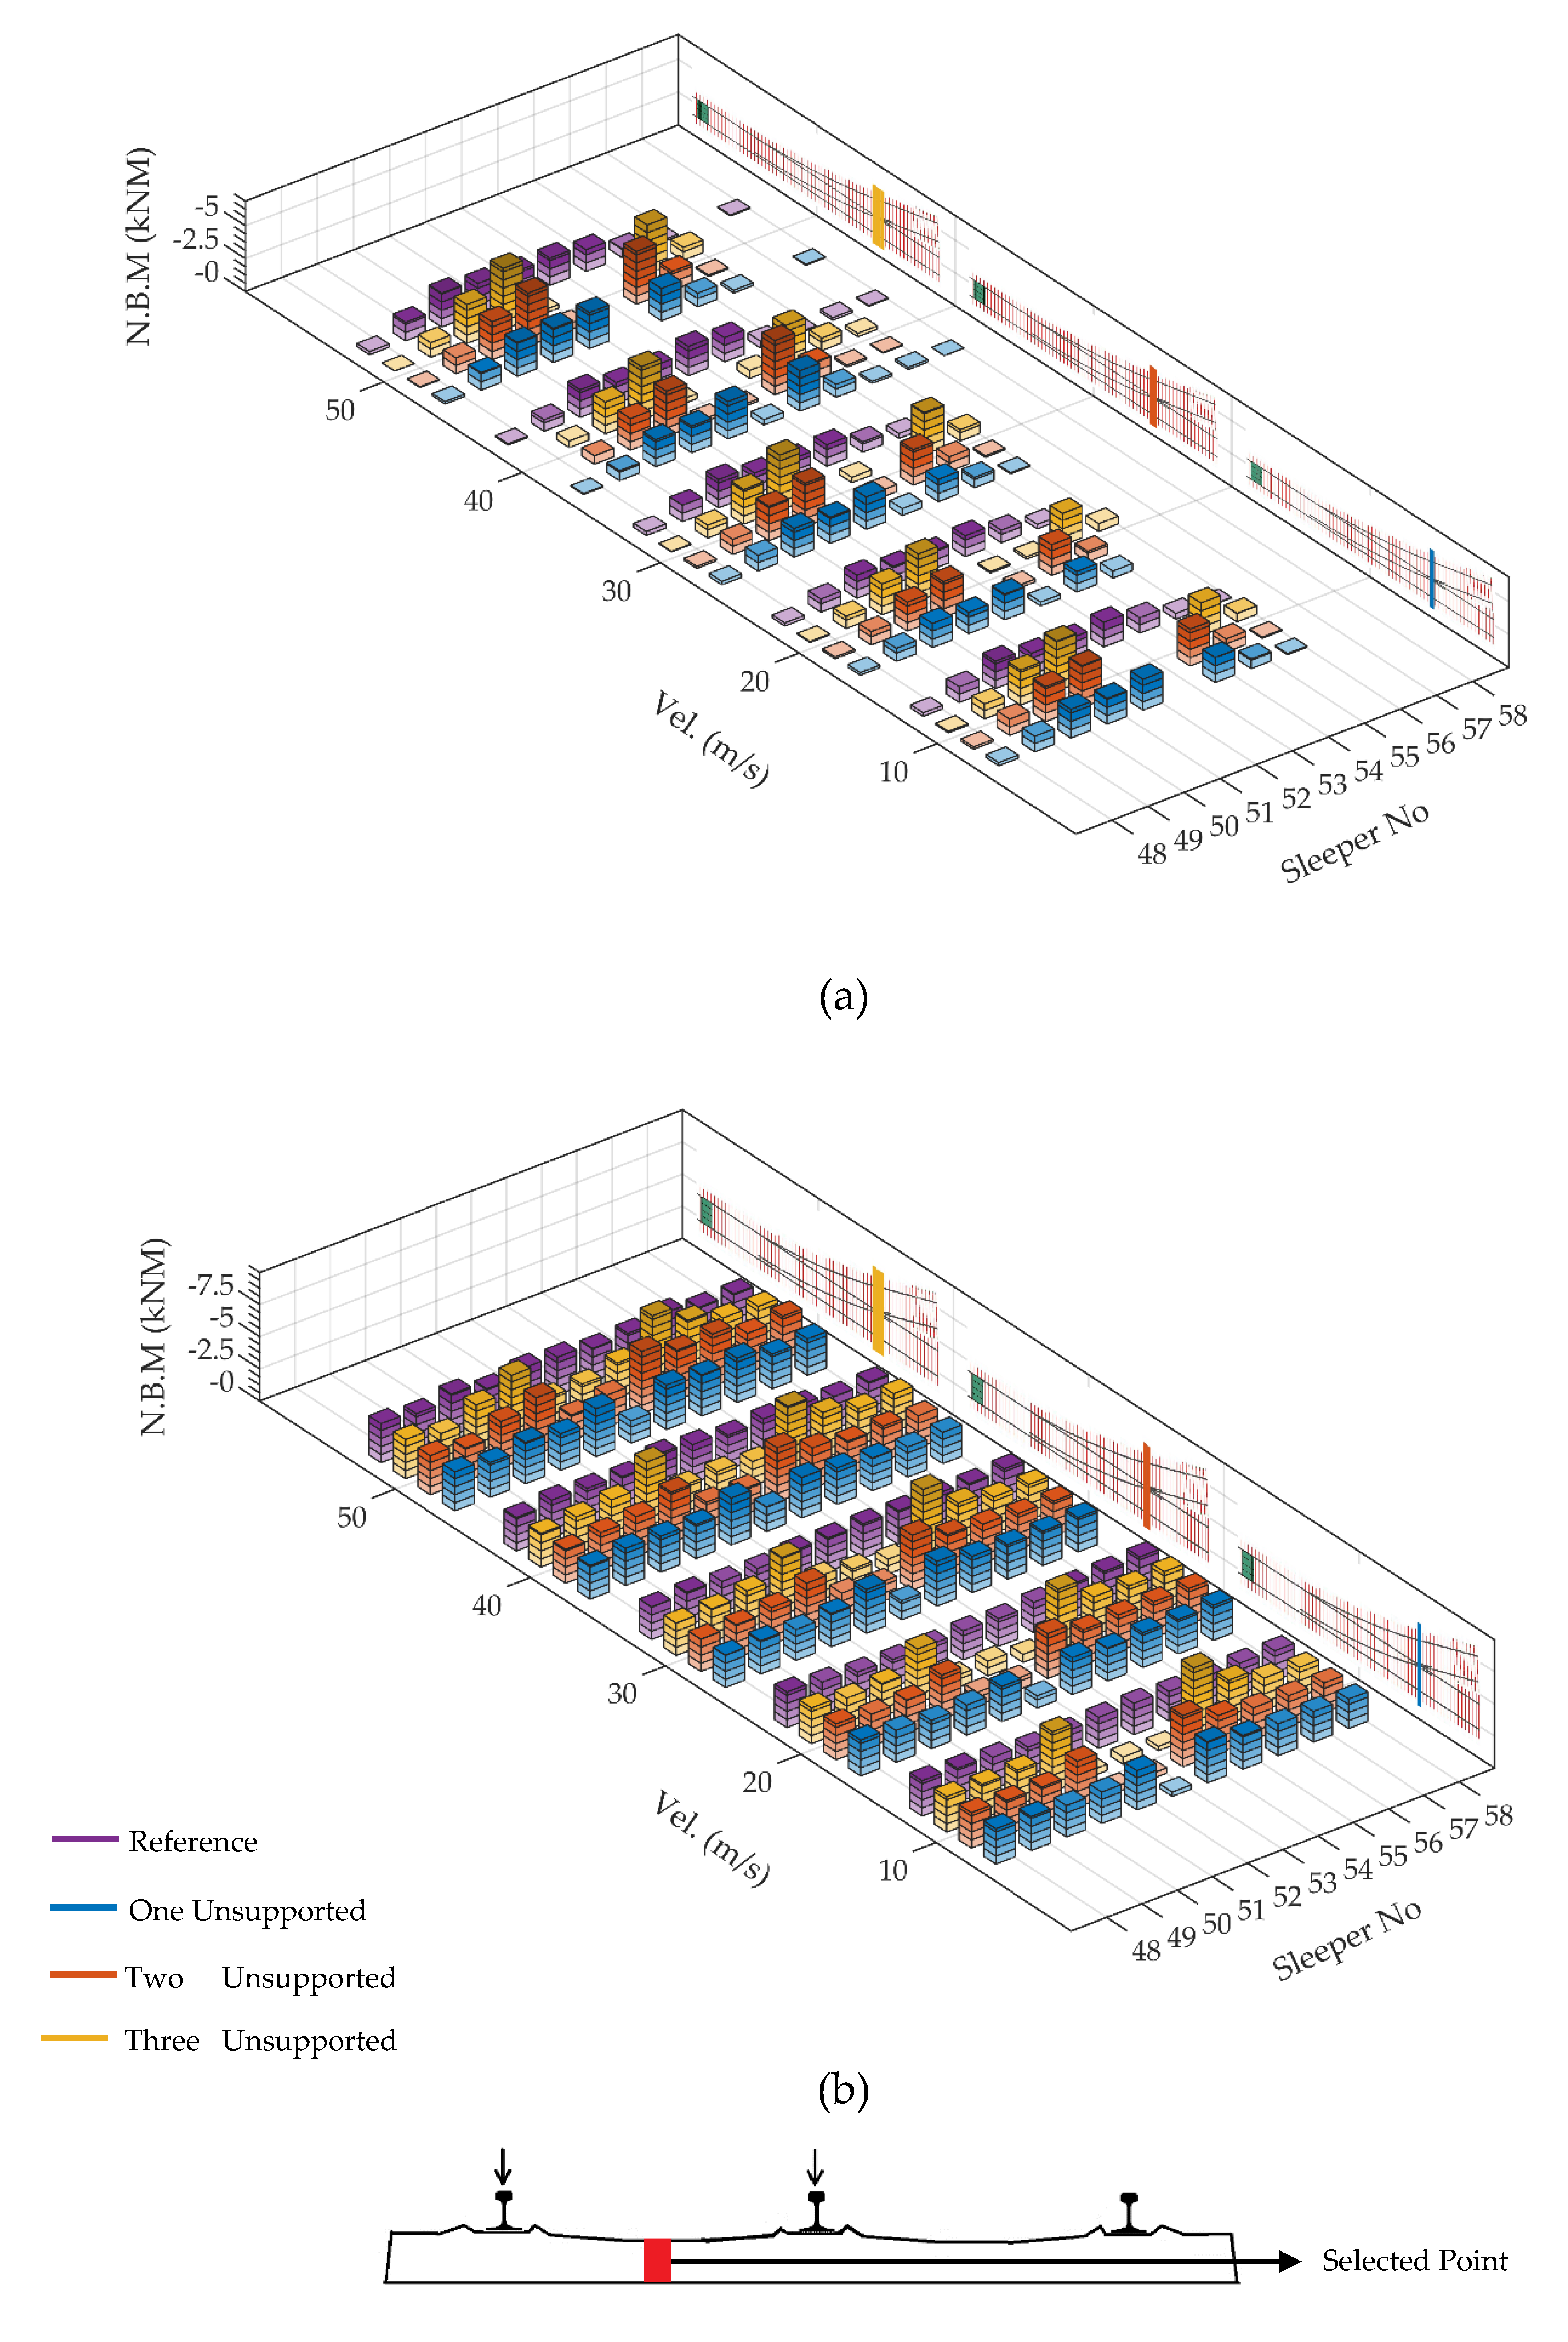
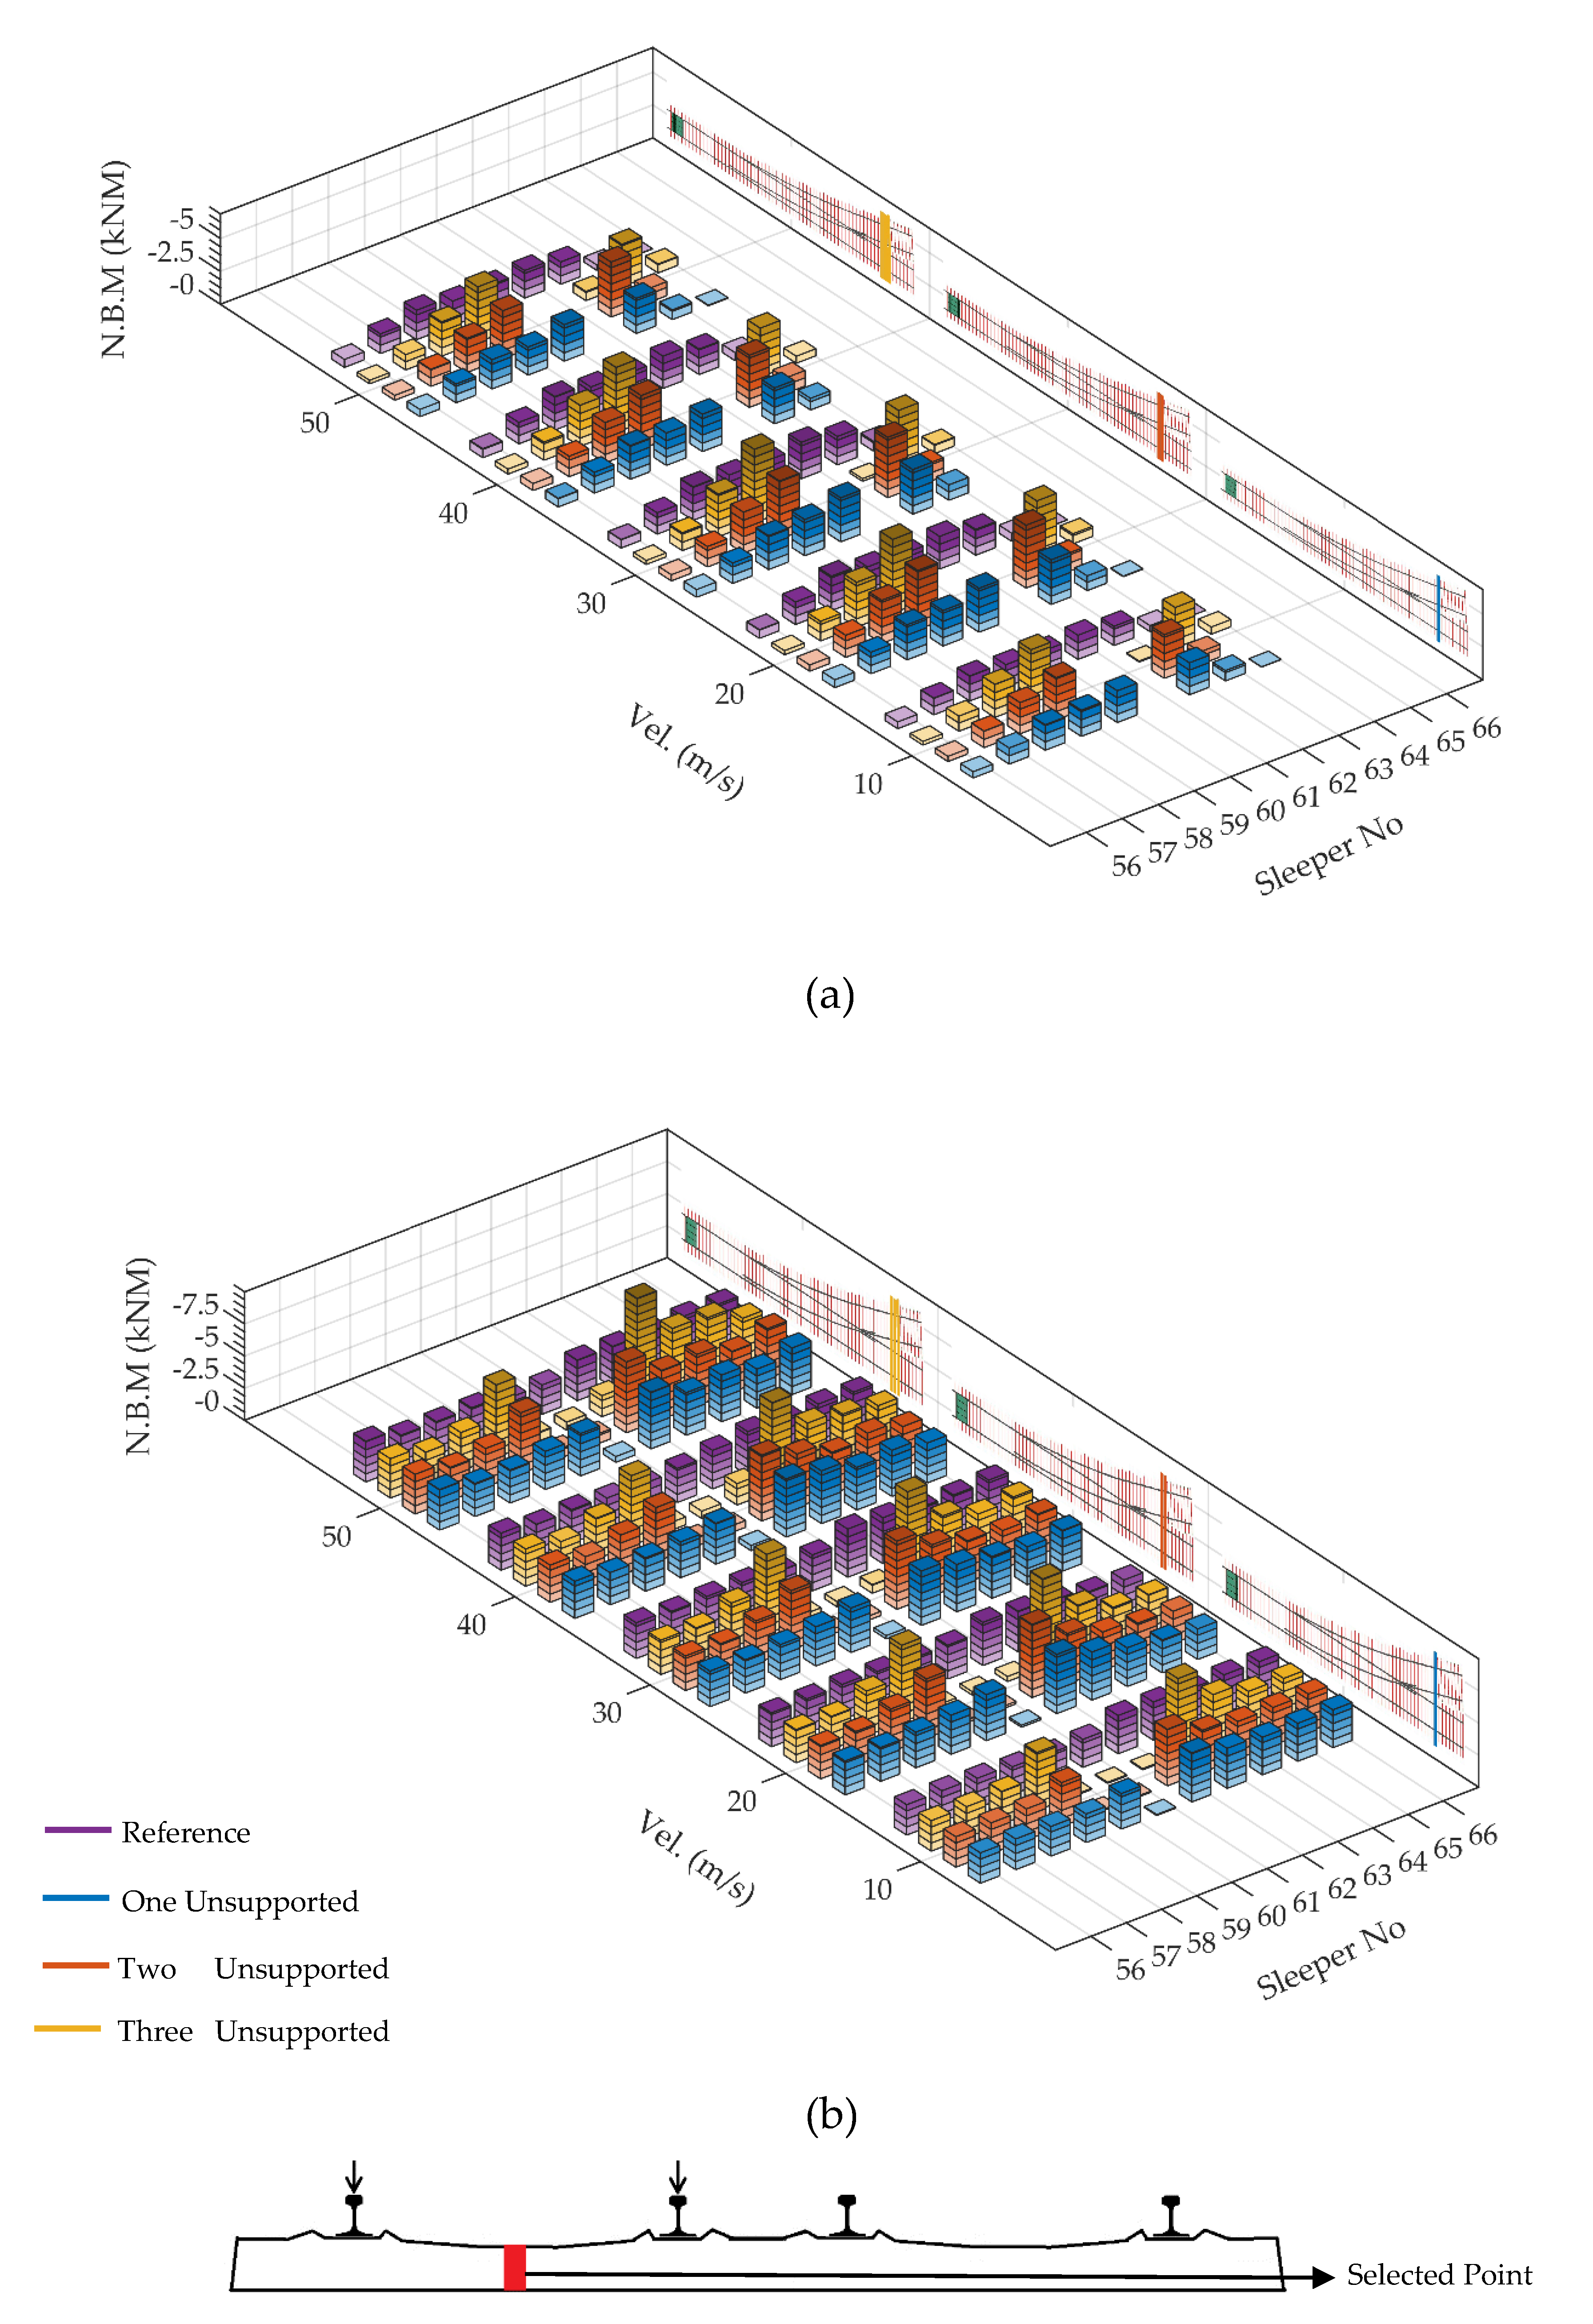
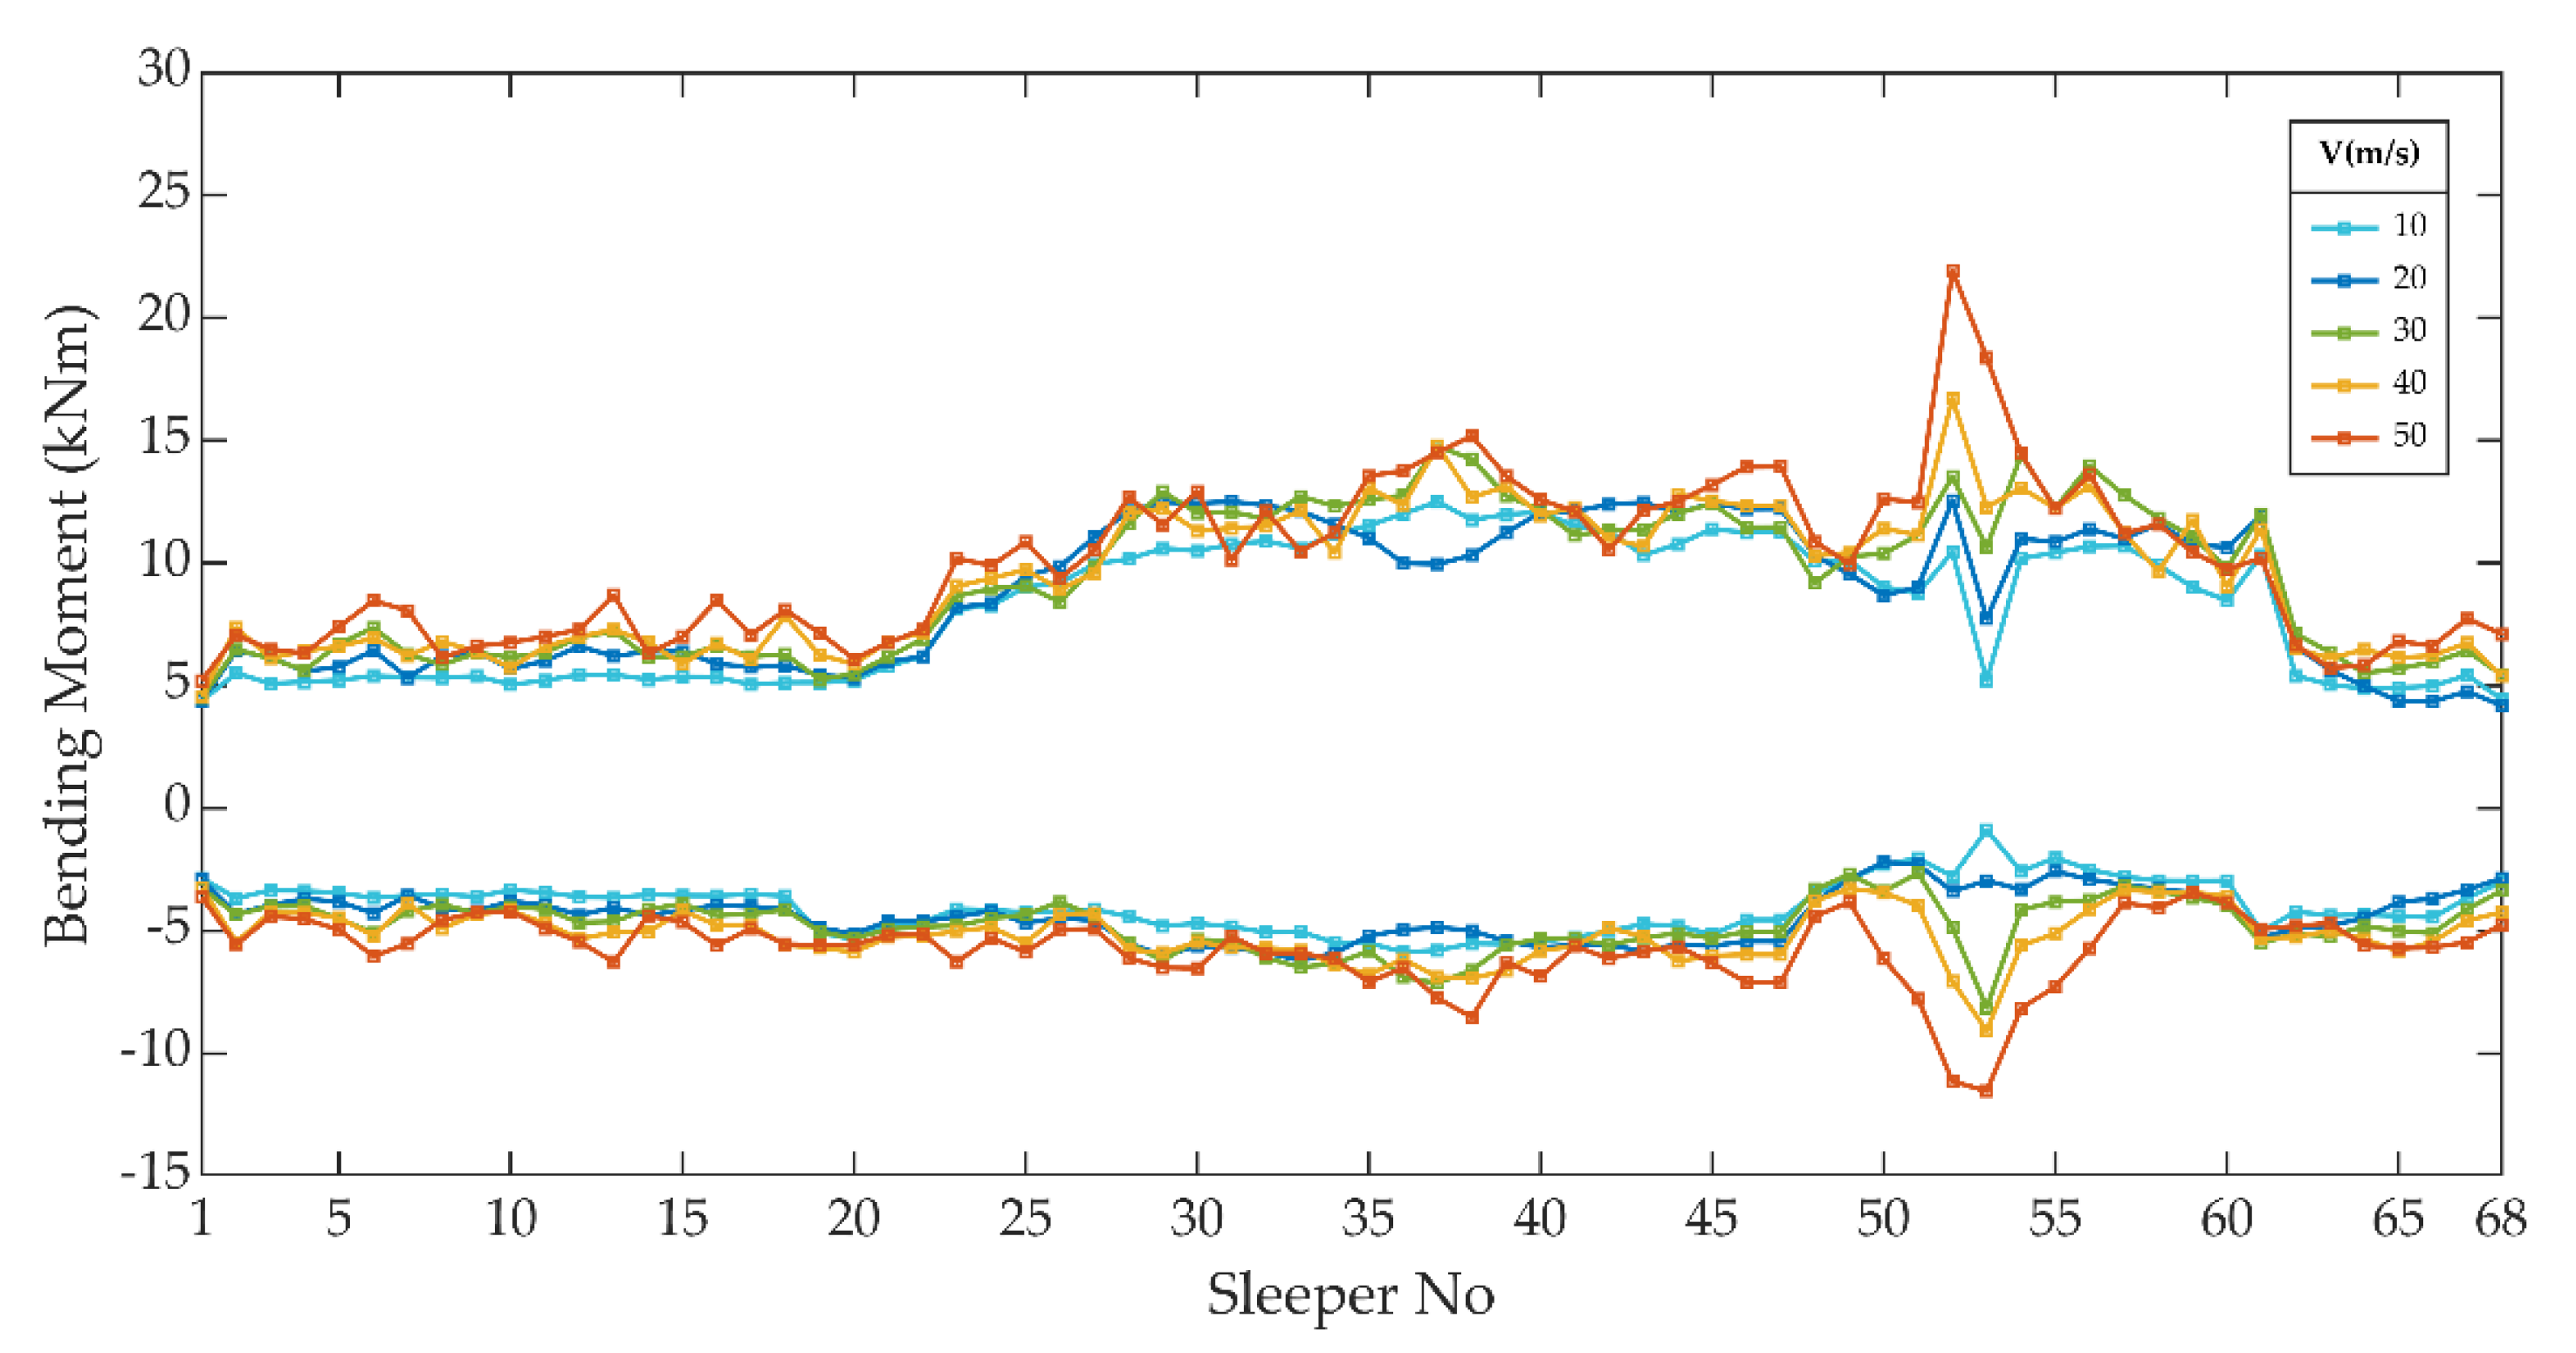
3.4. Negative Bending Moment Distributions of Selected Points
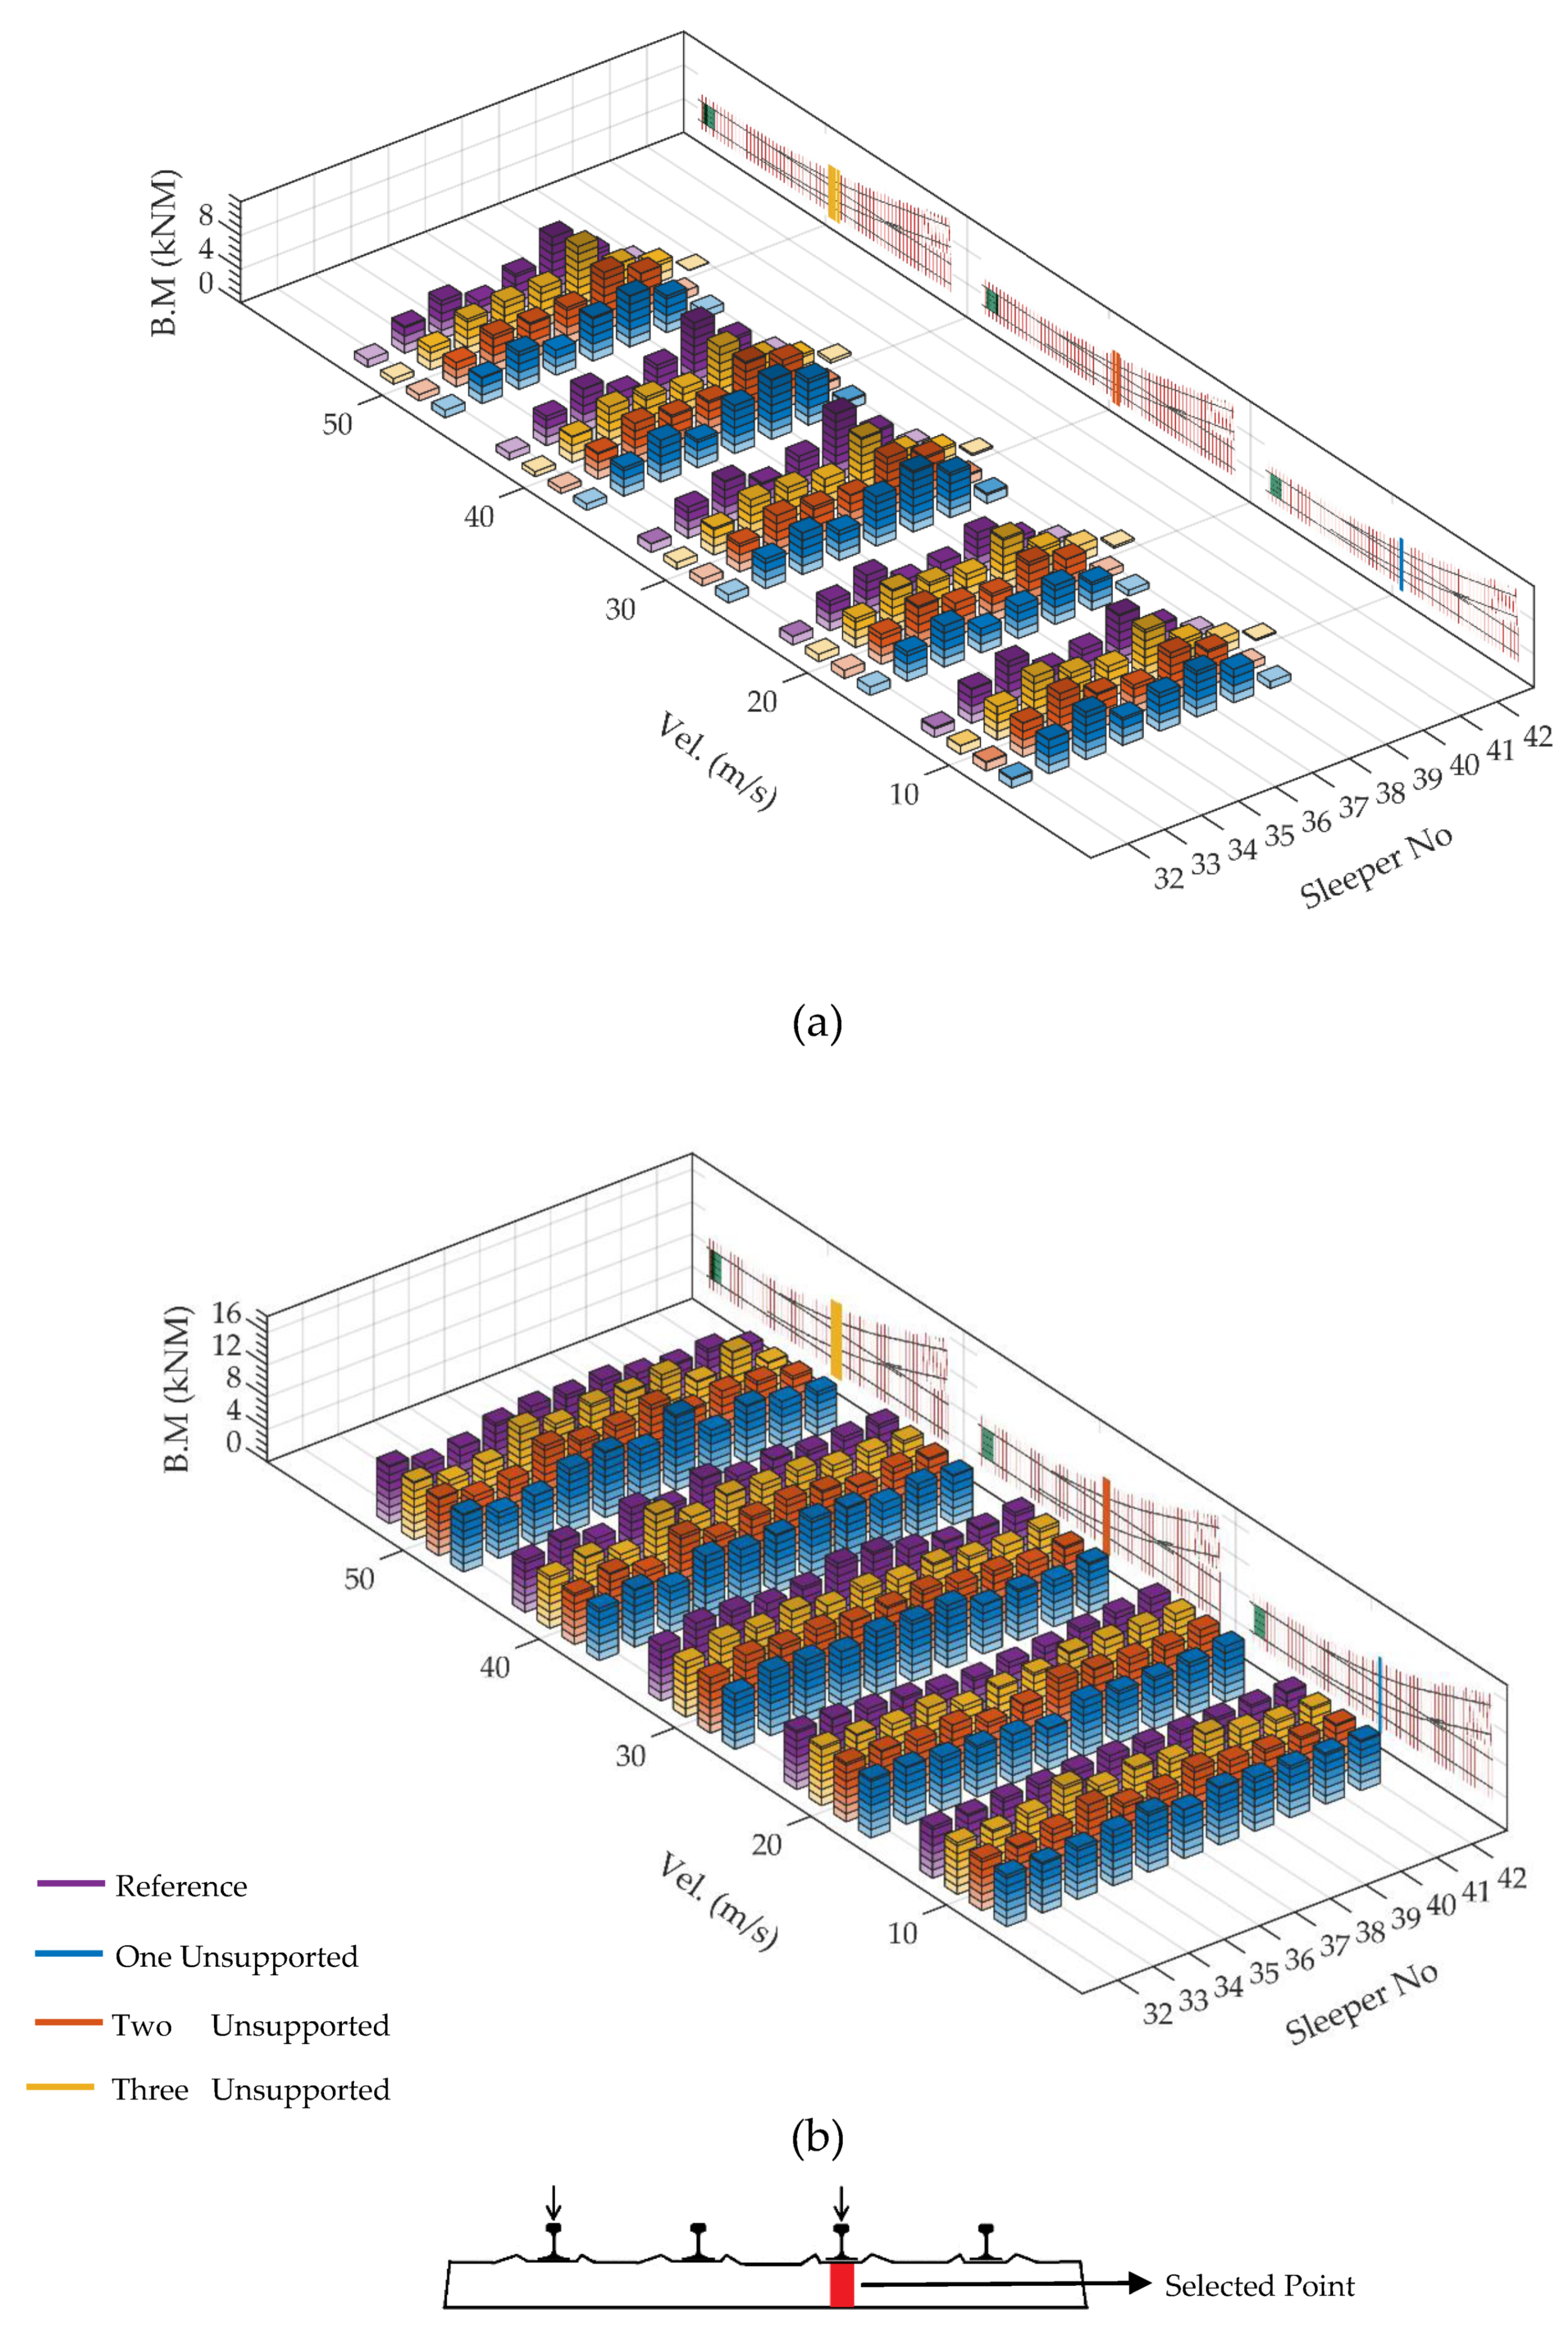
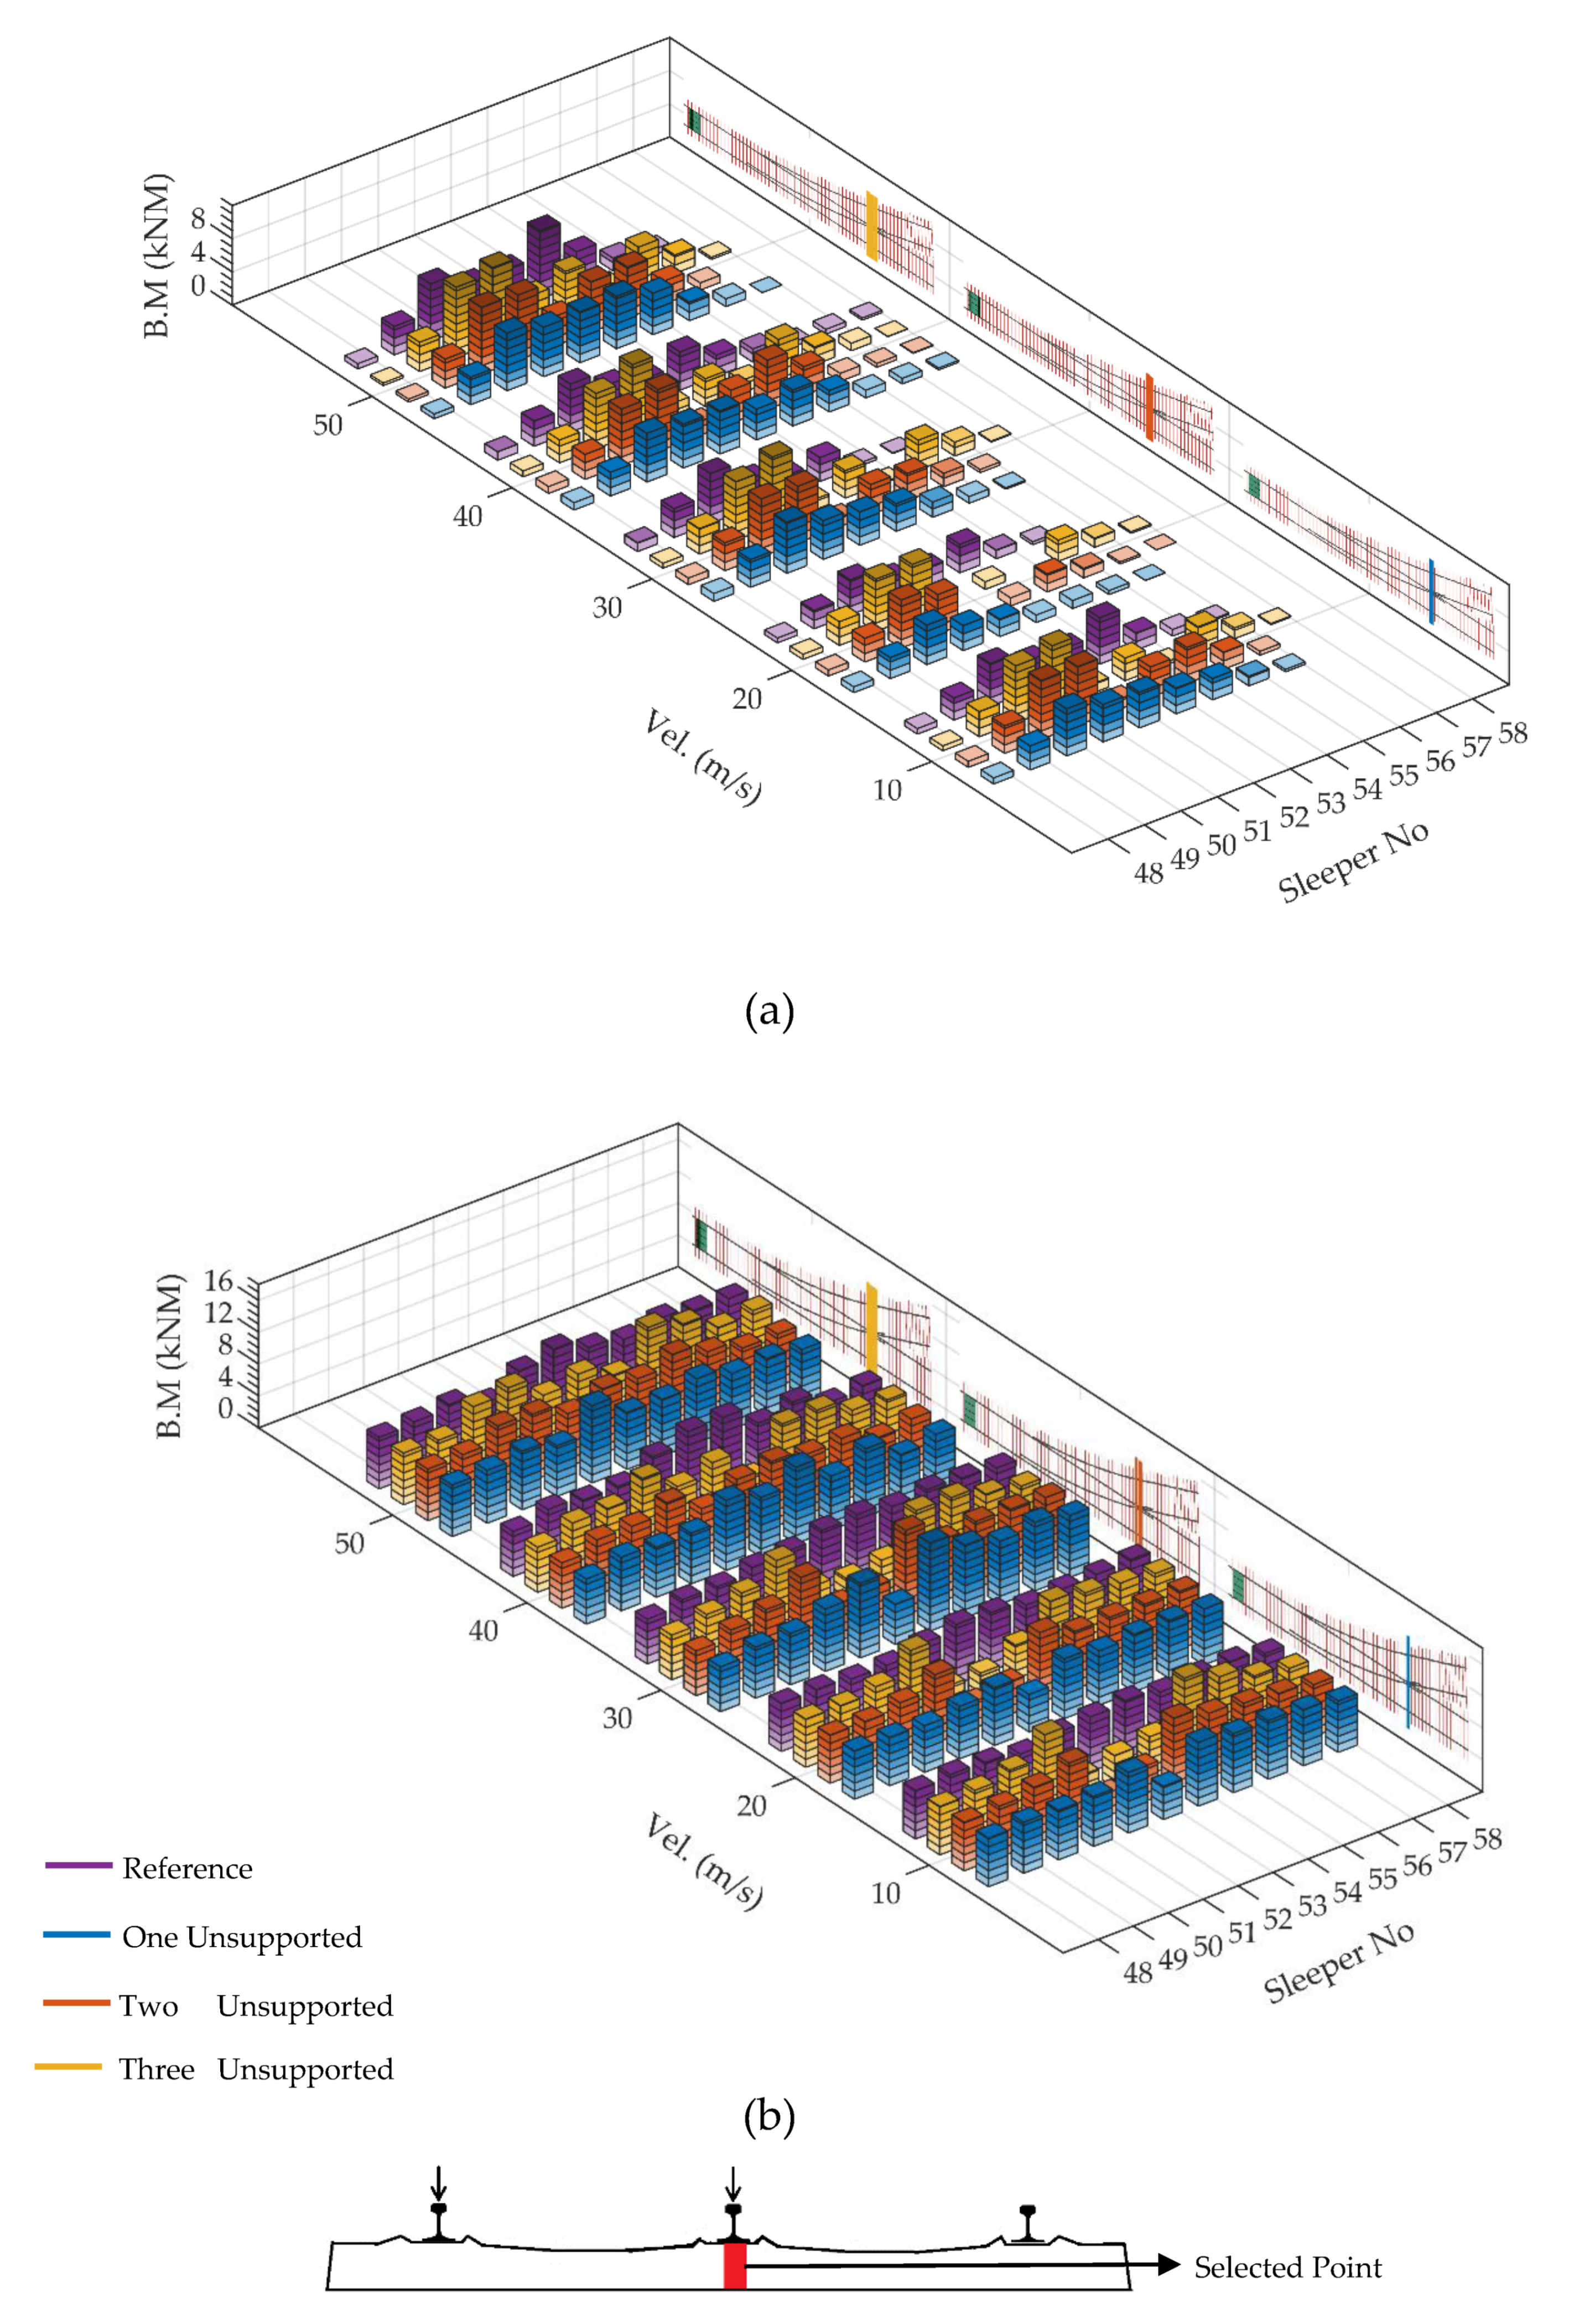
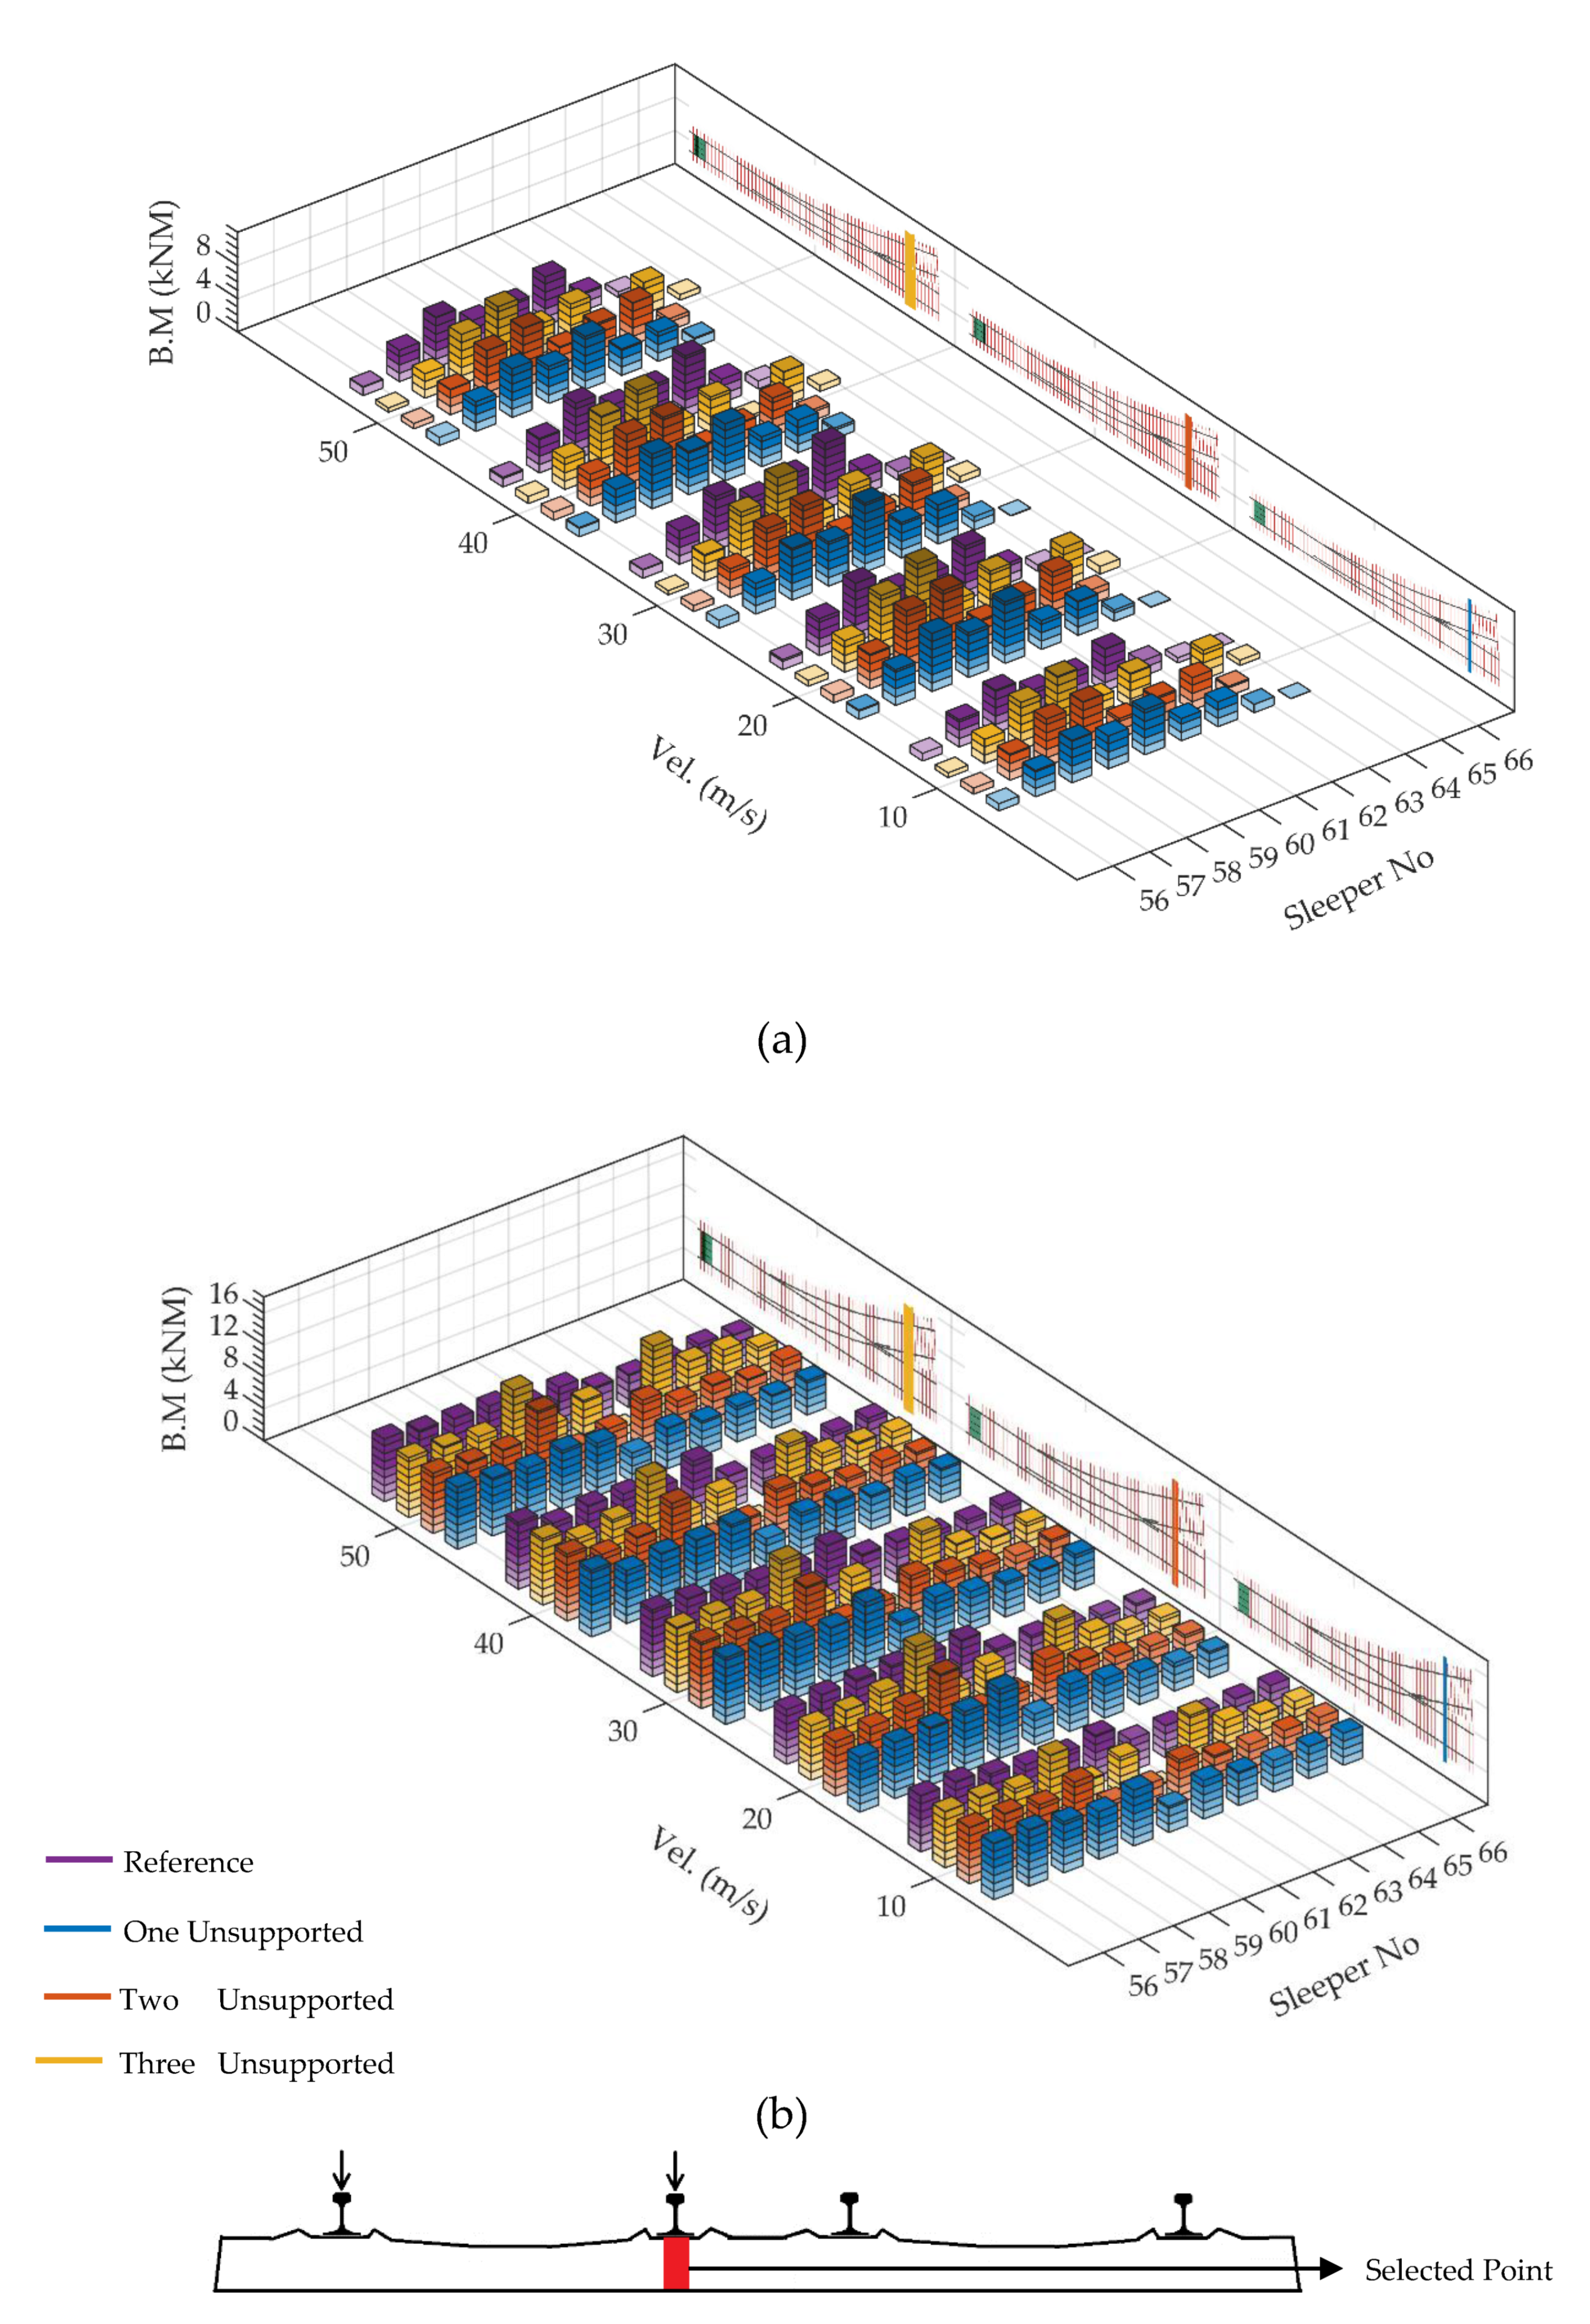
3.5. Positive Bending Moment Distributions of Selected Points
3.6. Bending Moment Distributions Along a Bearer
3.7. Comparison between FFU and Concrete Sleepers
4. Conclusions
Author Contributions
Funding
Acknowledgments
Conflicts of Interest
References
- Grassie, S.; Cox, S. The dynamic response of railway track with unsupported sleepers. Proc. Inst. Mech. Eng. Part D Transp. Eng. 1985, 199, 123–136. [Google Scholar] [CrossRef]
- Kaewunruen, S.; Remennikov, A. Investigation of free vibrations of voided concrete sleepers in railway track system. Proc. Inst. Mech. Eng. Part F J. Rail Rapid Transit 2007, 221, 495–507. [Google Scholar] [CrossRef]
- Nielsen, J.C.; Igeland, A. Vertical dynamic interaction between train and track influence of wheel and track imperfections. J. Sound Vib. 1995, 187, 825–839. [Google Scholar] [CrossRef]
- Zhu, J.; Thompson, D.; Jones, C. On the effect of unsupported sleepers on the dynamic behaviour of a railway track. Veh. Syst. Dyn. 2011, 49, 1389–1408. [Google Scholar] [CrossRef]
- Lundqvist, A.; Dahlberg, T. Load impact on railway track due to unsupported sleepers. Proc. Inst. Mech. Eng. Part F J. Rail Rapid Transit 2005, 219, 67–77. [Google Scholar] [CrossRef]
- Zhang, S.; Xiao, X.; Wen, Z.; Jin, X. Effect of unsupported sleepers on wheel/rail normal load. Soil Dyn. Earthq. Eng. 2008, 28, 662–673. [Google Scholar] [CrossRef]
- Zhu, J.J.; Ahmed, A.; Rakheja, S.; Khajepour, A. Development of a vehicle–track model assembly and numerical method for simulation of wheel–rail dynamic interaction due to unsupported sleepers. Veh. Syst. Dyn. 2010, 48, 1535–1552. [Google Scholar] [CrossRef]
- Zakeri, J.A.; Fattahi, M.; Ghanimoghadam, M.M. Influence of unsupported and partially supported sleepers on dynamic responses of train–track interaction. J. Mech. Sci. Technol. 2015, 29, 2289–2295. [Google Scholar] [CrossRef]
- Mosayebi, S.-A.; Zakeri, J.A.; Esmaeili, M. Effects of train bogie patterns on the mechanical performance of ballasted railway tracks with unsupported sleepers. Proc. Inst. Mech. Eng. Part F J. Rail Rapid Transit 2018, 232, 238–248. [Google Scholar] [CrossRef]
- Kaewunruen, S.; Remennikov, A.M.; Dindar, S. Influence of Asymmetrical Topology on Structural Behaviours of Bearers and Sleepers in Turnout Switches and Crossings. In Sustainable Civil Infrastructures, Proceedings of the International Congress and Exhibition “Sustainable Civil Infrastructures: Innovative Infrastructure Geotechnology”; Springer: Cham, Switzerland, 2017; pp. 51–60. [Google Scholar]
- Kaewunruen, S.; Ngamkhanong, C.; Janeliukstis, R.; You, R. Dynamic amplification factors for railway turnout bearers in switches and crossings. In Proceedings of the 6th ECCOMAS Thematic Conference on Computational Methods in Structural Dynamics and Earthquake Engineering (CompDyn2017), Rhodes Island, Greece, 15–17 June 2017; pp. 15–17. [Google Scholar]
- Hamarat, M.; Kaewunruen, S.; Papaelias, M.; Silvast, M. New Insights from Multibody Dynamic Analyses of a Turnout System under Impact Loads. Appl. Sci. 2019, 9, 4080. [Google Scholar] [CrossRef]
- Kaewunruen, S. In situ performance of a complex urban turnout grillage system using fibre-reinforced foamed urethane (FFU) bearers. In Proceedings of the 10th World Congress on Rail Research, Sydney, Australia, 24–27 November 2013; pp. 25–28. [Google Scholar]
- Kaewunruen, S. Acoustic and dynamic characteristics of a complex urban turnout using fibre-reinforced foamed urethane (FFU) bearers. In Noise and Vibration Mitigation for Rail Transportation Systems; Springer: Berlin/Heidelberg, Germany, 2015; pp. 377–384. [Google Scholar]
- Kaewunruen, S. Monitoring in-service performance of fibre-reinforced foamed urethane sleepers/bearers in railway urban turnout systems. Struct. Monit. Maint. 2014, 1, 131. [Google Scholar] [CrossRef]
- Kaewunruen, S.; Remennikov, A. Dynamic Properties of Railway Track and Its Components: A State-Of-The-Art Review; Nova Science Publishers: New York, NY, USA, 2008. [Google Scholar]
- RRSB. Signing of Permissble Speeds and Speed Restrictions; Safety & Standards Directorate Railtrack PLC: London, UK, 2000. [Google Scholar]
- Esveld, C. Modern Railway Track, 2nd ed.; Delft University of Technology: Zaltbommel, The Netherlands, 2001. [Google Scholar]
- Hallquist, J.O. LS-DYNA keyword user’s manual. Livermore Softw. Technol. Corp. 2007, 970, 299–800. [Google Scholar]
- Kaewunruen, S.; Xie, L.; Goto, K. Damping characteristics of composite sleepers and bearers in railway switches and crossings. In Proceedings of the 26th International Congress on Sound and Vibration, Montreal, QC, Canada, 7 July 2019. [Google Scholar]
- Sengsri, P.; Oliveira De Melo, A.; Kaewunruen, S. Experimental and numerical investigation of vibration characteristics of fibre-reinforced foamed urethane composite beam. In Proceedings of the 4th World Multidisciplinary Civil Engineering-Architecture-Urban Planning Symposium, Prague, Czech Republic, 17–21 June 2019. [Google Scholar]
- De Man, A. Pin-pin resonance as a reference in determining ballasted railway track vibration behaviour. Heron Engl. Ed. 2000, 45, 35–52. [Google Scholar]
- Goto, K.; Minoura, S.; Watanabe, T.; Ngamkhanong, C.; Kaewunruen, S. Impact Load Response of PC Rail Joint Sleeper under a Passing Train. J. Phys. Conf. Ser. 2018, 1106, 012008. [Google Scholar] [CrossRef]
- Setsobhonkul, S.; Kaewunruen, S.; Sussman, J.M. Lifecycle Assessments of Railway Bridge Transitions Exposed to Extreme Climate Events. Front. Built Environ. 2017, 3, 35. [Google Scholar] [CrossRef]
- Kaewunruen, S.; Remennikov, A.M. Current state of practice in railway track vibration isolation: An Australian overview. Aust. J. Civ. Eng. 2016, 14, 63–71. [Google Scholar] [CrossRef]
- Kaewunruen, S.; Remennikov, A.M. Experiments into impact behaviour of railway prestressed concrete sleepers. Eng. Fail. Anal. 2011, 18, 2305–2315. [Google Scholar] [CrossRef]
- Kaewunruen, S.; Remennikov, A.M.; Murray, M.H. Introducing a new limit states design concept to railway concrete sleepers: an Australian experience. Front. Mater. 2014, 1, 8. [Google Scholar] [CrossRef]
- Kaewunruen, S.; Ishida, T.; Remennikov, A.M. Dynamic performance of concrete turnout bearers and sleepers in railway switches and crossings. Adv. Civ. Eng. Mater. 2018, 7. [Google Scholar] [CrossRef]
- Kaewunruen, S.; Aikawa, A.; Remennikov, A.M. The importance of ‘dynamics’ in the design and performance-based testing criteria for railway track components. Procedia Struct. Integr. 2019, 21, 83–90. [Google Scholar] [CrossRef]
- Kaewunruen, S.; You, R.; Ishida, M. Composites for Timber-Replacement Bearers in Railway Switches and Crossings. Infrastructures 2017, 2, 13. [Google Scholar] [CrossRef]
- Silva, E.A.; Pokropski, D.; You, R.; Kaewunruen, S. Comparison of structural design methods for railway composites and plastic sleepers and bearers. Aust. J. Struct. Eng. 2017, 18, 160–177. [Google Scholar] [CrossRef]
- Kaewunruen, S.; Sussman, J.M.; Matsumoto, A. Grand challenges in transportation and transit systems. Front. Built Environ. 2016, 2, 4. [Google Scholar] [CrossRef]


| Element | Type | Number of Elements | Properties | Value |
|---|---|---|---|---|
| Rail | Beam | 1980 | 1 E2 PR3 | 7800 210 0.3 |
| Bearer | Beam | 3070 | 1 E2 PR3 | 740 8.1 0.25 |
| Rail Pad | Spring | 245 | k4 | 1300 |
| Ballast | Spring/Damper | 5900 | k4 c5 | 45 32 |
| Primary Suspension | Spring/Damper | 8 | k4 c5 | 1.15 2.5 |
| Mode No | FFU Bearer | FFU Bearer | |
|---|---|---|---|
| Experimental [20] | Numerical | Numerical | |
| 1 | 68 | 69 | 25 |
| 2 | 143 | 137 | 87 |
| 3 | 247 | 214 | 150 |
| 4 | N/A | 446 | 208 |
| 5 | N/A | 832 | 296 |
| 6 | N/A | 1030 | 445 |
| 7 | N/A | 1322 | 641 |
| 8 | N/A | 1850 | 870 |
© 2020 by the authors. Licensee MDPI, Basel, Switzerland. This article is an open access article distributed under the terms and conditions of the Creative Commons Attribution (CC BY) license (http://creativecommons.org/licenses/by/4.0/).
Share and Cite
Hamarat, M.; Papaelias, M.; Silvast, M.; Kaewunruen, S. The Effect of Unsupported Sleepers/Bearers on Dynamic Phenomena of a Railway Turnout System under Impact Loads. Appl. Sci. 2020, 10, 2320. https://doi.org/10.3390/app10072320
Hamarat M, Papaelias M, Silvast M, Kaewunruen S. The Effect of Unsupported Sleepers/Bearers on Dynamic Phenomena of a Railway Turnout System under Impact Loads. Applied Sciences. 2020; 10(7):2320. https://doi.org/10.3390/app10072320
Chicago/Turabian StyleHamarat, Mehmet, Mayorkinos Papaelias, Mika Silvast, and Sakdirat Kaewunruen. 2020. "The Effect of Unsupported Sleepers/Bearers on Dynamic Phenomena of a Railway Turnout System under Impact Loads" Applied Sciences 10, no. 7: 2320. https://doi.org/10.3390/app10072320
APA StyleHamarat, M., Papaelias, M., Silvast, M., & Kaewunruen, S. (2020). The Effect of Unsupported Sleepers/Bearers on Dynamic Phenomena of a Railway Turnout System under Impact Loads. Applied Sciences, 10(7), 2320. https://doi.org/10.3390/app10072320